
Abstract
In this study, a long-term assessment of the wave energy in the China Sea was performed for a 30-year time interval (1988–2017), using the model WAVEWATCH-III. The reliability of the wave simulation results was increased by means of longer time horizon data compared to other relevant studies in the China Sea. This analysis provided information on the regional distribution as well as on the monthly and seasonal variability. The exploitation and stability of wave energy were taken into consideration, so as to find the advantage of resource exploitation. Results indicated that values of significant wave height and wave power density had obviously differences compared with different months, especially in December with a maximum significant wave height of 2.7 m and 35 kW/m of wave power density. The minimum value of them appeared in May, was 1.0 m and 4.5 kW/m, respectively. The distribution of wave energy was abundant in winter and the poorest in summer. In winter, the significant wave height in most areas was above 1.8 m, while the maximum wave energy density in summer was only 1.2 m. As for the wave power density, in winter values in most areas were above 18 kW/m, while the maximum value in summer was only 12 kW/m. In sight of regional distribution, the highest wave energy potential was located in the Northern South China Sea, the East China Sea, the Ryukyu Islands waters, east of the Taiwan Island and the Luzon Strait, with coefficient of variation was within 2.0 and occurrence of exploitation was above 80%, whereas the Bohai Sea, the northern part of the Yellow sea, the Gulf of Thailand, and the Northern Bay were in poor contribution, with occurrence of exploitation was within 50%.
Introduction
China has a vast coastline of 18,000 km, including the Bohai Sea, the Yellow sea, the East China Sea and the South China Sea with many islands and abundant marine resources, including tidal energy, wind energy, wave energy, and so on. Among the seas of China, the average water depth in the South China Sea is 1212 m, with the maximum water depth reaching 5559 m, and it is the heart of the Indian–Pacific economic circle and is a crossroad of the sea silk road (Wan et al., 2018). Against a backdrop of dramatic energy consumption increase, serious ecological degradation and environmental pollution (heavy smog in particular) (Li et al., 2015), there is no doubt that the exploitation of wave energy technology has become the focus of energy development and utilization due to its advantages of no pollution, wide distribution, renewable, and large storage (Falnes, 2007; Beyene, 2007; Cornejo-Bueno et al., 2016) compared with the limited fossil energy. Meanwhile to realize the sustainable development strategy of China, speed up the construction of resource-saving and environment-friendly society, reduce the CO2 emission and help the European Union (EU) becomes a competitive low carbon economy by 2050 (Higgins et al., 2014), it is sensible to make full use of wave energy resources. However, the instability and regional differences of wave energy increase difficulties in exploitation and utilization, thus few of the wave energy is being utilized efficiently. Therefore, it is necessary to intensify scientific research on long-term distribution characteristics of wave energy and seasonal changes and provide reliable scientific guidance for the utilization of wave energy.
Evaluations of the wave energy have been done all over the world and found that fully discrete third-generation spectral models like WAVEWATCH III (WW3; Tolman, 1991) and Simulated Waves Nearshore (SWAN; Booij et al.,1999) were widely used in the wave energy evaluation for the higher accuracy (Bromirski et al.,2013; Rusu and Soares,2009; Wan et al., 2017). The essence of them is that no restrictions are imposed on the spectral shape, which is fully determined by the source terms. WW3 is more suits for wave energy simulation in large and mesoscale sea areas (Bernier et al., 2016; Charles et al., 2012; Li et al., 2016; Wang et al., 2017). On the contrary, SWAN is widely used in many coastal wave studies since some nearshore wave evolution processes have been incorporated into the model with parameterized terms, such as depth induced wave breaking and triad wave interactions (Akpinar and Kömürcü,2012; Akpinar et al., 2012; Cherneva et al.,2008; Iglesias and Carballo,2010; Liang et al., 2016). Based on this, Rusu et al. (2018) found locations situated in the western side of the Black Sea basin were of great importance using the SWAN model. Besio et al. (2016) found the stronger contributions were given by the winter values according to the analysis on seasonal distribution of wave energy in the Mediterranean Sea using the WW3. Wang et al. (2018) simulated the wave energy in the South China Sea and discovered the wave potential was smallest in the spring and reached increasingly larger values during summer, autumn, and winter, in turn. Besides, wave energy assessment in large-scale areas and long-term temporal is essential to understand the spatial and temporal distributions of wave energy and can provide macroscopic references for decision makers to evaluate wave energy projects. Wang et al. (2016) analyzed wave energy resources from 1985 to 2010 in the Bohai, using SWAN driven by the wind data obtained by the Regional Atmospheric Modeling System. They achieved spatial distributions of significant wave height (SWH) and wave power density (WPD) and found that waves having the SWH between 0–1.1 m with 0–3.5 kW/m WPD occurred in most part of the Bohai Sea, which was similar with our research. Zheng et al. (2013) simulated the wave field in the China Sea over the period from 1988 to 2009. However, they paid more attention to the storage of wave energy and the temporal variability index instead of the monthly and seasonal distribution of wave energy, which are also important for the assessment of wave energy. Zheng and Li (2015) found an obvious increasing trend in the Ryukyu Islands, the Luzon Strait and the north area of the South China Sea and a noticeable seasonal difference in the variation, in terms of the SWH and WPD. However, the seasonal distribution of the SWH and WPD need further analysis.
Considering the reliable performance and wide applications in the oceanic basin scale, the WW3 is adopted to simulate the wave energy in the China Sea. In this paper, we achieved reliable results by using 30-year simulate data driven by Cross Calibrated Multi-Platform (CCMP) wind field, assessed the long-term average monthly and seasonal distribution of the SWH and WPD and also took the exploitation and stability of the WPD into consideration. There are four sections in this paper. The data materials, the wave model theory, the model configuration, and data verification are introduced in Methodology and validation section. The results, followed by detailed discussions, are given in Results and discussion section, and Conclusions section concludes this paper.
Methodology and validation
Wind field data
CCMP wind field with higher spatial resolution and long time series is usually used as the driving field of WW3 model. The data of CCMP wind field come from ESE (NASA Earth Science Enterprise), integrating the data of ADEOS-II (Advanced Earth Observing Satellite, 2nd Generation), AMSRE (Advanced Microwave Scanning Radiometer-Earth Observing System), QuikSCAT, SSM/I (Special Sensor Microwave Imager), TRMMTMI (Tropical Rainfall Measuring Mission Microwave Imager) and using the method of variation. The database of CCMP has time step of 6 h and spatial resolution of
Bathymetric topographic data
ETOPO5 (5-Minute Gridded Global Relief Data Collection) was generated from a digital data base of land and seafloor elevations on a 5-min latitude/longitude grid. All kinds of data were collected by NOAA (National Oceanic and Atmospheric Administration) and released by the NGDC (U.S. National Geophysical Data Center). Data contain some gridded global topographic data, bathymetric data of different scales, and digitized land and shore boundaries, etc., which can provide relatively comprehensive ocean topographic data for simulating wave energy in the China Sea. ETOPO5 is the most popular bathymetric boundary data in current ocean models, which brings great convenience for ocean numerical simulation. The bathymetric topography of the study area in this paper is shown in Figure 1.
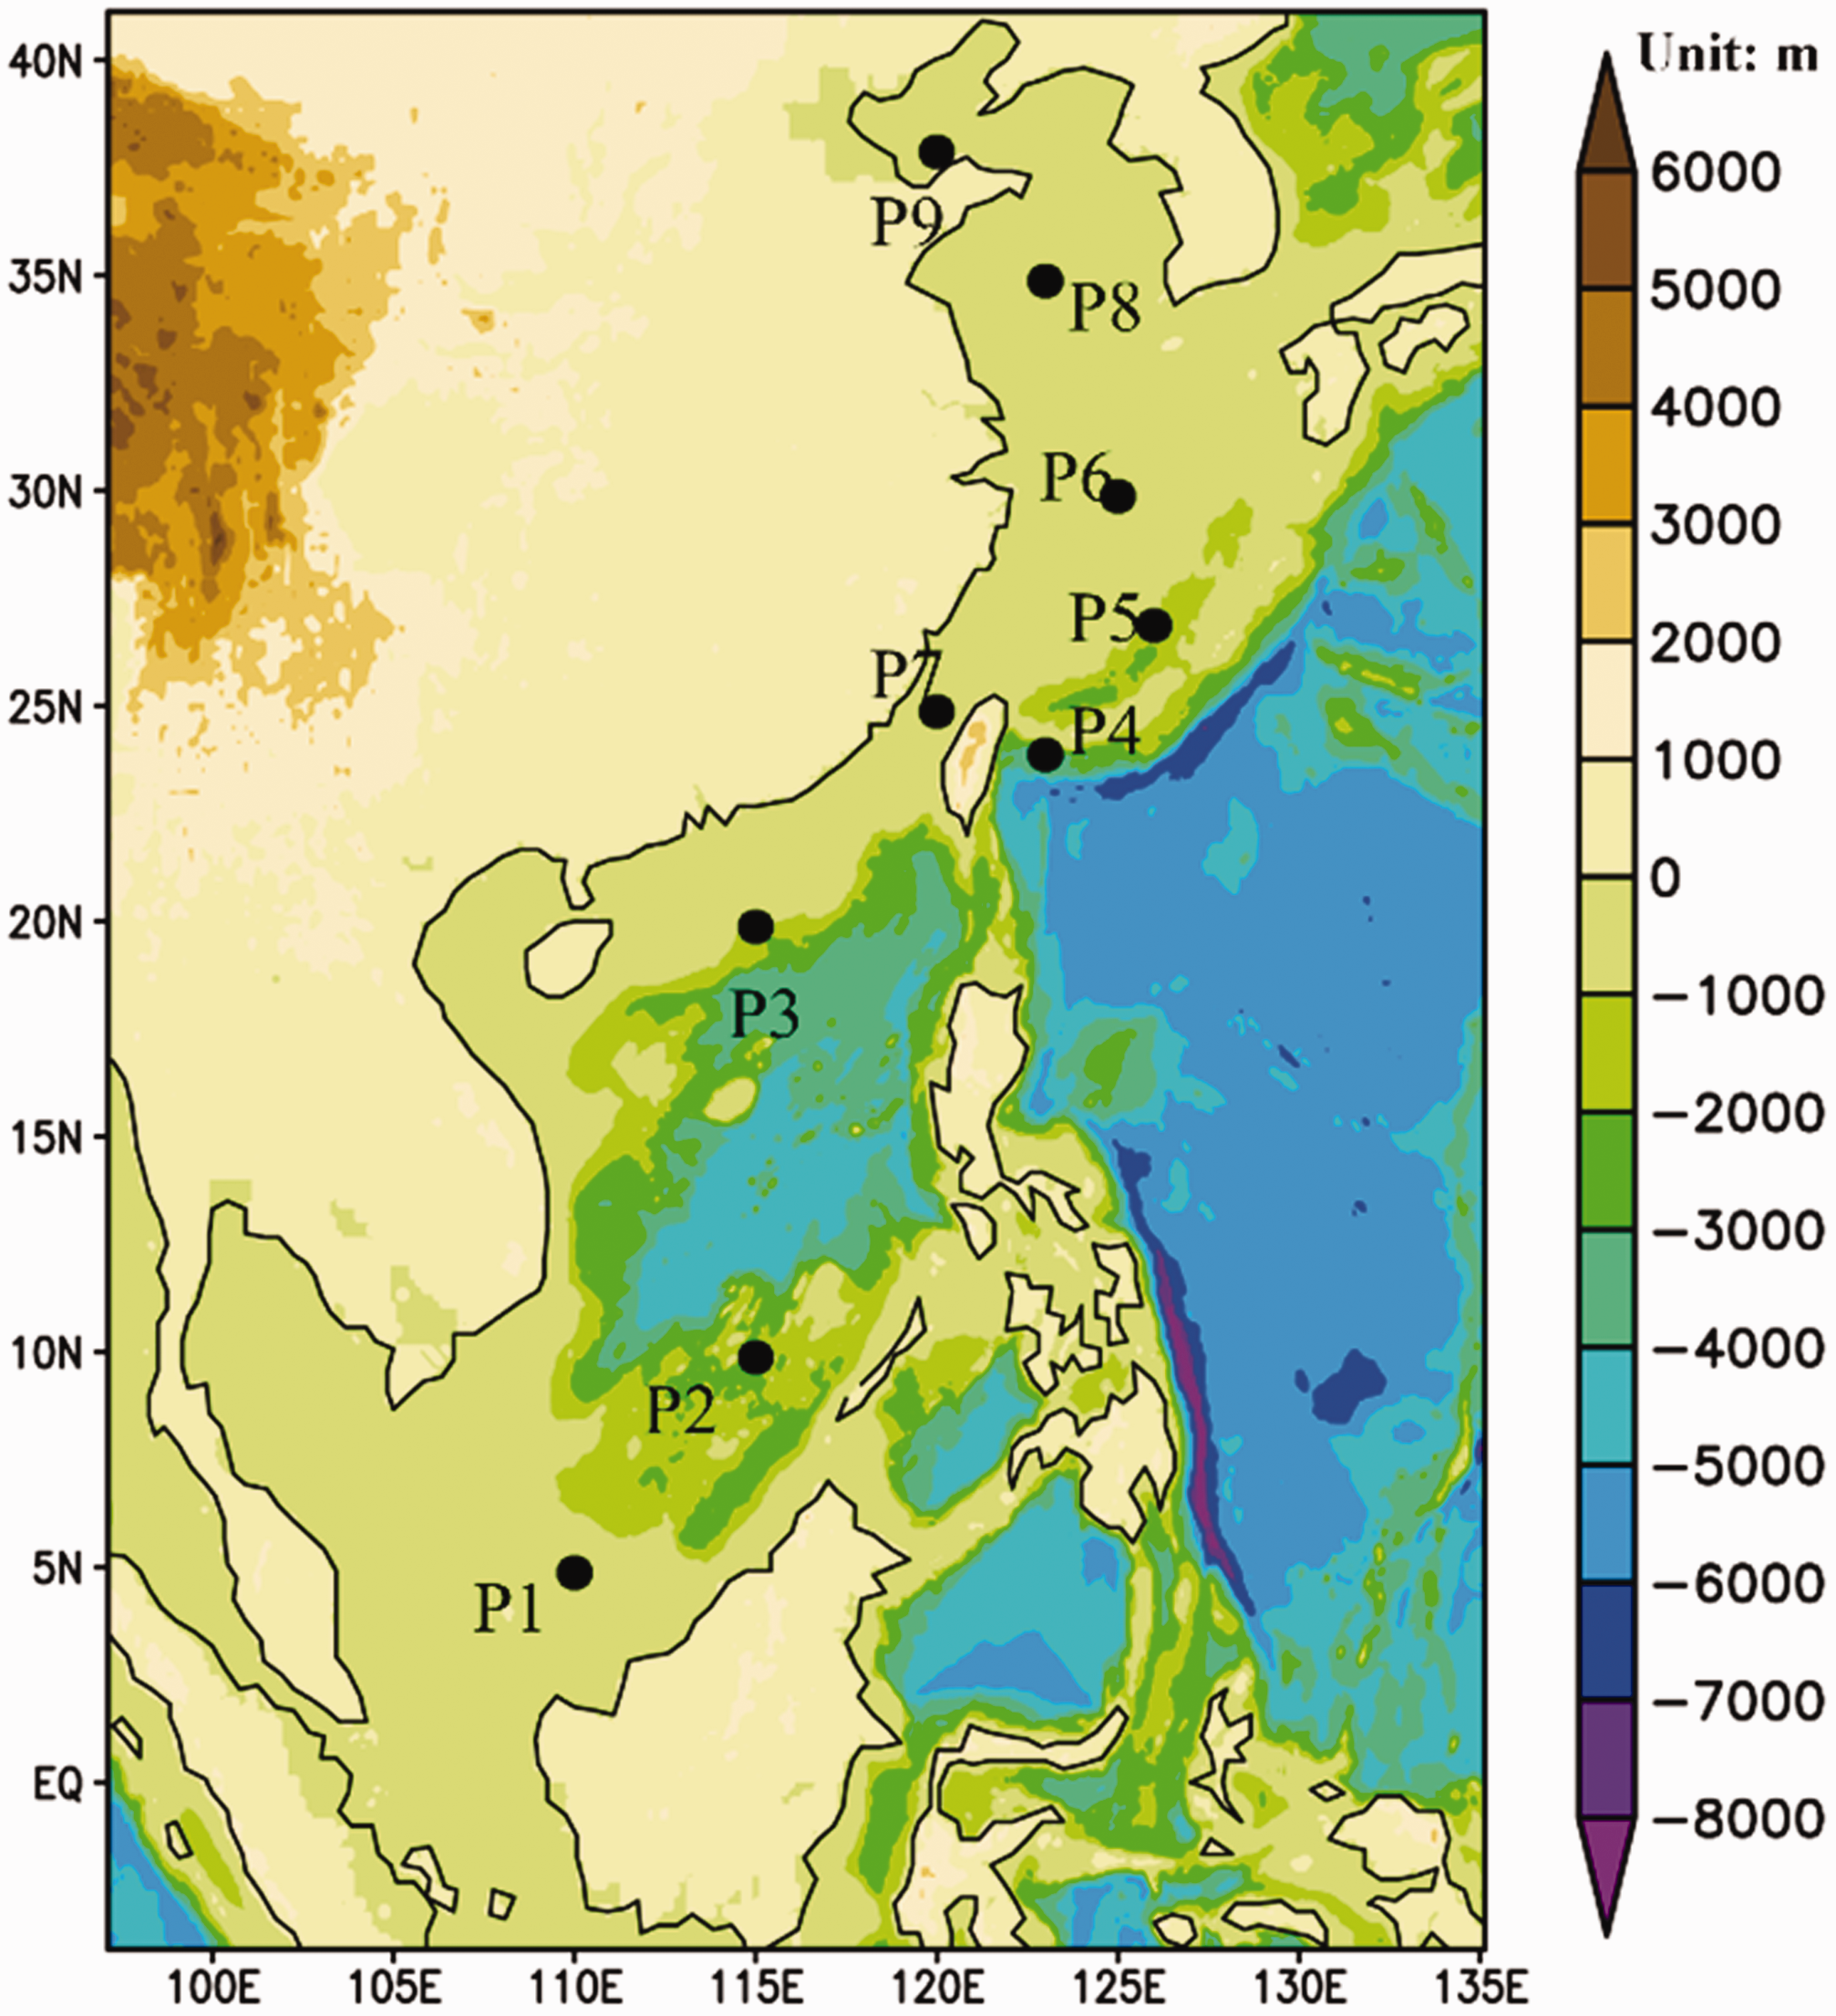
The bathymetric topographic map of the China Sea.
Model theory and configuration
Model theory description
WW3 is the third generation of full-spectrum space wave model, initially developed by a marine simulation team in NOAA/NCEP Environmental Simulation Center. The model contains the general governing transport equations that permit full coupling with ocean models, modified third-order propagation schemes, physics for wave growth and decay, and a physics integration scheme. The model can better solve the spectral action density balance equation and the nonlinear energy interaction in terms of waves with different frequencies can be directly computed for the purpose of avoiding the shape limitation in the predictive spectra, and has achieved regional and global wave forecasts.
Regarding the wave propagation, Eulerian form of the balance equation (1) is needed. It can be defined as
Besides, this balance equation can either be written in the form of a transport equation (with velocities outside the derivatives), or in a conservation form (with velocities inside the derivatives). The former form is only valid for the vector wavenumber spectrum


The net source term

Specially, the input source term can be written as


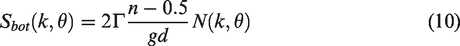
Using the notation of Tolman (1991), the bottom friction source term can be written as
Model configuration
In the model setting, the model execution is set in 24 directions as well as 25 frequencies that are spaced logarithmically from 0.04118 Hz, using a frequency increment factor of 1.1 Hz. Herein, it is supposed that no currents are considered. The simulations are computed using a maximum global time step of 900 s, a maximum Courant–Friedrichs–Lewy condition time step for x–y of 900 s, a k-theta time step of 900 s, and a minimum source term time step of 300 s. The range selected for model calculation is
The WW3 output wave parameters in the dataset include SWH (
Data validation method
The accuracy of wave energy assessment is directly related to the accuracy of the wave parameters. With the development of ocean remote sensing technology, the SWH retrieved by satellite data has been close to the buoy observations (Qi et al.,2013; Zhou et al.,2007; Zhou and Yang, 2008). Jason-2 is the follow-up satellite of TOPEX/Poseidon (T/P) and Jason-1. It is a long-term observation satellite which can measure marine elements such as the global sea level, sea surface wind speed, and SWH. Therefore, we compared the SWH retrieved by Jason-2 satellite data with the simulated SWH. The data cover global geographical range, the spatial resolution is 1°×1° (regular grid), and the data are presented as daily average data in NetCDF format. Specially, in order to enhance the persuasive power of the conclusion, we randomly selected nine points P1 to P9 for the validation. The locations of study areas can be seen from Figure 1. We used the point average method to process the simulated values due to the difference resolution (e.g., the value of point P1(5°N, 110°E) is obtained by the average from the points: (4.875°N, 109.875°E), (4.875°N, 110.125°E), (5.125°N, 109.875°E), and (5.125°N, 110.125°E)). The comparisons between the simulated data and the altimeter data at P2 and the whole domain in 2017 are shown in Figures 2 and 4 and residuals of P2 are presented in Figure 3.
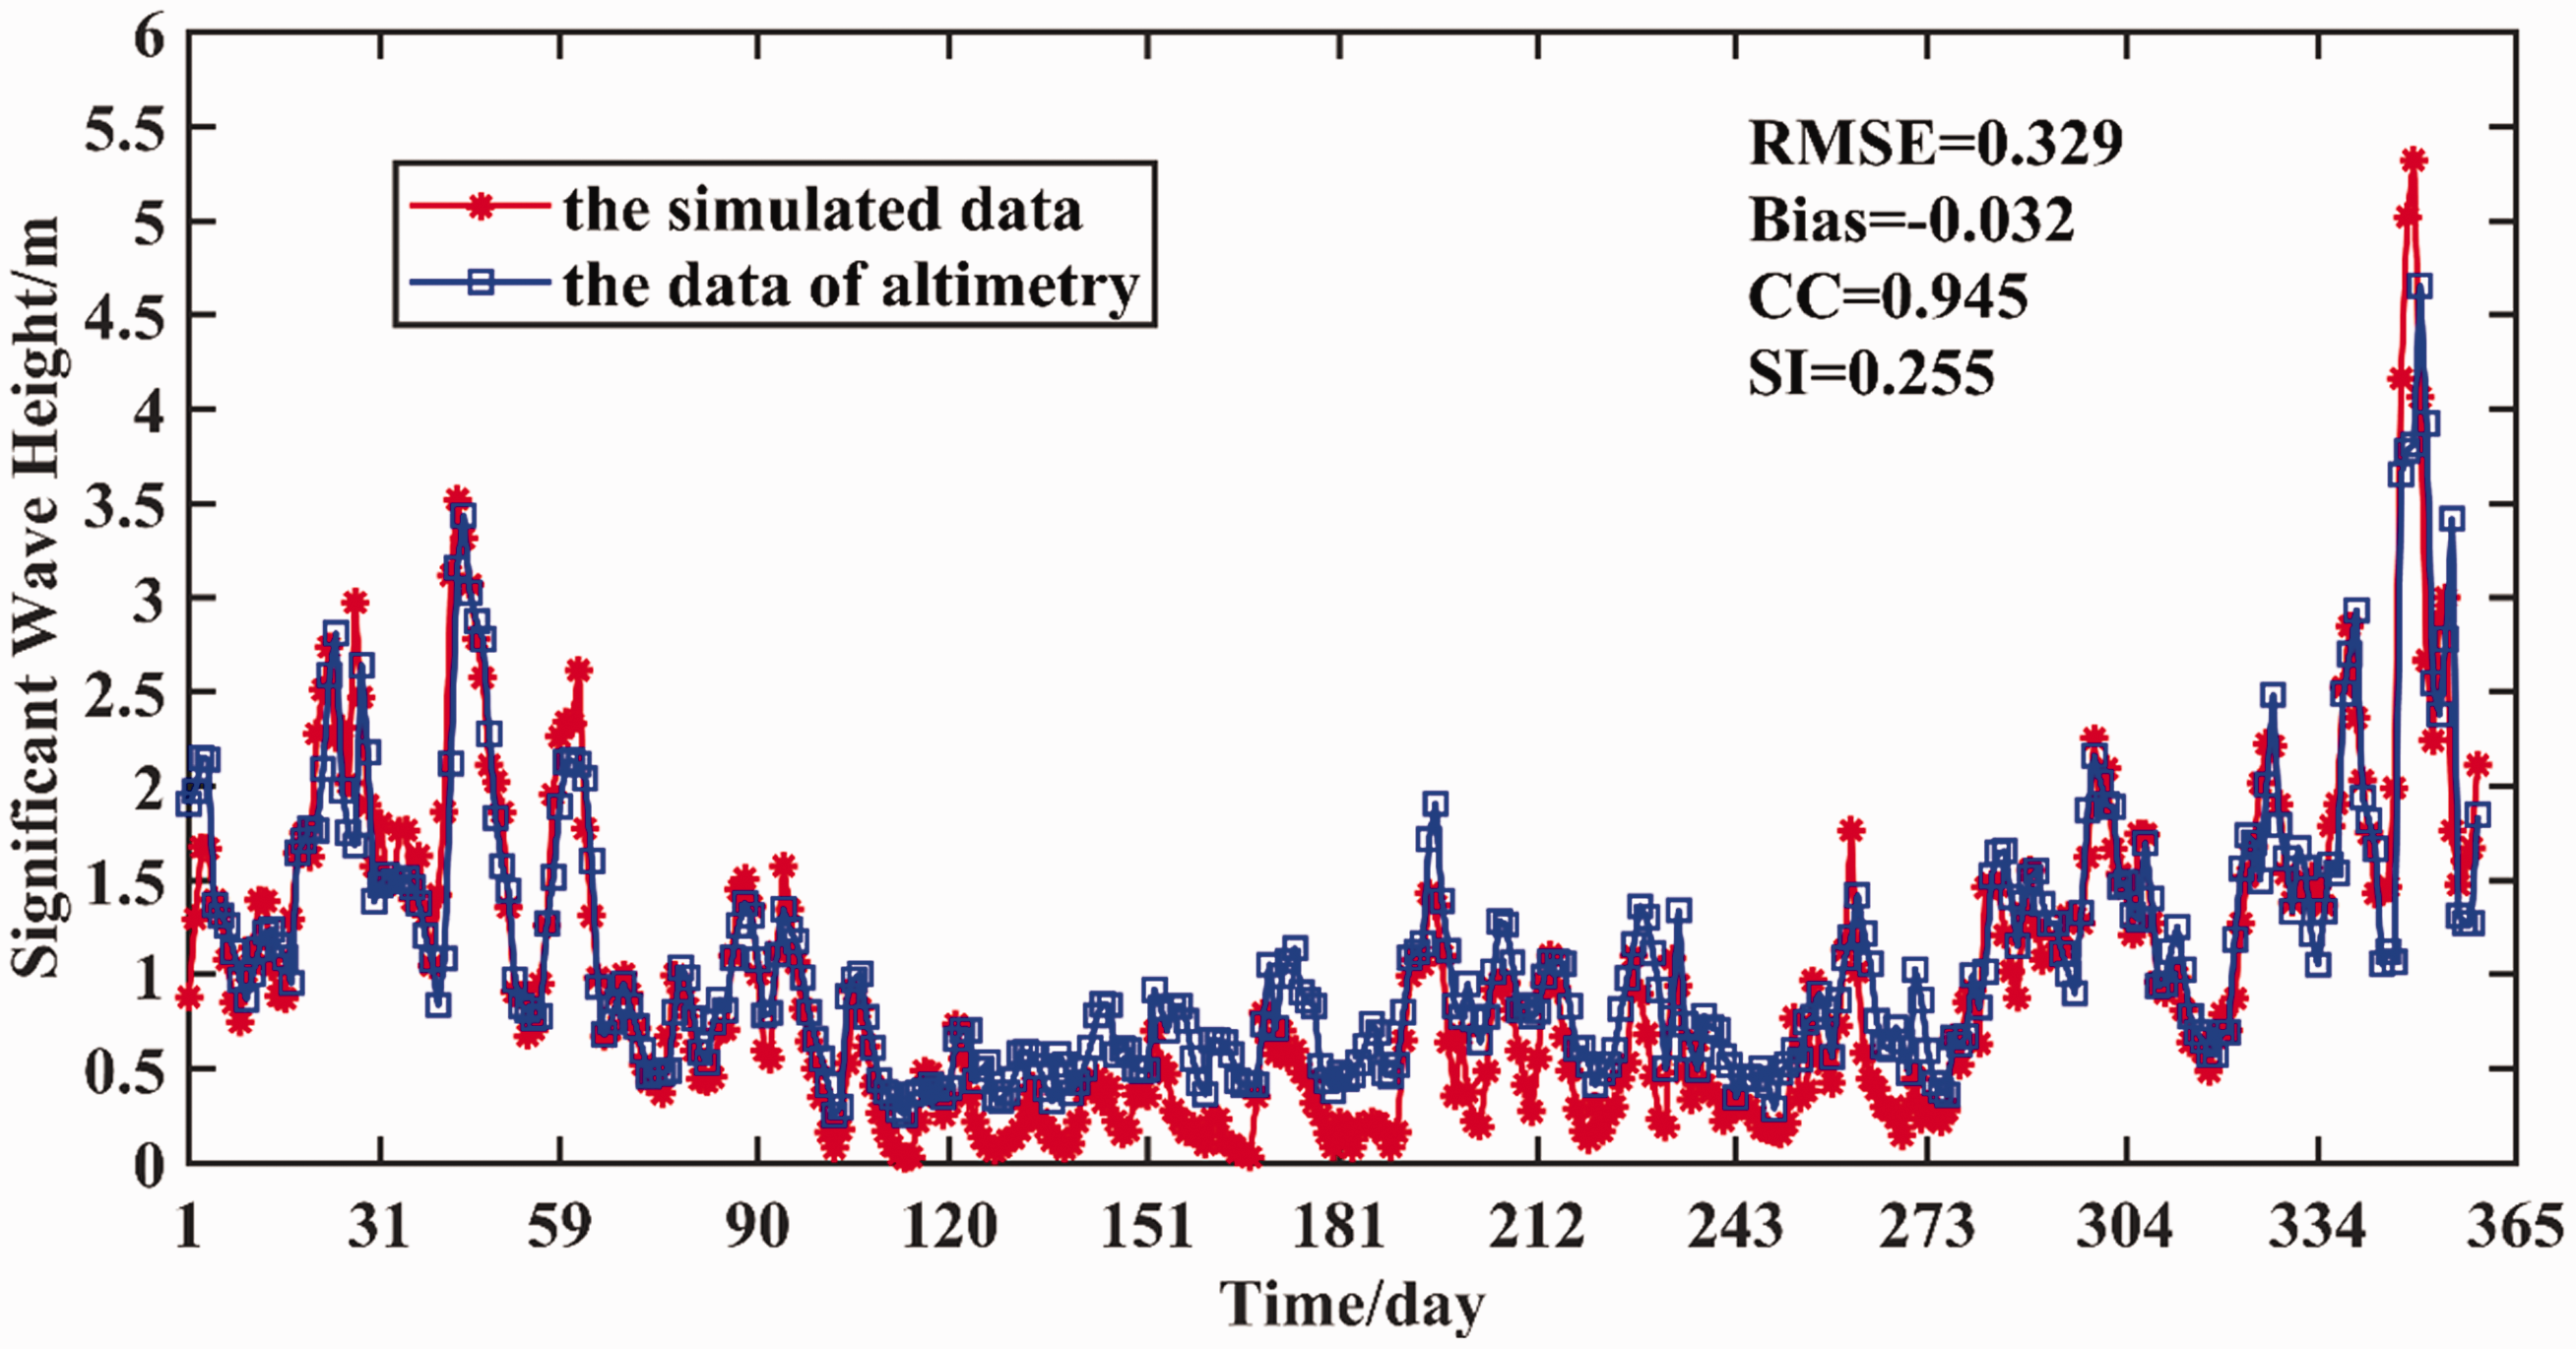
Simulated and observed SWH at the selected location of P2 from 1 January 2017 to 31 December 2017.
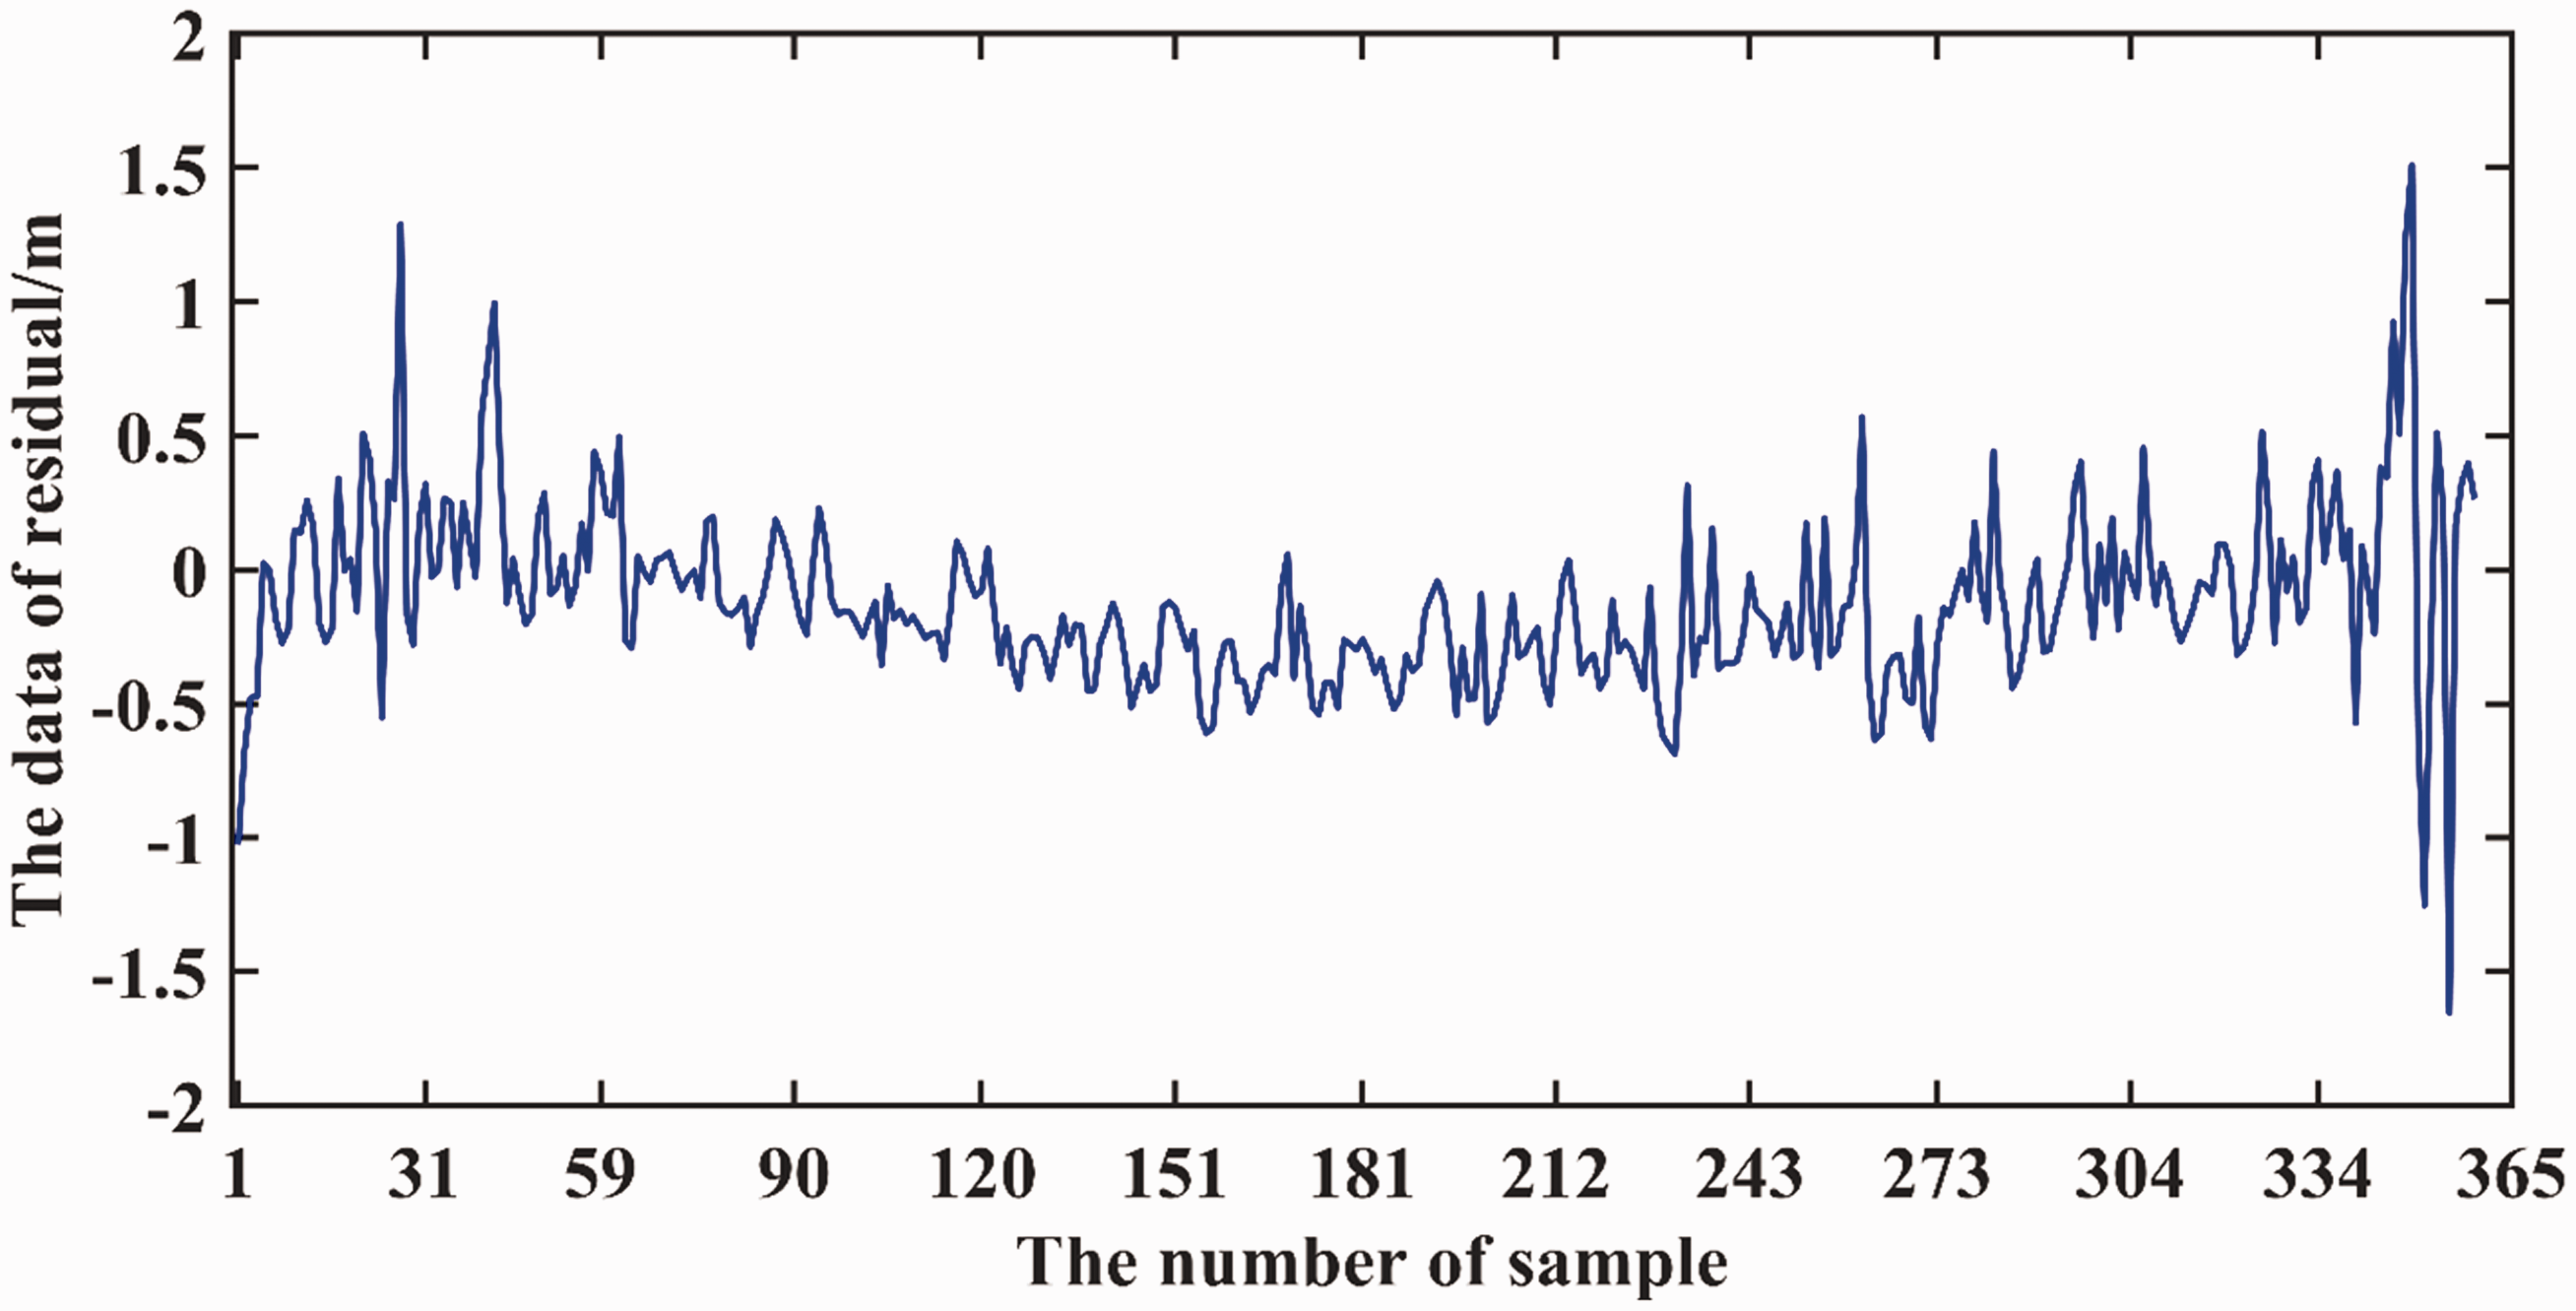
Residuals plots between simulated and observed SWH at location of P2 from 1 January 2017 to 31 December 2017.
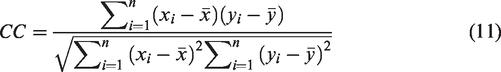
In order to analyze the precision of the simulated SWH quantitatively, the correlation coefficient (CC), the bias, the root mean square error (RMSE), and the scatter index (SI) are calculated as follows.

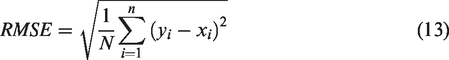
Herein,
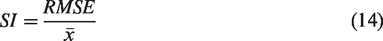
Statistical errors of the simulated significant wave height (SWH) in points P1 to P9 and the whole domain.
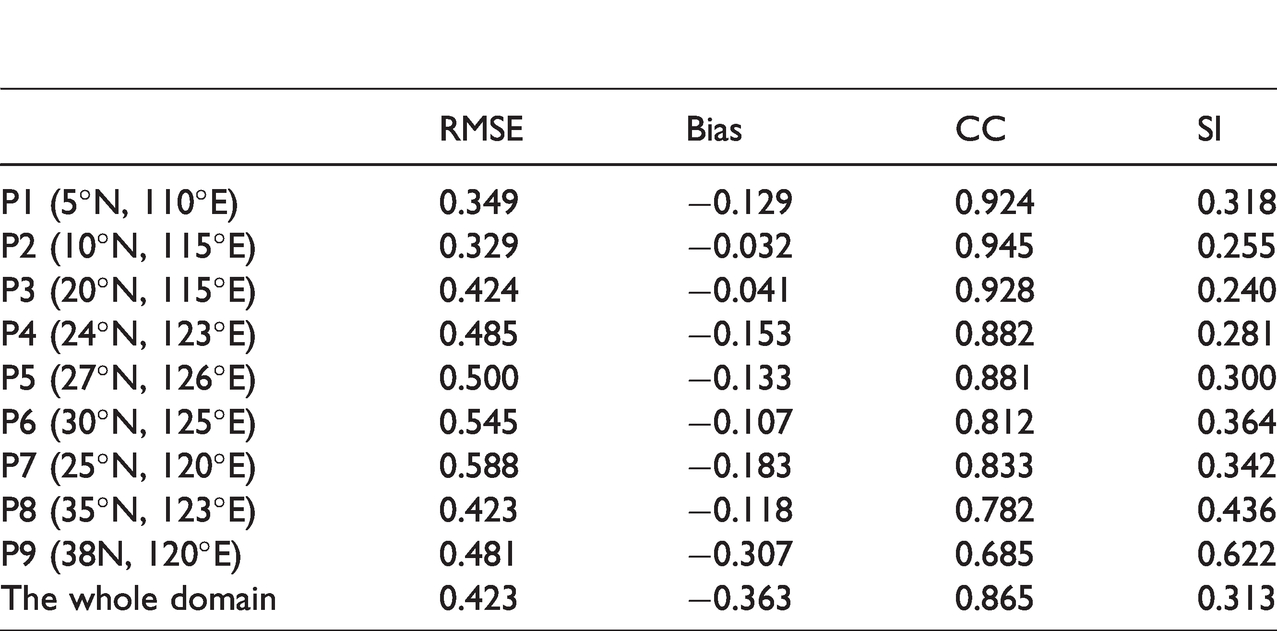
From Figures 2 and 3, we can clearly see that there is a close relationship between the simulated and observed SWH in P2. The difference between the simulated values and the observed values fluctuate steadily within a certain range. Figure 4 shows the scatter plot of observed and simulated SWH in the whole domain. The scatter diagram for them shows clustering of points approximately around the line with a slope of 1.0. The RMSE and CC are 0.423 and 0.865, respectively. We can also see that the statistical errors of the nine points are consistent with that of the whole domain from Table 1, the bias is negative in nine points and the whole domain, which proves that the simulated SWH is slightly smaller than Jason-2 observed SWH. Judging from CC, there is a close relationship between simulated and observed data, especially in P1, P2, and P3 with a value of above 0.9. From the statistical analysis, we can find that errors of simulated SWH are within the acceptable range. Previous studies also showed a good ability of WW3 on wave field simulation in the China Sea (Zheng et al., 2012). As a result, we can find that the simulated data are also reliable.
Scatter plot of Janson-2 observed and simulated SWH in the whole domain.
Results and discussion
Calculation method of WPD
WPD is an important characteristic quantity for assessing wave energy. Reference to the calculation and evaluation method of Cornett (2008), Iglesias and Carballo (2011), Zheng and Li (2015) and Wang et al. (2016), the every 3 h WPD from January 1988 to December 2017 in the China Sea is calculated, according to equation (15).
Hence in,
The long-term monthly distribution of SWH and WPD
In order to achieve the spatial distribution of SWH and WPD, they are calculated by taking an average value of simulated records of the same month in each year during 30 years. Take January for example, they are mean values of all spatial records (
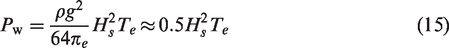
Spatial distributions of monthly-averaged SWH based on 30-year WW3 simulated results in the China Sea.
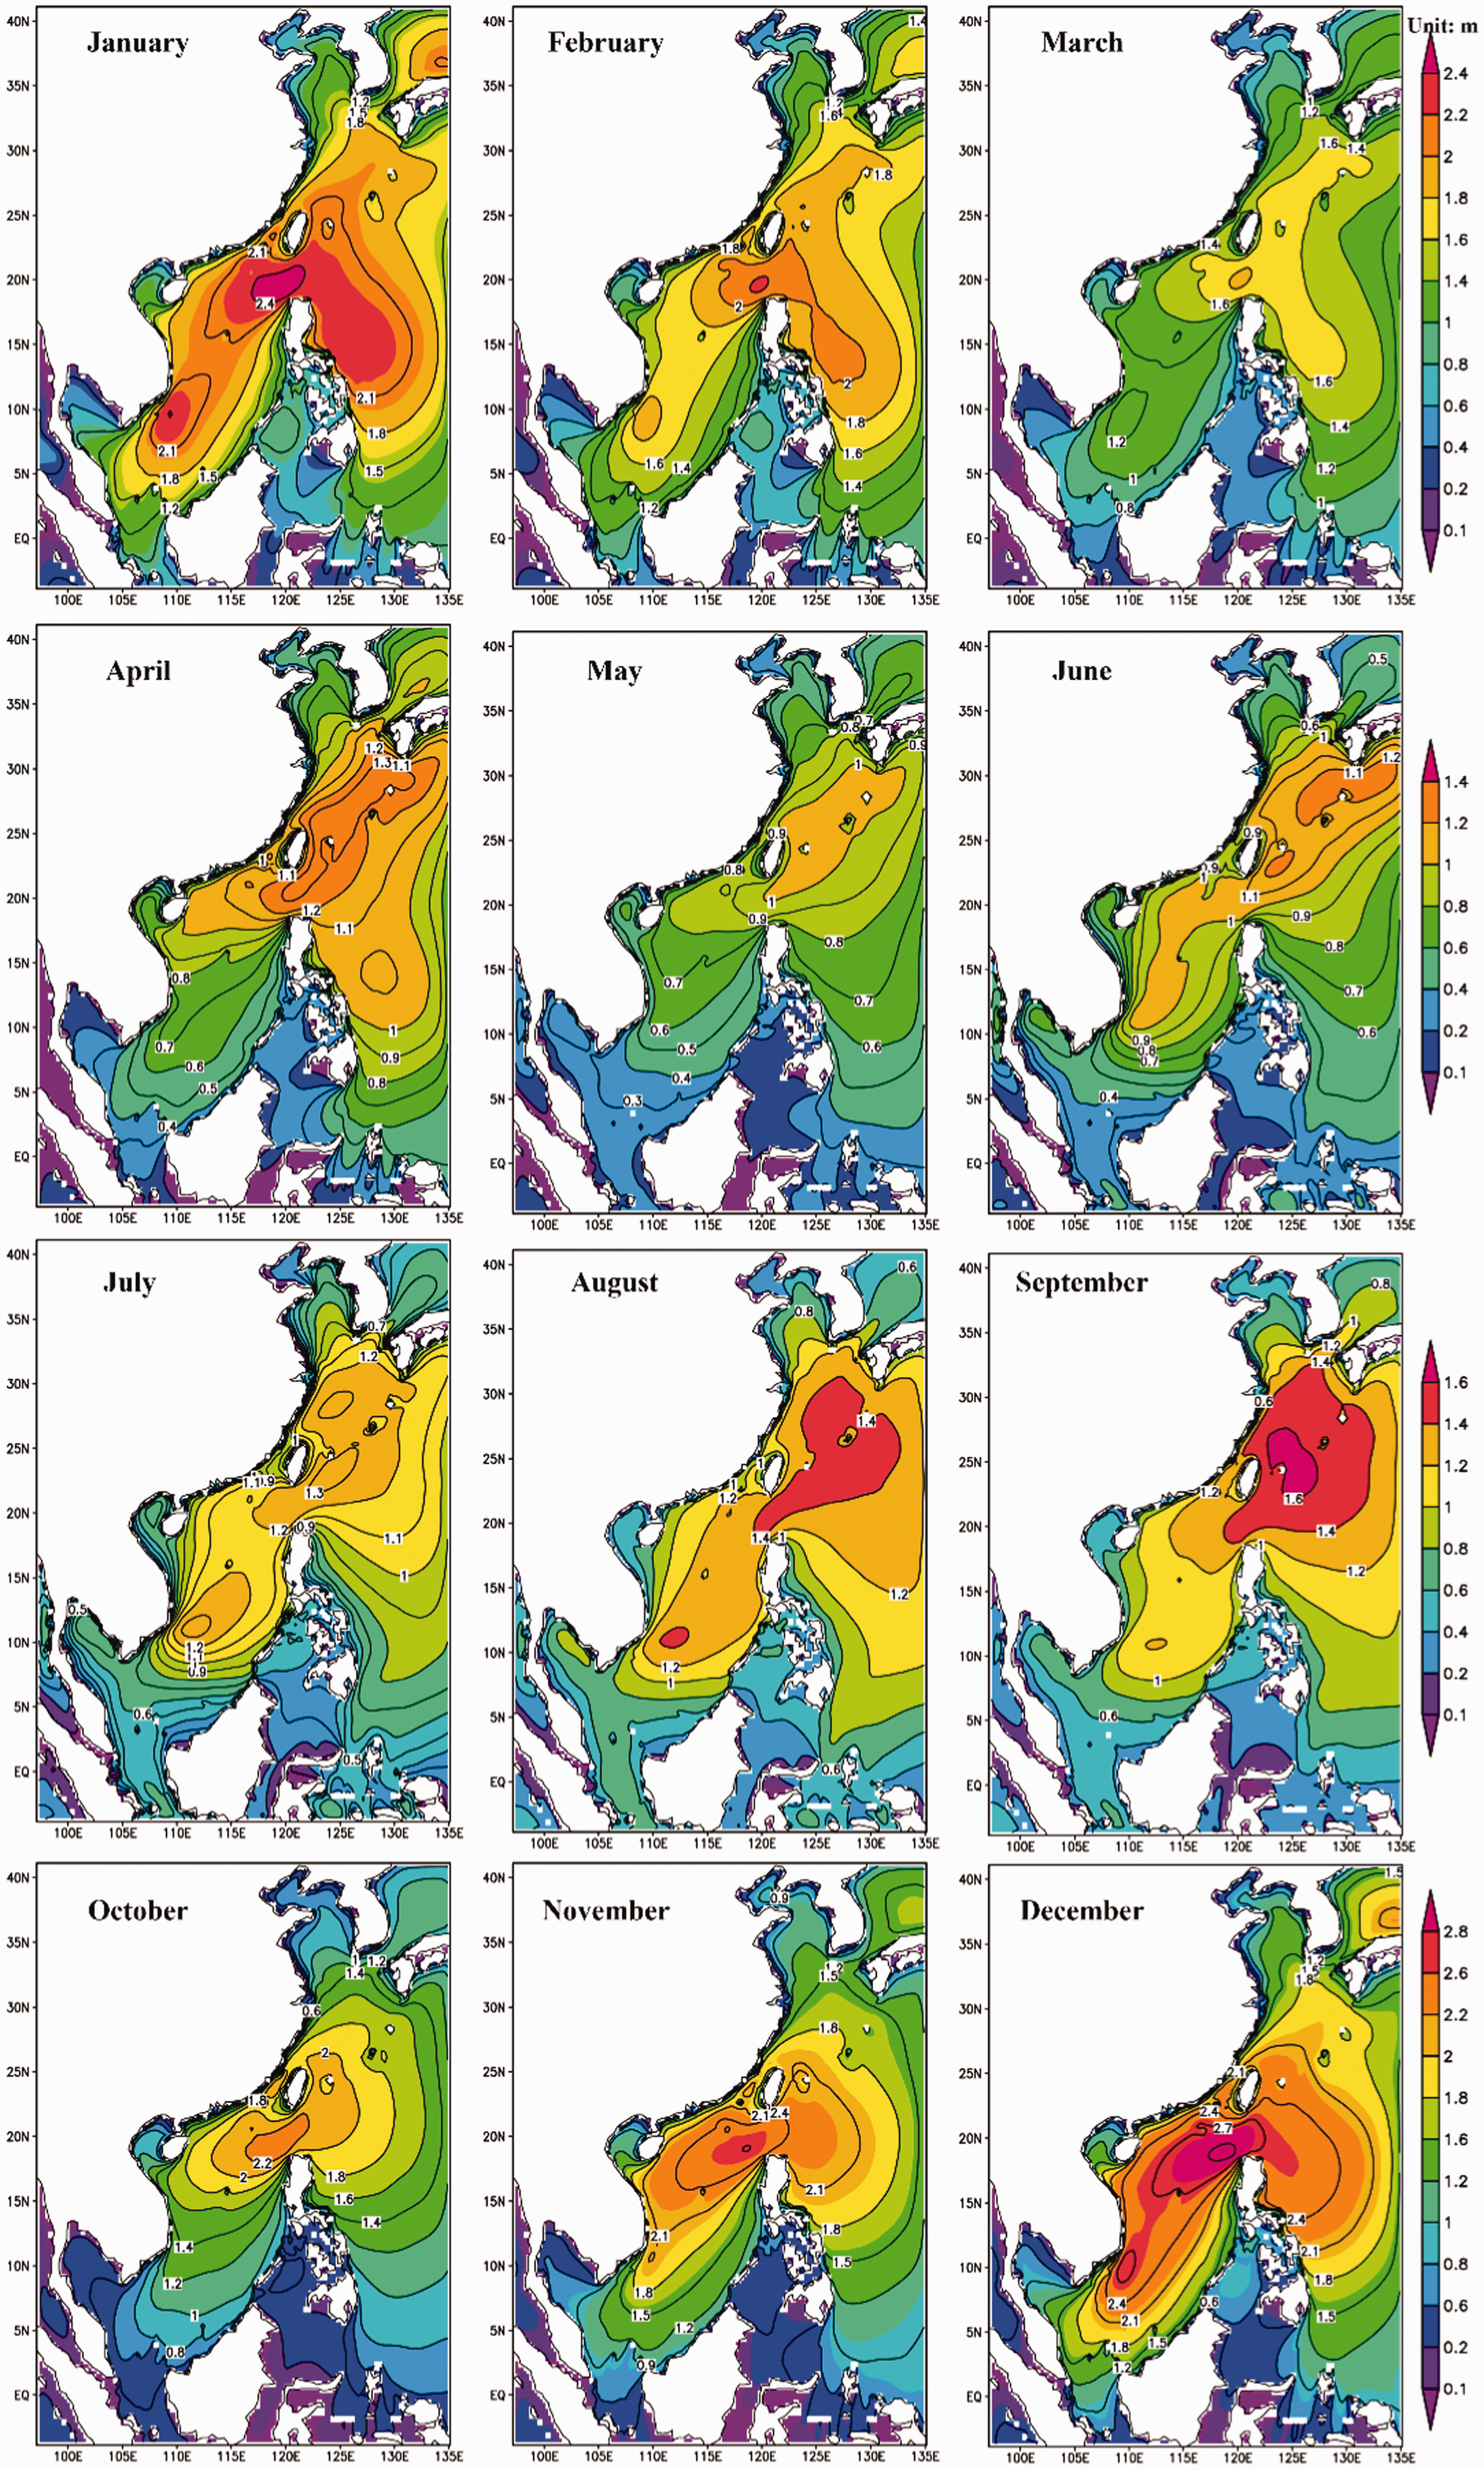
Spatial distributions of monthly-averaged wave energy power based on 30-year WW3 simulated results in the China Sea.
Generally, it is observed that the value of SWH is between 0.1 m and 2.7 m and the value of WPD is between 2 kW/m and 35 kW/m in the whole areas of the China Sea. As is clearly seen, the highest SWH with the value of 2.7 m and the largest WPD with the value of 35 kW/m arise in December and then drop to the minimum value in May. In terms of their distribution, the long-term monthly spatial distribution characteristic of WPD has a good consistency with that of SWH, both of them show a similar trend of moving from northeast to southwest. This may be associated with the emergence of the northeast monsoon season.
In December, SWH and WPD are the maximum of the year, with big value located in the line of the Dondsha Islands–the Nansha Islands, appearing in northeast to southwest direction. The two big value centers are located in waters around the Dondsha Islands and the Nansha Islands, where the SWH and WPD can reach to 2.4–2.7 m and 30–35 kW/m, respectively. This distribution may be due to the activity of cold air in December, which often brings strong wind. In May, SWH and WPD are the minimum of the year. The big value areas are located in the region of Ryukyu Islands–Luzon Strait, where the SWH and WPD are only 0.9–1.0 m and 4–4.5 kW/m, respectively. This distribution may be related to that the cold air strength has been greatly weakened, while the southwest monsoon has not yet formed.
In October, November, December, January, and February, most areas have the higher SWH between 1.2 m and 2.4 m and the larger WPD between 20 kW/m and 35 kW/m. Presumably it should be related to the frequent cold air and the prevalence of monsoon during this period. Besides, values of SWH and WPD become lower in April, May, June, July, and August. In the view of the regional distribution, the highest value of SWH and WPD distribute in the north–central part of the South China Sea, the East China Sea, the vicinity of Ryukyu Islands, the Northern South China Sea, and the Luzon Strait waters, of above 1.8–2.4 m in SWH and 16–35 kW/m in WPD. However, the Bohai Sea, the Yellow sea, the Northern Bay, and the Thailand Gulf arise the lowest value of them.
The long-term seasonal distribution of wave energy
To get more insight on the temporal variability and have a comprehensive consideration in the assessment of future exploitation, the long-term seasonal distribution of SWH, mean wave period, and WPD is assessed. We obtain the seasonal average contour maps using 30-year data. Take spring for example, they are mean values of all spatial records (
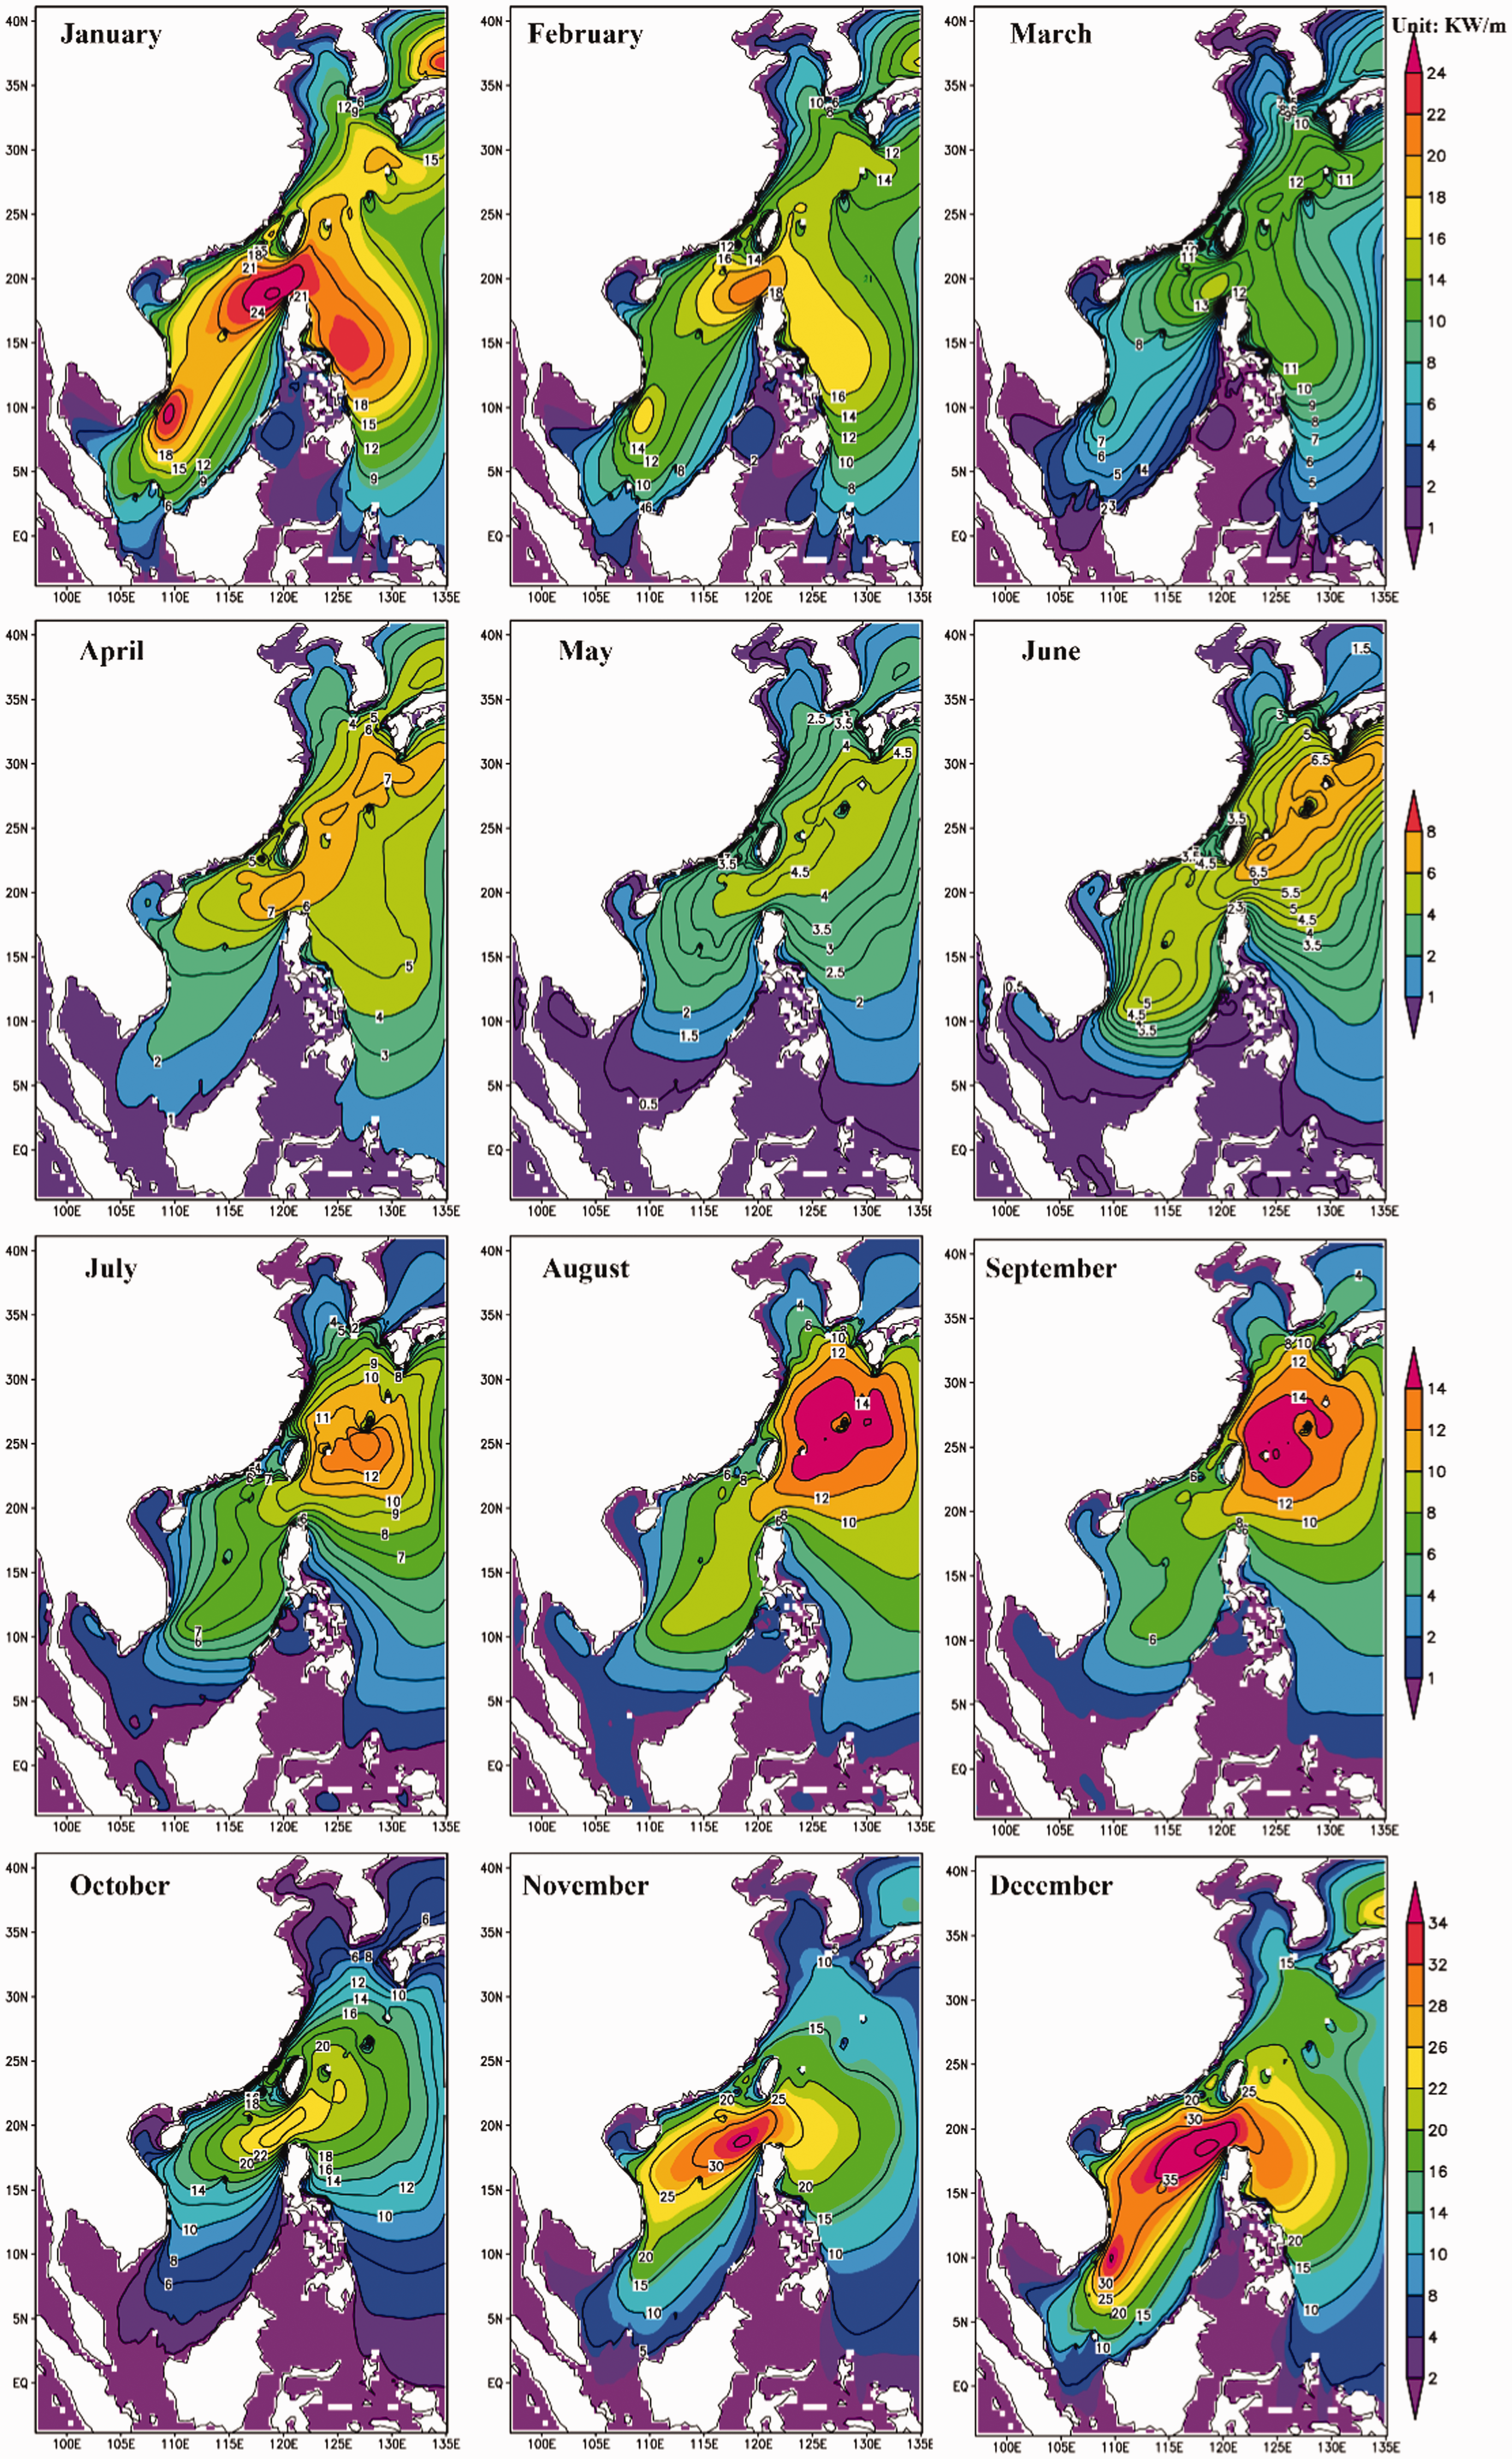
Distribution of seasonal (spring, summer, autumn, winter) SWH based on 30-year WW3 simulated results in the China Sea.
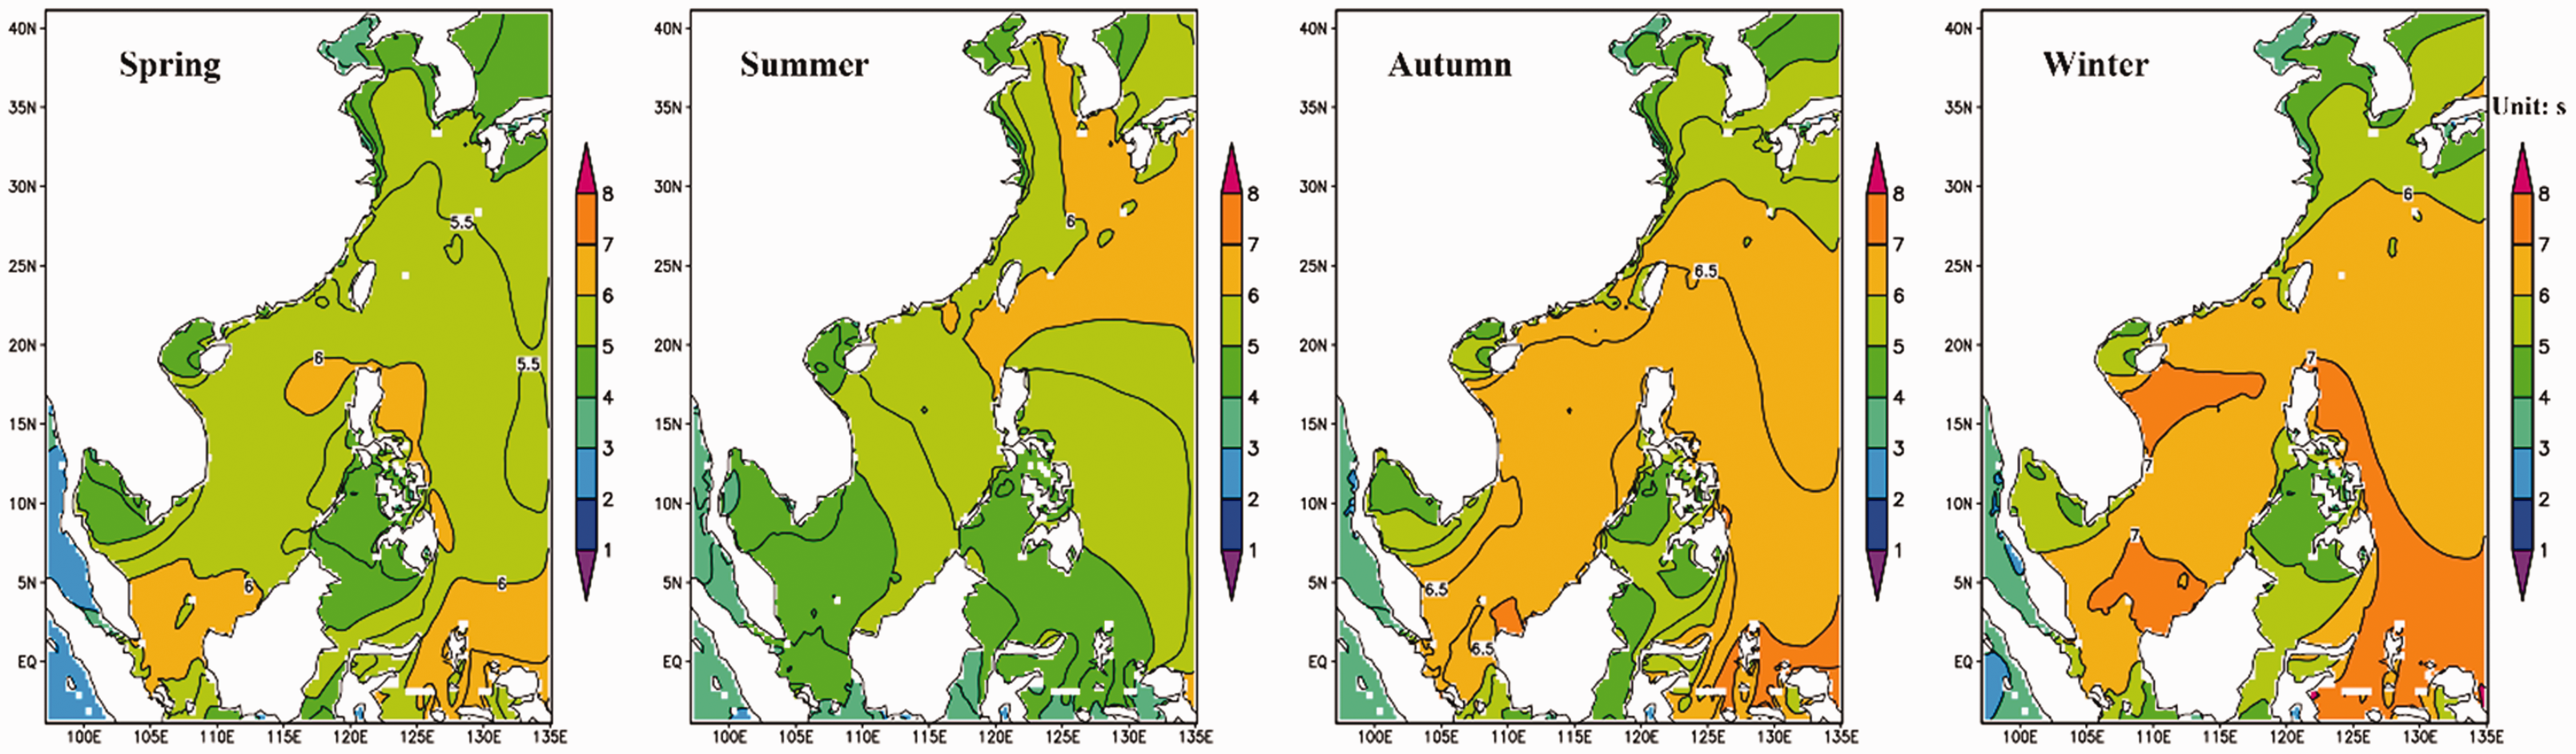
Distribution of seasonal (spring, summer, autumn, winter) mean wave period based on 30-year WW3 simulated results in the China Sea.
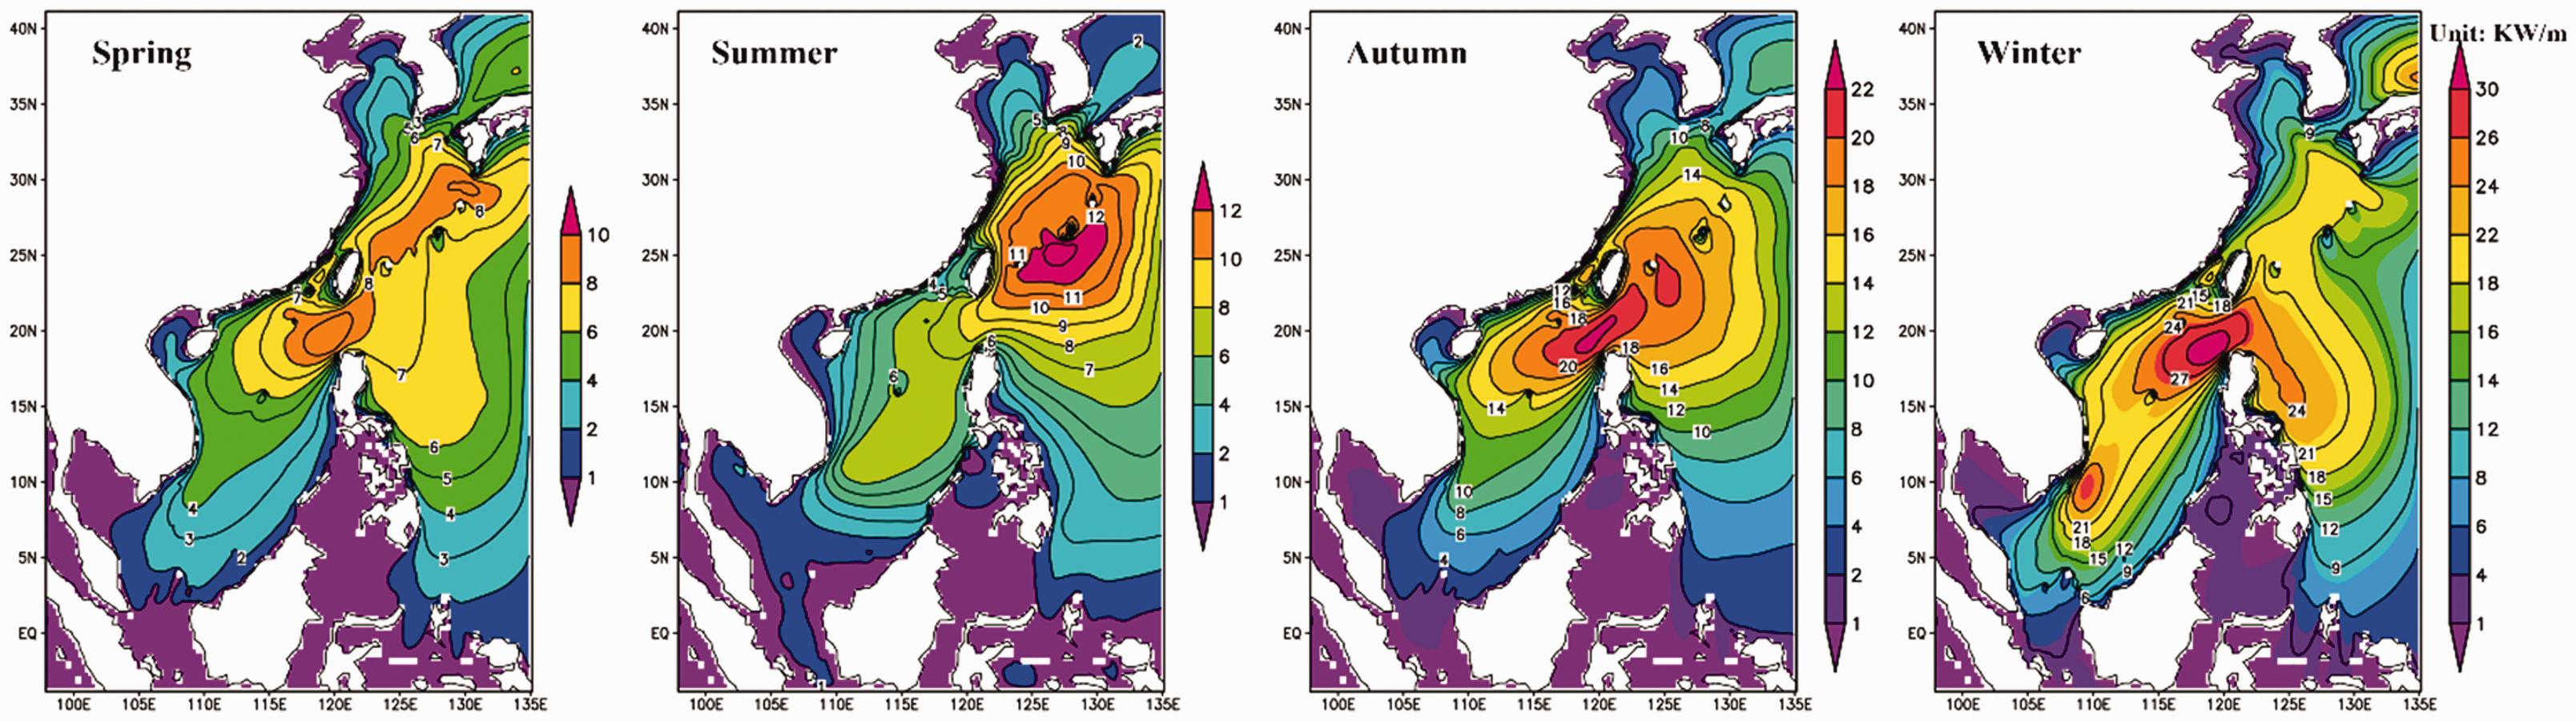
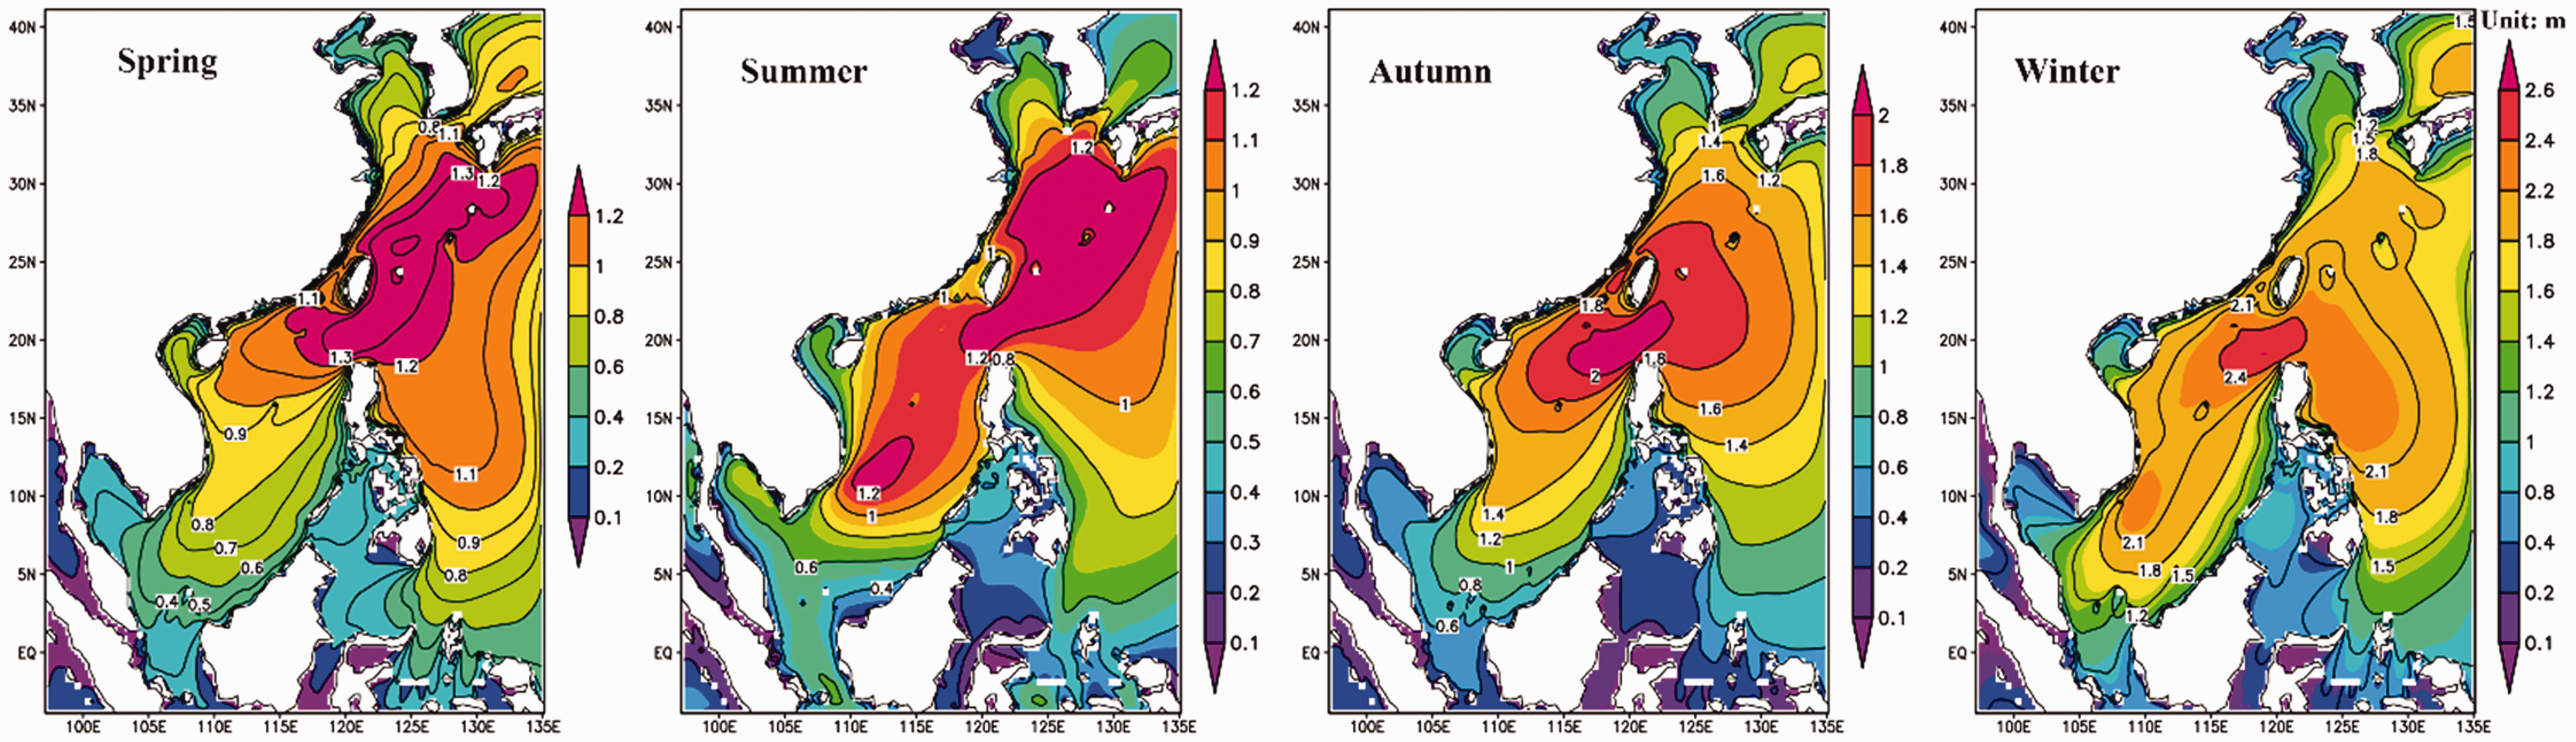
Distribution of seasonal (spring, summer, autumn, winter) WPD based on 30-year WW3 simulated results in the China Sea.
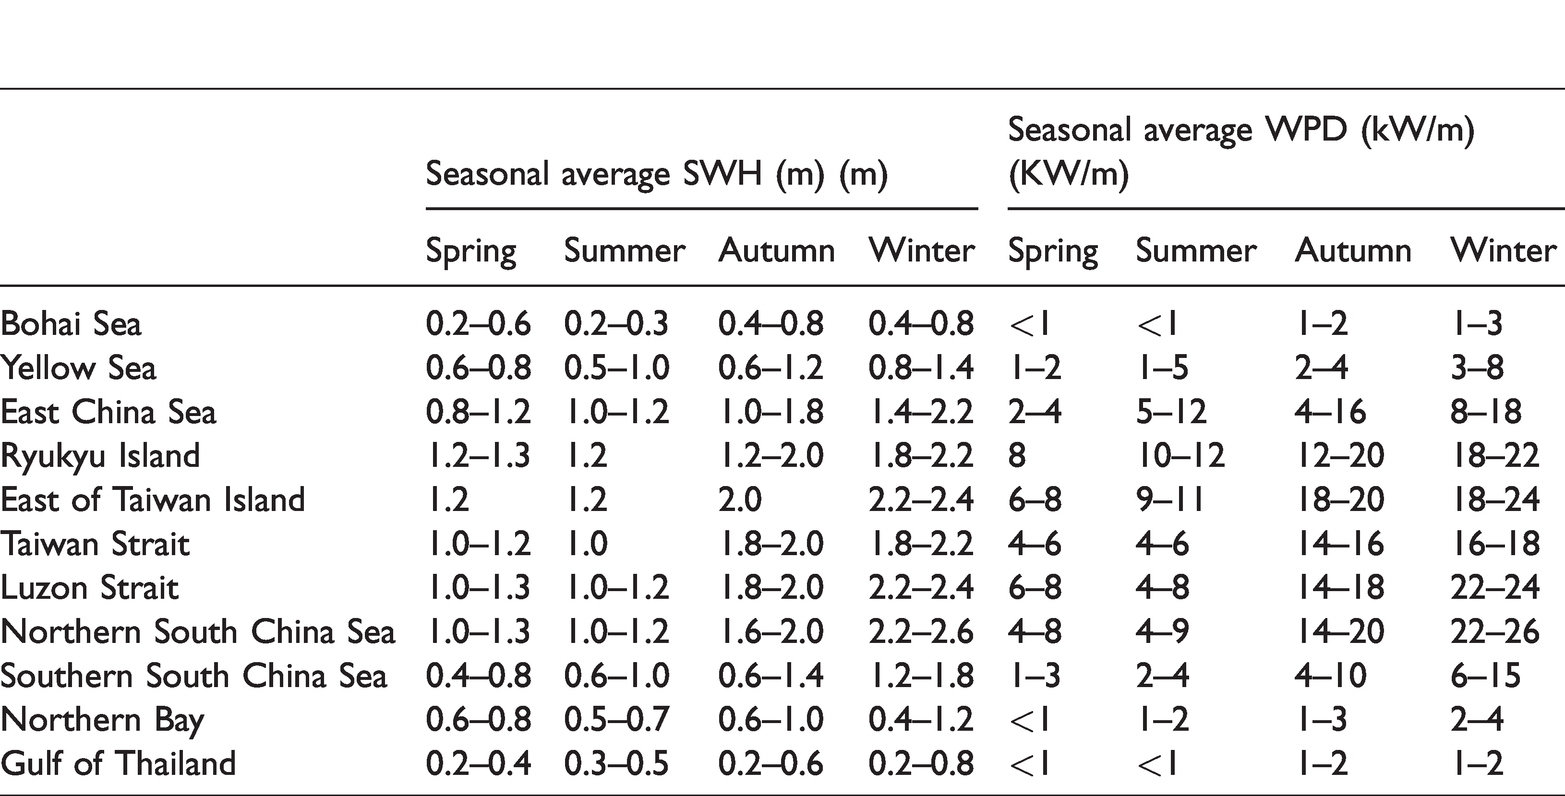
A summary of the distribution of significant wave height (SWH) and wave power density (WPD) in China Sea.
1. Figure 8 shows the seasonal average wave mean period (
2. In winter, SWH in most sea areas ranges from 1.8 m to 2.4 m, whereas WPD ranges from 18 kW/m to 24 kW/m. Both of them have the similar distribution, the largest value regions are mainly founded in two areas: waters around the Dongsha Islands and the Nansha Islands. In autumn, SWH in most sea areas ranges from 1.4 m to 1.8 m, whereas WPD ranges from 14 kW/m to 20 kW/m, becoming slightly smaller compared with winter. The larger value region distribution is mainly distributed in the waters around the Northern South China Sea, of above 1.1 m in SWH and above 18 kW/m in WPD. In the north area of the Yellow Sea, the Bohai Sea, the Northern Bay, the Gulf of Thailand, and the waters near the equator meet the lowest value of SWH and WPD. In summer, SWH in most sea areas ranges from 1.0 m to 1.2 m, whereas WPD ranges from 8 kW/m to 11 kW/m. The larger values of them are mainly found in the East China Sea, the Ryukyu Islands waters, and east of the Taiwan Island compared with the distribution of the larger value of WPD, which is located in the vicinity of the Ryukyu Islands. The lowest SWH and the smallest WPD appear in spring, basically within 1.2 m and 8 kW/m, respectively.
3. The Bohai Sea, the Northern Bay, and the Thailand Gulf are the lowest value center, in SWH and WPD. To the central and southern Yellow Sea, as the sea becomes broader, the ocean wave is fully grown, the value of them increase significantly. The SWH and WPD in the East China Sea are much larger than that in the Bohai Sea and Yellow Sea. Large value regions of SWH and WPD are found in the East China Sea, the vicinity of the Ryukyu Islands, the waters around the Northern South China Sea and the Luzon Strait waters.
The distribution of exploitable SWH and WPD
The occurrence of exploitable SWH and WPD is an essential indicator to measure the exploitation degree of wave energy. We considered an available area where SWH is between 1.3 m and 4.0 m, and WPD is greater than 2 kW/m, which some excellent wave power device such as Oscillatory Water column can make the best use of the wave energy (Ren et al., 2009; Zheng et al., 2012). In this paper, we use the simulated data to complete the calculation about the occurrence of seasonal (spring, summer, autumn, winter) exploitable SWH and WPD. Results are shown in Figure 10 and 11 and Table 3.
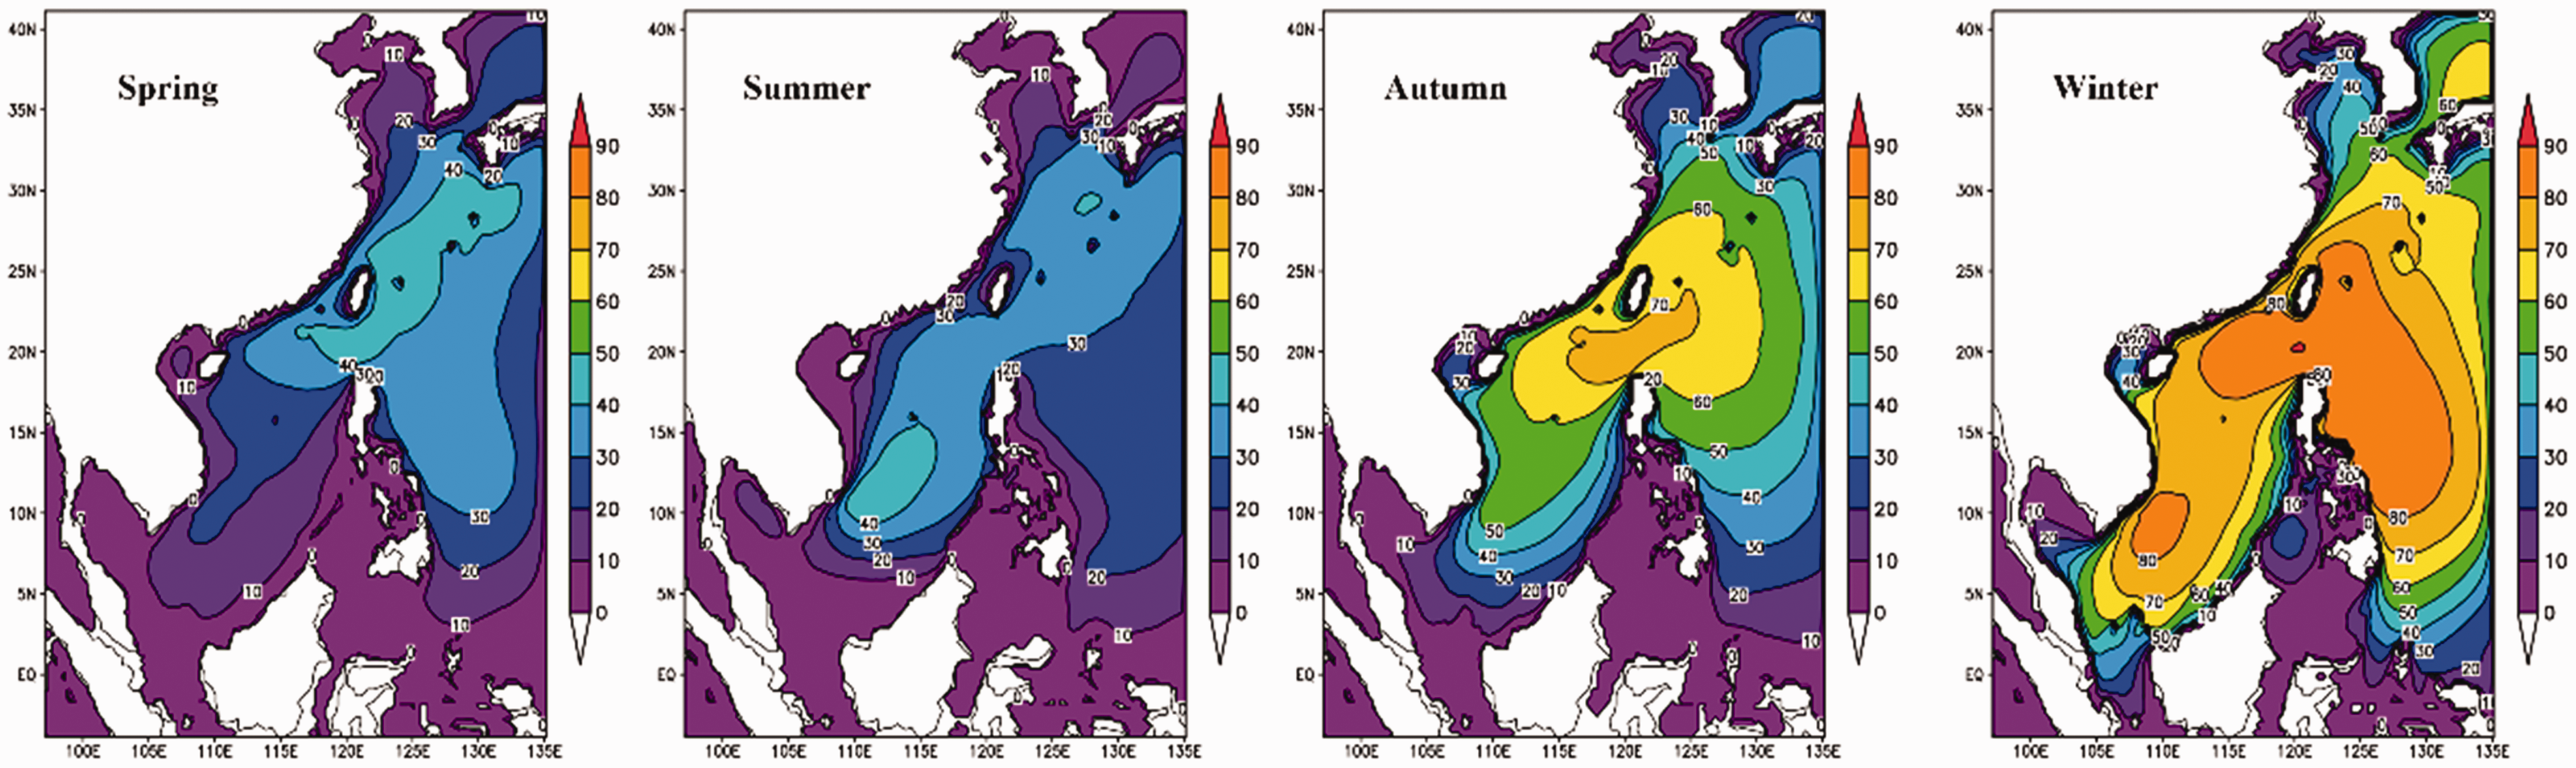
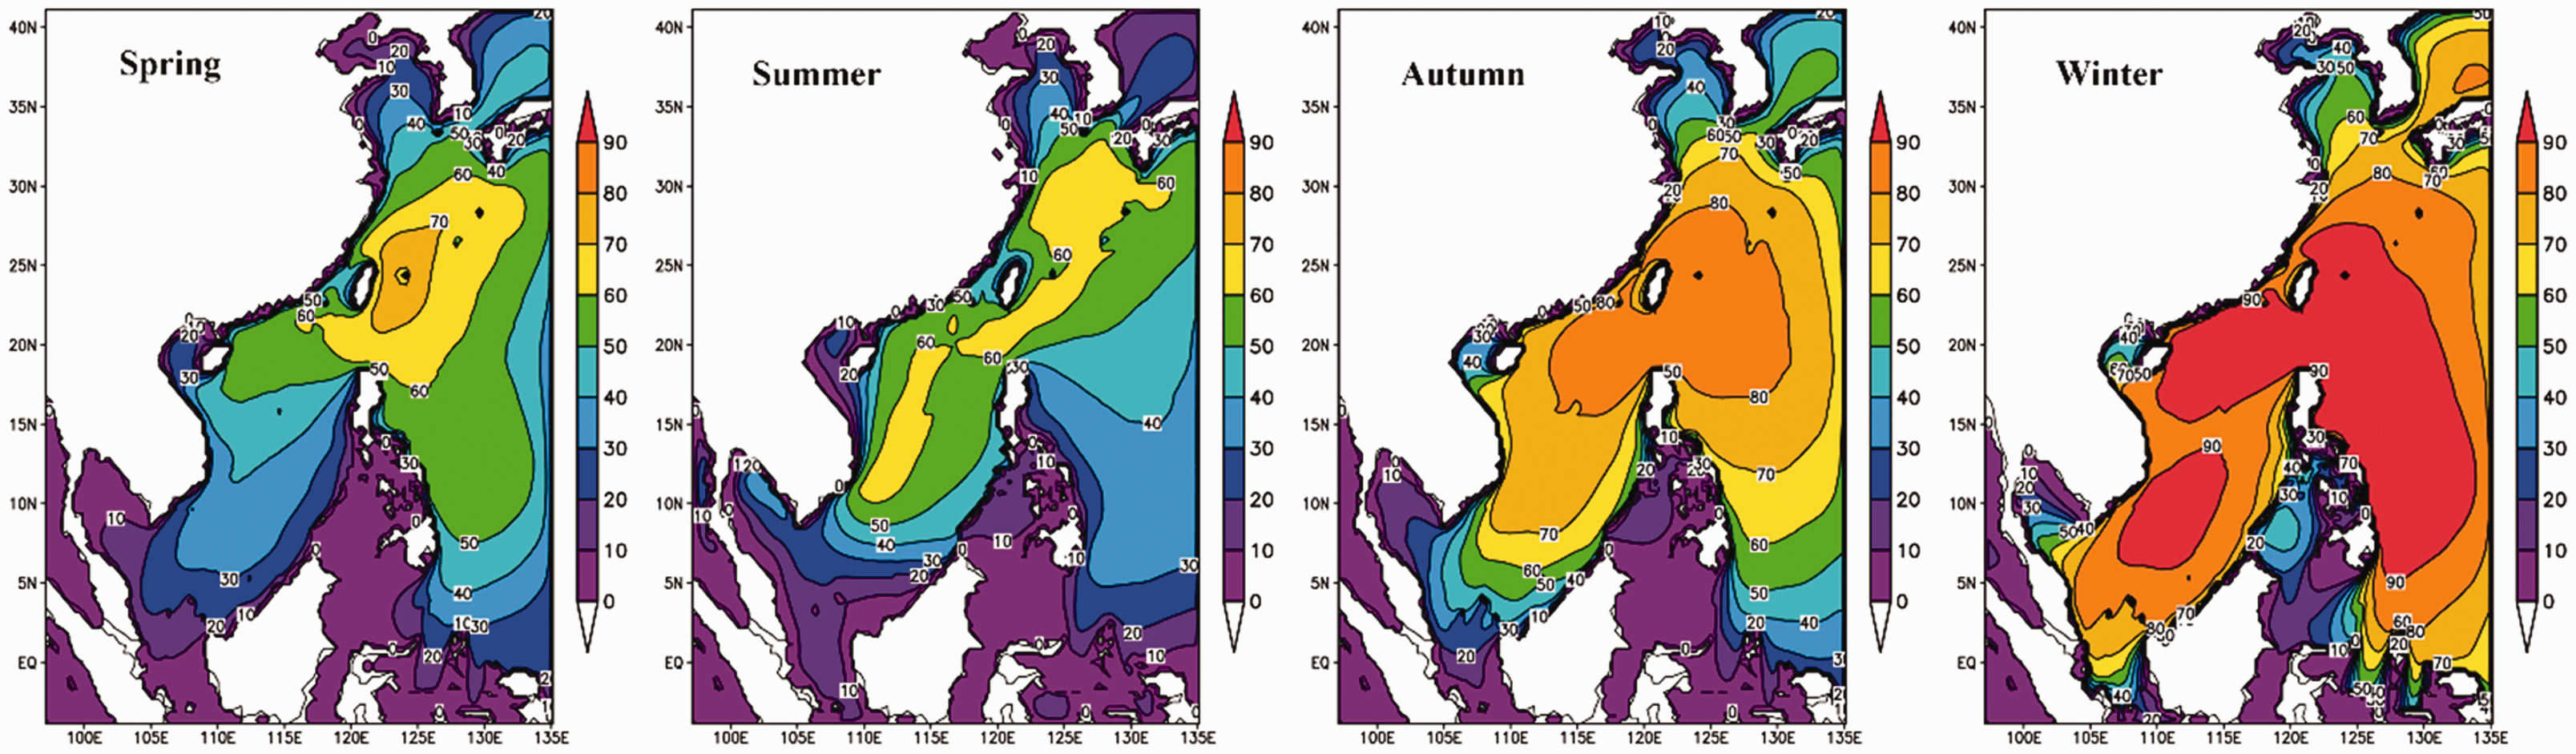
Occurrence of seasonal (spring, summer, autumn, winter) exploitable SWH (unit: %) based on 30-year WW3 simulated results in the China Sea.
Occurrence of seasonal (spring, summer, autumn, winter) exploitable WPD (unit: %) based on 30-year WW3 simulated results in the China Sea.
A summary of the probability of exploitable significant wave height (SWH) and wave power density (WPD) in China Sea.
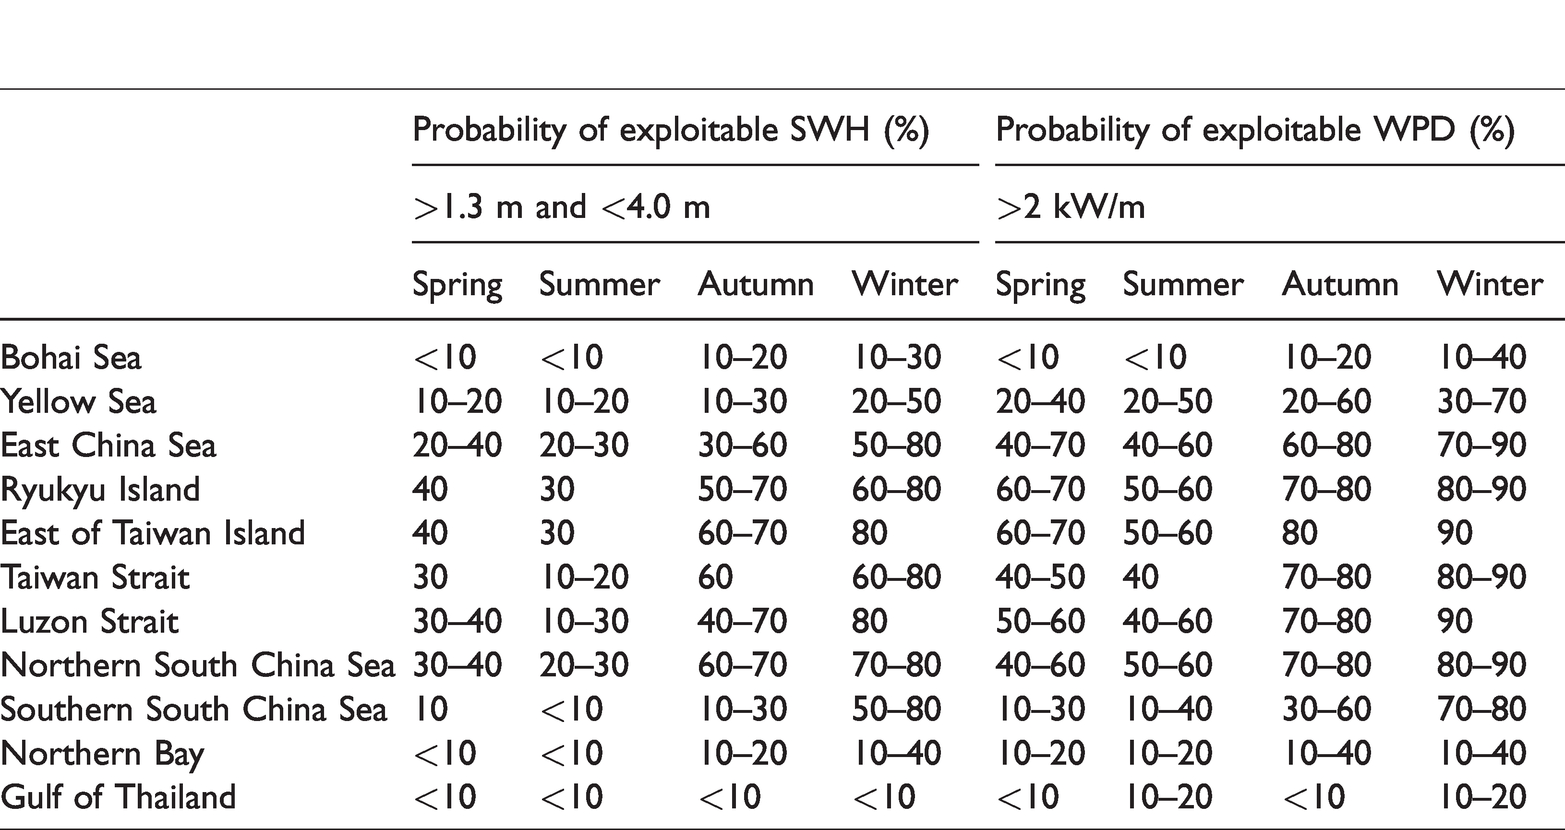
As is shown, the occurrence of exploitable SWH and WPD shows obvious seasonal changes. The exploitable SWH and WPD are basically similar in regional distribution trends. In winter, the value of the occurrence of exploitable SWH and WPD in the Northern South China Sea, Ryukyu Islands waters, the Luzon Strait waters, east of Taiwan Island, and the East China Sea is above 80% and 90%, respectively. They are relatively low in the Yellow Sea and Bohai Sea, but can also reach to 10%–30% and 40%–50%, respectively. In summer appears the lowest value of the occurrence of exploitable SWH and WPD in the South China Sea and the East China Sea is 10%–40% and 10%–60%, respectively. In the Bohai Sea, the Northern Bay, the Thailand Gulf, and the north area of the Yellow Sea have the lowest value, almost below 10%.
In general, the occurrence of exploitable SWH and WPD in winter is the highest in the year, followed by autumn, spring, and summer. The occurrence of them is relatively low all the time in the Bohai Sea, the Northern Bay, the Thailand Gulf, and the north area of the Yellow Sea. However, most regions of the East China Sea, the Ryukyu Islands waters, east of the Taiwan Island, and northeast of the South China Sea have a high probability and are suitable for the development of wave energy.
The stability of WPD
Cornett (2008) has pointed out that it is necessary to consider the disperse nature of data in the assessment of power plant location. Van et al. (2005) and Johanning et al. (2007) have thought that the stable energy density has momentous sense to energy collection. By calculating the WPD coefficient of variation (abbreviated as 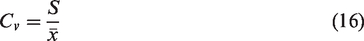
In equation (16), 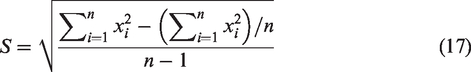
In equation (17),
By using the every 3 h data of WPD over the past 30 years, the stability of WPD in long-term seasonal was calculated as shown in Figure 12 and Table 4,
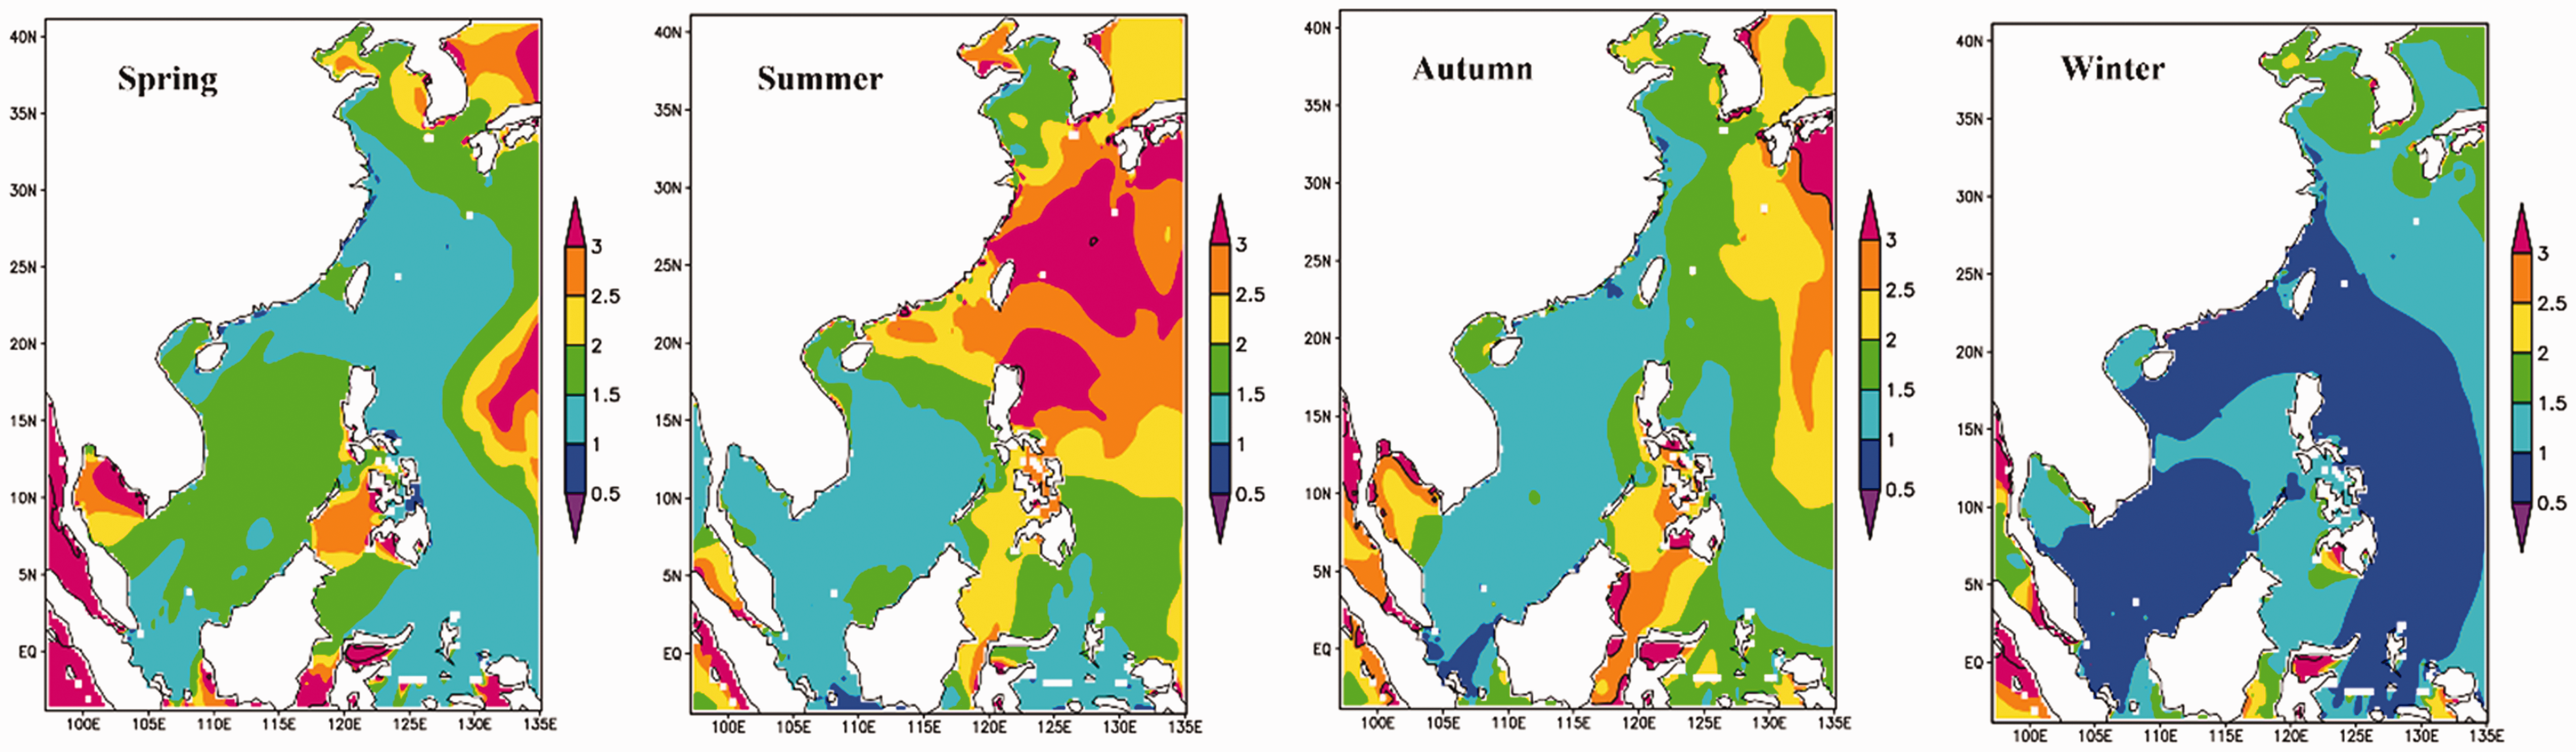
Distribution of seasonal (spring, summer, autumn, winter) coefficient of variation of WPD in the China Sea.
A summary of the stability of wave power density (WPD) in China Sea.
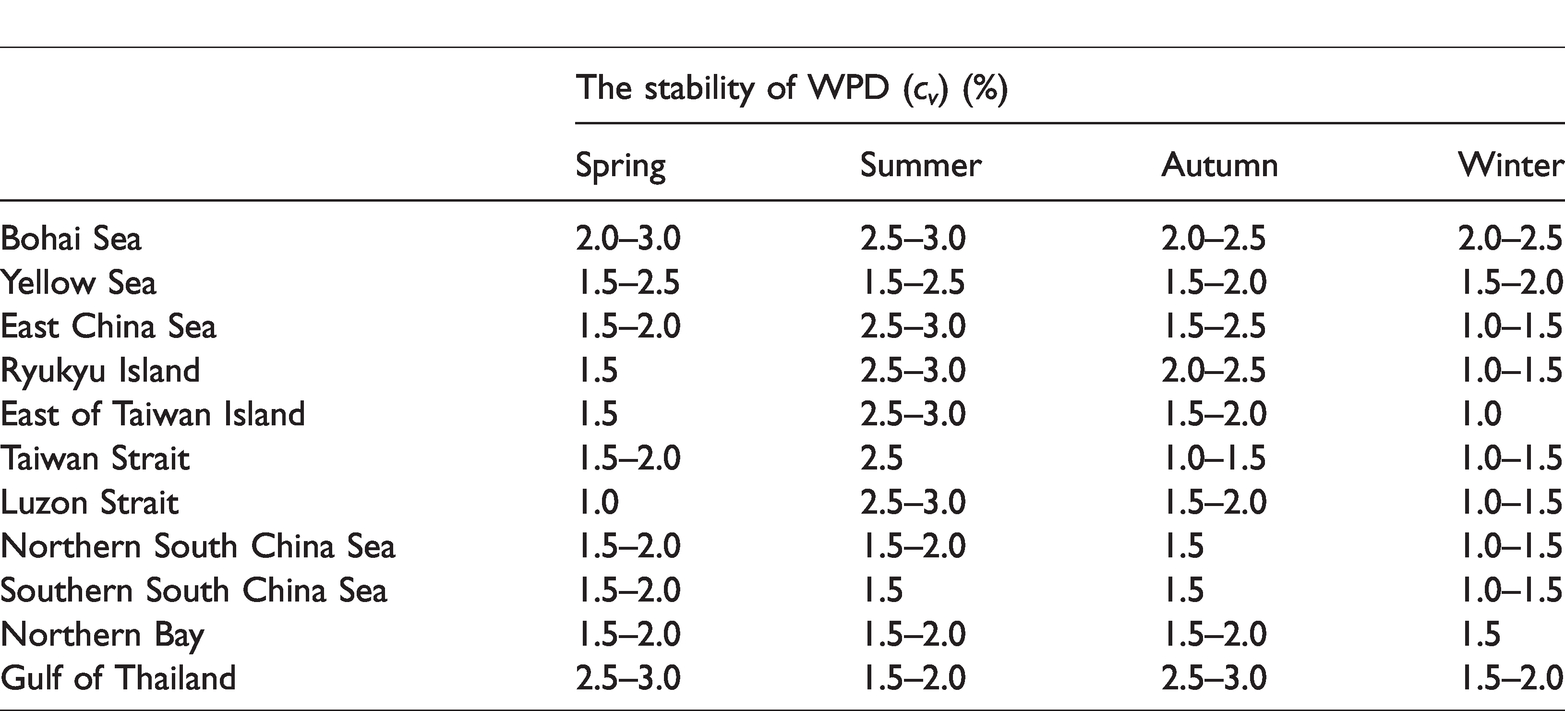
Overall, the variation coefficient in winter and autumn is less than that in spring and summer, which means that the stability in winter and autumn is better than that in spring and summer. In winter, the regions with better stability of WPD are located in the South China Sea and waters surrounding Taiwan Island, with the value almost less than 1.0, and that of the East China Sea basically between 1.0 and 1.5, the Yellow Sea and Bohai Sea basically between 1.5 and 2.0. It may be related to the stable energy power density in the South China Sea under the strong winter monsoon control. In autumn, the variation coefficient in most of the South China Sea and Taiwan Strait is less than 1.5 and in the most areas of East China Sea and waters east of the Taiwan Island, between 1.0 and 1.5, while in the Bohai Sea and the Yellow Sea are almost above 2.0. In spring, the areas where the stability of wave energy is better are located in the most areas of East China Sea and waters east of Taiwan Island, with the value less than 1.5. However, it is about 1.5 in the most of the South China Sea, 1.5–2.0 in the Taiwan Strait and the Yellow Sea. The stability in the Bohai Sea is the worst, over 2.0. In summer, the stability of WPD is the worst in the year. The areas with worse stability are located in the waters surrounding Taiwan Island, the East China Sea, with the value of variation coefficient above 2.0. This may be related to the stable southwest monsoon in the South China Sea and tropical cyclones in the East China Sea and Taiwan Island. From the total stability of view, the stability in winter is the best through the year whereas appears the worst stability in summer. The South China Sea is better than other sea areas, and the variation coefficient of WPD in this sea area is basically within 2.0 in each season.
Conclusions
The WW3 driven by 30-year CCMP wind field data can better simulate the wave energy of the China Sea. Wave energy assessment in large-scale areas and long-term temporal are helpful to understand the spatial and temporal distributions of wave energy and can provide macroscopic references for decision makers to evaluate wave energy projects. In sight of the distribution of SWH and WPD, it is clearly seen that the better development potential of wave energy occurs in December, with a larger value of SWH (1.8–2.7 m) and WPD (20–35 kW/m). Results also show that the wave energy in the China Sea has obvious seasonal and regional difference. The SWH and WPD in winter have the maximum value, followed by autumn and summer, spring has the minimum value. Large value regions are found in the Northern South China Sea, the East China Sea, the Ryukyu Islands waters, east of the Taiwan Island, the Luzon Strait no matter the SWH or the WPD. In contrast, the value of them in the Yellow Sea, the Bohai Sea, the Northern Bay, the Gulf of Thailand, and waters near the equator are generally small. During the 30 years’ analysis, high occurrence areas of exploitable SWH and WPD are found in the South China Sea, east of the Taiwan Island, the East China Sea, and the Ryukyu Islands waters, but in the Bohai Sea and the Yellow Sea are relatively low, especially in the coastal sides as low as 10%. Most areas in the South China Sea are stable, and the variation coefficient of WPD in this sea area is basically within 2.0 all over the year. In the whole, the Bohai Sea, the northern part of the Yellow sea, the Northern Bay, and the Gulf of Thailand are all in the poor resource areas. The Northern South China Sea waters, the East China Sea, the Ryukyu Islands waters, east of the Taiwan Island, and the Luzon Strait belong to the exploitable areas of resources.
Footnotes
Author note
Jianjun Xu and Chongwei Zheng made equal contributions to this paper.
Acknowledgements
We would like to acknowledge the NASA Earth Science Enterprise for providing CCMP wind data and the NOAA/NCEP, the WAM for the support on the WW3 model and the support of the Opening Fund of Shandong Provincial Key Laboratory of Ocean Engineering. In addition, our deepest gratitude goes to the anonymous reviewers for their careful work and thoughtful suggestions that will make this paper more improvement.
Declaration of conflicting interests
The author(s) declared no potential conflicts of interest with respect to the research, authorship, and/or publication of this article.
Funding
The author(s) disclosed receipt of the following financial support for the research, authorship, and/or publication of this article: This research was funded by the Open Research Fund of State Key Laboratory of Estuarine and Coastal Research (Grant No. SKLEC-KF201707), the Opening Fund of Shandong Provincial Key Laboratory of Ocean Engineering, Strategic Priority Research Program of Chinese Academy of Sciences (Grant No. XDA20060503), the National Key R&D Program of China (Grant No. 2018YFA0605604 and 2017YFC1501802), the Innovation and Entrepreneurship Project of Ocean Engineering Institute of Tianjin University (Grant No. 20190201-5) and the state Key Laboratory of Precision Measuring Technology and Instruments of Tianjin University and the Science research fund for young teachers (Grant No. Pilq1702).