
Abstract
This study employed dynamic economic dispatch with the particle swarm optimization method to optimize the generation cost of a solar photovoltaic-integrated power system. In the study, a load profile initially aligned with peak solar power production that evolved to be relatively flat was considered. Load profile flatness was measured by the load factor, whereas alignment between solar power production and peak loads was determined by the solar-load correlation coefficient. The results revealed that the load profile with the highest load factor exhibited the best generation cost in most cases. However, as solar power penetration increased, load profile with higher positive solar-load correlation coefficient was the most cost-effective, whereas that with the highest correlation offered the worst costs. This result implies that these flattening and coincidence techniques potentially improve generation costs at low and high solar penetrations, respectively. However, load profiles with high positive solar-load correlation coefficients may not effectively reduce generation costs at high solar penetration.
Keywords
Introduction
Load profiles (LPs) are crucial in power system operation and planning. Thus, to a large extent, the LP is a key contributing factor to the efficient performance of a power system (Asare-Bediako et al., 2014; Fezai and Belhadj, 2016). Typically, consumption patterns in power systems vary greatly with time, whereas it is an operational requirement that the supply matches the consumer load demand (Lund et al., 2015; Paterakis et al., 2017). The wide gap that could exist between the instantaneous load demand and the available supply can lead to serious challenges in the power system. These challenges include underutilized generation units, extra investments in infrastructure and limited renewable energy (RE) penetration, among others (Javaid et al., 2017; Mahmud et al., 2018). Therefore, influencing consumption patterns to stay within the limits of generation resources has become very important. Moreover, reducing the usual wide gaps between peak and valley loads to yield relatively flat LPs is paramount (López et al., 2015; Meyabadi and Deihimi, 2017) because LP flattening offers numerous benefits, such as reduced generation costs, and has been widely investigated in the literature (Javaid et al., 2017; Surai and Surapatana, 2014; Yao et al., 2016).
However, modern power systems are evolving due to factors such as environmental impact and the sustainability of energy sources (Gul et al., 2016). Moreover, the rapidly rising energy demands of human activities cannot be sustainably supplied through fossil sources alone (Li et al., 2018b; Liu et al., 2019). These factors have contributed to the high penetration of RE sources such as solar PV in power systems (Jin et al., 2017; Li et al., 2018a). A predominant challenge of solar PV integration into the utility grid is its variable nature. The variation in solar PV contributes to power demand and supply mismatch and, consequently, grid instability (Emmanuel and Rayudu, 2017).
To mitigate the challenges posed by the variable nature of solar PV, both supply- and demand-side techniques have been explored (Lund et al., 2015; Paterakis et al., 2017). Among the demand-side techniques, several studies have shown that improving LPs to align with solar power production could mitigate some of the challenges resulting from the variation in solar power generation.
In this regard, Fezai and Belhadj (2016) demonstrated that solar power utilization and solar microgrid efficiency can be improved by shifting peak loads toward peak solar power production. A similar study on a hybrid power system also showed that LPs with high daytime loads exhibited better levelized costs of energy than other LPs (Bilal et al., 2013). Stodola and Modi (2009) demonstrated that supplying daytime peak loads with peak solar power production makes use of solar PV cost-effective by reducing the need for storage facilities. Likewise, Hasan and Chowdhury (2014) reported that increasing the daytime production loads in a solar PV-integrated power system reduced the generation costs. According to George and Banerjee (2011), generation from intermittent sources becomes more valuable when it corresponds to the bulk part of the load. Similarly, other studies have shown that the proportion of the load occurring during periods of sunlight affects the performance of solar-integrated systems (Helman, 2017). According to Liu et al. (2010), when the load is aligned with solar power generation, dispatchable generation units and solar PV can complement each other to cope with variation in the load. Similarly, Bayram et al. (2018) observed that under high solar PV penetration conditions, LPs with peak loads coinciding with solar PV generation reduced ramping in the generation units. Moreover, Rose et al. (2016) reported that improving either the flatness of the LP or the alignments between daytime peak loads to coincide with peak solar generation favored the economics of solar PV.
However, considering the default bell shape of solar resources (Jamal et al., 2017), load patterns aligned with solar power production are inconsistent with the flat LP desired in power systems. It is worth noting that previous studies on improving power system performance have often employed either the conventional method of flattening the LP or the method of aligning the peaks of solar power production and load. However, none of these studies have compared these two methods to determine which method better improves the generation cost performance. Therefore, an investigation into the impacts of both LP flattening and alignment of the peaks of solar power production and load demand on the generation cost is relevant. This investigation will provide deeper insight into the type of LP to be adopted in solar PV-integrated power systems in order to reduce generation costs.
Thus, the main contribution of this paper is the use of an optimization model to investigate the generation costs of a solar PV-integrated power system using two LP improvement techniques: LP flattening and solar-load alignment. The considered LP initially aligned with the peak solar power production but evolved to a relatively flat profile to improve the generation cost under varying solar conditions. In the simulation study, the alignment between solar power generation and the load demand was measured in terms of the solar-load correlation coefficient. Moreover, the flatness of the LP was determined by the load factor (LF).
The first section of this paper presents the introduction of this study. The formulation of the dynamic economic dispatch (DED), load shifting, PV system, and particle swarm optimization (PSO) is discussed in following section. In the same section, the test system under consideration is described. The simulation results and a discussion of the findings and significance of this study are presented in third section. The final section provides the conclusion, summary of findings, and future work direction.
Materials and methods
In this simulation study, the generation cost of the solar PV-integrated power system was modeled in MATLAB (MATLAB r2016a, MathWorks®, Natick, MA) as a single-objective DED with the PSO method. In this study, a test system with six thermal generation units was used. The initial load profile (LP2) was adopted from (Vaisakh et al., 2012; Figure 1). However, this profile was scaled down by a factor of 5 to fit the generation capacity of the test system. The LP2 had daytime peak loads that were considerably aligned with daytime peak solar power production. However, to improve the flatness of the LP, 5% of the peak loads were continuously shifted from peak to valley hours to obtain the LPs LP3 and LP4 (Figure 1). The peak load hours were assumed to be within the period from 10 to 19 h, whereas the valley load hours were from 1 to 7 h and from 22 to 24 h. However, LP1 was obtained by shifting loads from the valley to the peak load hours. It is worth noting that the net loads of all LPs are equal.
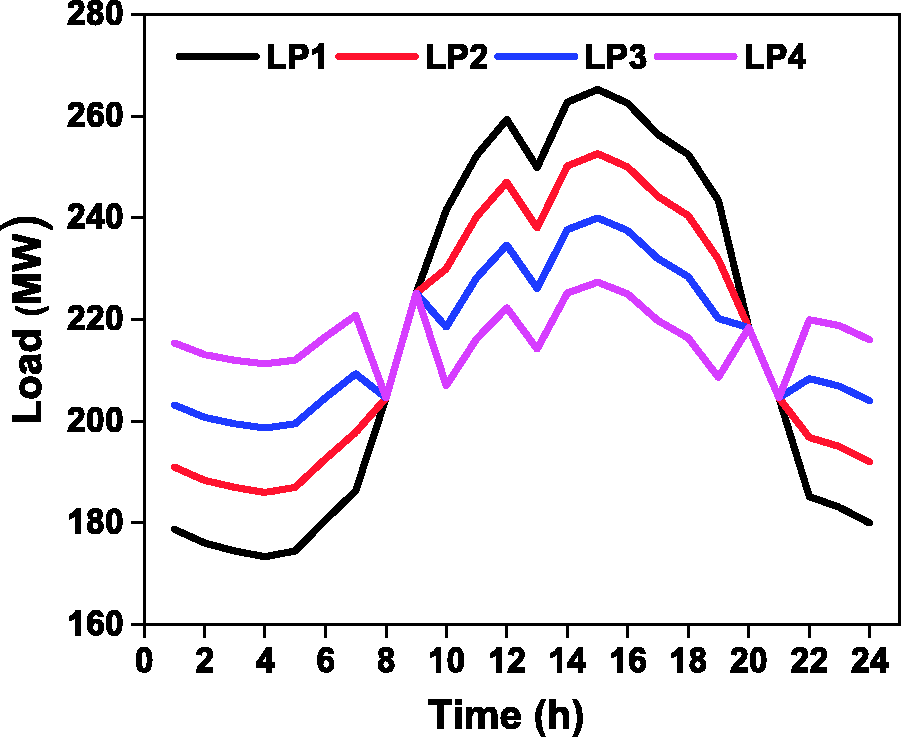
Load profiles (LPs).
The costs of the load shifting program were assumed to be negligible ($0/MW). This assumption is necessary because both flat LPs and LPs with daytime peak loads coinciding with peak solar power production have been projected as the desired LPs in the existing literature. Therefore, the assumption of $0/MWh decoupled the outcomes of this study based on the performance of the LPs from other influencing factors, such as the costs incurred in the load shifting program. The authors envisaged that this assumption could therefore help to achieve the main objective of this study. Nevertheless, this assumption is a limitation of this study, as considerable costs could arise from changing energy consumption patterns.
Problem formulation
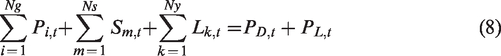
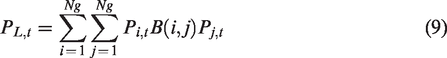
The objective of the DED employed in this study was to minimize the generation costs of the online generation units for the given load demands subjected to various operational constraints over the dispatch period. The DED was modeled as follows (Hasan and El-Hawary, 2016; Jebaraj et al., 2017; Ramabhotla et al., 2016):
The objective function was formulated according to Hasan and El-Hawary (2016) as

The fuel cost function with valve-point loading effect was considered as

Additionally,


The cost of the load shifting program,
The DED was subjected to real power demand and supply balance constraints as
Moreover, the transmission losses were considered as
The limits of the real power outputs of the generation units were formulated as

Additionally, the thermal generation units were subjected to ramping limitations as

Load shifting formulation and constraints
The new load based on the load shifting program was formulated as (Nazari-Heris et al., 2017)


The limits of

Solar PV system
The output energy of the solar PV system


Particle swarm optimization
The PSO algorithm consists of particles with the aim of identifying candidate solutions and, eventually, the optimal solution of an optimization task. In this algorithm, the particles are initially randomly distributed in the solution search space with assigned random velocities and positions. In every iteration, each particle assesses the fitness of its current position by an objective function. The particle then uses its own experience


The PSO was adopted in this study due to its simple implementation, robustness, lesser computational time, and reliable true global convergence compared to those of other algorithms. This algorithm is effective at finding solutions to global optimization tasks (Li et al., 2018a).
The flowchart of the generation cost optimization model is shown in Figure 2.
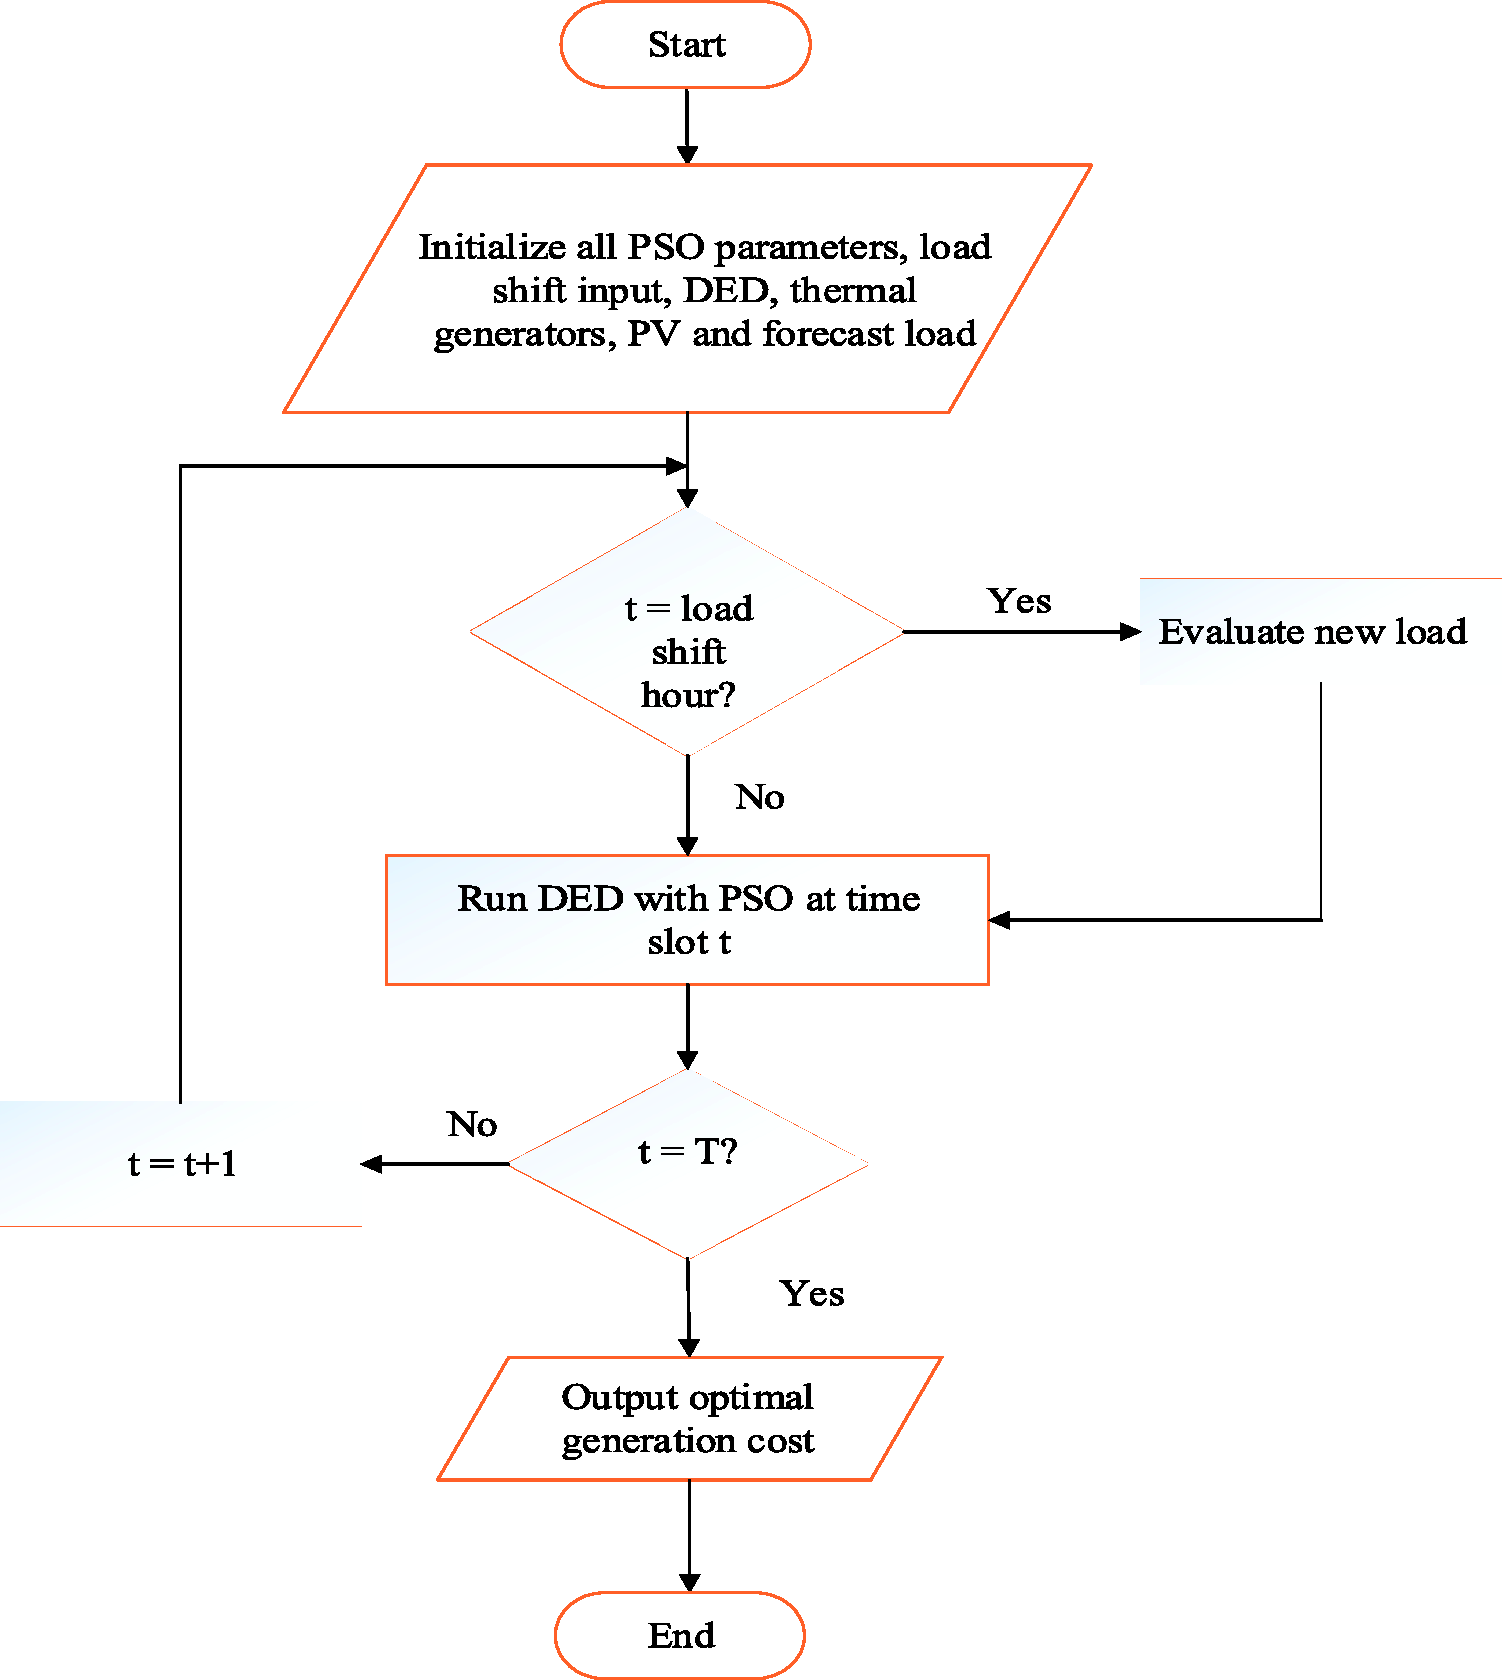
Flowchart of the generation cost optimization model.
Test systems
A six-thermal generation unit test system was considered in this simulation study. The characteristics (see Table S1 in Supplementary material) and the transmission loss coefficient
Solar data and solar PV considerations
The solar resource under consideration was based on two years of ground-measured data from Wa, Ghana. Figure 3 shows the hourly solar irradiation in Wa, Ghana (under average, abundant and scarce solar resource conditions). Additionally, this study considered increasing penetrations of solar PV from 0 to 30% (in steps of 10%). The solar penetration levels were estimated as percentages of the peak load demand of the LP2. The solar PV sizing considerations and parameters are reported in Table S2 (see Supplementary material). Additionally, the solar PV cost data taken from Ramabhotla et al. (2016) are presented in Table S3 (see Supplementary material). However, the cost of solar power adopted from Ramabhotla et al. (2016) was scaled down by a factor of 10 due to the low cost coefficients for the six thermal generation unit system.
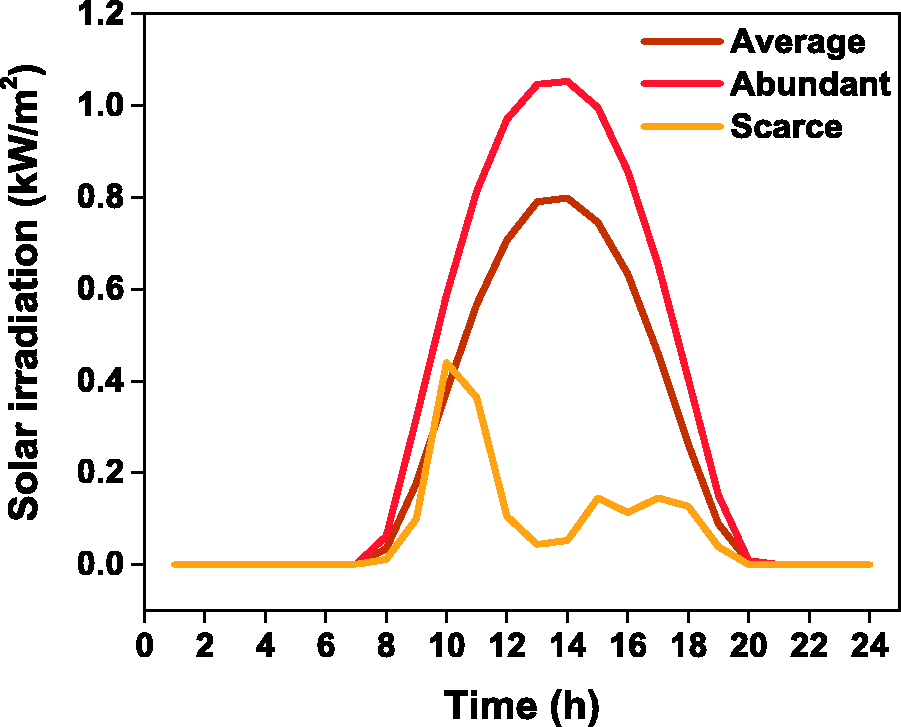
Hourly solar irradiation in Wa, Ghana. Location coordinates: 10°1’N and 2°5’W (source: Wa-Polytechnic Weather Station, Ghana).
Solar-load correlation coefficients and p values
In this study, the alignment between peak solar power generation and the various LPs was measured by the solar-load correlation coefficients. Thus, Table 1 shows the results for the solar-load correlation coefficients and p values of the various LPs obtained via statistical analyses of the average, abundant, and scarce solar conditions. The results of the two-tailed statistical tests conducted at p = 0.05 and 0.01 showed that all the correlation coefficients for LP1, LP2, and LP3 were significant (p = 0.01). Likewise, the correlation coefficients for LP4 were significant under both average and abundant solar conditions. However, under the scarce solar condition, the correlation coefficient was not significant (p = 0.05 and 0.01).
The results of two-tailed tests showing the solar-load correlation coefficients and p values of the various load profiles (LPs) under average, abundant, and scarce solar resource conditions.
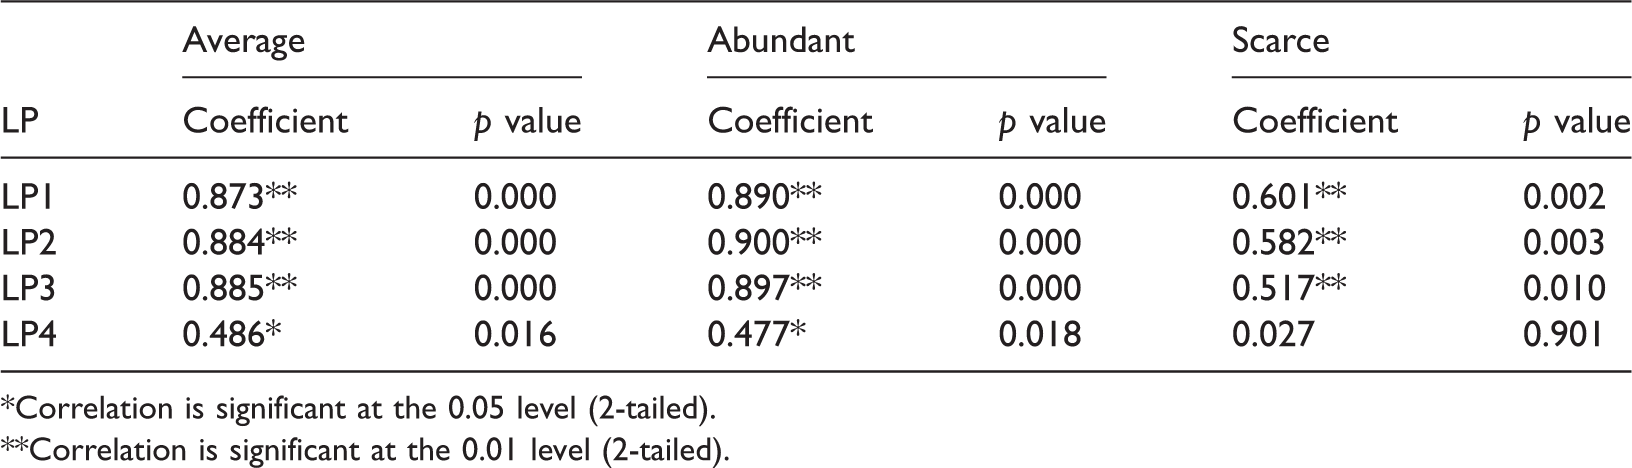
*Correlation is significant at the 0.05 level (2-tailed).
**Correlation is significant at the 0.01 level (2-tailed).
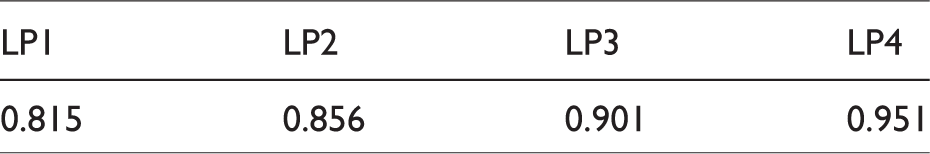
Load factors
The flatness of the LPs was measured according to the LFs using equation (21) (Surai and Surapatana, 2014). Thus, Table 2 presents the estimated LFs of the LPs

Load factors of the load profiles (LPs).
Validation test
The effectiveness of the optimization algorithm was validated using the 24-h LP shown in Table S4 (see Supplementary material) adopted from Lokeshgupta and Sivasubramani (2018) for the thermal generation system. The fuel cost/day result of the 24-h DED (without solar PV) was $13,630.07/day, which is comparable to the value of $13,555/day used in Lokeshgupta and Sivasubramani (2018). The thermal generation units’ optimal 24-h DED using PSO is presented in Table S5 (see Supplementary material).
Results and discussion
Generation cost optimization under 0 to 30% solar penetration
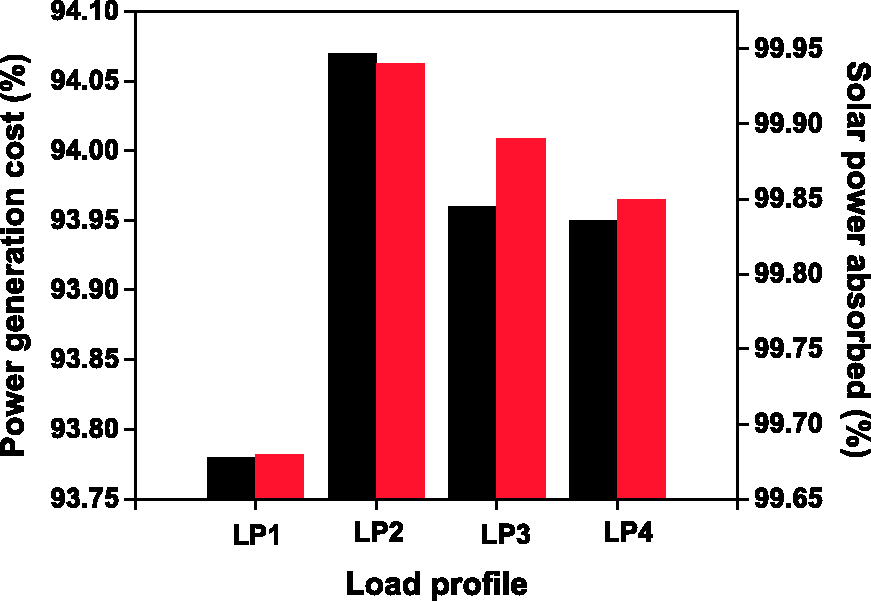
Figure 4 shows the power generation costs of the 24-h DED of the various LPs. The results are presented as percentages of a base case (i.e., LP2) when there was no solar PV included in the DED. This figure shows that the generation costs decreased with increasing solar penetration. The generation costs further decreased with the abundance of solar resources. The reduction in costs of power generation with increasing solar penetration and abundance can be attributed to the high solar absorption capability of the LPs, as shown in Figure 5 (results of solar power absorptions, which were estimated as percentages of the total solar power generated). Thus, as solar penetration increased, more solar power was absorbed in the various LPs to reduce generation costs by displacing thermal generators with marginally higher generation costs (Brouwer et al., 2014).
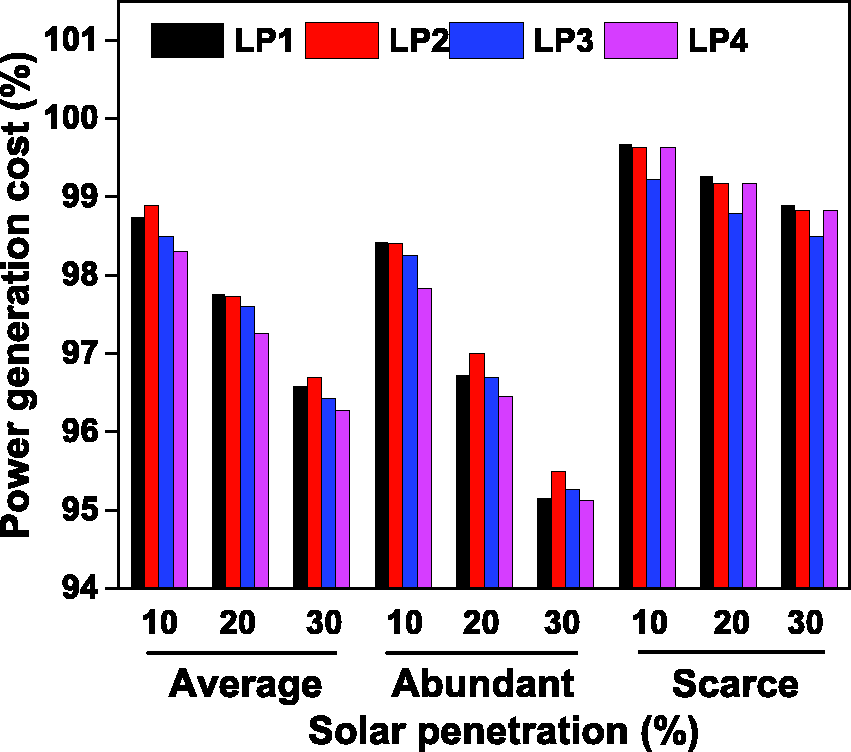
Power generation costs of the 24-h DED of the various load profiles (LPs) under the average, abundant, and scarce solar resource conditions.
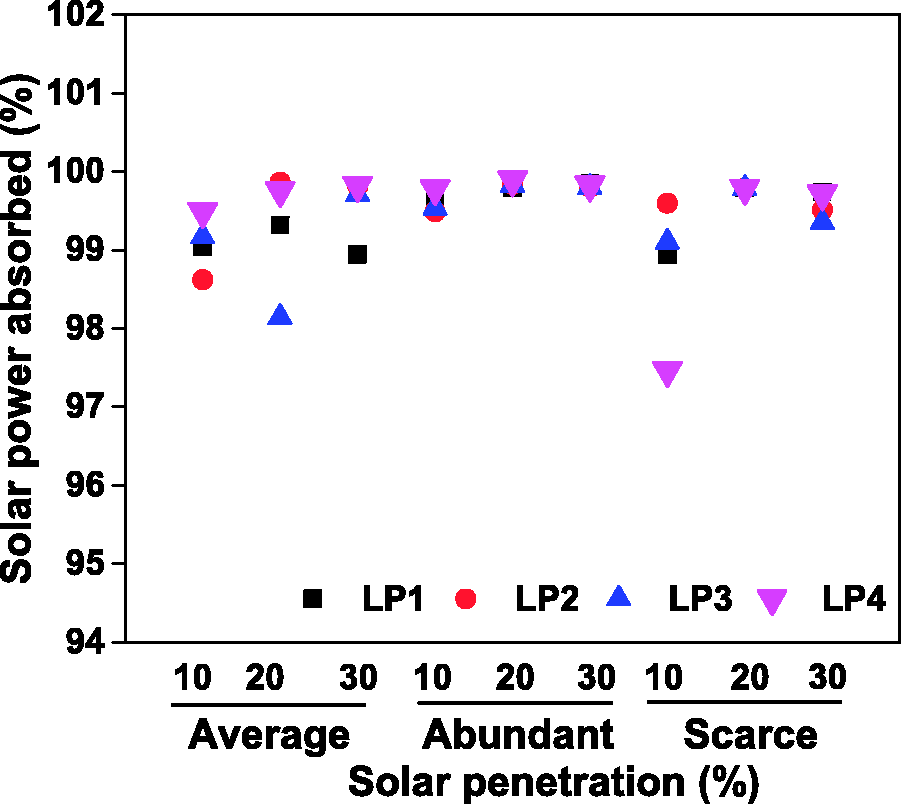
Solar power absorption in the 24-h DED of the load profiles (LPs) under the average, abundant, and scarce solar resource conditions.
In the average and abundant solar resource conditions, the generation costs increased from LP1 to LP2 but decreased from LP3 to LP4. Moreover, LP2 and LP4 exhibited the worst and best cost performances in most cases, respectively, under the abundant and average solar conditions. The increase in generation costs from LP1 to LP2 can be related to the slightly higher positive solar-load correlation coefficients of LP2 than those of LP1 in both the average and abundant solar conditions (Table 1). Therefore, under the scarce solar condition in which the correlation coefficient of LP2 was slightly lower than that of LP1, the generation costs slightly decreased from LP1 to LP2. However, the observed reduction in generation costs from LP3 to LP4 under the average and abundant solar conditions could be related to the slightly higher LF of LP4 than that of LP3 (Table 2).
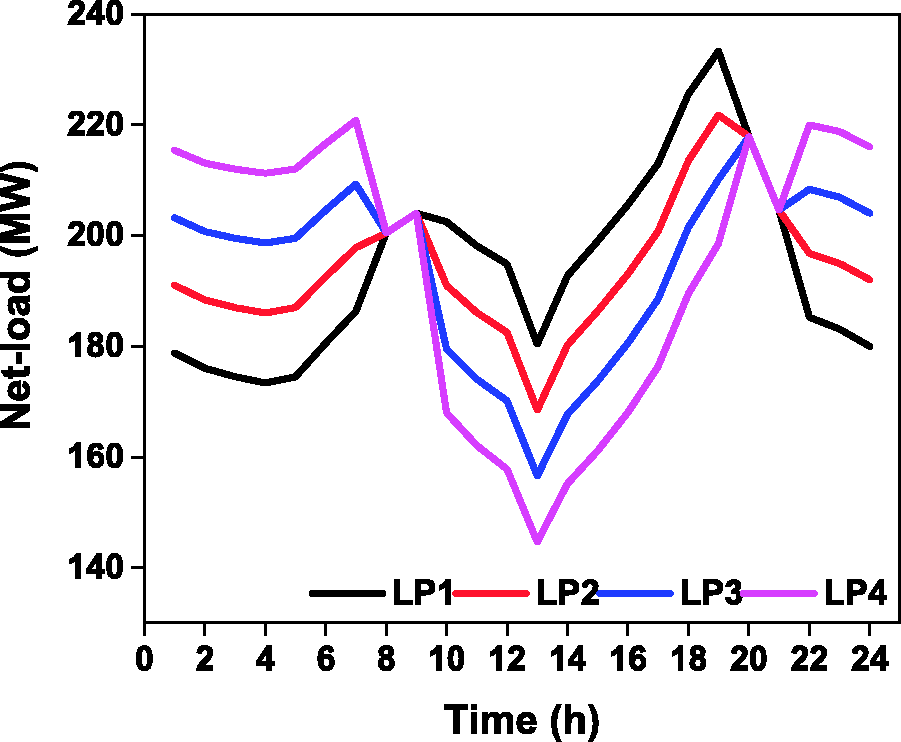
Figure 6(a–d) illustrates the output power curves of the generation units in the 24-h DED at 10% solar penetration under the abundant solar condition for LP1–LP4, respectively. These figures show that the output power curves of the thermal generation units in LP3 and LP4 were more stable than those in LP1 and LP2. This stability could be related to the higher LFs in LP3 and LP4 than those in LP1 and LP2. Subsequently, the lesser ramping of the dispatchable generation units due to the relatively stable operation of the generation units is attributable to the lowest generation cost exhibited by LP4. In addition, the absorption of solar power could further improve the flatness of LP4 compared with that of the other LPs and could contribute to the best generation costs observed in LP4. This improvement is demonstrated using the net-load concept (Chaiamarit and Nuchprayoon, 2014), as shown in Figure 7. The result that LP4 exhibited the lowest generation costs at low solar penetration was in agreement with the results of several studies indicating that LP flattening improves the generation costs (Javaid et al., 2017; Surai and Surapatana, 2014; Yao et al., 2016). LP1 and LP2, which exhibited higher generation costs than LP3 and LP4, could be associated with additional ramping up of their thermal generation units to meet the higher peak loads (Figure 6(a, b)). This ramping up has an adverse impact on the generation costs (Brouwer et al., 2014; Paterakis et al., 2017). These results suggested that under low solar penetration conditions, increasing the LF of LPs can improve the generation cost, whereas increasing the positive solar-load correlation coefficients of LPs could worsen the generation cost. However, under the scarce solar condition, LP3, which had a lower LF than LP4, exhibited the lowest generation costs in all the scenarios. This inconsistency could be associated with the irregular shape of the scarce solar condition compared to the bell shapes of the abundant and average solar conditions (Figure 3).
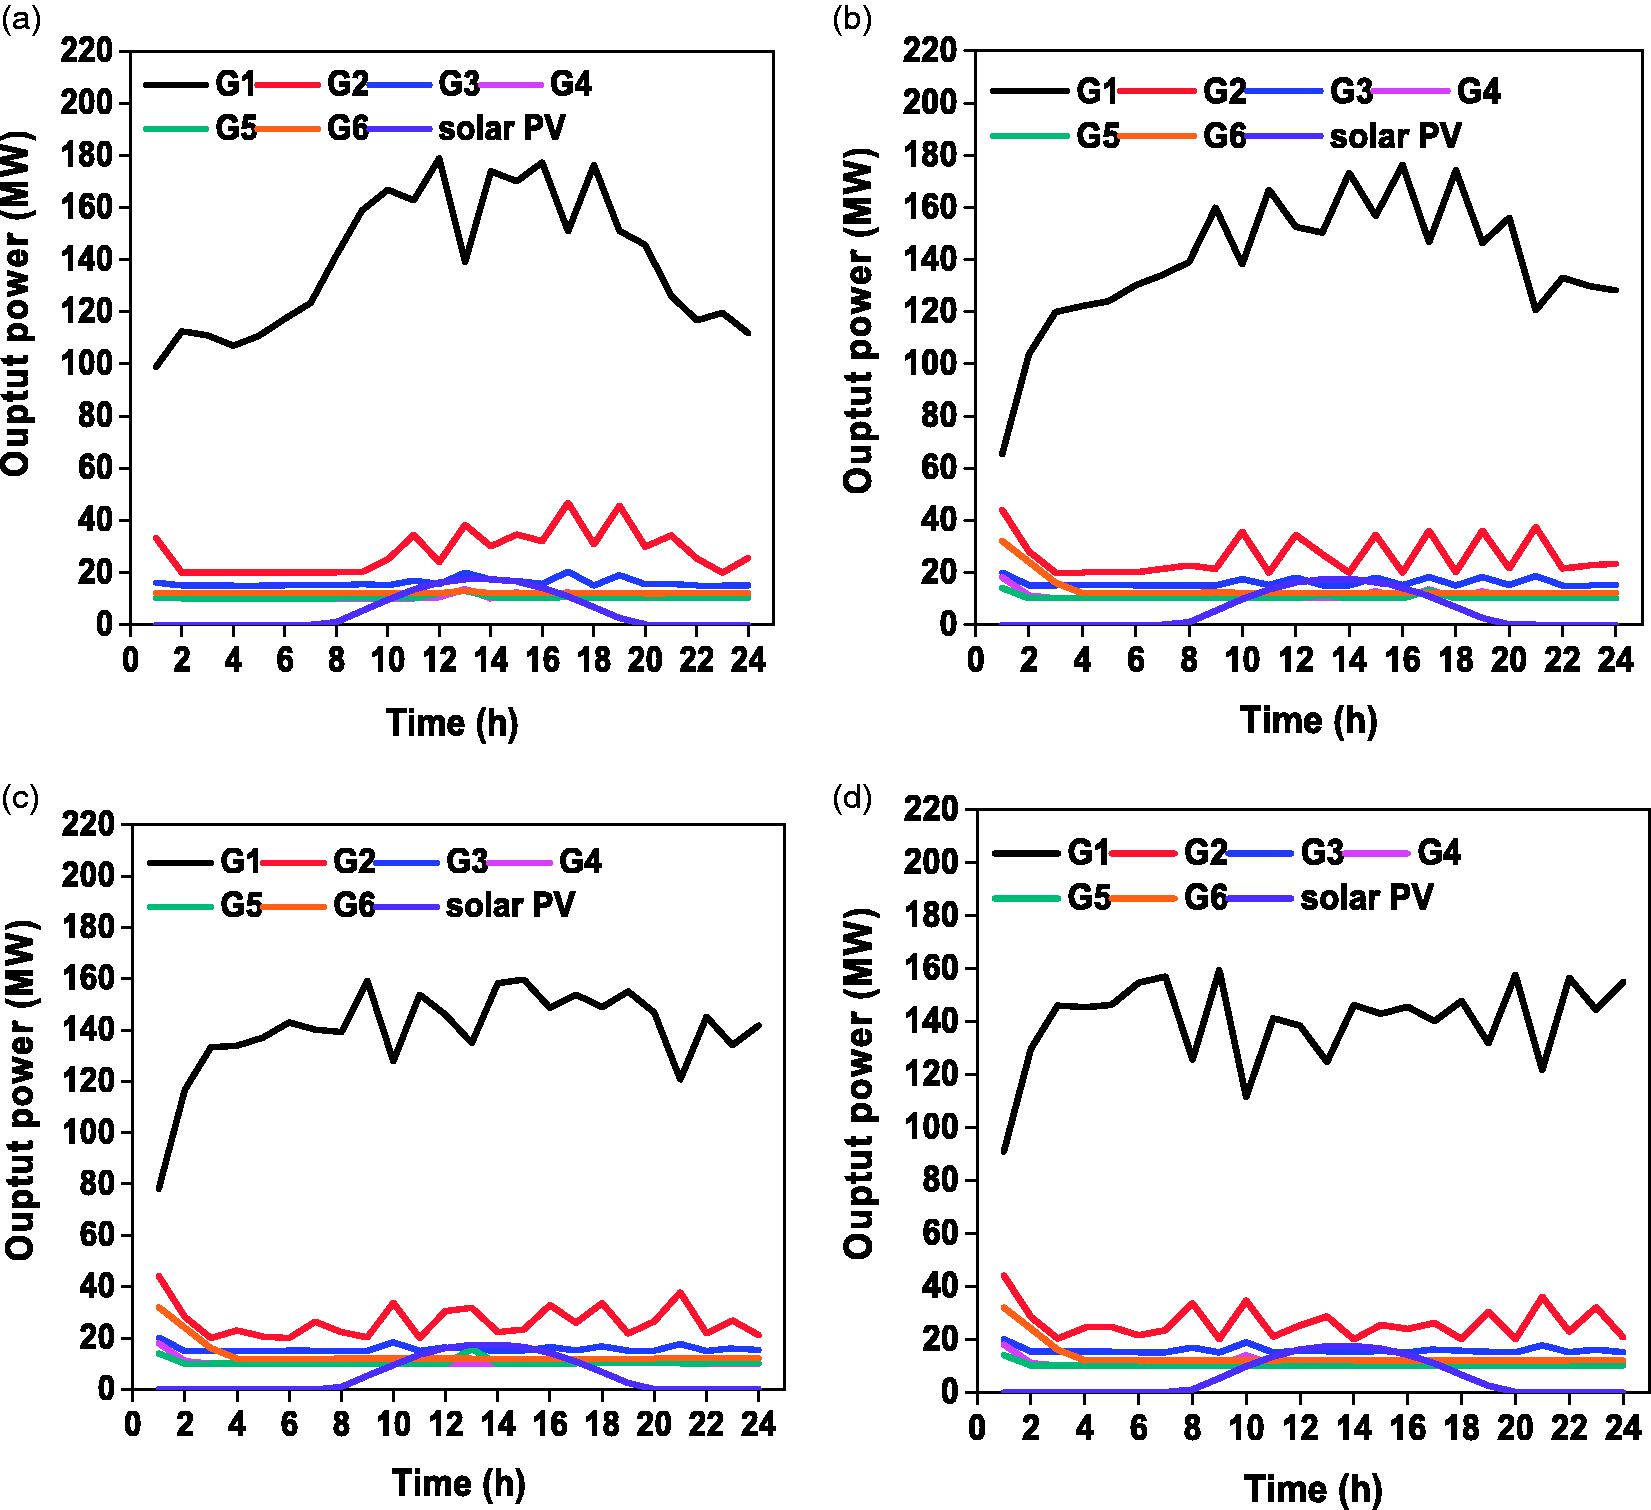
Output power curves of the generation units in the optimal 24-h DED in various load profiles (a) LP1, (b) LP2, (c) LP3, and (d) LP4 at 10% solar penetration under the abundant solar resource condition (where G is the thermal generation unit).
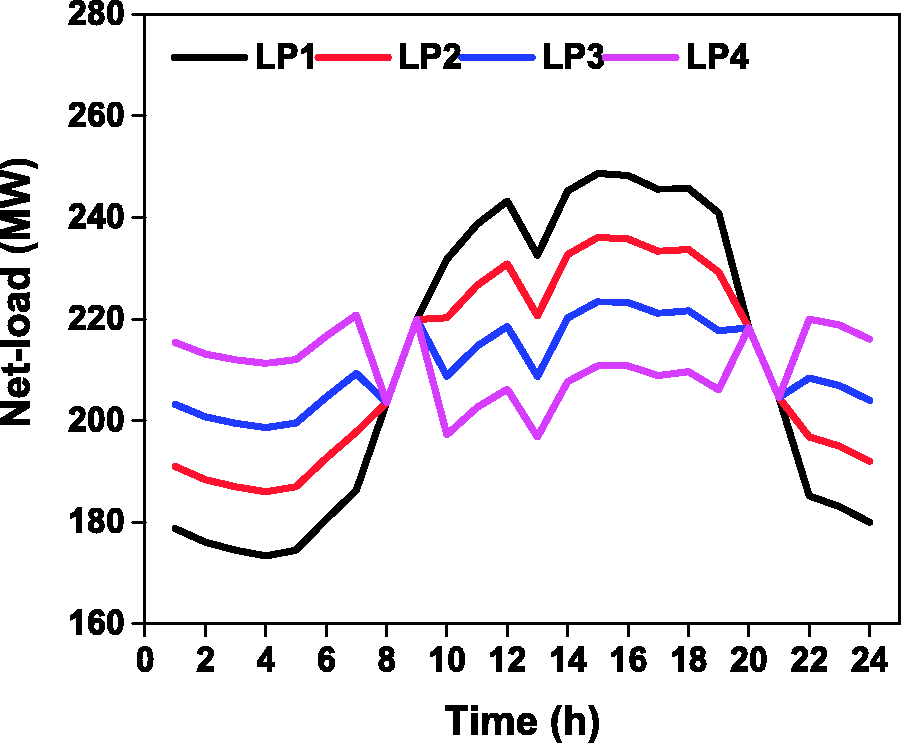
Net-load curves of various load profiles (LPs) at 10% solar penetration under the abundant solar resource condition.
Under the 10% penetration and abundant solar conditions, the generation costs were virtually the same for both LP1 and LP2, which were both higher than those of LP3 and LP4. As solar penetration increased to 30%, however, the generation cost of LP1 decreased considerably, to virtually the same level as that of LP4. Specifically, the cost gap between LP1 and LP4 significantly decreased from 0.6% to 0.04%. This close generation cost gap between LP1 and LP4 could be related to the further ramping down of the main load-following generation unit (G1) as the solar penetration increased in LP4 (Figure 8(d)).
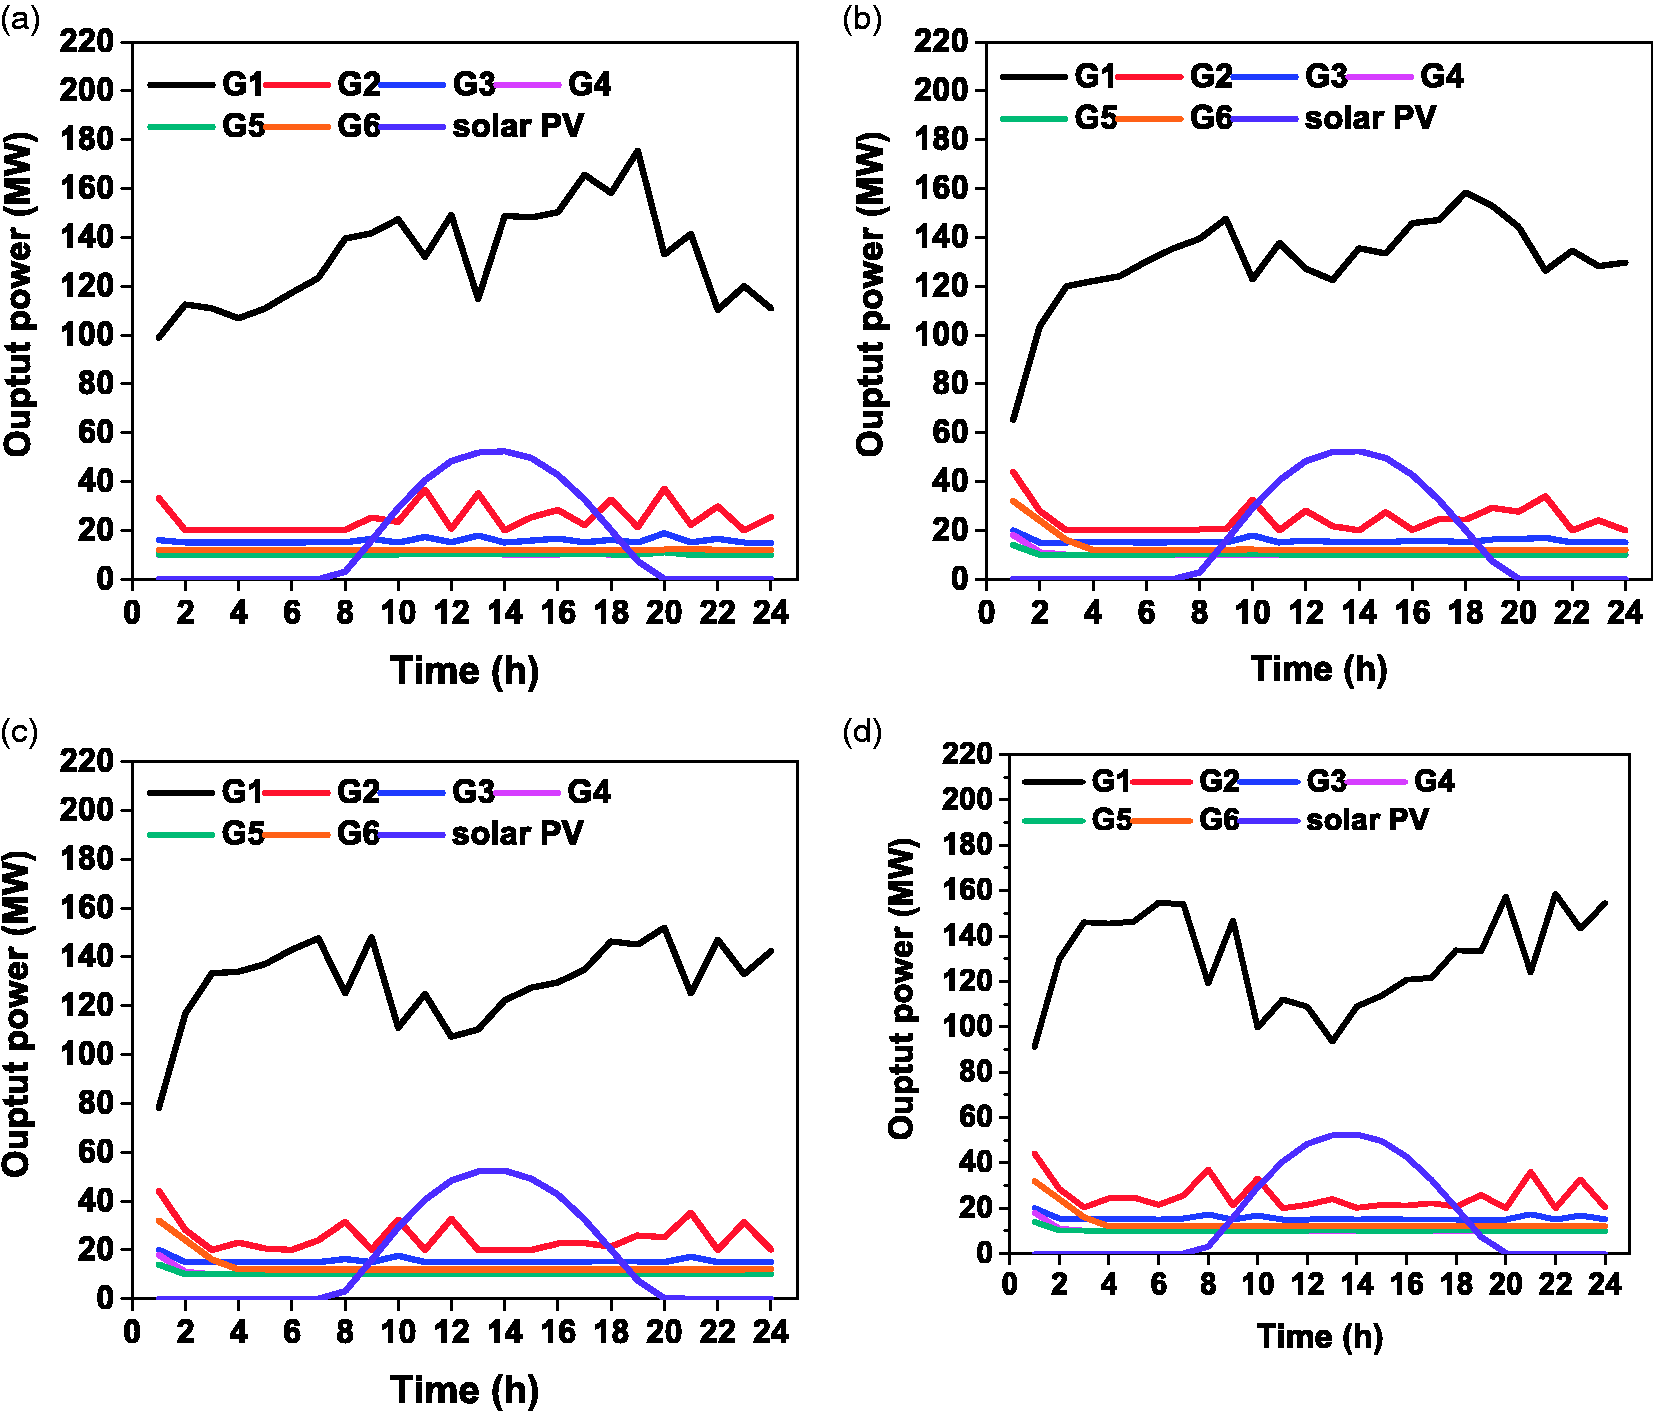
Output power curves of the generation units in the optimal 24-h DED in various load profiles (a) LP1, (b) LP2, (c) LP3, and (d) LP4 at 30% solar penetration under the abundant solar resource conditions (where G is the thermal generation unit).
Generation cost optimization under further (40%) solar penetration
The solar penetration level under the abundant solar condition was further increased to 40%. This increment was used to analyze the generation cost performance of the various LPs as solar penetration increased. Thus, Figure 9 shows the results of the power generation costs and solar power absorptions in the LPs at 40% solar penetration.
Power generation costs and solar power absorption in the 24-h DED of the load profiles (LP) at 40% solar penetration under the abundant solar resource condition.
The results of the power generation costs shown in Figure 9 were found to be similar to those shown in Figure 4, which presented results for the range of 10% to 30%. Both figures show that the rate of reduction in the generation cost of LP1 was faster than those of the other LPs. This trend continued and resulted in LP1 exhibiting the best generation cost among all the LPs. Moreover, Figure 10(a–d) shows the output power curves of the generation units in the 24-h DED at 40% solar penetration under abundant solar conditions for LP1 to LP4. These figures show that G1 in both LP3 and LP4 was further ramped down compared to that in LP1 and LP2 during the high solar generation period. According to Liu et al. (2010), the absorption of solar power depends on the ability of dispatchable generation units to reduce their power outputs during low-load periods. Thus, LP3 and LP4 required more downward adjustment of the thermal generation units due to their lower daytime loads than those of LP1 and LP2 during the high solar generation period. The ramping-down process for G1 was observed to be deeper in LP4 than in the other LPs to absorb the solar power. Consequently, further ramping up was also required in G1 to balance the load in LP4 compared to that required in the other LPs as solar power production declined.
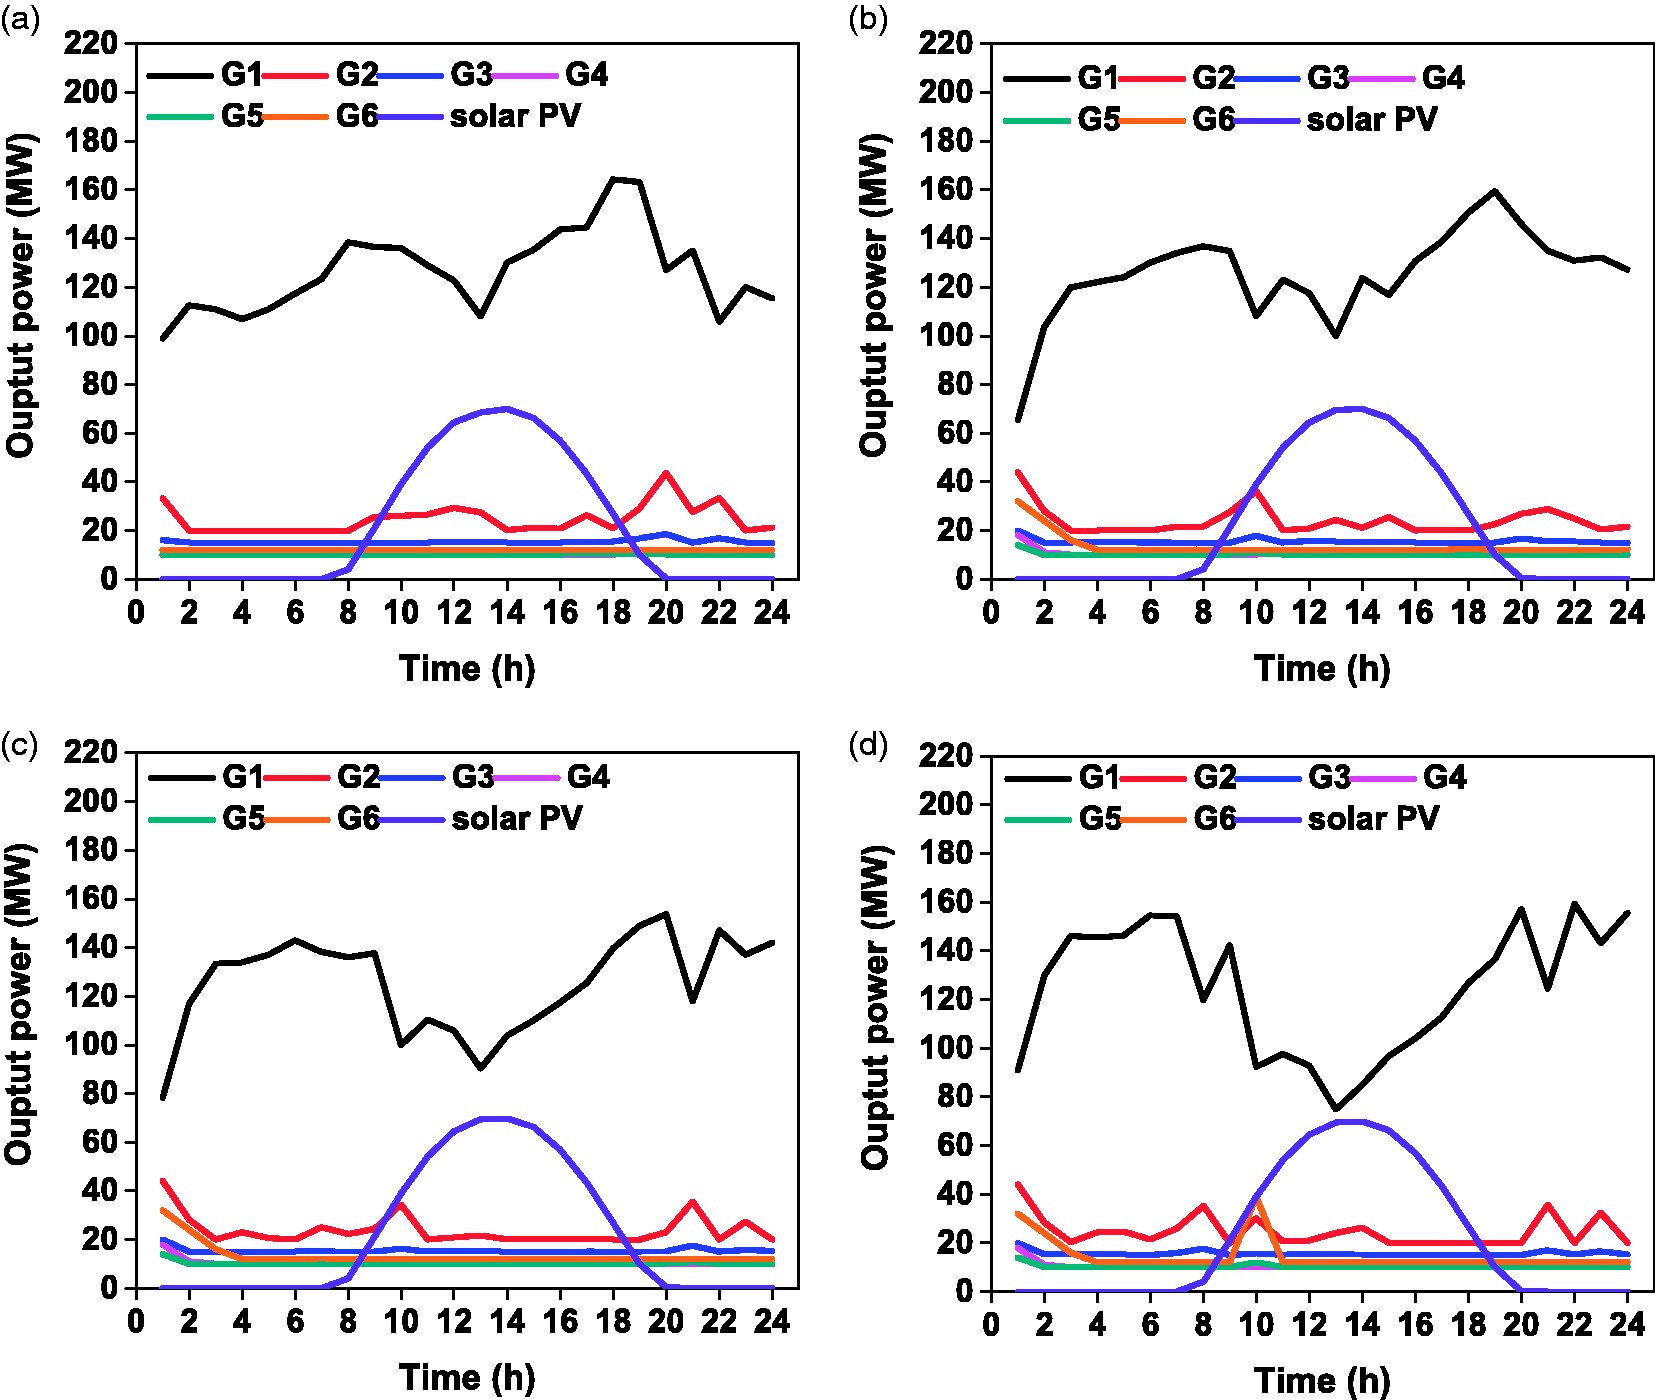
Output power curves of the generation units in the optimal 24-h DED in various load profiles (a) LP1, (b) LP2, (c) LP3, and (d) LP4 at 40% solar penetration under the abundant solar resource condition (where G is the thermal generation unit).
The fast ramping of generation units negatively affected the marginal generation cost (Goop et al., 2017). According to Rose et al. (2016), the cycling costs that arose under high solar penetration countered the cost reduction benefits accrued from the initial solar penetration. Therefore, the shift of the best generation cost performance from LP4 to LP1 as solar penetration increased to 40% could have been a consequence of further ramping in LP4 than in the other LPs.
On the other hand, Figure 10(a, b) shows that due to the high load in the daytime for LP1 and LP2 during the peak solar hours, there were fewer ramping-down processes in the generation units to absorb the high solar power generated. Thus, the differences in the ramping requirements of the various LPs were likely the reasons why LP1 exhibited a better generation cost than LP4 as solar power penetration increased to 40% (Wu et al., 2015). The result of the lower generation cost of LP1 than that of LP4 under the highest solar penetration condition of the abundant solar resource agreed with the results of other research studies advocating for LPs with daytime peak loads aligning with peak solar power production (Fezai and Belhadj, 2016; Liu et al., 2010; Rose et al., 2016; Stodola and Modi, 2009).
However, the generation cost performance of LP1 was greater than that of LP2, probably due to the higher daytime peak loads than those of LP2. Subsequently, these loads could have reduced the downward adjustment to compensate for the high daytime-generated solar power. The output power of G1 was lower in LP2 than in LP1 during the high solar generation periods (i.e., 12–15 h; Figure 10). The net-load curves also supported this observation, as it can also be confirmed from Figure 11 that LP2 exhibited deeper valleys than did LP1 during the high solar generation period.
Net-load curves of various load profiles (LPs) at 40% solar penetration under the abundant solar resource condition.
Moreover, the worst generation cost was exhibited by LP2, which had the highest positive solar-load correlation coefficient among the various LPs, and could be due to a number of reasons. First, solar absorption could shift the load peak to other periods when solar penetration diminishes (Helman, 2017; Johnson et al., 2017). Thus, although this profile also showed the highest solar power absorption (Figure 9), the worst generation cost performance of LP2 could be attributed to the possible shift in the initial load peak to the evening hours. The higher solar energy absorbed in LP2 than in the other LPs could has resulted in higher evening peak loads. Consequently, the further ramping required may have adversely affected the generation cost. It can therefore be observed that when the solar generation diminished (19 h) in both LP1 and LP2, the output power of G1 was higher than that in LP3 and LP4. The net-load curves in Figure 11 also agreed with this inference of possible higher evening load peaks in LP1 and LP2 than in LP3 and LP4. Second, unlike LP1, which could have reserved some flexibility during the high solar generation period, the further ramping down of generation units in LP2 might have limited the available ramping capability to meet the high evening peak loads. Consequently, this ramping down further contributed to the worst generation cost exhibited by LP2.
The best and worst generation cost performances associated with LP1 and LP2 under the 40% abundant solar penetration condition suggested that a high positive solar-load correlation could favor generation cost reduction under high solar penetration conditions. However, this result also suggested that a very high positive solar-load correlation coefficient may not effectively reduce the generation costs, even at high levels of solar penetration. Moreover, the results obtained at 10% and 40% penetration under the abundant solar conditions suggested that ramping up could be a limitation on the LPs with high positive solar-load correlation under low solar penetration conditions. On the other hand, ramping down could also be a limitation of the LPs with high LFs under high solar penetration. Although Janko et al. (2016) demonstrated that ramping requirements in dispatchable generation units increased with increases in solar PV penetration, the results of this study at 40% solar penetration in LP1 agreed with those of Liu et al. (2010). This agreement indicates that the synergy between solar power production and load could result in the complementation of dispatchable generation units and solar PV to follow variations in load. This synergy could reduce ramping requirements in generation units at high solar penetration levels. The results for LP1 under high solar penetration conditions are also consistent with those of other studies, showing that large-scale solar power systems can provide load-following and ramping services in power systems (Helman, 2017). Moreover, changes were observed in the generation cost performance of the LPs as the solar penetration increased from 10% to 40%. This result was consistent with the findings of Chaiamarit and Nuchprayoon (2014), who reported that high solar penetrations significantly change the original load characteristics.
Conclusions
In this simulation study, optimization of the power generation costs of an evolving LP in a solar PV-integrated power system was investigated. The generation cost was modeled as a single-objective DED with a PSO method on a MATLAB platform. The results revealed that the generation costs of the LP with the highest LF were the lowest among the various LPs in most cases. However, as solar power penetration increased, a LP with a higher positive solar-load correlation coefficient evolved to be the most cost-effective. The LP with the highest positive solar-load correlation coefficient maintained the worst generation costs under both high and low solar penetration conditions in most cases. The outcomes of this study suggest that LP flattening and improving peak loads to align with peak solar power production will potentially improve the generation costs of solar-integrated power systems at low and high solar penetration levels, respectively. However, LPs with very high positive solar-load correlation coefficients may not effectively reduce generation costs, even under high solar penetration conditions. This study could provide relevant information to the power industry for load planning in solar PV-integrated power systems. Future research directions of this study will consider consumer LPs and multiple variable RE sources spatially distributed over a wide geographical area. Additionally, other cost components of RE-integrated systems such as that of storing excess RE will be factored into the economic analyses of the power generation cost in further research studies.
Supplemental Material
Supplemental material for Optimization of the cost of power generation of an evolving load profile in a solar photovoltaic-integrated power system
Supplemental Material for Optimization of the cost of power generation of an evolving load profile in a solar photovoltaic-integrated power system by Stephen Afonaa-Mensah, Qian Wang and Benjamin Bernard Uzoejinwa in Energy Exploration & Exploitation
Footnotes
Declaration of conflicting interests
The author(s) declared no potential conflicts of interest with respect to the research, authorship, and/or publication of this article.
Funding
The author(s) disclosed receipt of the following financial support for the research, authorship, and/or publication of this article: The National Science Foundation of China (Grant No. 51876083).
Supplemental material
Supplemental material for this article is available online.
References
Supplementary Material
Please find the following supplemental material available below.
For Open Access articles published under a Creative Commons License, all supplemental material carries the same license as the article it is associated with.
For non-Open Access articles published, all supplemental material carries a non-exclusive license, and permission requests for re-use of supplemental material or any part of supplemental material shall be sent directly to the copyright owner as specified in the copyright notice associated with the article.