
Abstract
Thermochemical conversion of biomass is an encouraging way for the production of syngas. In the present research, four different biomass materials were used for gasification which includes rice husk, cotton stalks, sugarcane bagasse, and sawdust. These biomass sources were selected because they are common Pakistani feedstocks. Gasification of selected biomasses was performed using concentric tube entrained flow gasifier. Three-dimensional computational fluid dynamics model was used to investigate the impacts of kinetic rate and diffusion rate on the gasification performance. The Euler–Lagrange method was used for the development of entrained flow biomass gasifier using commercial computational fluid dynamics code ANSYS FLUENT®14. Discrete phase model was used to predict the movement of particles, whereas the gas phase was treated as the continuous phase with a standard k–ε turbulent model to predict the behavior of gas phase flow. Finite rate/Eddy dissipation model was applied for the calculation of homogenous and heterogeneous reaction rates. Oxygen was used as a gasifying agent. Cotton stalks and sugarcane bagasse produced higher mole fractions of hydrogen (H2) and carbon monoxide (CO) than sawdust and rice husk. Regarding carbon conversion efficiency, cold gas efficiency, and higher heating value cotton stalks and sugarcane bagasse produced better syngas quality as compared to sawdust and rice husk. The oxygen/fuel (O/F) ratio is a key operating parameter in the field of gasification and combustion. The O/F ratio above 0.42 favored combustion reactions and increased mole fraction of water vapor (H2O) and carbon dioxide (CO2) in syngas composition, whereas gasification reactions dominated below 0.42 O/F ratio, resulting increased mole fraction of H2 and CO in syngas composition.
Keywords
Introduction
Fossil fuels have remained a major source of primary energy in the world since the last few decades. According to the estimations, the oil and natural gas resources will end up in the coming 40–50 years (Zou et al., 2016). However, coal reserves are higher than oil and gas and will last over in more than 100 years. Moreover, the utilization of coal for energy production has caused serious environmental and health problems such as emissions of carbon dioxide, SOx, and NOx. Due to environmental problems associated with coal consumption, it has become important to develop a method to utilize coal more cleanly. Besides coal, biomass could be used for energy production (Chen and Wu, 2009; Chmielniak and Sciazko, 2003).
Biomass accounts for approximately 11% of the world’s total primary energy supply (Proskurina et al., 2018). Recent assessments about energy generation from biomass indicate that at least 100 EJ could be available in 2050 (IRENA, 2017). There are promising projections for biomass use but, unfortunately, most of them have not been fulfilled up to this day. The conversion of biomass into different fuels is done through biochemical, thermochemical, and extraction processes (McKendry, 2002; Srirangan et al., 2012). For syngas production, the biomass gasification is performed in reactors commonly called gasifiers. Various factors including the design of gasifier and fuel properties significantly affect syngas quality (Tian et al., 2018). Important factors that affect product gas quality include particle size, moisture, temperature, pressure, equivalence ratio (ER), and gasifying medium (Guo et al., 2014; Pereira et al., 2012). Therefore, a deep understanding of all chemical and physical changes occurring during biomass gasification is important for the successful operation of the gasification plant (Anukam et al., 2016).
Entrained flow gasifiers (EFG) are widely used because of short residence time and high carbon conversion efficiencies (Zheng and Furinsky, 2005). Entrained-flow gasifiers having opposite multi burners (OMB) provide greater collision rates between solid particles and better fuel conversion efficiencies (Li et al., 2012; Ni et al., 2009; Unar et al., 2014). Presently concentric tube entrained flow gasifiers (CT-EFG) are focused by researchers and considered good in performance due to the vigorous mixing of feedstock and an oxidizing agent. The syngas produced through thermochemical conversion processes is a more versatile fuel than biomass. Syngas can be used for various applications such as for electricity, hydrogen, and heat generation (Pereira et al., 2012). The main components of syngas obtained through the gasification of biomass are CO and H2 (Chen et al., 2007; Pettinau et al., 2012). The research has proved that the syngas quality is highly dependent on the feedstock composition (Akubo et al., 2018; Samiran et al., 2016), however scant literature is available on the gasification characteristics for Pakistani biomass. Moreover, no literature is available for the parametric investigations of Pakistani biomass gasification using a CT-EFG.
Hence the objective of this study was to investigate the behavior of gasification process using different Pakistani feedstocks at varying oxygen/fuel ratios and its effect on the syngas quality regarding gas yield, carbon conversion efficiency (CCE), and cold gas efficiency (CGE).
Numerical method
Development of CFD model
The CFD modeling started with the development of the computational domain, i.e. the geometry of the CT-EFG. After the development of the computational domain, the appropriate governing equations were selected for predicting the gasification processes within the developed computational domain.
Computational domain
Gasification using waste biomasses in a CT-EFG was examined. Figure 1 shows the geometry of a CT-EFG. Figure 2 shows the mesh structure. Some minor changes were done in the geometry of an entrained-flow gasifier developed by Chen et al. (2013). The geometry was developed in Ansys Design Modeler®14, and the meshing was done in Ansys Meshing®14. The geometry of a gasifier is a cylindrical entrained-flow gasifier (Shen et al., 2012). Biomass as a feedstock and oxygen as a gasifying medium was fed from the top of the gasifier as shown in Figure 1. The biomass is fed to the gasifier from the central tube whereas the oxygen was injected through an outer ring which is concentric with the inner tube. The mesh density was taken as 77,410 cells. This grid was found independent after several cold flow simulations on various meshes.
The geometry of entrained flow gasifier.
Computational domain of CT-EFG and mesh.
Governing equations and assumptions
In the gasifier, the main processes involved include heat transfer, mass transfer, homogenous, and heterogeneous chemical reactions. Some hypothesis was made to make the physical problems more tractable during simulation study. The hypothesis adopted include.
The flow field was assumed as incompressible, turbulent, axisymmetric, and steady flow. Nitrogen (N2) species was considered an inert species and did not participated in any reaction whereas, (S) from the biomass source only assumed to produce SO2 during volatile combustion reactions (equations 26–29). Furthermore, the formation of another air pollutants like COS, CS2, HCN, NH3, H2S during the gasification process was ignored. In the gasifier, thermal radiations and flow forces are omitted. The walls of the entrained-flow gasifier are considered as adiabatic. In syngas composition, the primary components are CO and H2 and the contribution of CH4 in heating value of syngas is usually negligible hence methane formation is not included in present simulations. Entrained flow gasifiers produce tar-free syngas, hence tar formation is not taken in considerations. The slagging problem at high temperatures in the gasifier is closely related to the concentrations of K, Cl, and S in biomass. In entrained flow gasifier, organic matter of biomass is gasified and the inorganic matter (ash) melts to form slag. Ash melting and formation of slag is a complex phenomenon so ash and its related melting/slagging is not incorporated in the model.
Navier–Stokes steady state and time-averaged, energy equations were solved along with the standard k–ε turbulence model (Chen et al., 2013). All the governing equations (equation (1–9)) with constant used during solution are mentioned in Table 1. The values of the constants used in equations (equation (5)), (equation (6)), and (equation (7)) are given in Table 2.
Governing equations.
Turbulence equations’ constants.
Chemical reactions
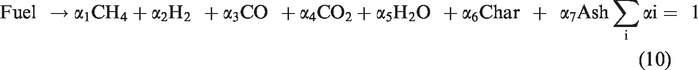
The decomposition of feed particles into volatiles, char, and ash at higher temperatures as given by reaction (equation (10)) (Wen and Chaung, 1979).
Devolatilization process dominates the raw material reactions at the initial stage of feed material (Du et al., 2007). In the devolatilization process, volatiles evolved are given by a two-step devolatilization model (Du and Chen, 2006). The two-step devolatilization model is given by reactions (equation (11)) and (equation (12)).
The devolatilization at low temperature is given by reaction (equation (11)).

whereas the devolatilization at high temperature is given by reaction (equation (12)).

Y represents the stoichiometric coefficient. The reaction (equation (11)) dominates at relatively lower temperatures, while reaction (equation (12)) dominates at higher temperatures. Therefore, volatiles reaction kinetics is given by equations (13), (14), and (15).
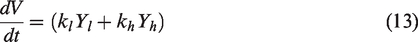
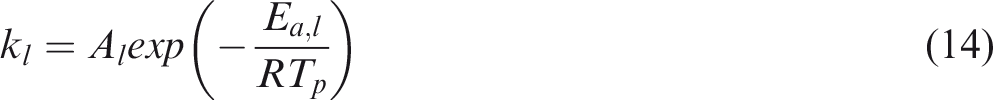
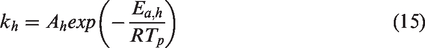
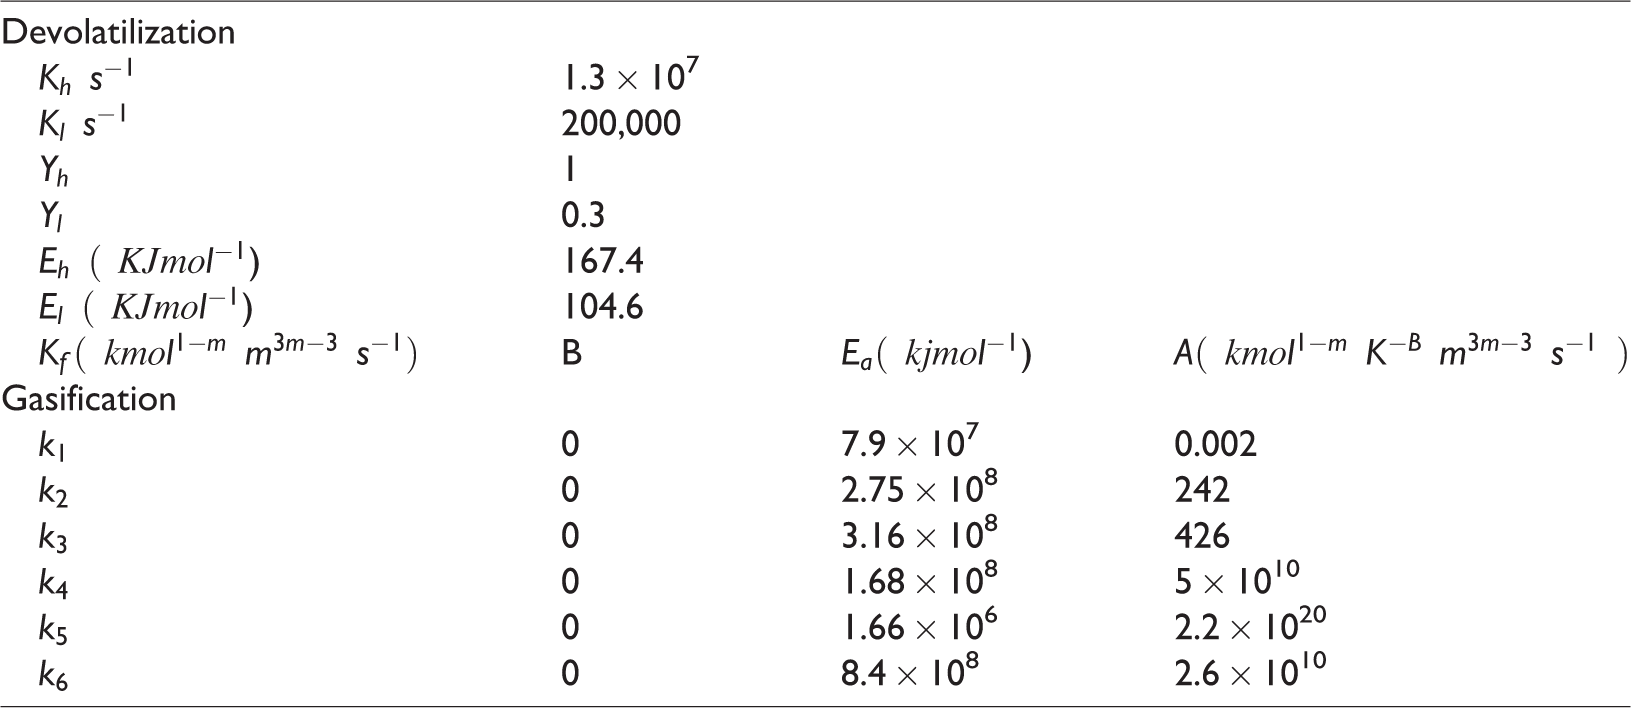
Here TP represents feed particle temperature; V shows the mass of fraction of volatiles; A shows the pre-exponential factor; k is reaction rate constant; Ea represents reactions activation energy. The
Reactions and their kinetic parameters (Chen et al., 2013).
The gasification of chars produced during devolatilization process is given by reactions (equation (16)), (equation (17)), and (equation (18)).


For gas phase chemical reaction, the relevant reactions are given by reactions (equation (19)), (equation (20)), and (equation (21)). (Jones and Lindstedt, 1988).


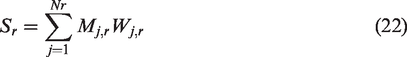
Regarding species equation, Sr represents the sum of reaction rates of different species and is given by equations (22), (23), and (24).
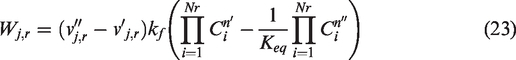

The kf is based on Arrhenius law; the forward reaction rate constant is developed in the equation (equation (24)). Here A is the pre-exponential factor, whereas B represents temperature exponent. The values of A and B for different reactions are given in Table 3.
Feedstock composition, operating parameters, and performance indicators
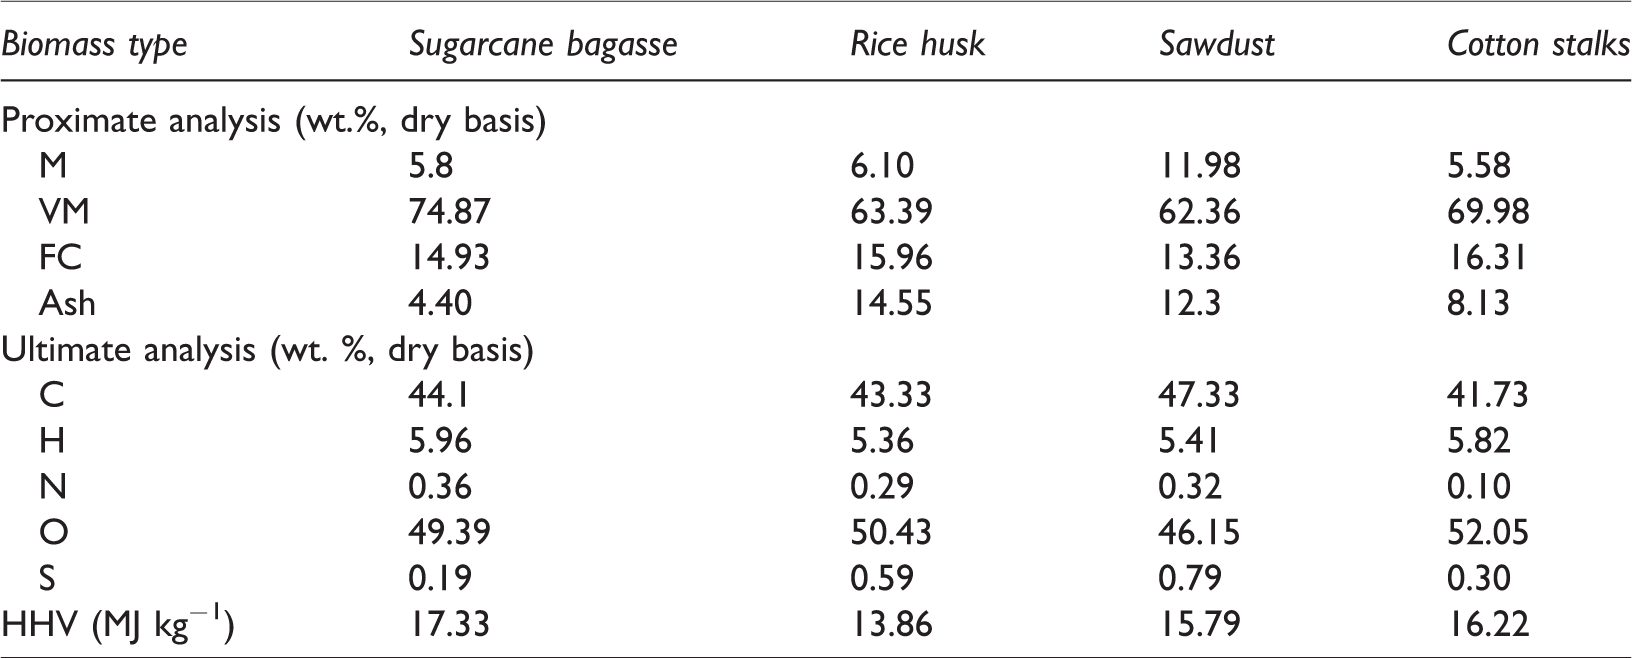
Feedstocks used in the gasifier include rice husk (RH), sawdust (SD), cotton stalks (CS), and sugarcane bagasse (SB). The proximate analyses of selected samples were performed using a TGA model SDT-Q600 as per standard method (ASTM D-7582–12). Samples were placed in a platinum pan, and the weight of the platinum pan was calibrated to the zero before sample filling. The filled platinum pan was loaded upon the reference cup of TGA model SDT-Q600 and the initial weight of the sample was recorded. The temperature was raised from ambient temperature to 900°C at a heating rate of 20°C min−1 under an oxygen atmosphere at a constant flow rate of 100 mL min−1. The elemental analyses were done as per ASTM D3176 method. The Vario MAX elementary analyzer was used for the calculation of percentages of sulfur, nitrogen, hydrogen, and carbon. Whereas, the percentage of oxygen was calculated by subtracting the percentages of hydrogen, sulfur, nitrogen, carbon, and ash from 100%. The higher heating values (HHV) of samples were determined from the elemental results by using Dulong’s formula. The composition obtained from experiments is tabulated in Table 4.
Proximate, ultimate, and calorific analyses results.
Two parameters, the ER, and the oxygen to fuel ratio (O/F) are very important for the efficient operation of any gasification process (Lv et al., 2004). Mathematically O/F ratio is given by equation (equation (25)).

The stoichiometric


For performance evaluation of a gasification plant, two parameters are important. One is the conversion efficiency, and other is quality of syngas. The conversion efficiency is also measured in different ways like CCE and CGE which are considered as important performance indicators. For the calculation of HHV, the standard correlation was used as per previous research by Gai and Dong (2012) and Unar et al. (2012)

In the present research, CH4 has not incorporated in the simulations so the value of
The CGE and CCE can be represented by equations (equation (31)) and (equation (32)) (Skodras et al., 2007)
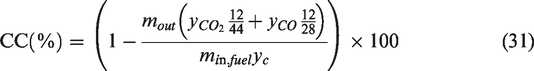

The CCE was calculated from the concentrations of CO and CO2 whereas the CGE was determined from the concentrations of H2 and CO respectively. The heating value of 286 KJ/mol (141.80 MJ/kg) for H2 (Council, 2004) and 283 KJ/mol (10.107 MJ/kg) for CO (Linstrom and Mallard, 2001) were used in the calculation of CGE (equation (31)).
Discrete phase model
A Eulerian–Lagrangian model was selected to inspect the behavior of fuel particles in the fluid. The Eulerian–Lagrangian approach considers hydrodynamic drag coupled with energy, mass, and momentum transport particles into the fluid and the inertia. Discrete phase model (DPM) was employed to investigate the behavior of fuel particles through the continuous phase of a fluid. In the DPM, the change in particle velocity as per equation (equation (33)).
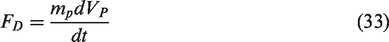
Particle velocity is represented by VP, whereas the drag force of the fluid on the particle is denoted by FD and the drag force is given in equation (equation (34)).
ρ shows the density of the fluid, Ap,c, is the cross-sectional area of the particle normal to the direction of flow, 
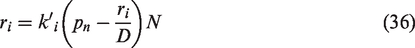
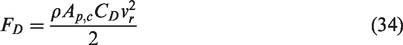
Here 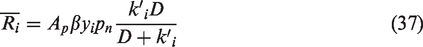
For zero-order reaction (N = 0), the consumption rate is given by equation (38).

Here (N = 0) shows solid depletion rate equal to the chemical reaction rate. When there is no reaction at the surface (N = 1). The decomposition rate of solid converts to the diffusion-controlled rate.
Boundary conditions
The feedstock at 290 K temperature was introduced into the CT-EFG from the central tube located at the top of the gasifier, the oxygen at 290 K was injected through an outer ring which is concentric with the inner tube in order to provide ease in transporting the feed particles. Feed particle size was kept in the range of 56–250 µm, whereas the average particle size of the feed was observed 113 µm. Such small particle sizes are needed because it is a requirement of entrained flow gasifiers. The feed particles sizes were determined through the Rosin–Rammler distribution function (Macı́as-Garcı́a et al., 2004). No mass and heat fluxes could cross through the system boundaries because of the design of axisymmetric centerline of the reactor. No slip conditions were taken into consideration because of the adiabatic wall of the reactor. The ANSYS FLUENT®14.0 software was used for the numerical study of biomass gasification phenomena. The SIMPLE algorithm was used for the solution of the governing equations and boundary conditions in these simulations. For the calculation of diffusion fluxes and convection, a first-order unwinds scheme was used.
Results and discussion
In this section, effect of varying O/F ratio on the behavior of gasification is covered. The quality of syngas production such as temperature, thermal efficiency, CGE, and CCE is discussed in detail. In this work, the oxidant–fuel ratio was maintained from 0.17 to 1.1 by changing the mass flow rate of biomass.
Temperature profile within the gasifier
Figure 3 shows the contours of temperatures at different sectional planes along the height of the gasifier. The highest temperature zone was observed near the inlet points of fuel and oxygen irrespective of the kind of biomass used for the gasification. This behavior of temperature contours is attributed to the mixing of biomass and oxidizer and is followed by the occurrence of the combustion reactions (equation (16)), (equation (19)), and (equation (20)). The decrease in temperature was observed along the downward direction of biomass gasifier due to proceedings of endothermic reactions (equation (17)) and (equation (18)). The maximum temperature in the reactor depends mainly on the type of fuel used for the gasification. The maximum temperature observed for the CS, RH, SB, and SD at 1.1 O/F ratios, was 2611.79 K, 2662.67 K, 2689.67 K, and 2569.27 K, respectively. Temperature contours obtained in this research are in similar ranges as per findings of previous researchers (Chen et al., 2013; Gao et al., 2016; Unar et al., 2014). The maximum temperatures of entrained flow gasifier usually come in the range of 1300–1500°C but in those cases, the walls of the entrained flow gasifiers are assumed to be cooled (usually via cool water). In simulations, this is usually performed by fixing the gasifier wall temperature at lower temperature levels. But several authors (Chen et al., 2013; Gao et al., 2016; Unar et al., 2014), performed simulations using entrained flow gasifiers and achieved temperatures above 2000 K. So these high temperatures seem normal. The maximum temperature was observed in SB, and the probable cause of this increased temperature is its highest heating value (17.33 MJ/kg) and higher amount of H (5.96) available in its ultimate analysis (Table 4). Similarly, the lowest temperature was observed in RH due to the lower amount of C and H in its ultimate analysis and lower heating value.
(a)–(d) Temperature contours of CS, RH, SB, and SD samples.
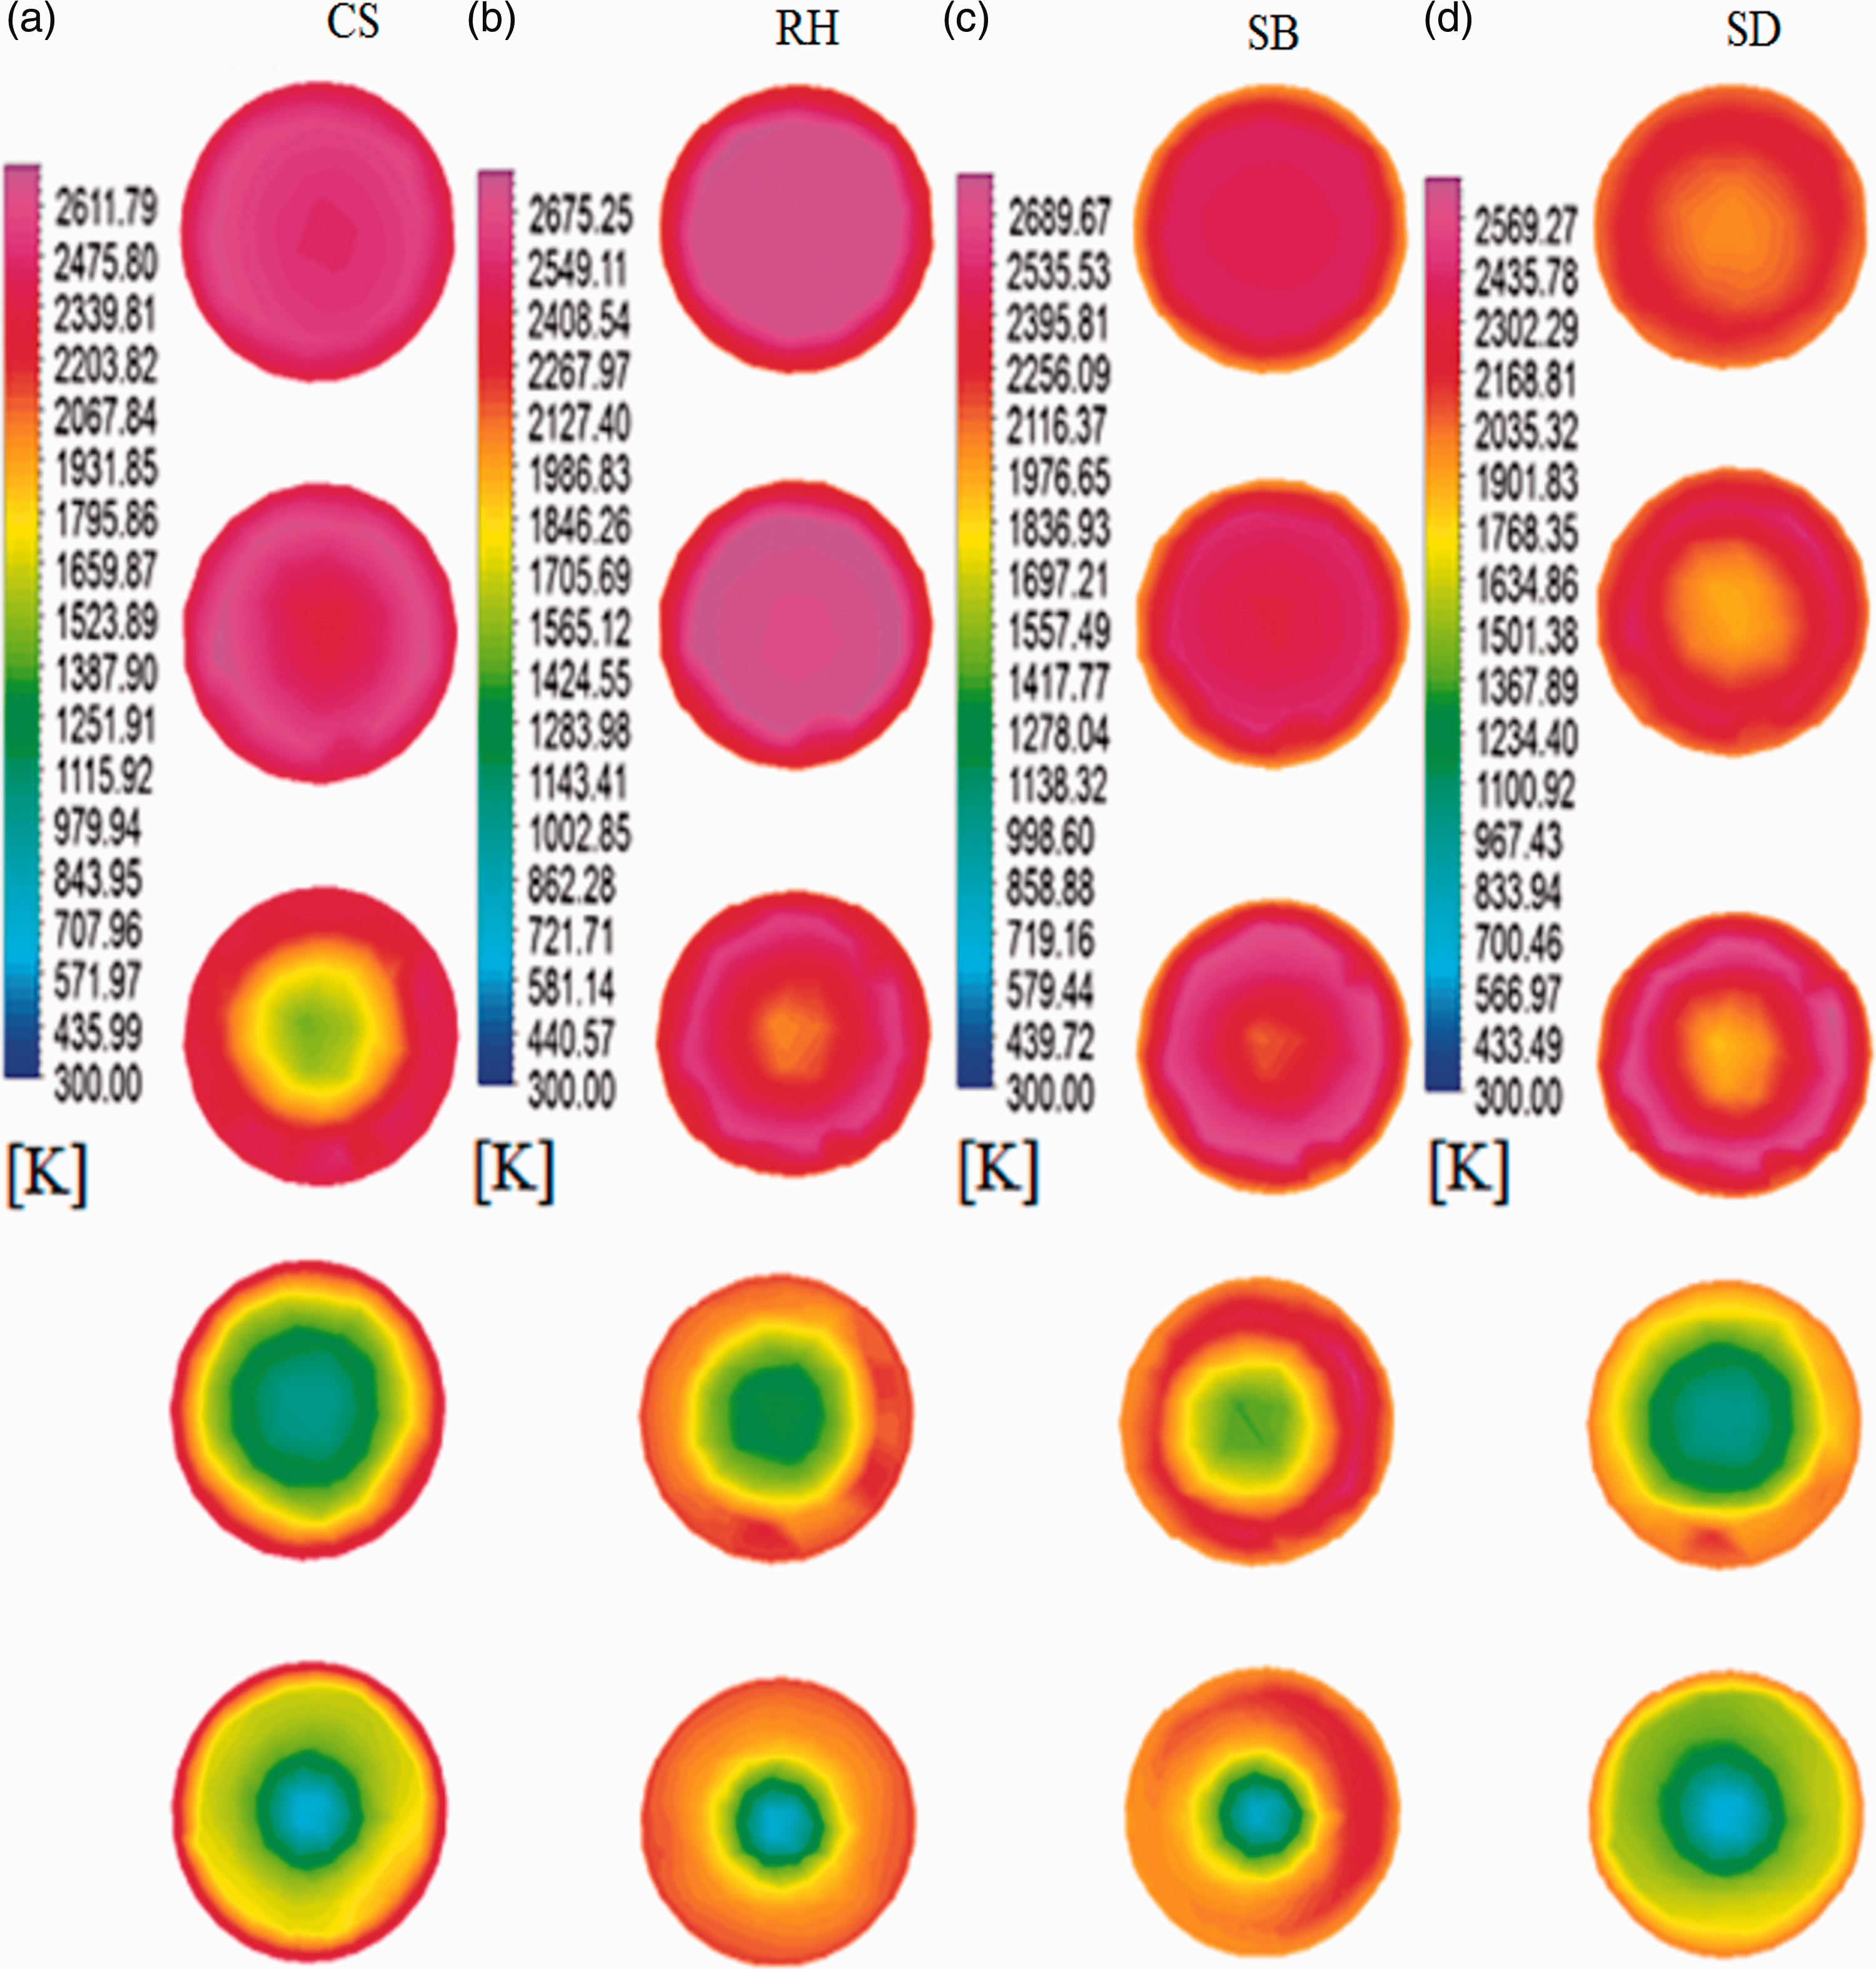
The raw biomass was feed at the top of the gasifier and moved through the drying and pyrolysis sections of the reactor. The gas species such as CO and H2 produced through reactions (equation (17)), (equation (18)), and (equation (21)) in gasification section and were released from the outlet. The oxidation reactions were observed in the gasifier’s combustion zone (Unar et al., 2014). In the highest temperature zone of the gasifier, the CO2 mass fraction achieved its highest levels. The reduction reactions were observed in the gasification zone of the reactor resulting in the decrease of CO2 mass fraction and increase of H2 and CO mass fractions. The temperature behavior at varying O/F ratios is shown in Figure 4. The temperature is low at lower O/F ratios ideally from 0.17 to 0.42 ranges then it is increased at upper O/F ratios (greater than 0.42). The reason for this trend of temperature is the occurrence of gasification reactions (equation (17)) and (equation (18)) because those reactions are endothermic and reduce the overall temperature of the mixture in lower ranges of O/F. But at higher ranges of O/F, the abundant oxygen is available, and the combustion reactions (equation (16)), (equation (20)), (equation (21)) become more favorable than gasification reactions and hence the rise in the overall temperature with the decreased amount of gasification products, i.e., CO and H2 (Zhou et al., 2009). Hence the reduction reactions were more dominant at O/F ratio of 0.17–0.42 resulting in more production of CO and H2.
Temperature profile at different oxygen/fuel ratios.
(a) Cotton stalks behavior under varying oxygen/fuel ratios. (b) Rice husk behavior under varying oxygen/fuel ratios. (c) Sugarcane bagasse behavior under varying oxygen/fuel ratios. (d) Sawdust behavior under varying oxygen/fuel ratios.
Effect of oxygen/fuel ratio on syngas quality
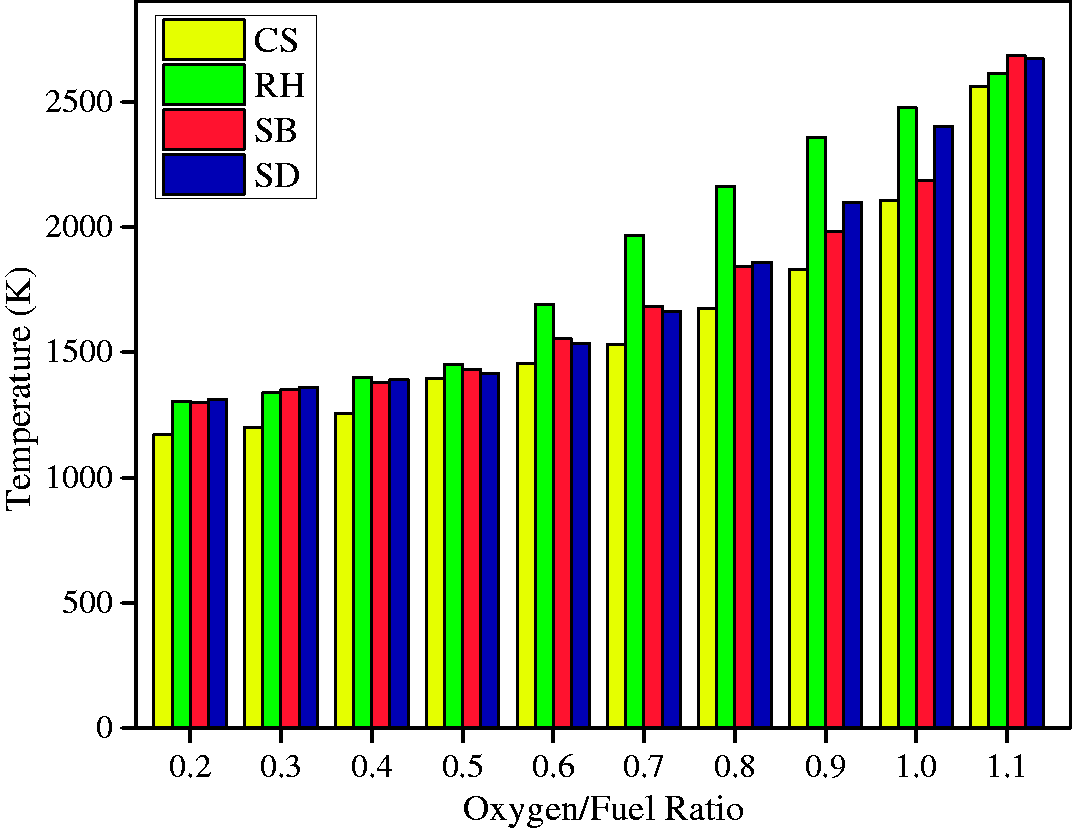
The O/F ratio is an important parameter being considered during the design and operation of a gasifier. The O/F ratio is the amount of oxygen introduced relative to the amount of carbon introduced into the reactor. During this simulation study, the variation in O/F ratio was performed keeping all other parameters constant such as the oxygen flow rate and feed temperatures. The effects of O/F ratio on syngas quality for CS, RH, SB, and SD are given in Figure 5 ((a), (b), (c), and (d)), respectively. The maximum mole fractions of CO and H2 for CS samples 0.35 and 0.042 respectively at 0.18 O/F ratio. At this point, the mole fractions of CO2 and H2O are at minimum levels (0.05 and 0.12). On increasing O/F ratio, there is a gradual decrease in CO and H2 and reached a minimum level of 0.012 and 0.006 at maximum tested O/F ratio of 1.1. The reason is quite obvious that at lower O/F ratios the gasification reactions were dominant over combustion reactions (equation (16)), (equation (19)), and (equation (20)) (Žandeckis et al., 2014). Similarly, for the case of RH, the maximum mole fractions of CO and H2 were 0.333 and 0.0465, at O/F ratio, of 0.31, and minimum 0.05, 0.001 at O/F ratio 1.1 respectively. For SB the maximum mole fractions of CO and H2 productions were 0.32, 0.047, minimum mole fractions were 0.039 and 0.0015 respectively. While the maximum mole fractions of CO2 and H2O were 0.302, 0.262, minimum mole fractions were observed 0.055, and 0.12 at O/F ratio of 1.1 respectively. For SD, the maximum mole fractions of CO and H2 productions were observed 0.30, 0.03 and minimum mole fractions of CO and H2 were 0.08 and 0.0031 respectively. While the maximum mole fractions of CO2 and H2O were 0.2788, 0.0.216 and minimum mole fractions were observed 0.06, and 0.105 respectively.
At lower O/F ratios, from 0.17 to 0.42, gasification reactions (equation (20)) and (equation (21)) were dominant. As O/F ratio increased from 0.42 to 1.1, the combustion reactions (equation (16)), (equation (19)), and (equation (20)) inside the gasifier remained dominant. Moreover, H2 consumed part of O2 to generate H2O, when the O2 content was low, carbon particles burned incompletely generating more CO productions. The incomplete combustion of carbon particles enhanced the CO production and the concentration of CO production increased. When the O2 concentration was higher CO, H2, and gaseous hydrocarbons were fully burned resulting in a rapid increase in CO2 and H2O concentrations and continuous decrease in CO, and H2. Therefore, excessive O2 did not enhance the syngas quality. The quantitative results explained above were justified and clarified thorough qualitative analysis using contour diagrams of CS, RH, SB, and SD regarding mole fractions of CO/H2, and CO2/H2O as shown in Figure 6 (a) to (d), and Figure 7 (a) to (d) respectively. It can be visualized from the Figure 6 that the occurrence of gasification reactions (equation (17)) and (equation (18)) is started after the traveling of the reaction mixture (feedstock along with oxidant and combustion products) about 25% of reactor length where enough temperature reaches for the triggering of endothermic reactions. It is verified from the production of CO and H2 in that region (Mathieu and Dubuisson, 2002). Initially, the combustion reactions (equation (16)), (equation (19)), and (equation (20)) started and produced CO2, H2O, and temperature up to this region (Figure 7). The analysis is more supported through the contours H2, CO, H2O, and CO2 mole fractions produced from RH feedstock at various sectional planes along the height of gasifier, shown in Figure 8. The first two sectional planes for CO and H2 show lower mole fractions whereas the rest of planes for said species show higher mole fractions. Similarly, this trends is reversed for the combustion products, i.e., CO2 and H2O.
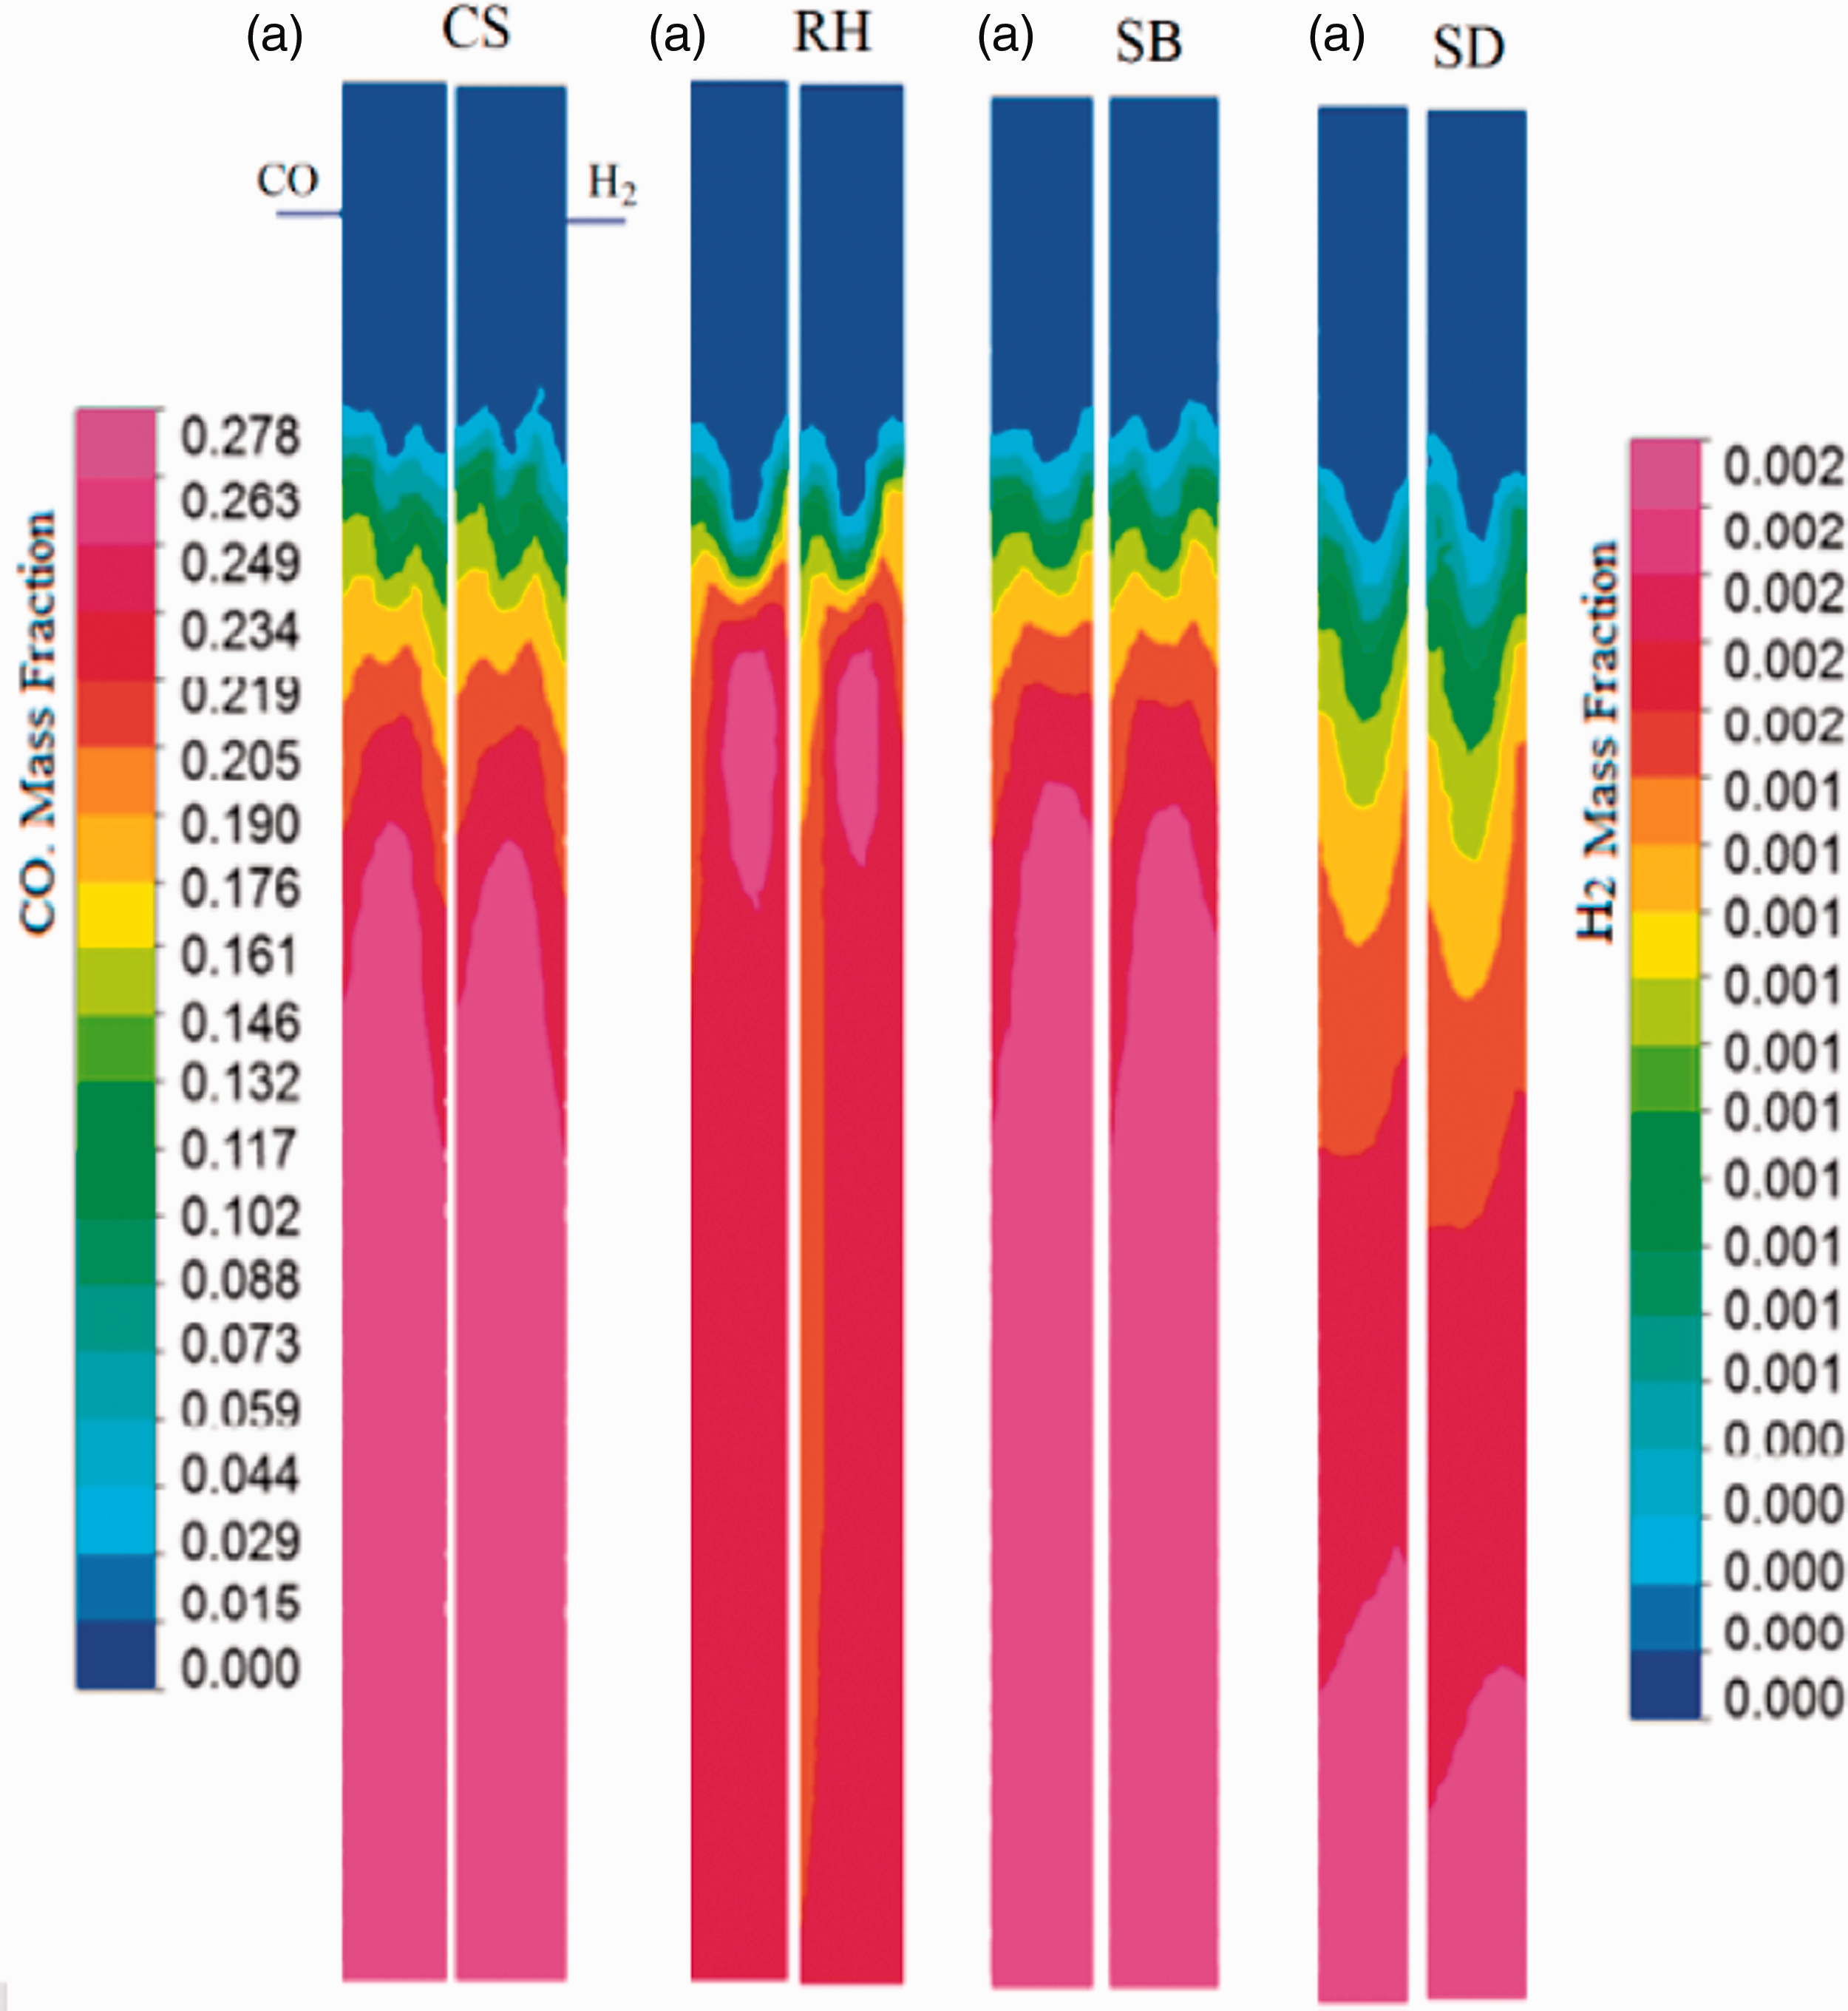
Contours of CO and H2 mole fractions within the gasifier from (a) CS, (b) RH, (c) SB, and (d) SD feedstock.
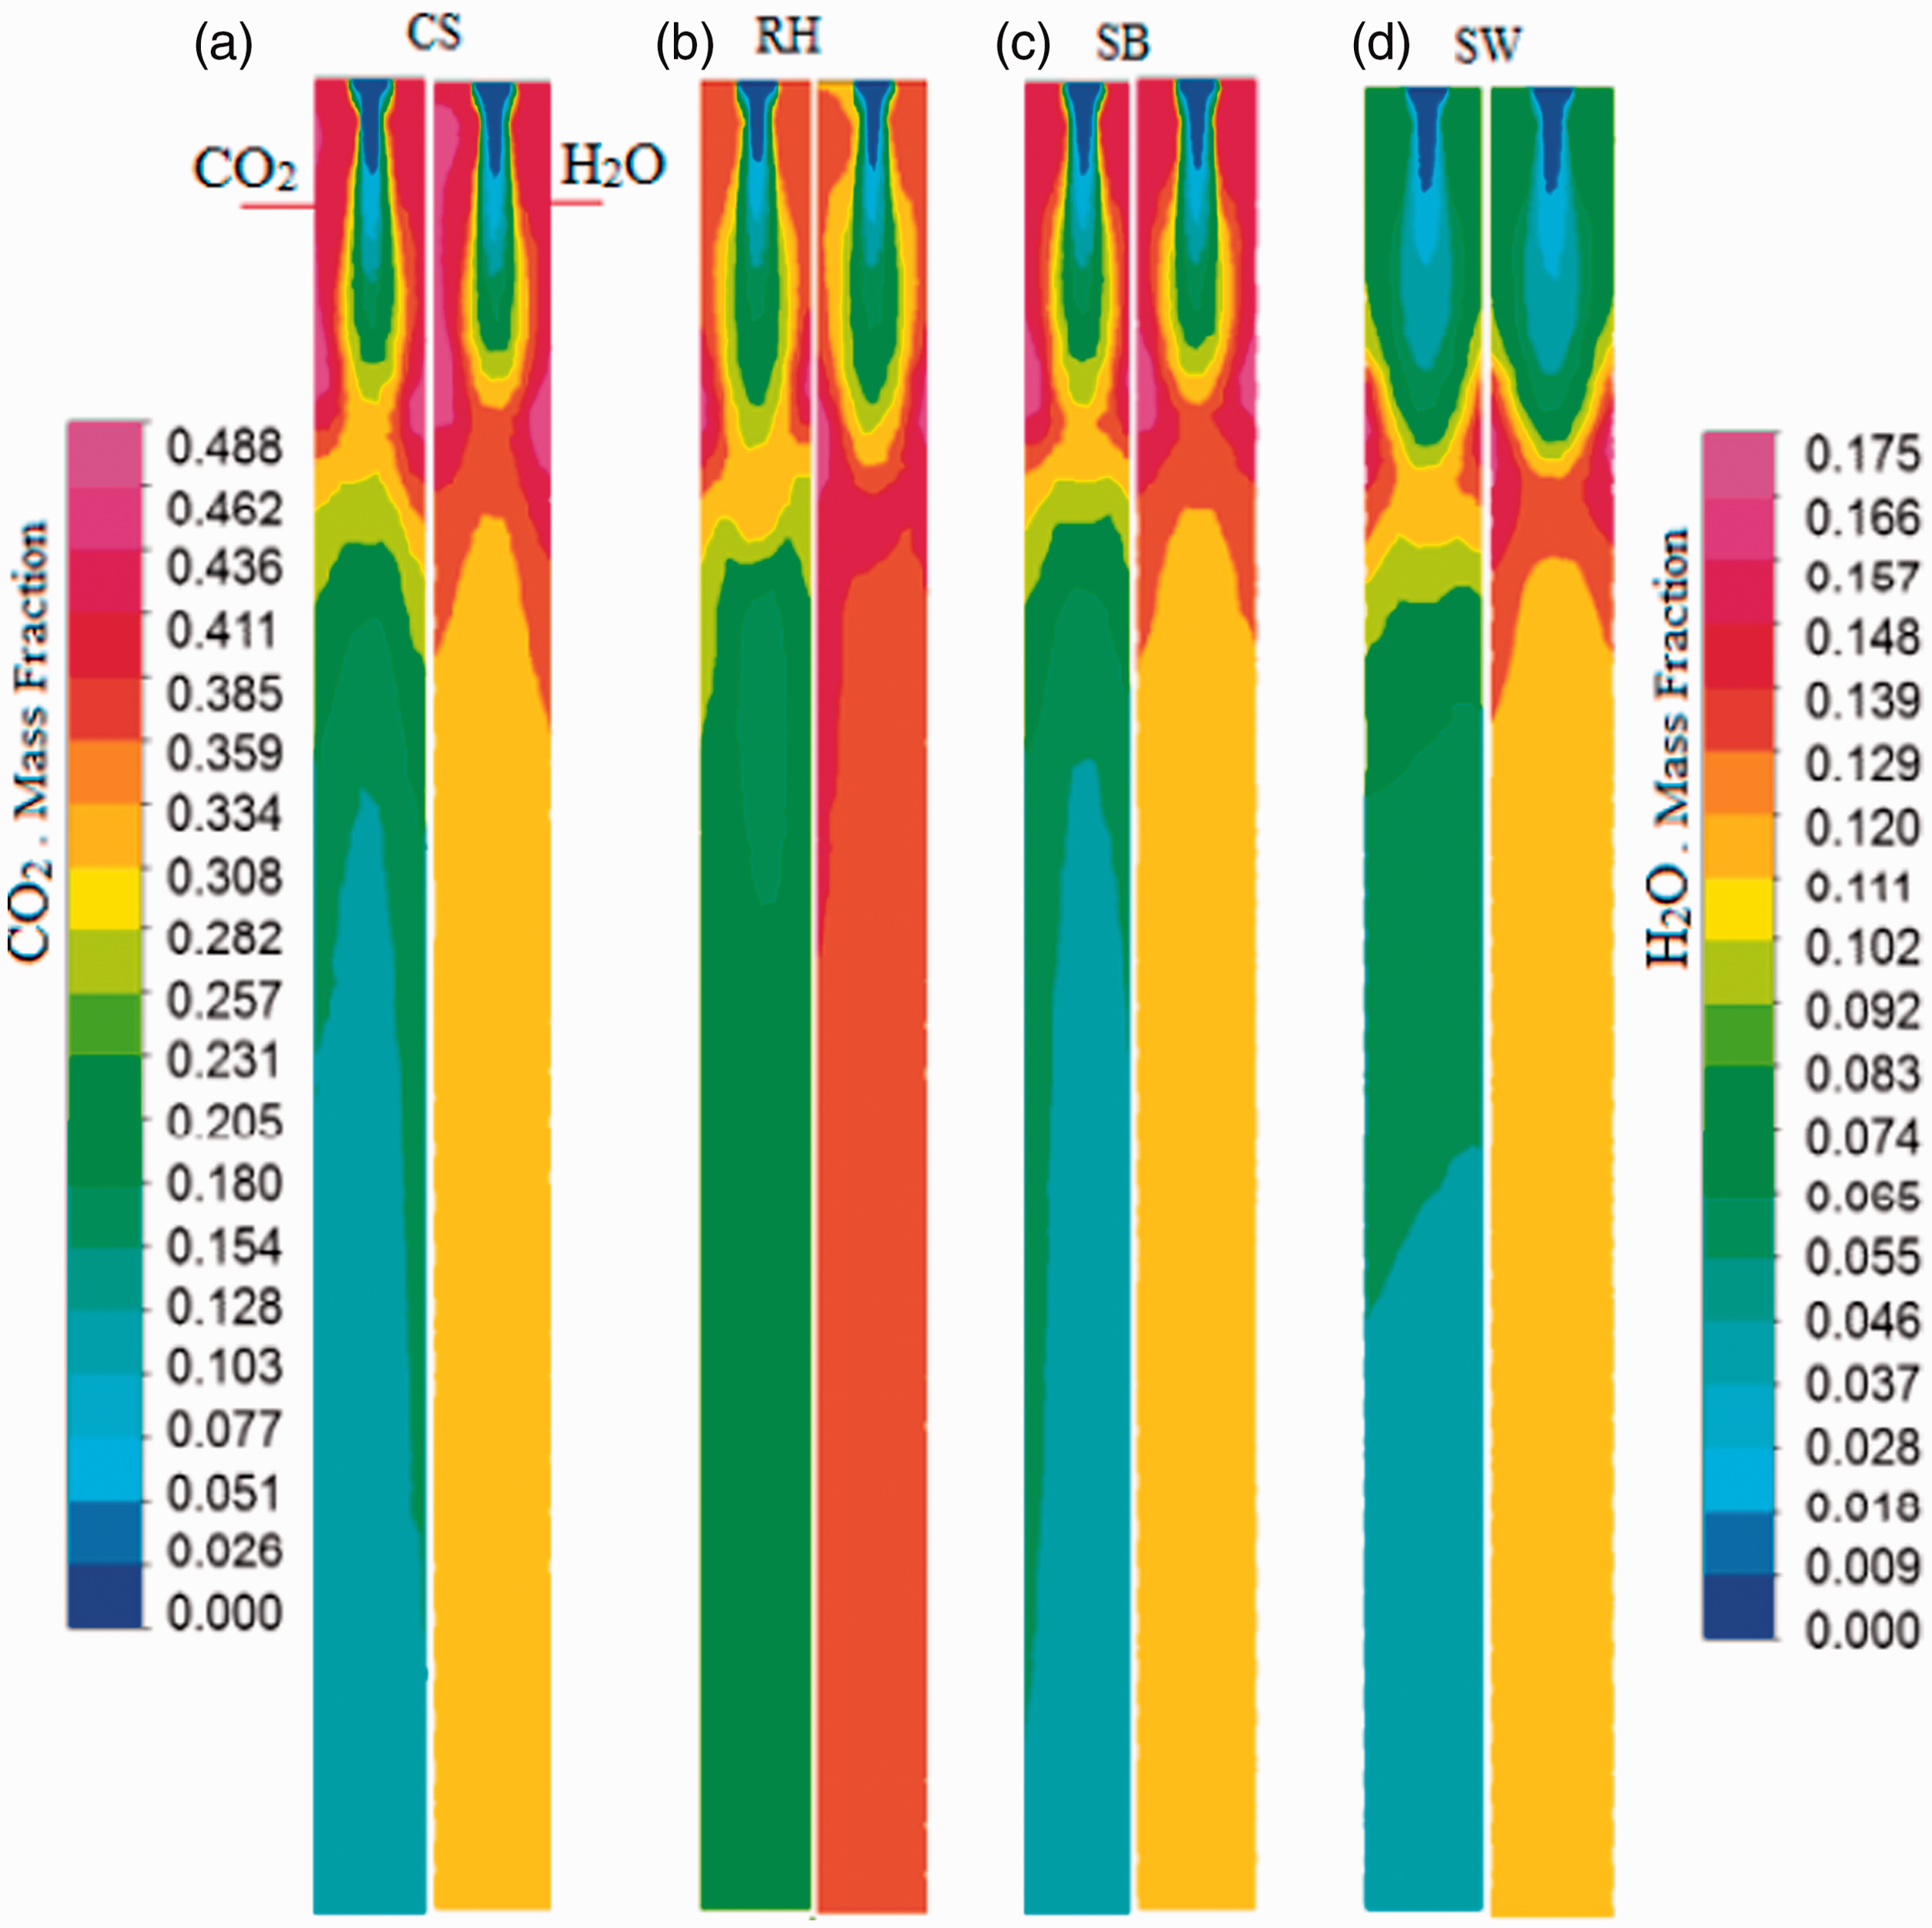
Contours of CO2 and H2O mole fractions within the gasifier from (a) CS, (b) RH, (c) SB, and (d) SD feedstock.
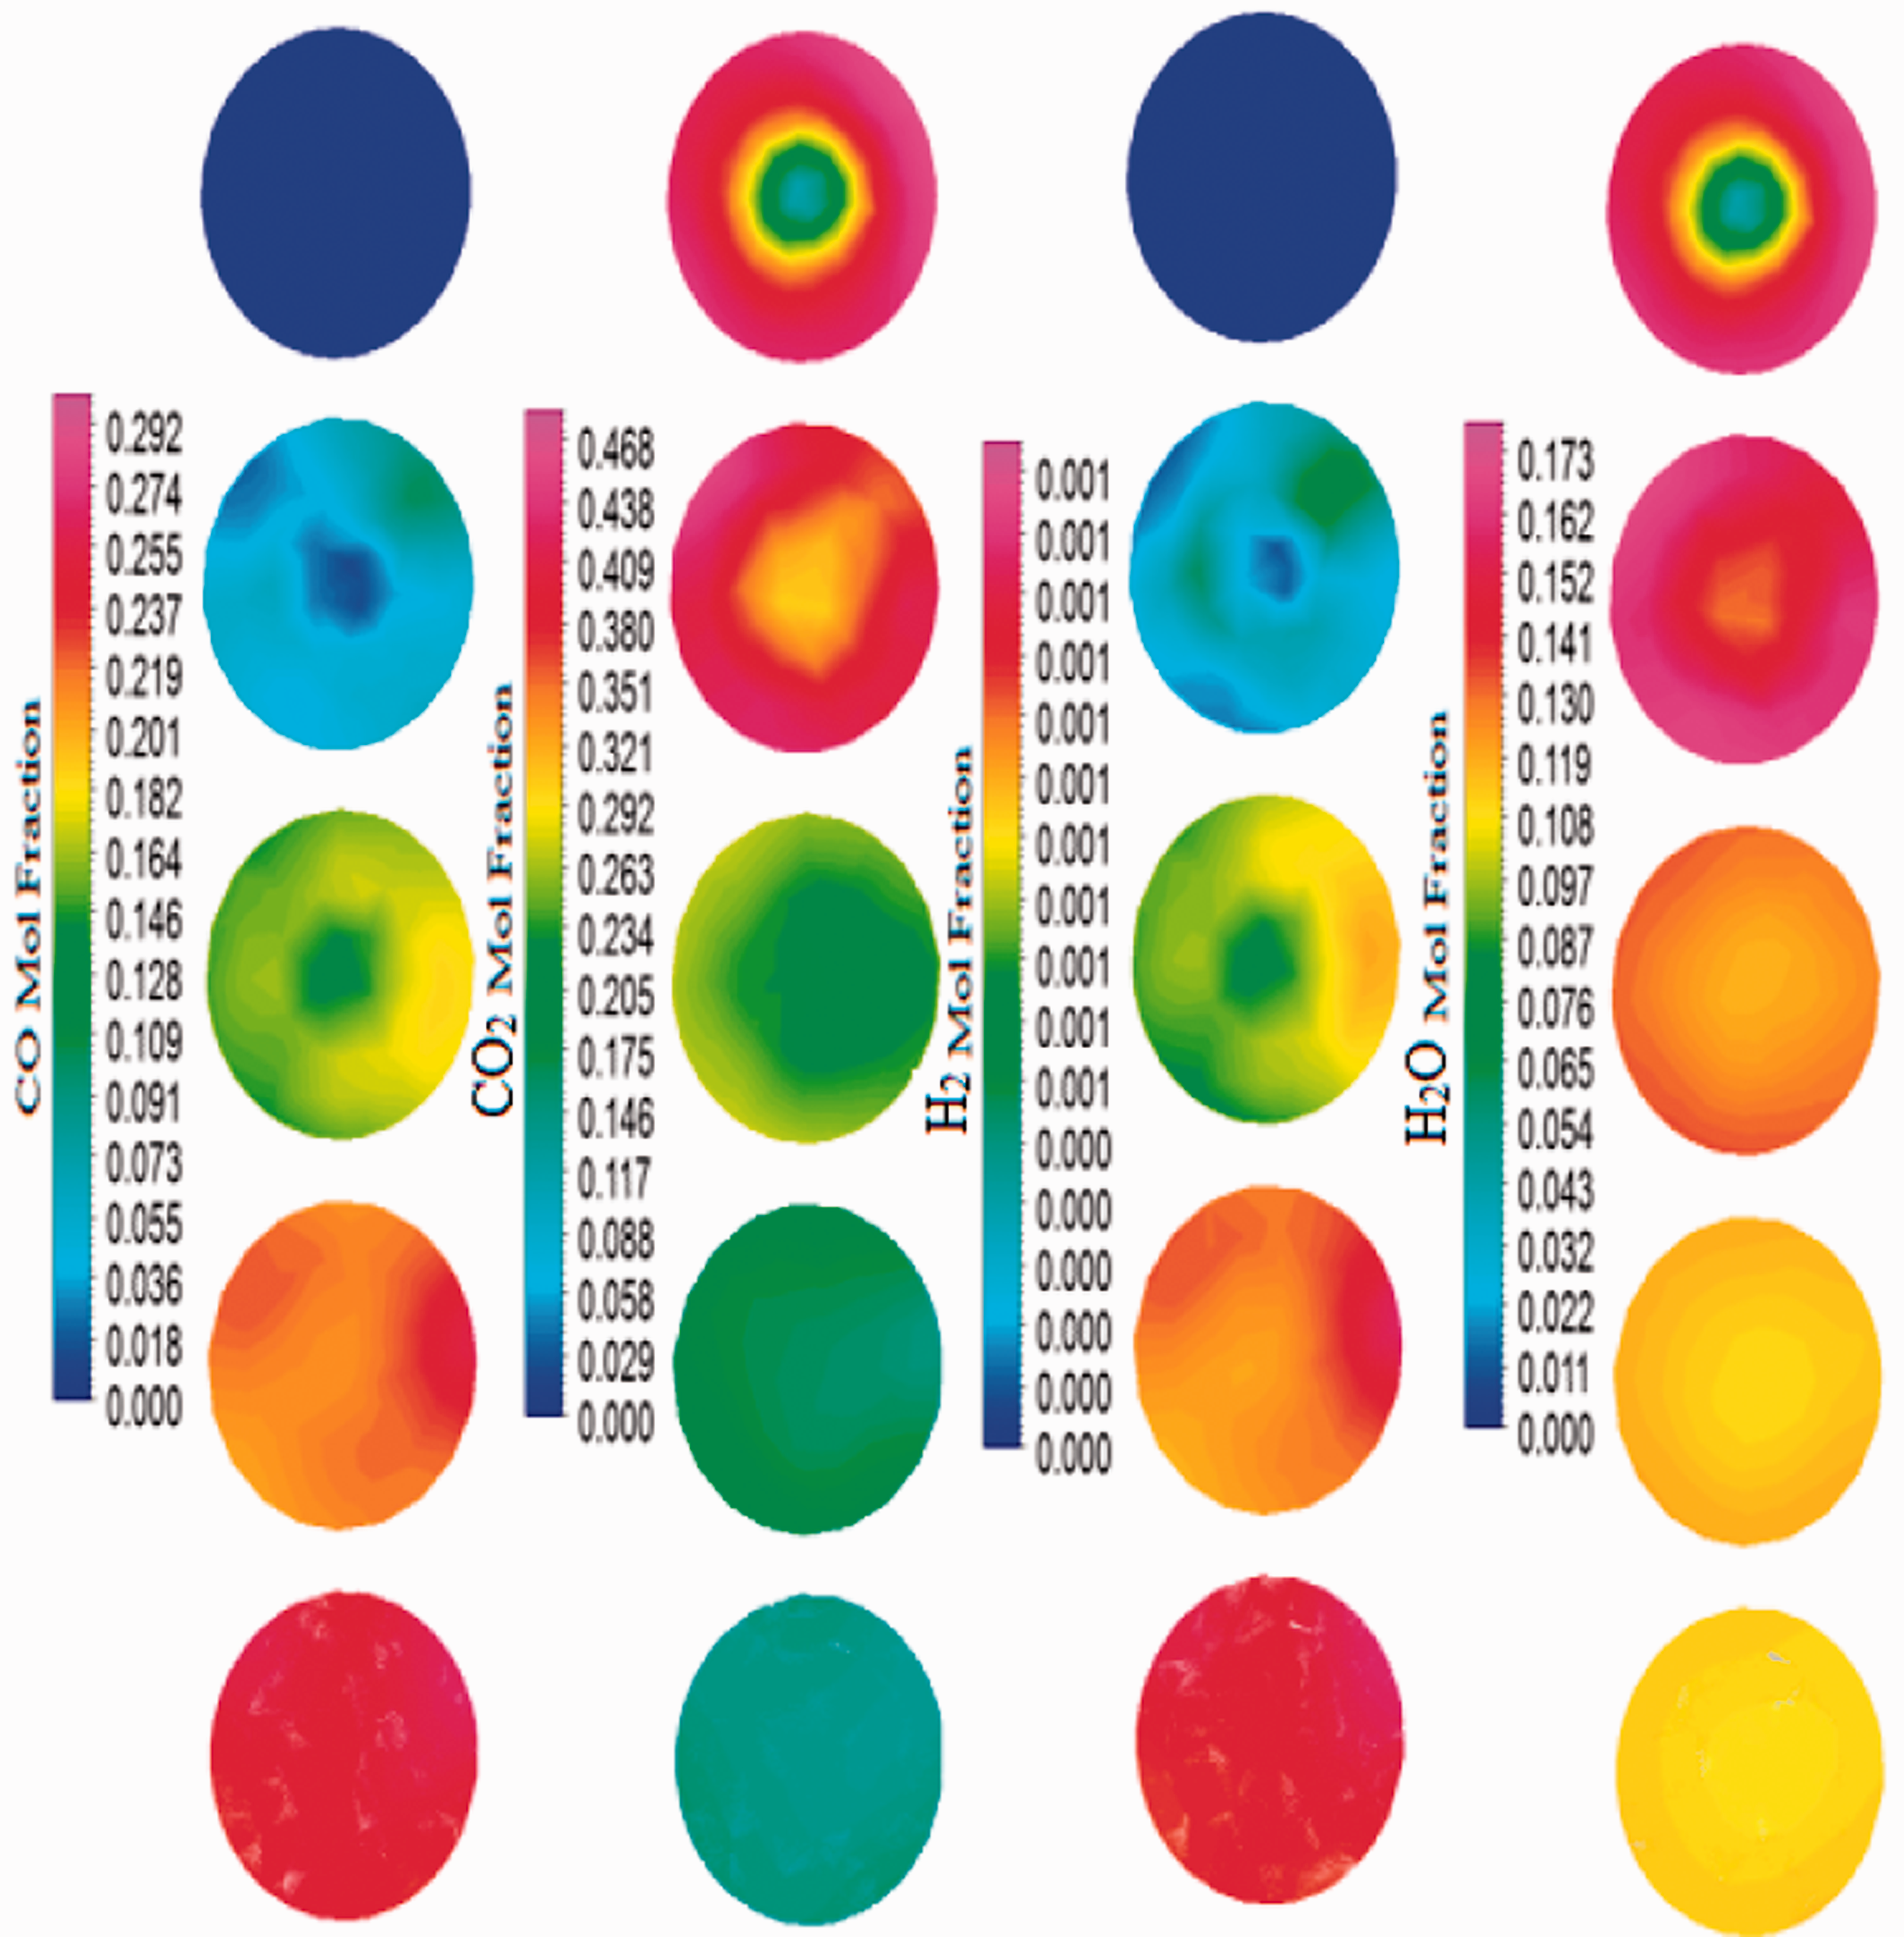
Syngas production contours of RH sample at different planes of the gasifier.
Figure 9 shows the streamlines of syngas for CS along with the contours of CO, CO2, H2, and H2O mole fractions at different sectional planes. From these streamlines, it is shown that during combustion reactions (equation (16)), (equation (19)), and (equation (20)) at the upper zone of reaction chamber) there is vigorous mixing of combustion products due to concentric injection of feedstock and oxidant which produces high temperature, and combustion products mainly CO2 and H2O leaving a portion of unburnt char particles. Those unburnt char particles then react with CO2 and H2O as per gasification reactions (equation (17)) and (equation (19)) and produce CO and H2 in the further length of the reactor (Chen et al., 2013; Fernando and Narayana, 2016).
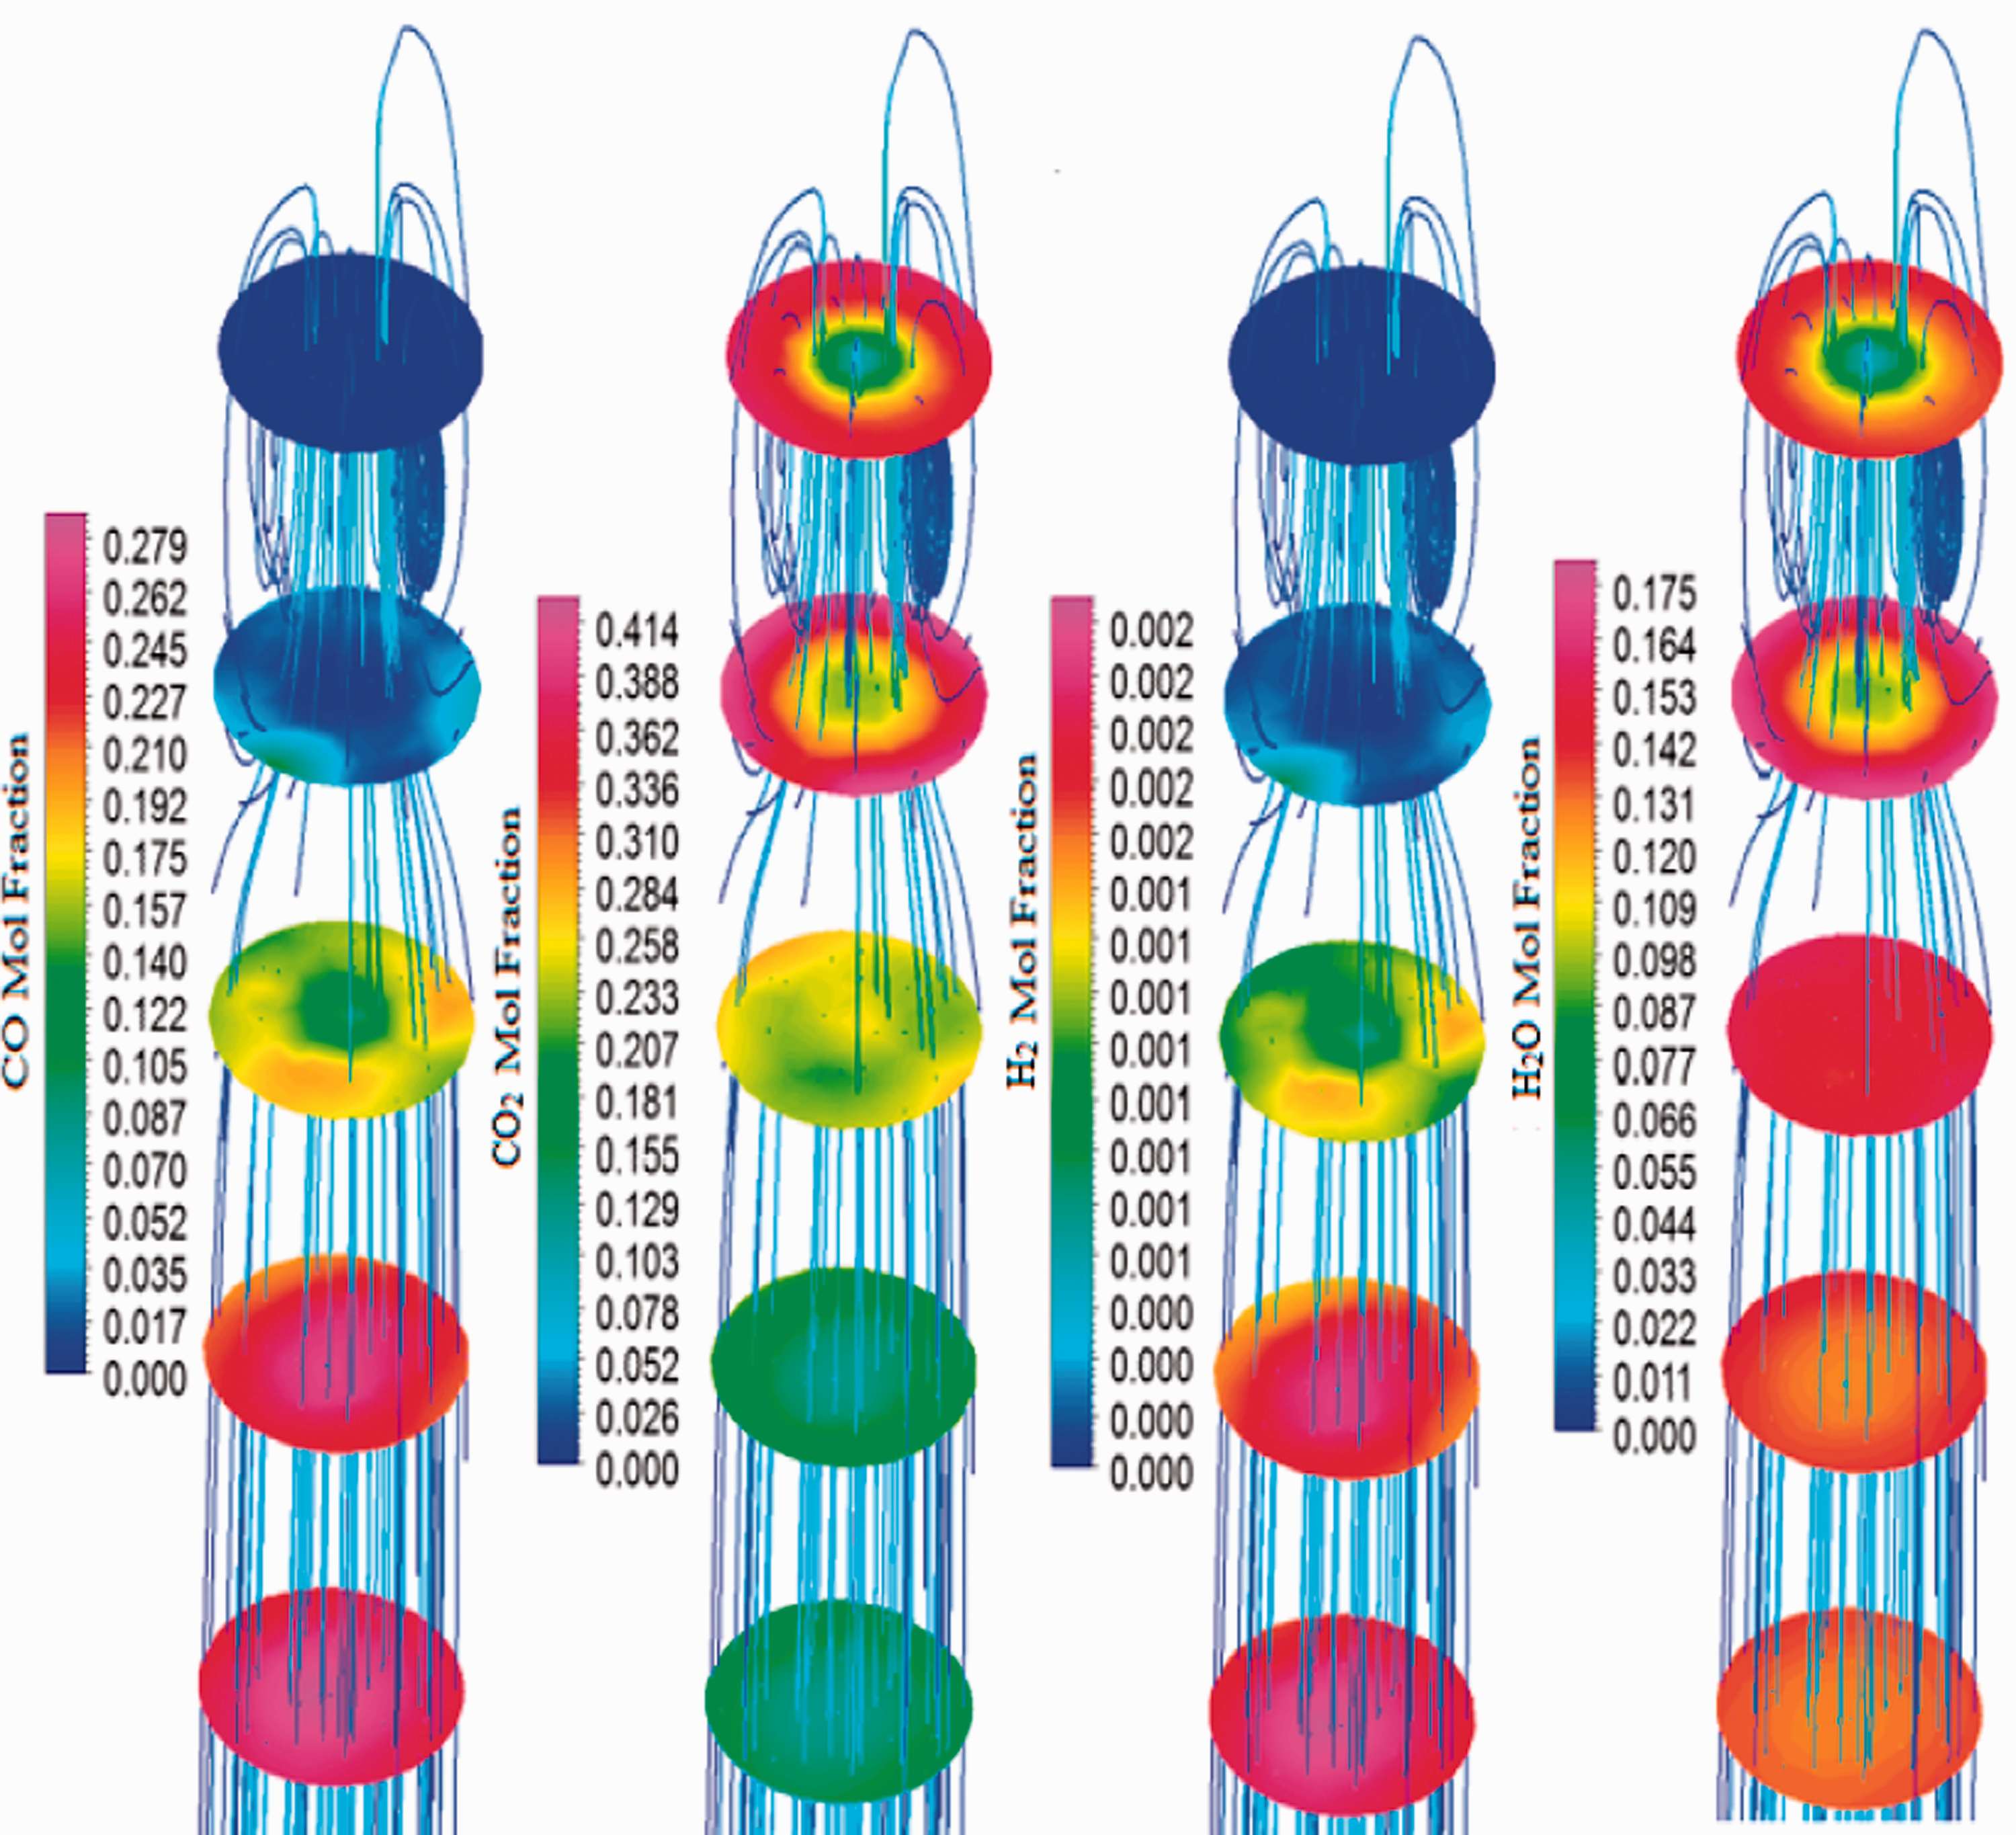
Syngas streams for CS at different planes of the gasifier.
The injector design with concentric-tubes plays a vital role in the proper mixing of fuel particles with an oxidizing agent at near entrance (Unar et al., 2014). It can be observed in Figure 9, in which flow streamlines are shown and indicating a vertical vortex at the entrance plane. Figure 10 shows a comparison among the mole % of important syngas species obtained from the present study with the other researchers’ work conducted experimentally or through simulations. From Figure 10, it is seen that the CO mole % obtained from various biomass material as per this study is higher in range as compared to other materials except for coal. The reason is the difference in composition of biomass taken in this study and the feedstock taken by other researchers. The primary difference is of total or fixed carbon content along with volatile matters. On the other hand, the CO2 and H2 mole% from the selected biomasses in the present study is quite less as compared to literature. One possible reason is the higher moisture % in their feedstock as compared to the material selected in the present study. One thing could be observed that not all researchers have calculated CH4 in their research keeping the similar assumption of a negligible amount of CH4. The obtained value of CH4 from literature is almost less than 1.5% which has very less share in the overall heating value as compared to very high mole % of CO and H2 (Couto et al., 2015; Ismail et al., 2016).
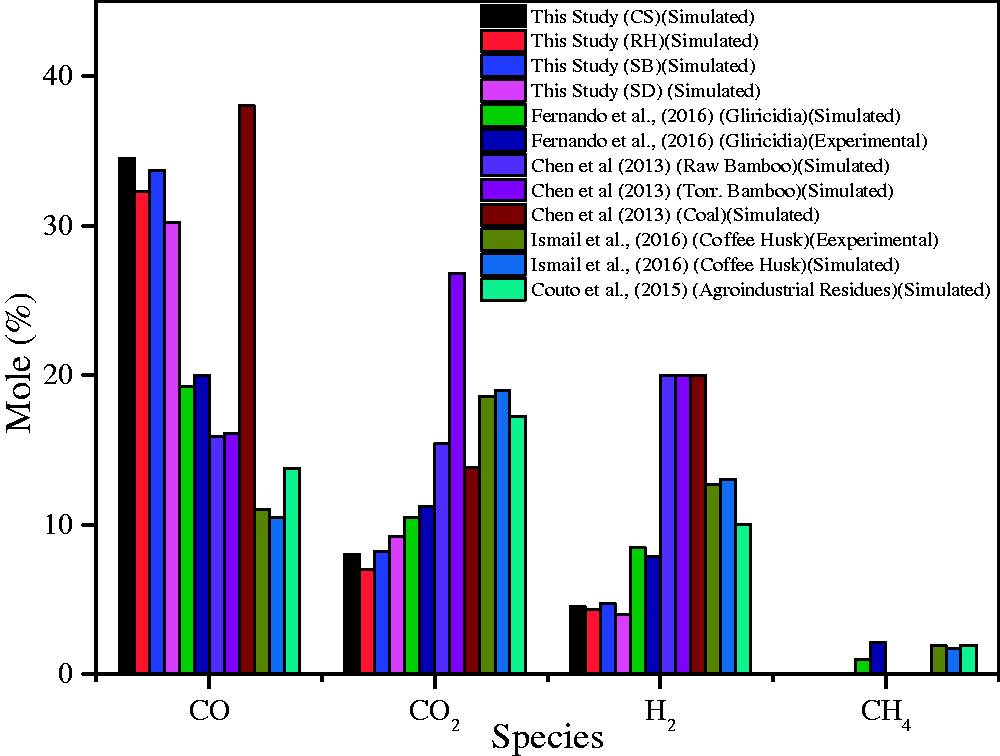
Comparison of the results of important syngas components from the present study with literature.
Higher heating value
The HHV for each simulated case was calculated using syngas composition in standard correlations as explained by previous research (Unar et al., 2012). Figure 11 shows HHV of syngas under varying O/F ratios from 0.17 to 1.1. The HHV of syngas was observed in the range of 5.60 MJ/kg to 12.611 MJ/kg.
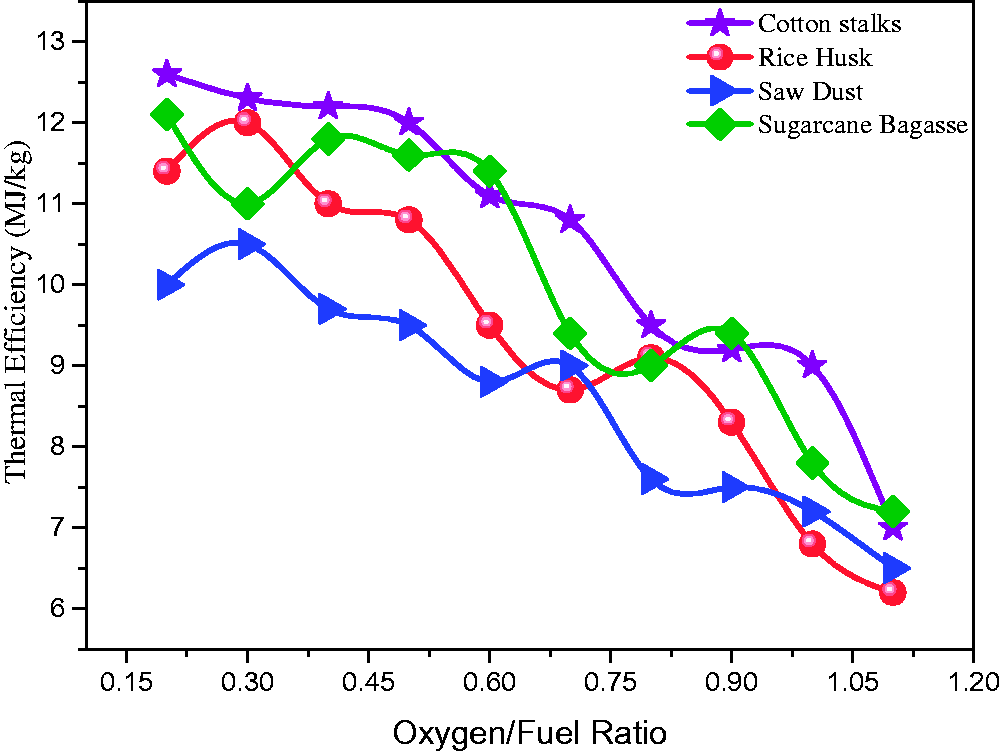
Thermal efficiency at varying oxygen/fuel ratios.
With the increase in O/F ratio above 0.42, the HHV of syngas decreased continuously as in Figure 10. The decrease in the HHV of syngas was due to the decrease in combustible gases such as CO and H2 (Chang et al., 2011). The maximum thermal efficiency regarding HHV for CS, SB, RH, and SD was observed at O/F ratio of 0.21, 0.30, 0.19, and 0.34. The maximum HHV of syngas produced from CS, SB, RH, and SD were observed 12.6 MJ/kg, 12.1 MJ/kg, 12.22 MJ/kg, and 10.5 MJ/kg respectively. Whereas the minimum HHV of syngas produce from CS, SB, RH, and SD were observed 7.11 MJ/kg, .33 MJ/kg, 6.55 MJ/kg, and 6.23MJ/kg at 1.1 O/F ratio, respectively.
Cold gas efficiency
CGE is considered one of the important parameters during the operation of a plant. It can be defined as the ratio between the flow of energy in the gas and the energy contained within the fuel. The CGE at different operating O/F ratios for CS, RH, SB, and SD are shown in Figure 12. The maximum CGE for CS and SB was found 72.51%, 72.84% at the O/F ratio of 0.39, 0.18. While the minimum CGE was observed at 42.13%, 44.85% at O/F ratio 1.1. While in the case of RH and SD the maximum CGE was 65.31%, 57.32%, and minimum 38.99%, 36.33%, at O/F 0.18, 0.19, and 1.10 respectively. The variations in cold gas efficiencies in selected biomasses are due to the difference in HHV and mole fractions of CO and H2 for different feedstocks used in this study. CGE also depends on biomass sources HHV. The low cold gas efficiencies resulting from biomass gasification are attributed to the low concentrations of H2 and CO in the product gas (van der Meijden et al., 2010).
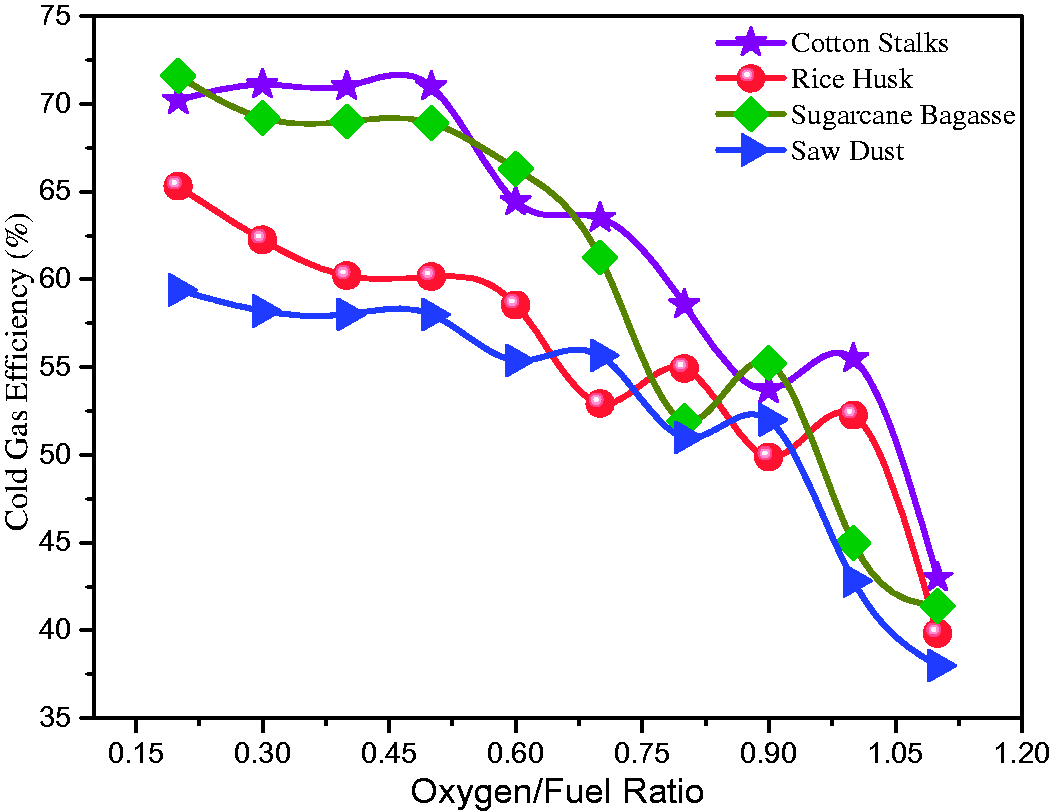
Cold gas efficiency at varying oxygen/fuel ratios.
Carbon conversion efficiency (CCE)
The CCE of the gasifier is one of the most important parameters considered during the design and operation of the gasifier. It is explained as the ratio of the carbon in the product gas to the ratio of carbon in the raw biomass fed into the reactor. Figure 13 shows the simulated values of carbon conversion efficiencies for CS, RH, SB, and SD. With the increase in O/F ratio from 0.17 to 1.1, the CCE varied between 99.61% and 91.13%. As O/F ratio increased, it reduced the CCE. However, in all O/F ratios, the observed CCE was greater than 91.13% representing that more than 91.13% of carbon in these biomasses was converted to the CO and CO2. The maximum CCE for CS was found at 99.61% at 0.44 O/F ratio. Similarly, the maximum CCE for RH was found 99.53% at 0.18 O/F ratio, for SB was found 98.11% at 0.33 O/F ratio, and for SD was found 97.33% at 0.41 O/F ratio. The minimum CCE was found 92.22% for CS, 91.62% for RH, 91.63% for SB, and 90.11% for SD at the same O/F ratio 1.1. The CCE of SB and CS were higher when compared with RH and SD. The results gathered concerning carbon conversion efficiencies of differently selected feedstocks are qualitatively in good agreement with the results reported in the literature by (Nikoo and Mahinpey, 2008).
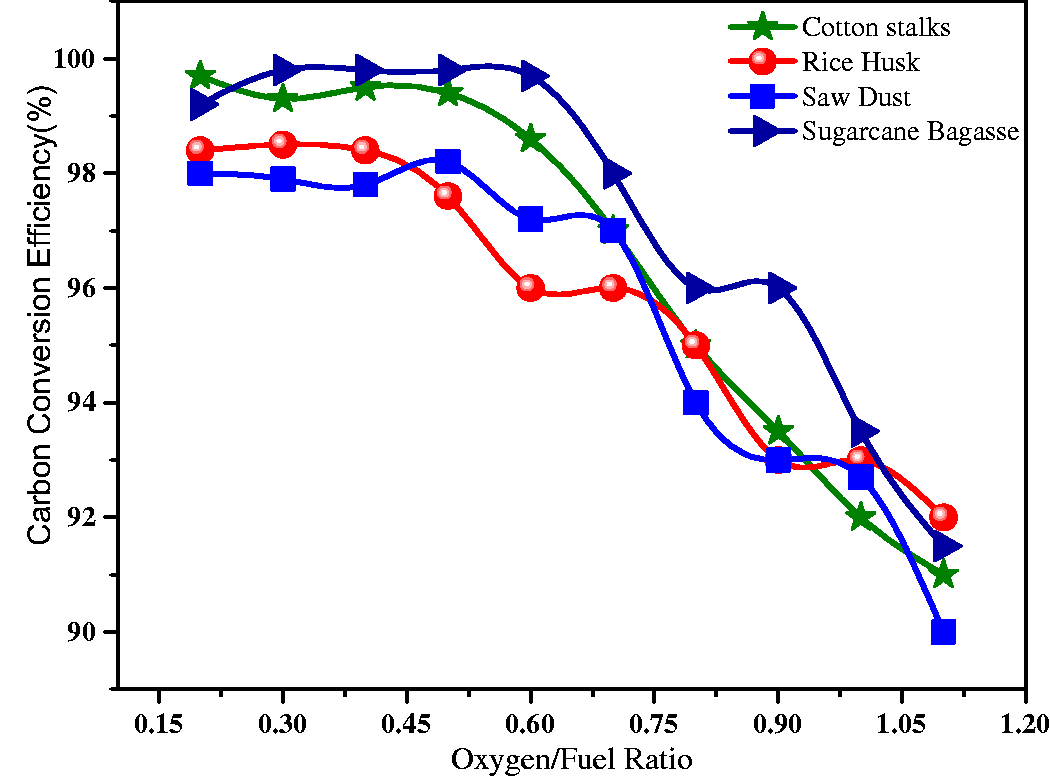
Carbon conversion efficiency at varying oxygen/fuel ratios.
Conclusions
The behavior of biomass gasification for selected biomasses including CS, RH, SB, and SD in CT-EFG was investigated and compared using a numerical simulation method. The behavior of gasification at the different O/F ratios and their effects on the syngas composition were investigated. The variations in O/F ratio affected the syngas yield and the gas-solid mixing pattern. This impact was transferred in the variation of char consumption rates with combustion and gasification reactions and that played a key role in the variation of syngas components and temperature.
The CCE for all selected biomass materials was found above 90%. The variations in O/F ratio impacted on the HHV of syngas. The HHV of syngas varied in the range of 12.6–6.23 MJ/kg with variations in O/F ratio. The current model predicted the effect of variations in O/F ratio on temperature, syngas production, and quality in an entrained flow gasifier equipped with concentric tube burners. The developed model also provided a sensitive analysis of syngas composition, in addition to the CCE, CGE and HHV.
The maximum mole fractions of CO for CS were observed 0.354, for RH 0.333, for SB 0.327, and for SD 0.302, and 0.30 respectively. While the minimum mole fractions of CO were found for CS 0.012, RH 0.051, SB 0.039, and SD 0.080 respectively. The maximum mole factions of H2 productions for CS 0.0423, RH 0.0465, SB 0.047, and SD 0.037, respectively. Similarly, the minimum mole fraction of H2 was observed for CS 0.006, RH 0.001, SB 0.0015, and SD 0.0031 respectively. The developed model would be useful for the simulation of biomass gasification plants concerning CT-EFG.
Footnotes
Acknowledgements
The authors are thankful to Dawood University of Engineering and Technology, Karachi and Mehran University of Engineering & Technology, Jamshoro, Pakistan for providing valuable resources and support in the accomplishment of this research article.
Declaration of conflicting interests
The author(s) declared no potential conflicts of interest with respect to the research, authorship, and/or publication of this article.
Funding
The author(s) received no financial support for the research, authorship, and/or publication of this article.