
Abstract
The phase characteristics of petroleum fluids are directly related to the hydrocarbon accumulation, and through exploration and development, the evolution process of hydrocarbon generation from coal is found to be complex, with variable fluid phases. To explore the relationship between the hydrocarbon generation process and fluid phase evolution of the coal, we derive the kinetic parameters for the gaseous hydrocarbons and methane generated from a series of closed-system laboratory pyrolysis tests of a Jurassic coal from the Minhe Basin and established a phase evolution diagram of the coal-generated fluids and the corresponding geological conditions. The study shows that with a fixed frequency factor of 1.0 × 10¹⁴/s, the mean values of activation energies of C1 and C1–5 are 64.55 kCal/mol and 63.93 kCal/mol, respectively. The phase of the coal-generated hydrocarbon fluids produced under geological conditions shows that an undersaturated oil phase or an oil–gas phases is possible when Easy%Ro <1.08, any phase is possible when Easy%Ro is between 1.08 and 1.36, an undersaturated gas phase or an oil–gas phases is possible when Easy%Ro is between 1.36 and 2.05, and a gas phase is possible when Easy%Ro > 2.05. The hydrocarbon generated from the Jurassic coal of the Minhe Basin started as an oil phase in the Early Cretaceous, and the fluid phase may have changed from oil phase to oil–gas phases in the late Early Cretaceous, The fluid changed to gas phase after the Miocene. Additionally, the source rock is still in the stage of gas generation currently.
Introduction
Petroleum is a mixture of many kinds of hydrocarbons and nonhydrocarbons. The fluid phase could be very different in different parts of a given petroleum reservoir; it could be a single gas phase, an oil–gas phase, or a single oil phase (Di Primio and Horsfield, 2006). The phase behavior of petroleum is directly related to hydrocarbon migration, exploration, and development (Pedersen et al., 2014). The phase behavior of a reservoir is mainly controlled by the fluid composition and the reservoir temperature and pressure (Di Primio, 2002; Di Primio et al., 1998; Düppenbecker and Horsfield, 1990; Zhang et al., 2013). When the fluid composition is known, the phase behavior can be simulated by the equation of state (EOS), and the fluid phase can be judged according to the temperature and pressure of the reservoir (Bao et al., 2009; Di Primio et al., 1998).
Coal has a complex molecular structure, and the hydrocarbon generation products are diverse (Petersen and Nytoft, 2006); thus, the fluid phase behavior of coal-generated hydrocarbon is always considerably more complex than that of the other source rocks. Several coal-generated oil and gas fields have been found worldwide (Wilkins and George, 2002), for example, from the Jurassic coal of the Kuche depression, Tarim Basin, China (Jia et al., 2002); the Jurassic coal of the Yibei sag, Qaidam Basin (Ritts et al., 1999); the late Cretaceous to Eocene coal of the Taranaki Basin, New Zealand (Killops et al., 1994); and the Early Cretaceous coal of the San Juan Basin, USA (Clayton et al., 1991). The Minhe Basin is a Mesozoic–Cenozoic fault-cutting interbasin developed at the eastern end of the middle of the Qilian uplift belt. The main oil-bearing strata of this basin are the Jurassic–Cretaceous, and the Jurassic coal is the main source rock (Zhang and Chang, 2000).
To systematically study the fluid phase behavior during the hydrocarbon generation from the coal, especially the fluid phase evolution history in the Minhe Basin, a series of anhydrous closed-system gold-tube thermal simulation experiments were performed on a Jurassic coal from the Minhe Basin. The kinetic parameters of the gaseous hydrocarbons were simulated, and the fluid compositions of the thermal cracking products were accurately obtained so that the phase behavior could be simulated by the PVTsim software (Calsep, 1997) to establish the history of hydrocarbon generation and the fluid phase evolution.
Sample and experiments
Sample
A sapropelic coal (M006) from the Minhe Basin from the Yaojie formation (J2y) (Figure 1) and the basic geochemical characteristics are listed in Table 1.
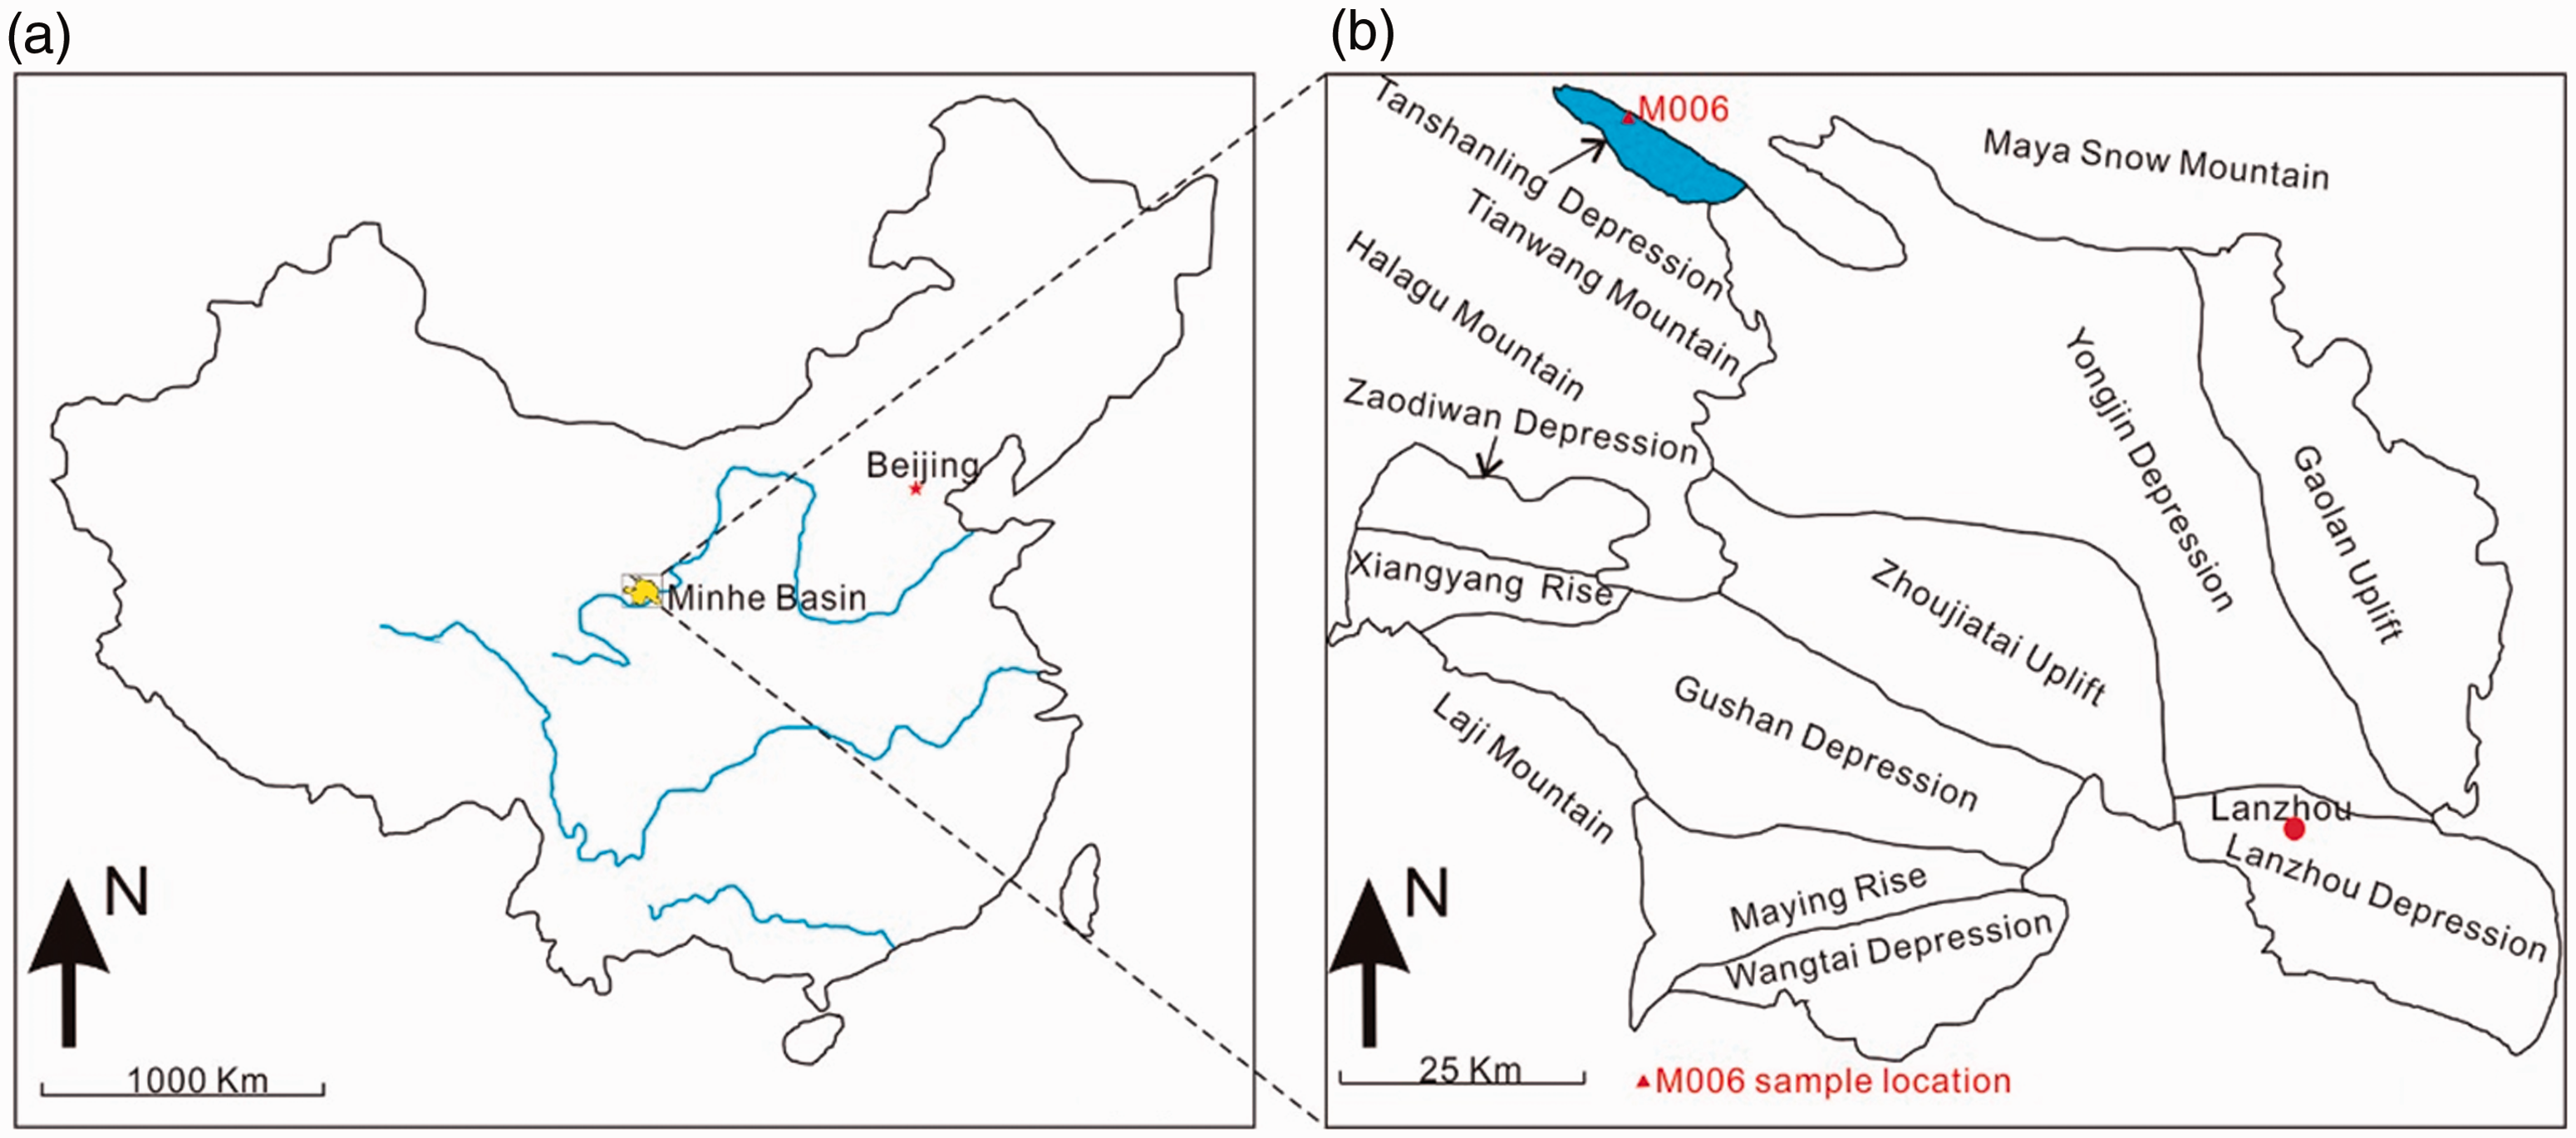
Sample location.
The basic geochemical characteristics of the samples.
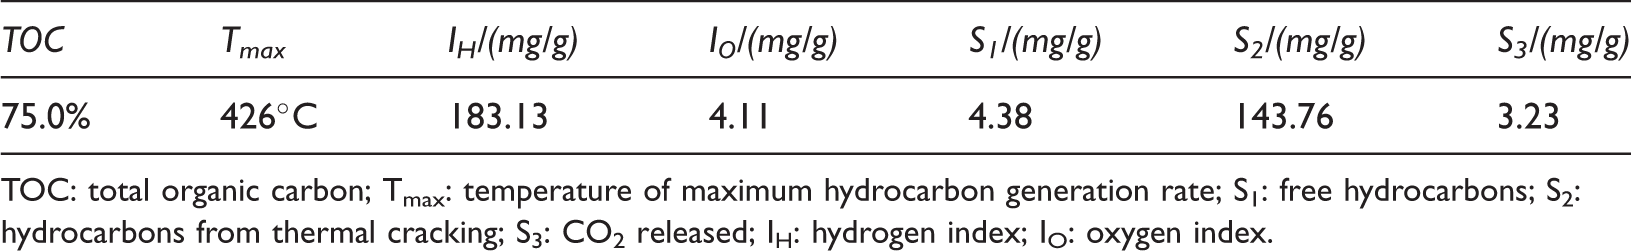
TOC: total organic carbon; Tmax: temperature of maximum hydrocarbon generation rate; S1: free hydrocarbons; S2: hydrocarbons from thermal cracking; S3: CO2 released; IH: hydrogen index; IO: oxygen index.
Pyrolysis experiment
The sample was ground to 100 meshes and sealed in 24 gold tubes (each tube had a length of 40 mm, an internal diameter of 2.5 mm, and a thickness of 0.25 mm) that were flushed with Ar to ensure that the air was completely removed and that the sample was in an Ar atmosphere. The sealed gold tubes were placed into autoclaves that were connected to a parallel water pressure line. All the autoclaves were heated in a single pyrolysis furnace. The pyrolysis pressure was 50 MPa with an error of less than 1 MPa; Figure 2 shows the pyrolysis system. The pyrolysis temperature was increased from room temperature (25°C) to 250°C over 10 h and then programmed to increase at 2°C/h and 20°C/h, respectively. The final target temperatures, which ranged from 336°C to 600°C, were measured every 24°C with an error of less than 1°C.
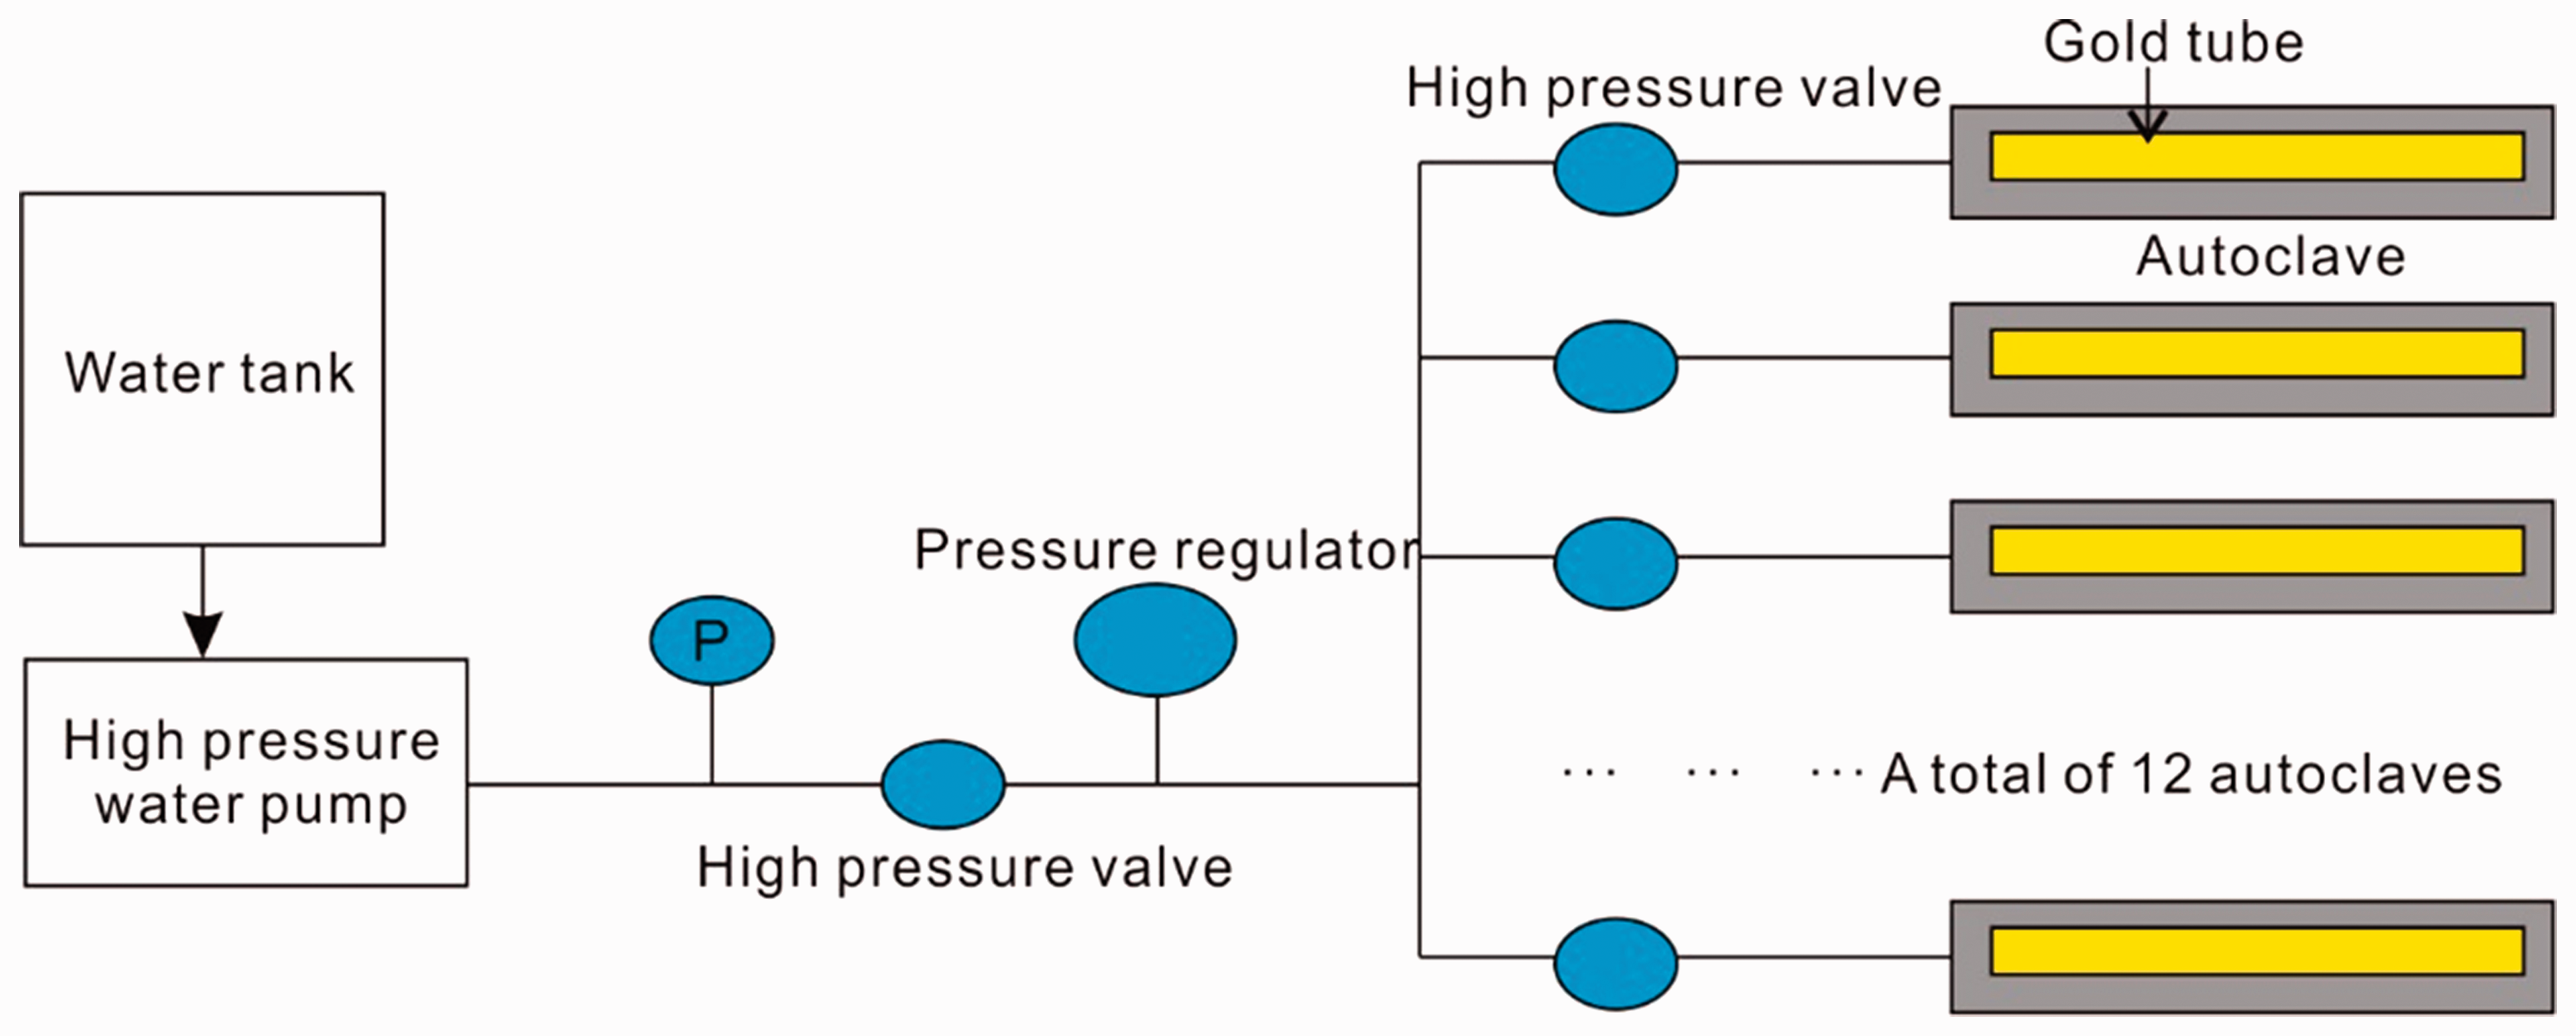
Thermal simulation experimental device schematic.
Gas compositions
After pyrolysis, the gold tube was punctured in a closed system that was connected to an Agilent 7890A gas chromatograph (GC) equipped with a two-channel Hewlett-Packard 6890 GC analyses (Wasson ECE) module with eight columns, one flame ionization detector, and two thermal conductivity detectors for the gas composition (C1-5, CO2, H2S) analysis, which was quantified by an external standard method with helium used as the carrier gas. The gas was injected at a column temperature of 60°C, which was held for 3 min; next, the oven was heated to 190°C at a rate of 25°C/min and held at 190°C for 3 min.
Quantification of C7+
After the gas compositions were analyzed, the C7+ was collected using a liquid nitrogen cold trap (4 ml, quartz bottle) (Behar et al., 1995), and 3 ml of n-hexane was injected. Then, the gold tube was cut into pieces and placed in the bottle to ensure that the C7+ was dissolved completely. Deuterated-24-alkanes were used as the internal standard for quantity. The analysis was conducted on an Agilent 7890A GC with a DM-5 capillary column (30 mm × 0.32 mm × 0.25 μm), and helium was used as the carrier gas. The initial oven temperature of 40°C was held for 5 min; next, the oven was heated to 290°C at a rate of 4°C/min and held at 290°C for 15 min. The C14+ was ultrasonically extracted using dichloromethane and weighed.
Results
Fluid compositions
The fluid yield compositions during the simulation at different heating rates are shown in Table 2 and Figure 3. The gas compositions are dominated by hydrocarbons gases and nonhydrocarbons gases, of which the hydrocarbon gases are mainly C1–5 hydrocarbons, and the nonhydrocarbon gases are mainly CO2. The maximum yields of CH4 and CO2 are 257.35 ml/g total organic carbon (TOC) and 112.14 ml/g TOC, respectively. Both of the yields show an increase as the simulated temperature rises (Figure 3(a) and (f)), and the cumulative rate of CH4 is significantly higher than that of CO2. The C2–5 gas yields first increases with pyrolysis temperature and then decrease with increasing temperature when the maximum yield is obtained. The yields of gaseous hydrocarbons at different heating rates are significantly different than those at the low heating rate, which produces a higher gaseous yield at the same temperature. The wetness coefficient of gaseous (C2–5/C1–5) increases with the simulation temperature rise and then to decreases after the maximum is attained (Figure 3(g)).
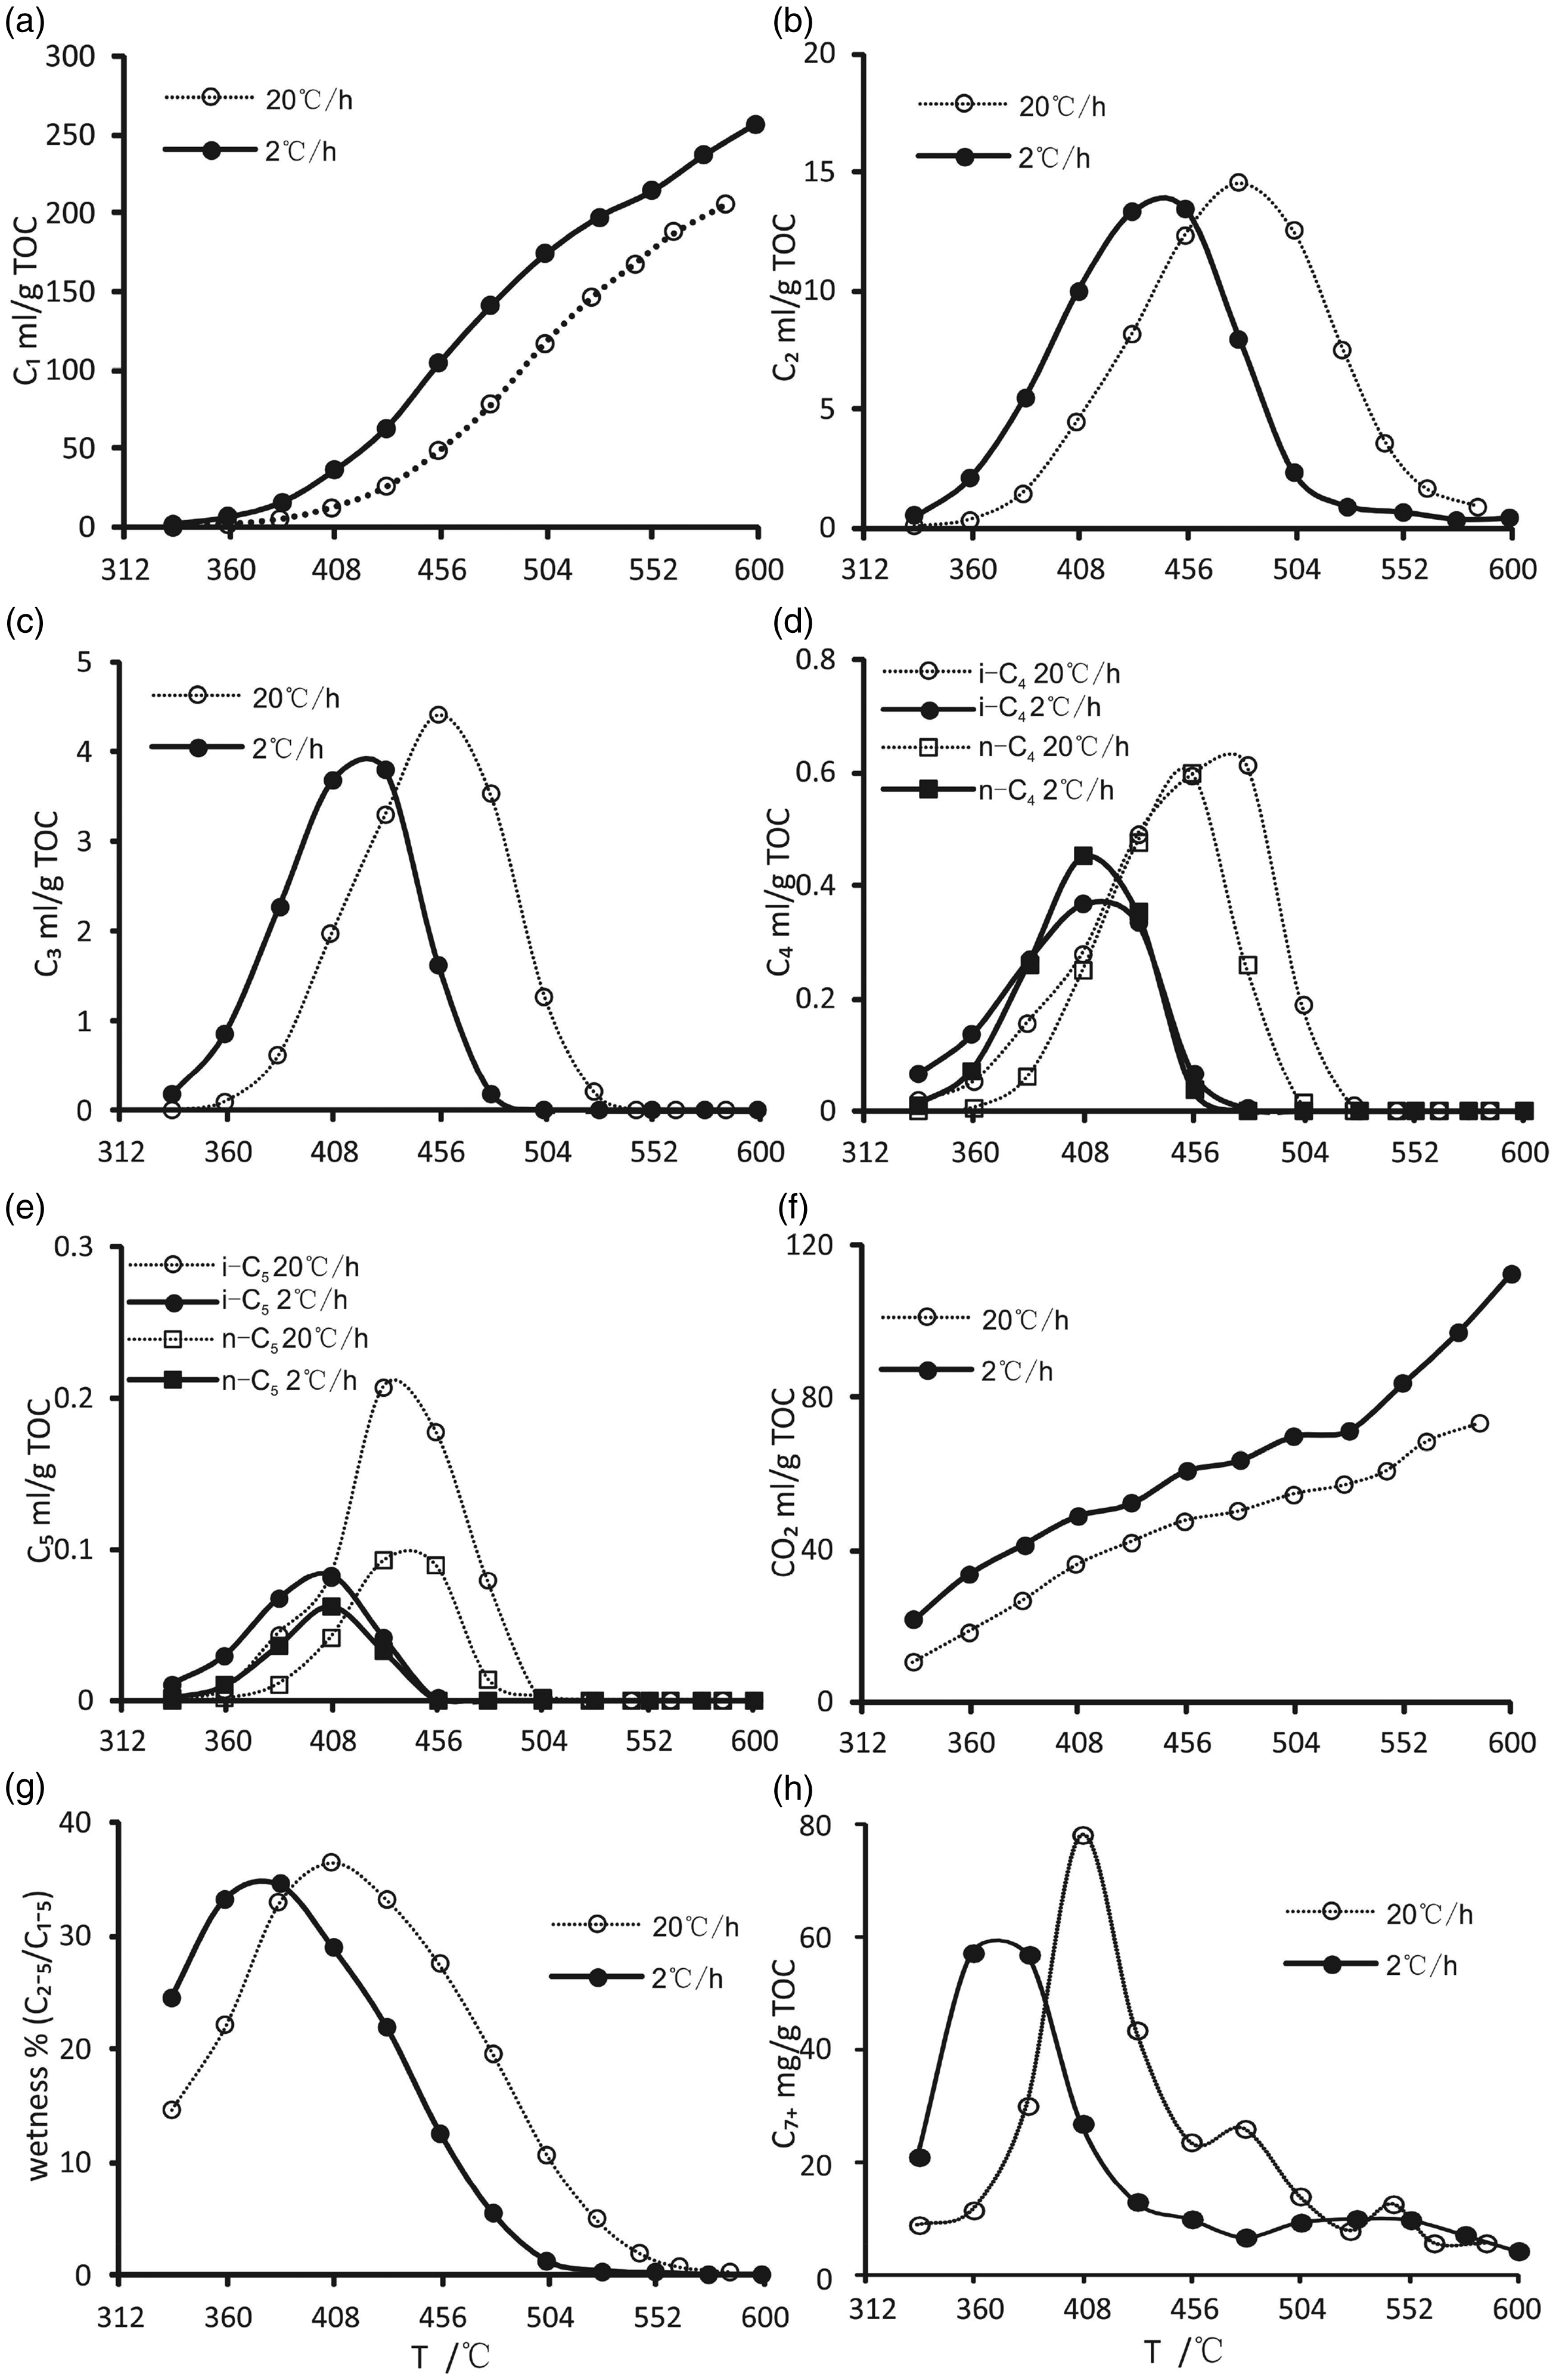
The fluid compositions yield during the simulation at different heating rates (a, CH4; b, C2H6; c, C3H8; d, C4H10; e, C5H12; f, CO2; g, wetness; and h, C7+). TOC: total organic carbon.
Yield of gas and liquid fluid from pyrolysis.
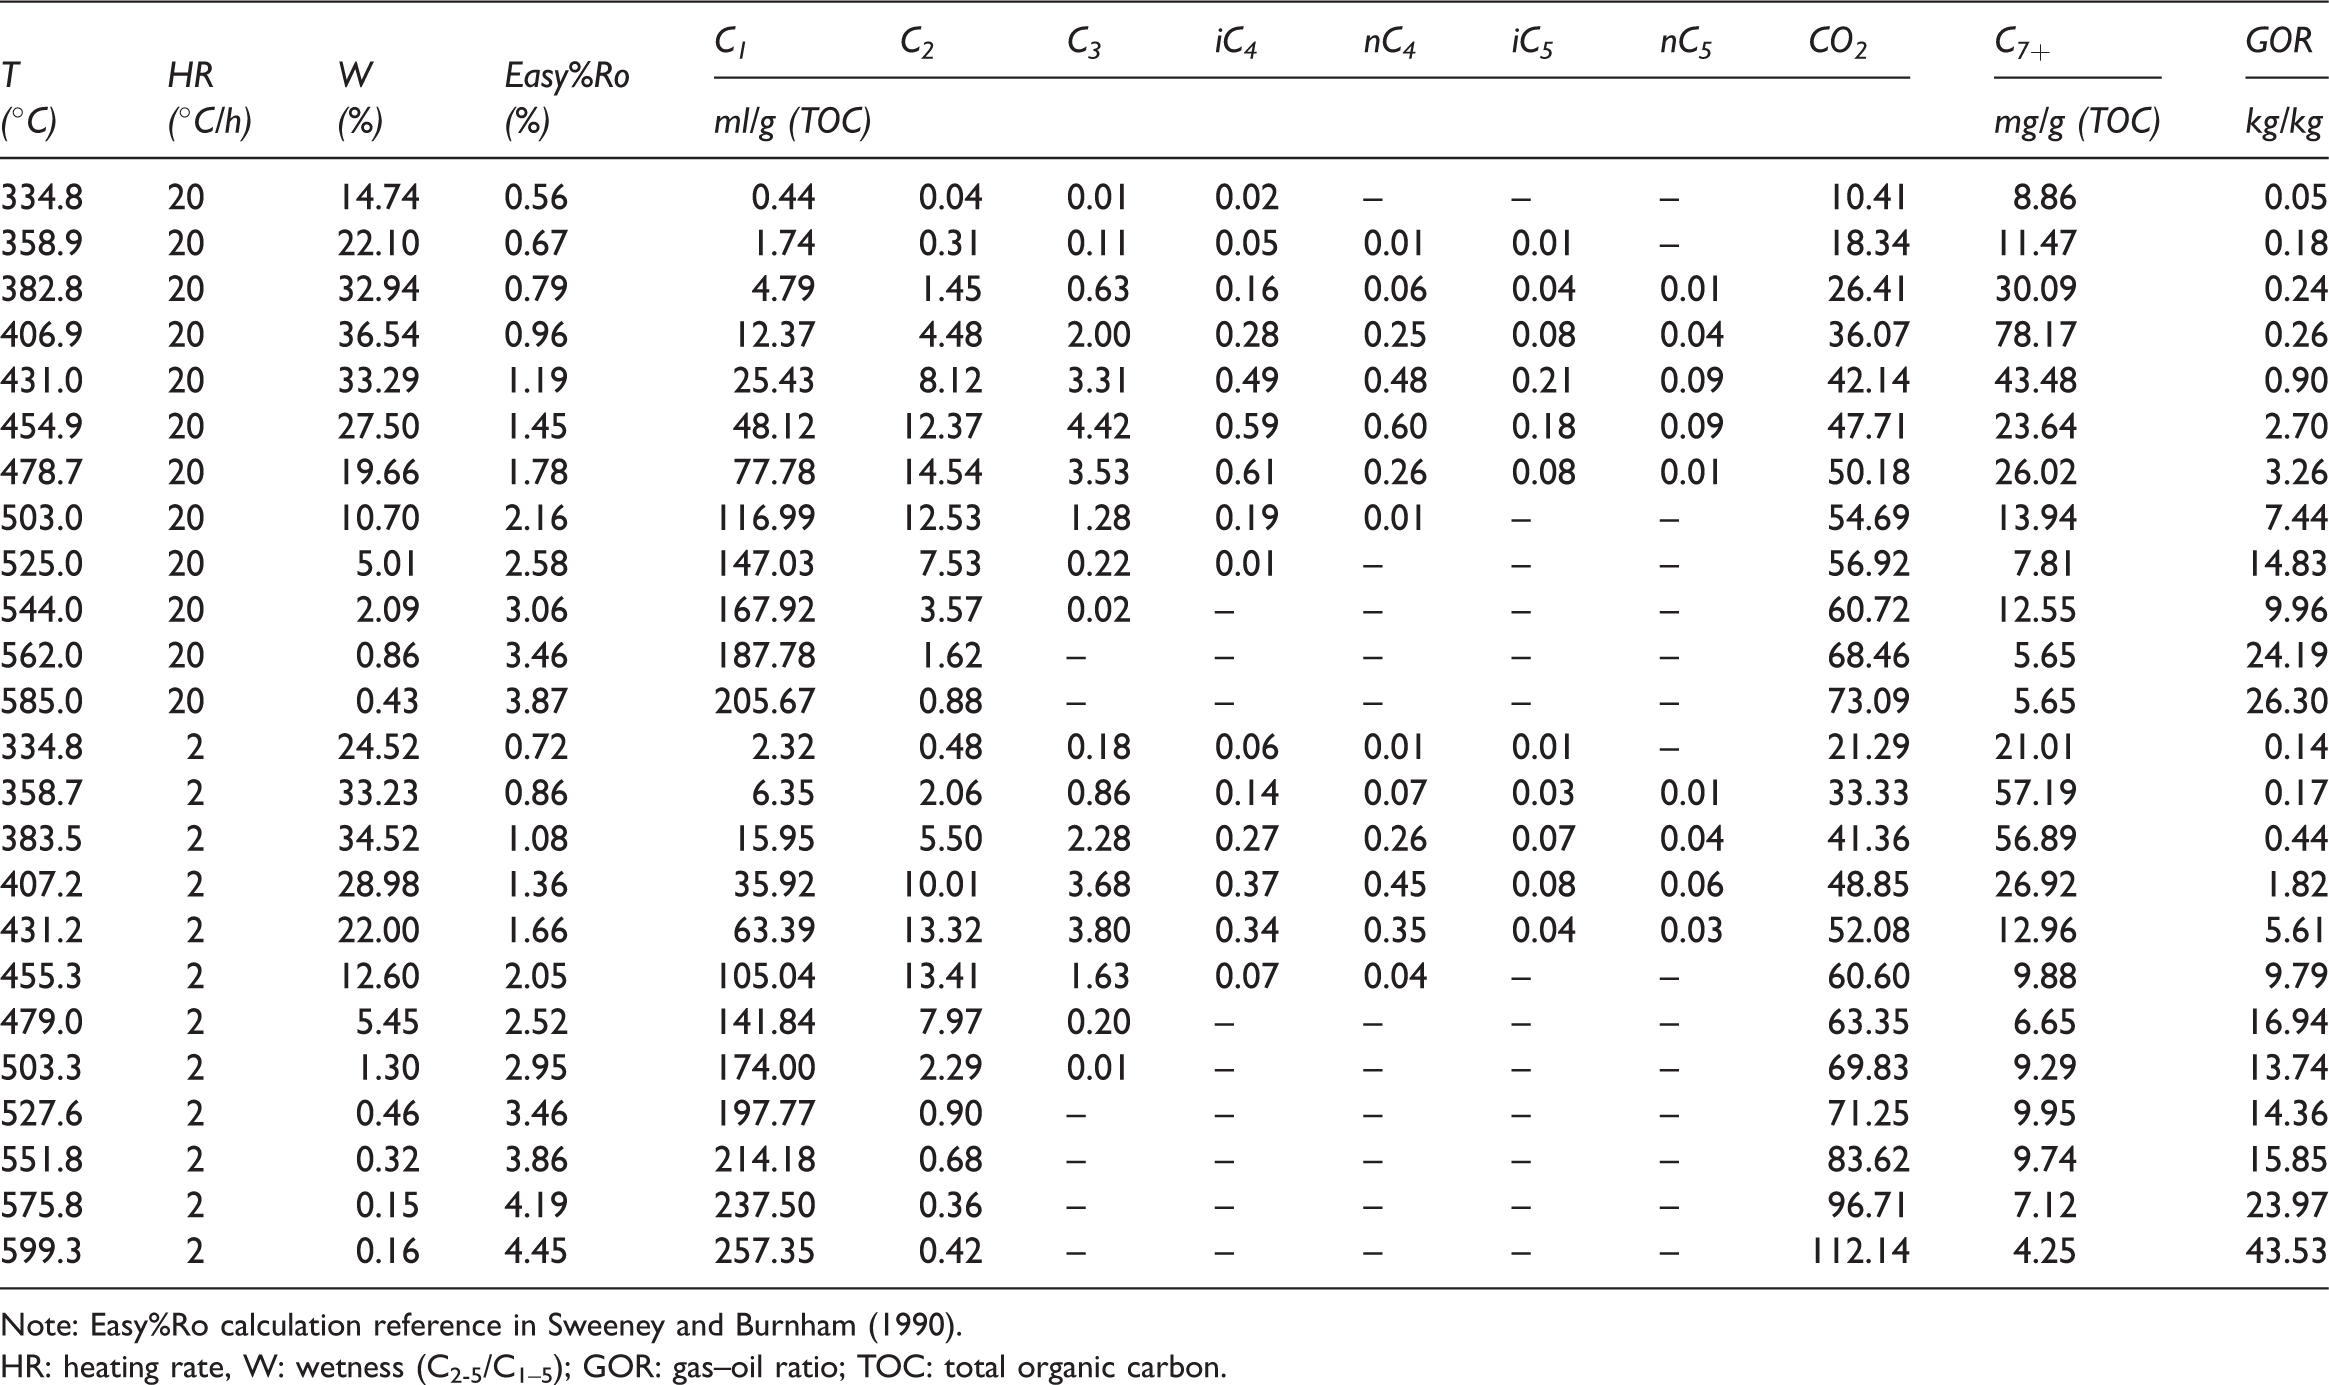
Note: Easy%Ro calculation reference in Sweeney and Burnham (1990).
HR: heating rate, W: wetness (C2-5/C1–5); GOR: gas–oil ratio; TOC: total organic carbon.
Kinetics parameters
The program of coal cracked to gas is always assumed that follows the first-order kinetics, which means that can be equal to a sum of a series of parallel first-order reactions(Cramer et al., 1998; He et al., 2018; Liao et al., 2014; Shuai et al., 2006; Wang et al., 2012; Xiong et al., 2004; Zhang et al., 2008). There is a compensation effect between the frequency factor (A) and the activation energies for hydrocarbon generation and destruction (Pepper and Dodd, 1995; Waples, 2000). To avoid this compensation effect, a frequency factor of 1.0 × 10¹⁴/s was assumed, and the activation energy was calculated by the software Kinetics 2000 (Braun and Burnham, 1998). A discrete distribution of activation energies was fitted. Figure 4 shows the activation energies of CH4 (Figure 4(a) and (b)) and C1–5 (Figure 4(c) and (d)) with mean value are 64.55 kCal/mol and 63.93 kCal/mol, respectively, which means that the temperature of the maximum generation rate of C1–5 is lower than that of C1. A similar activation energy distribution characteristic reflects that the CH4 cracking from the coal itself dominates the gaseous hydrocarbon generation process (Behar et al., 1995; Li et al., 2013; Ping’an et al., 2009). Additionally, it is verified that the cracking of the C2–5 provided a certain amount of the CH4 but not in dominate and that the maximum yield of CH4 was approximately 13 times of that of C2–5 in the experimental results.
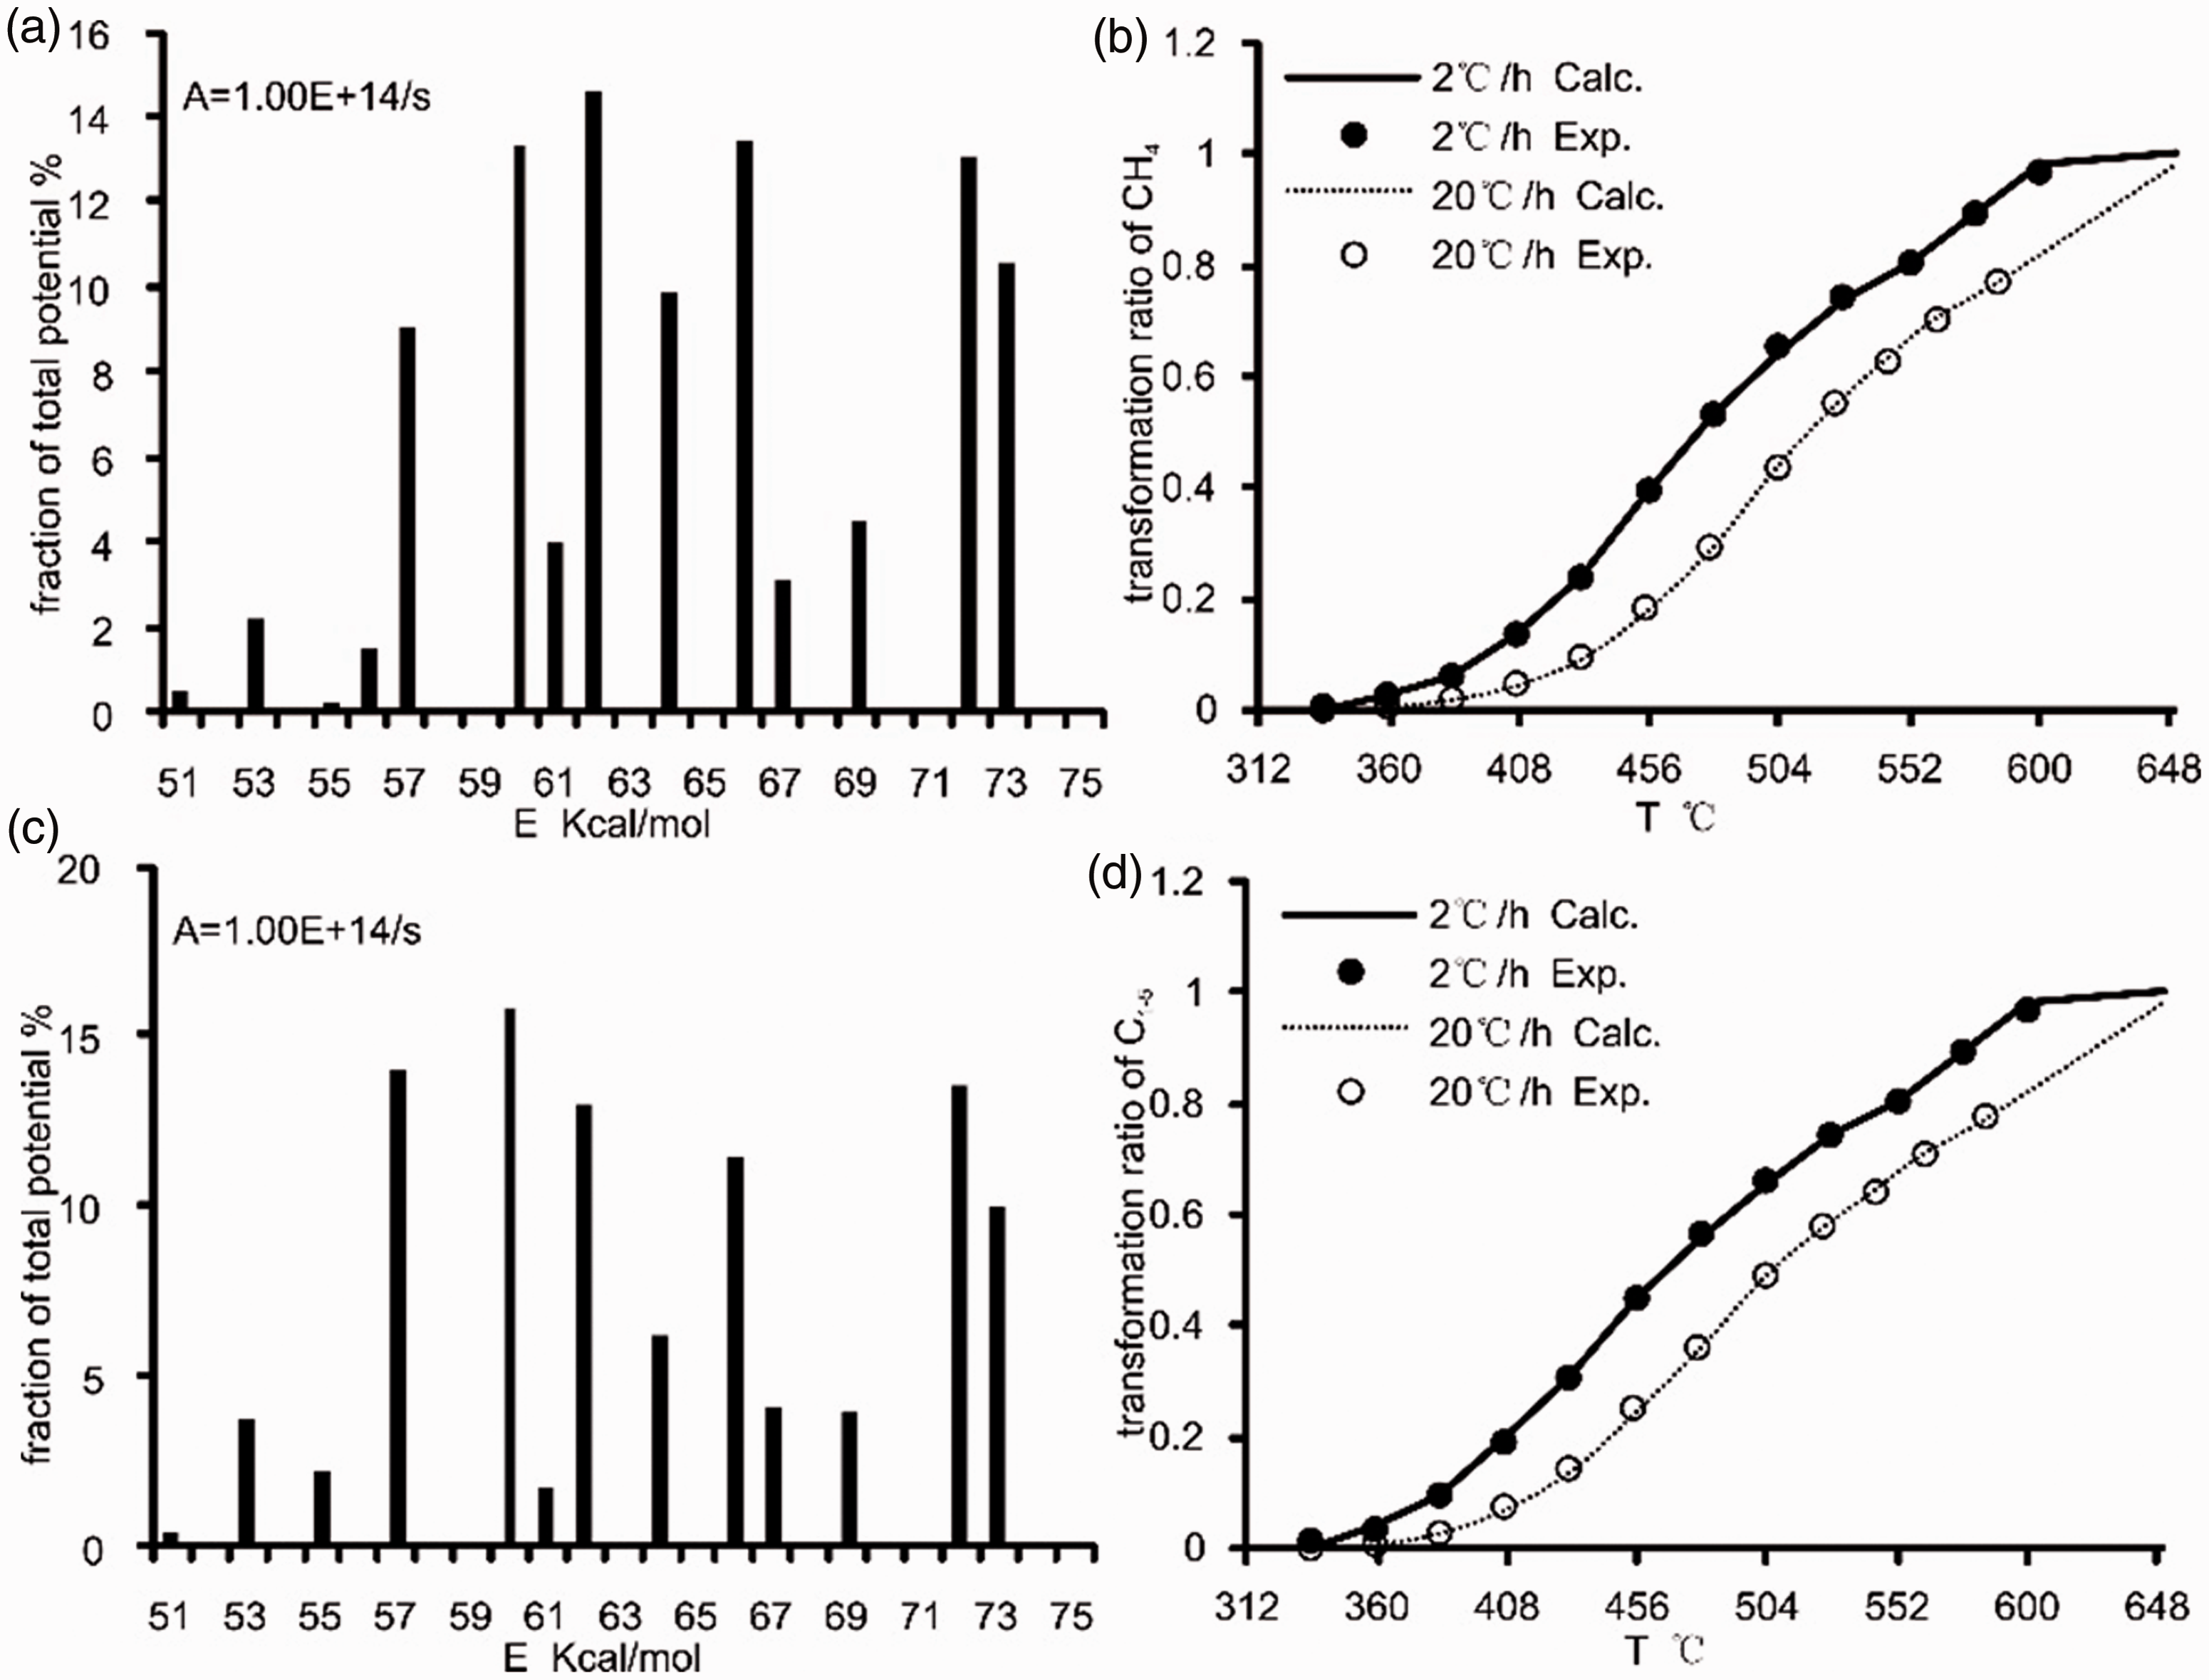
Kinetic parameters and fitting result for CH4 and C1–5 generated from coal pyrolysis (a, CH4-generated kinetic parameters; b, CH4-generated fitting result; c, C1–5-generated kinetic parameters; and d, C1–5-generated fitting result).
Discussion
Phase behavior of the coal-generated fluid
PVTsim phase simulation software of which uses the Peng–Robinson EOS (Peng and Robinson, 1976) is used to simulate the phase behavior of the pyrolysis fluid, and the fluid phase can be determined from Figure 5 (Pedersen and Christensen, 2007). The phase envelope was simulated by the fluid corresponding to the 2°C/h pyrolysis experiment listed in Table 2 because the fluid composition of the two heating rates have a similar evolution trends. It should be noted that the CO2 was not taken into account because it is very active under in situ geological conditions, and a variety of factors may cause the loss of CO2 such as diffusion, solubility in water, carbonate sedimentation, and microbial action (Ennis-King and Paterson, 2007; Killops et al., 1996; Shuai et al., 2013; Whiticar, 1999).
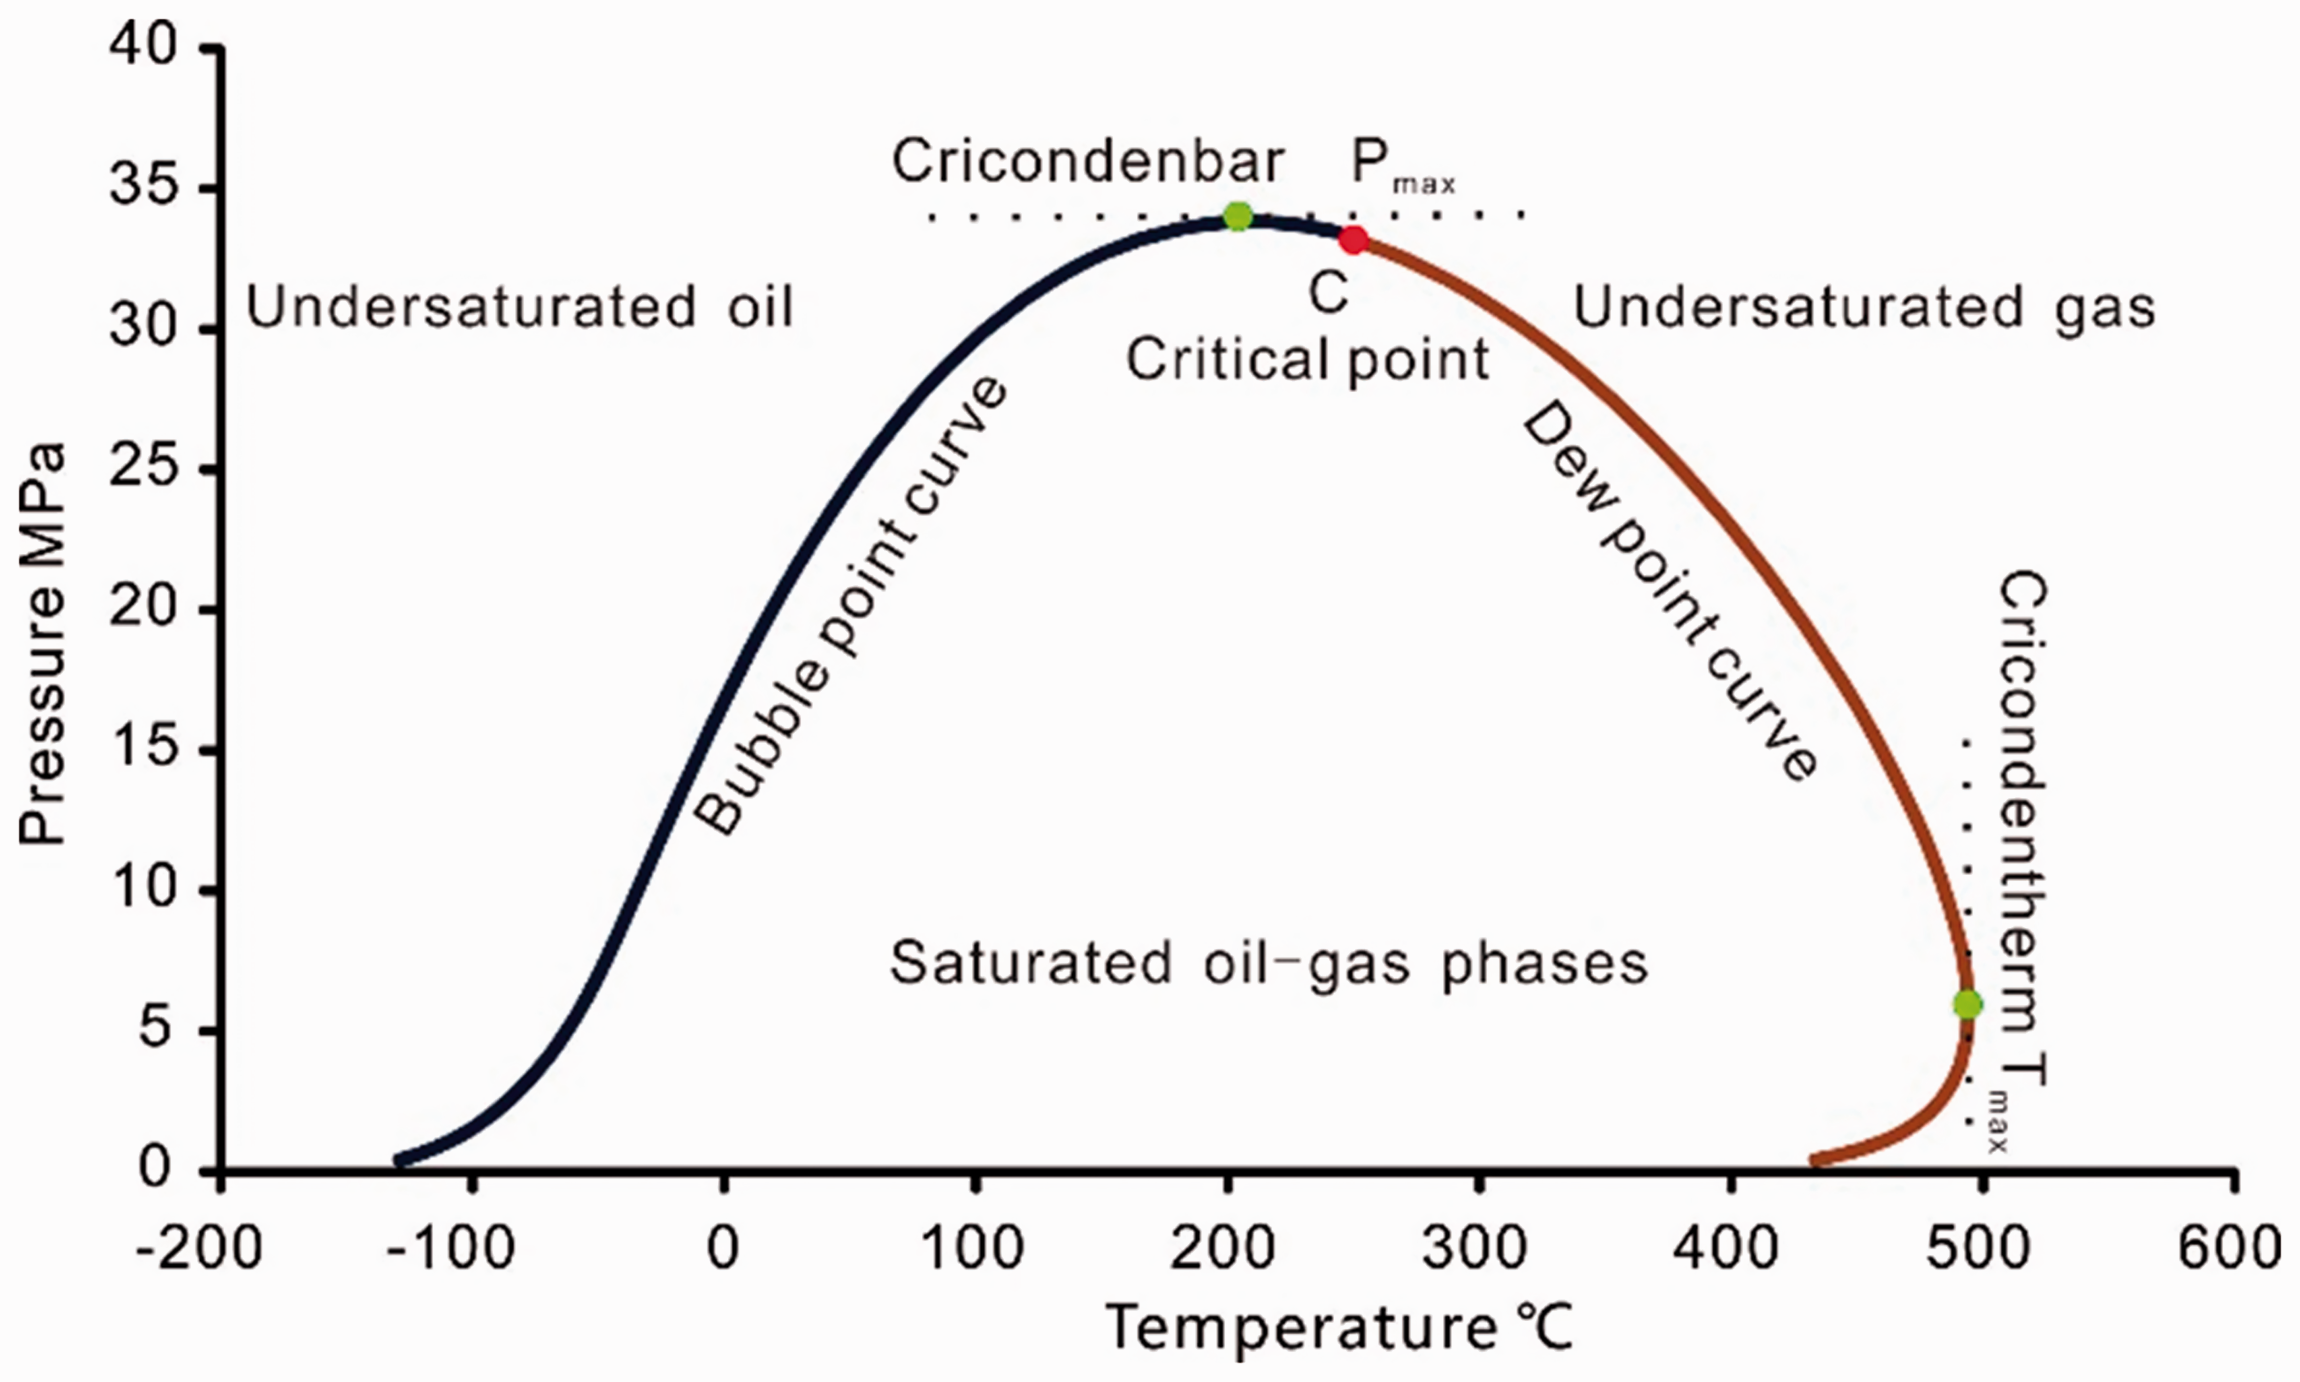
Phase envelope nomenclature (fluid compositions references from Pedersen and Christensen (2007)).
The phase envelopes of the pyrolysis products are shown in Figure 6. With an increase in Easy%Ro, the phase envelopes undergo a right-hand shift and then gradually contract and shift to the left possibly due to the lower yield of the C7+ component during the initial stage of the pyrolysis. The cricondentherm (Tmax) and cricondenbar (Pmax) first increase and then decrease; the critical point has an evolution similar to that of Tmax and Pmax in which it moves from the right side of the cricondenbar to the left when Easy%Ro >1.08.
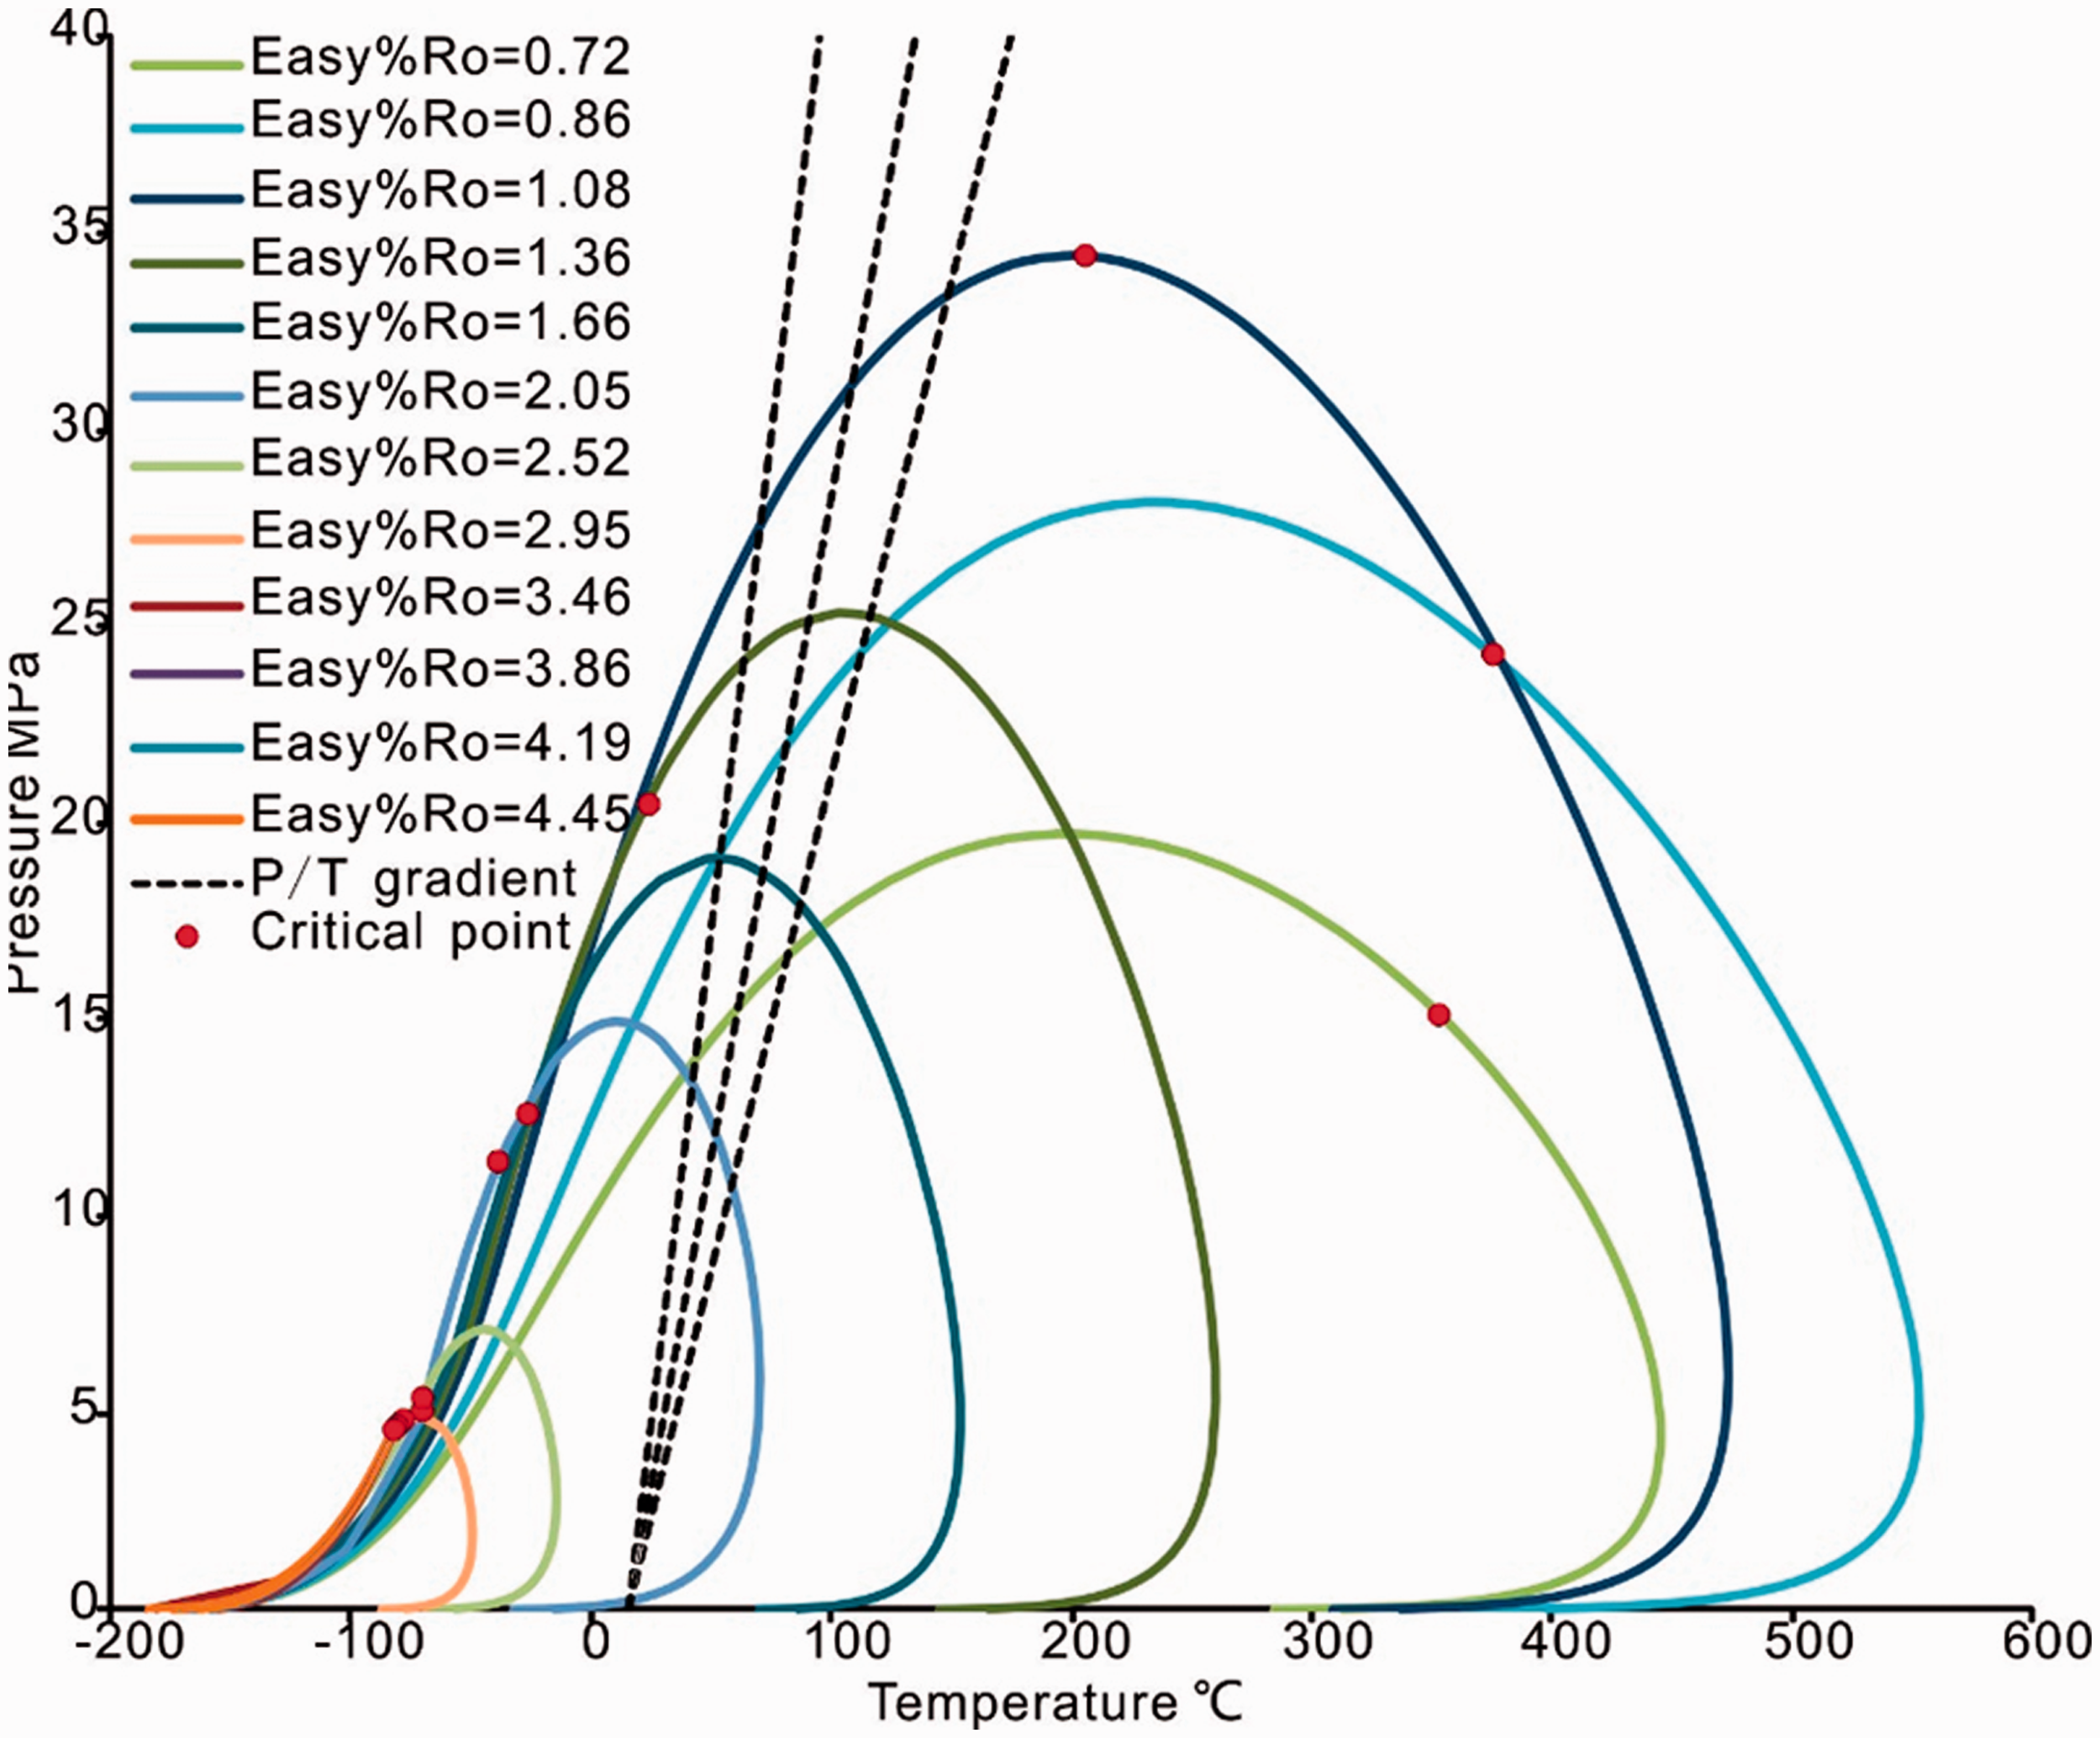
The phase envelopes of simulation products of 2°C/h heating rate.
Generally, hydrocarbon basins have normal hydrostatic pressure gradients in the shallow formations and possibly overpressure gradients or negative pressure gradients deeper in the system due to various geological factors (Osborne and Swarbrick, 1997); thus, a geothermal gradient of 30 ± 10°C/km and a pressure gradient of 10 ± 2 MPa/km are assumed. The phase behavior of hydrocarbons under geological conditions shows that when the Easy%Ro < 1.08, the hydrocarbon should be an undersaturated oil phase or an oil–gas phases but should not be a gas phase; when the Easy%Ro is between 1.08 and 1.36, any phase is possible because the critical point is approximately reflects the geological conditions; when the Easy%Ro is between 1.36 and 2.05, it should be an undersaturated gas phase or an oil–gas phase but should not be an oil phase; and when the Easy%Ro > 2.05, only gas phase is possible.
Figure 7 shows the phase evolution characteristic of hydrocarbon generation during the experiment combined gas–oil ratio (GOR (in kg/kg)) evolution characteristics. The location of the critical point is closely related to the phase behavior: when the critical point is located to the left of the cricondenbar point, the fluid is in a liquid phase, and when it is to the right of the cricondenbar point, the fluid is in a gas phase (Chen et al., 1999). As Figure 7 shows, the phase envelope shows a liquid phase when the Easy%Ro < 1.36 that the GOR < 1.82 kg/kg. With the increase in thermal evolution, the oil cracked, and much more gas hydrocarbon was generated from coal cracking. The GOR increased above 9.79 kg/kg and the cricondentherm decreased to below 50°C when the Easy%Ro > 2.05, which indicates that the fluid phase could only be gas phase. This method is similar to the above discrimination result.
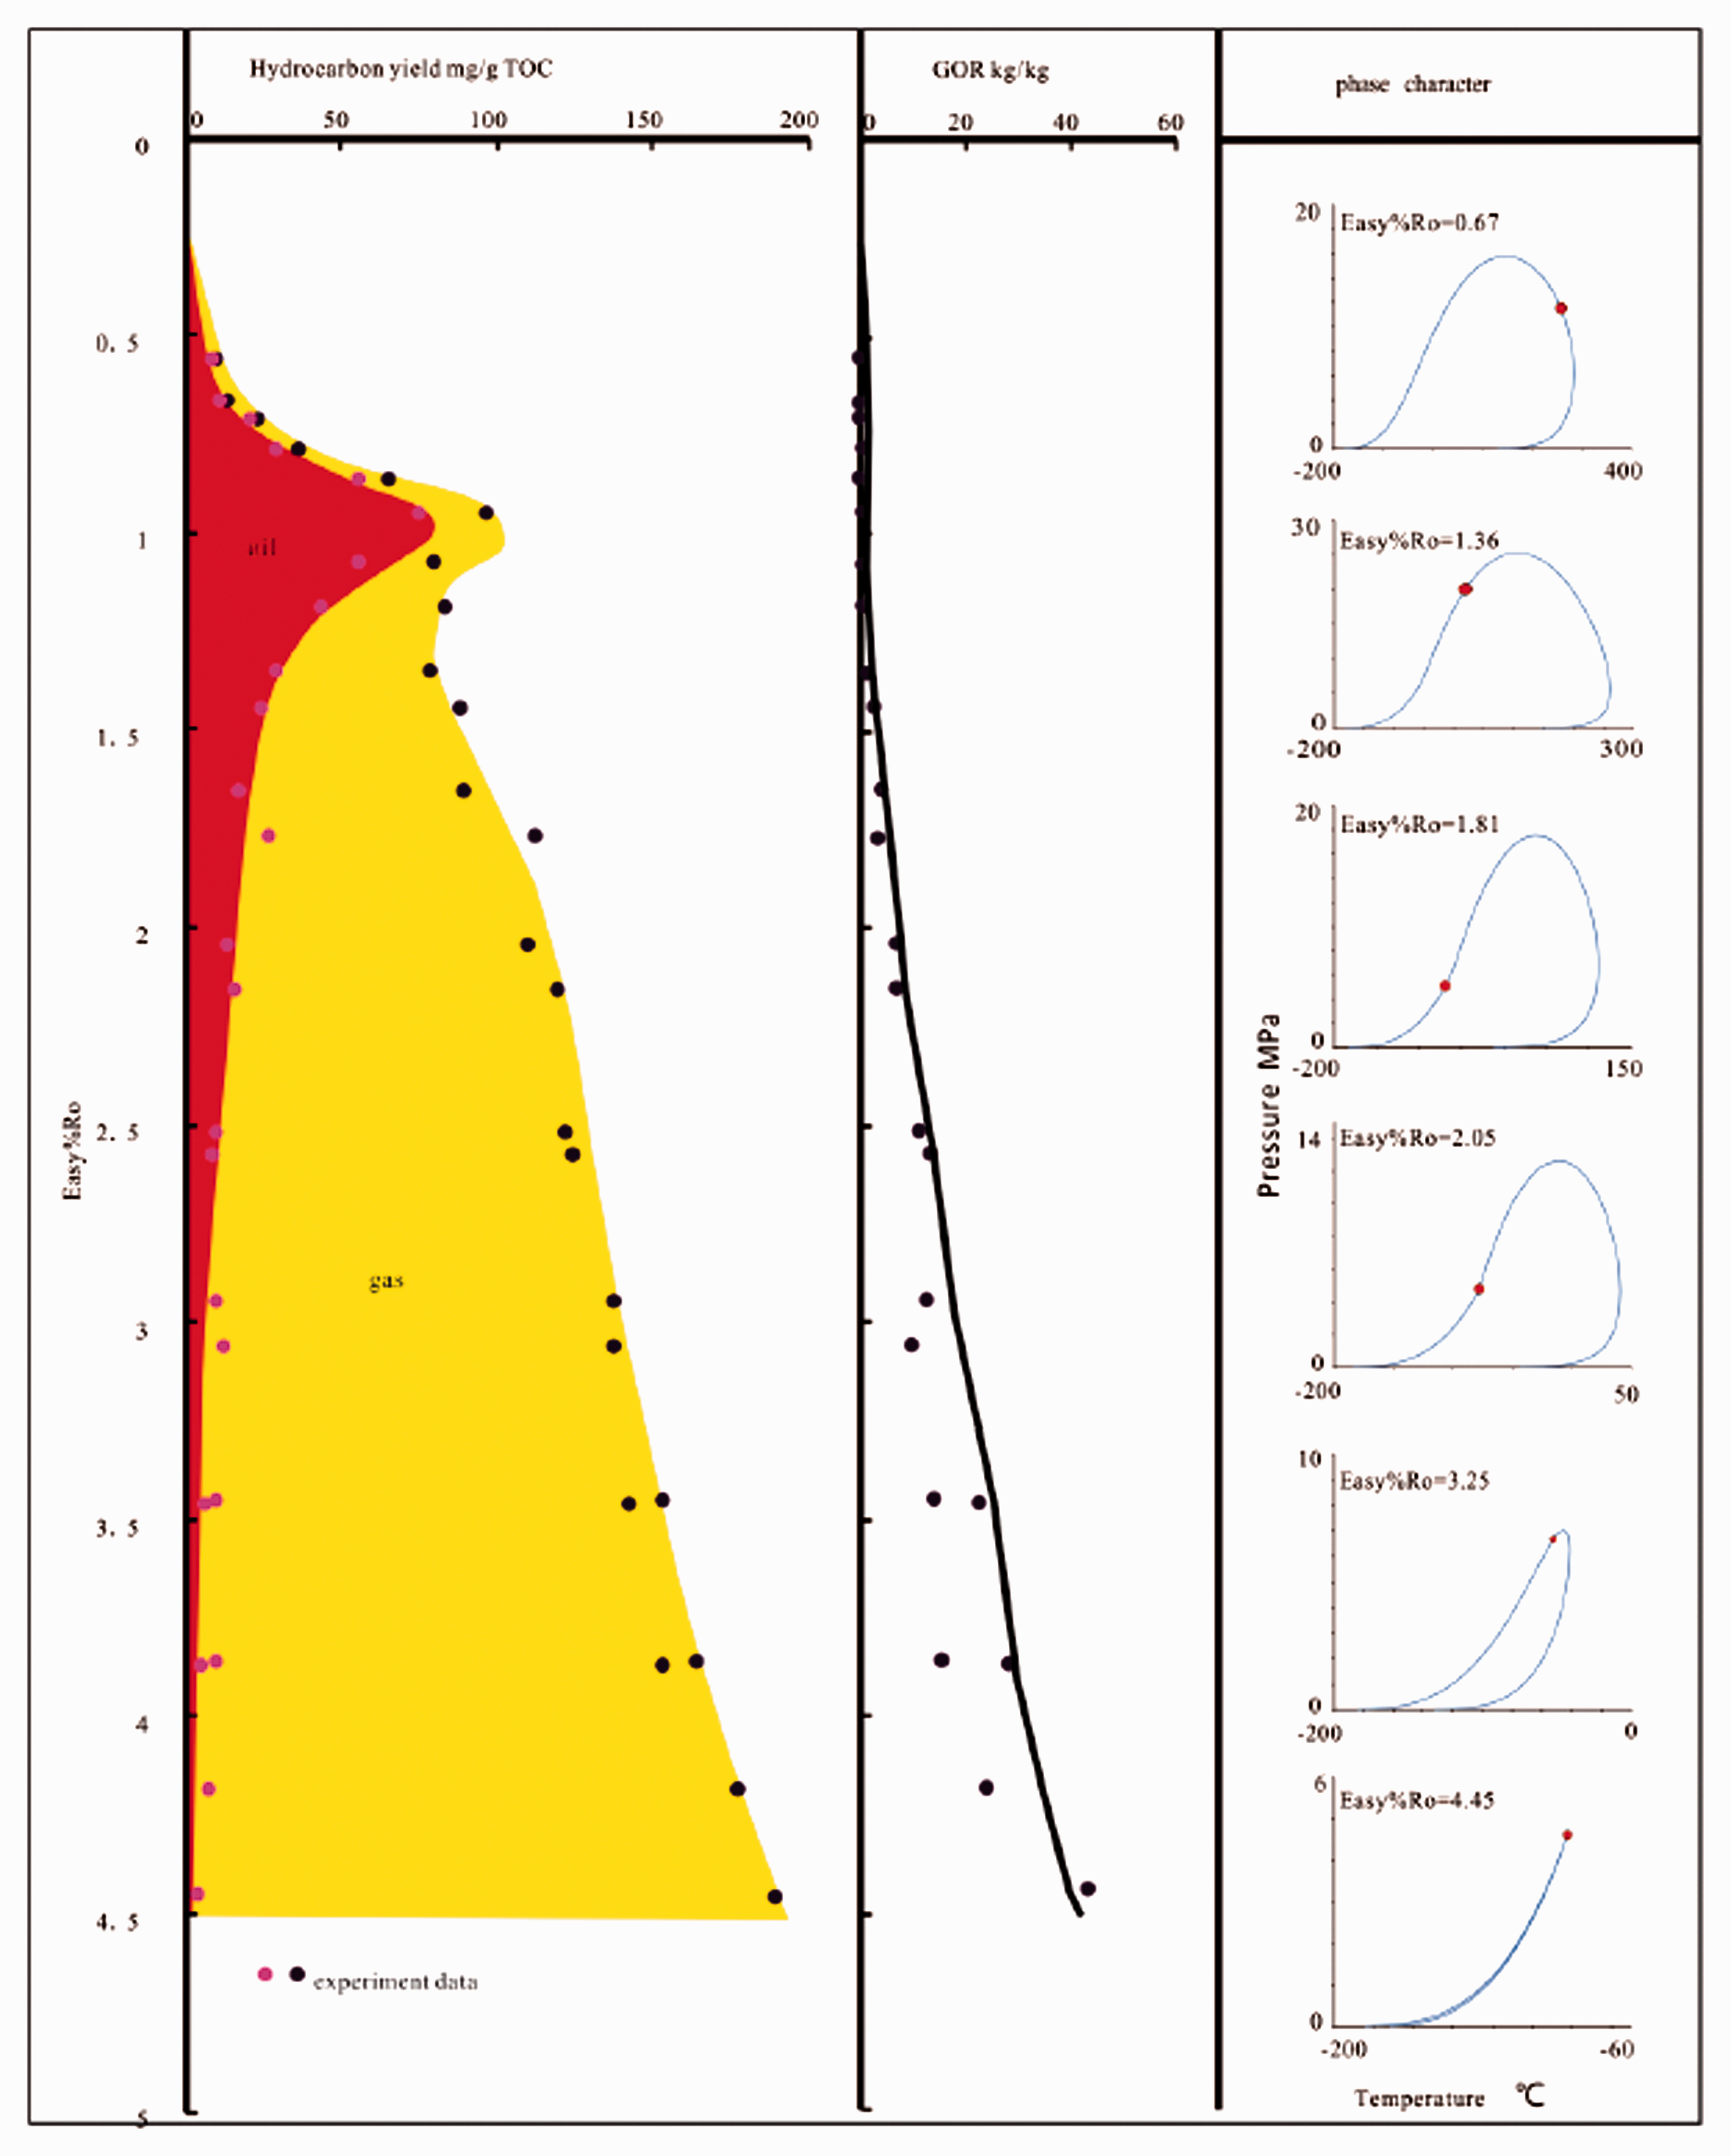
Relationship between hydrocarbon generation and phase evolution characteristics. GOR: gas–oil ratio; TOC: total organic carbon.
It is worth noting that the total hydrocarbon yield decreased when the Easy%Ro increased from 0.96 to 1.36 which is consistent with the rapid cracking stage of oil, indicating that the cracking of the oil led to a considerable amount of dead carbon, more than the gas yield that generated from coal and oil cracking.
Phase evolution of the Minhe Basin
CH4 is a fluid composition that accompanies the formation and evolution of any hydrocarbon reservoir, and there is a clear correlation between the natural gas wetness coefficient and fluid phase behavior (Nasriani et al., 2014; Pedersen et al., 2014; Zhang et al., 2013). The evolution of C2–5 can be obtained from the kinetic parameters of CH4 and C1–5 (Dieckmann et al., 2004), and the wetness coefficient can be determined. The laboratory kinetic results can be extrapolated to geological conditions from the geothermal history (Behar et al., 1997; Liu and Tang, 1998; Tang et al., 1996). The Jurassic source rock of the Minhe Basin underwent two uplifts and denudations in the late Early Cretaceous and middle of Oligocene, and the source rock experienced a maximum paleotemperature approximately 140°C in the middle of Oligocene (Figure 8) (Zhang and Chang, 2000). According to the thermal evolution of Bacan 1 well, the correlation of the phase behavior and hydrocarbon gas generation was studied, and the Easy%Ro (Sweeney and Burnham, 1990) method was used to reconstruct the phase evolution.
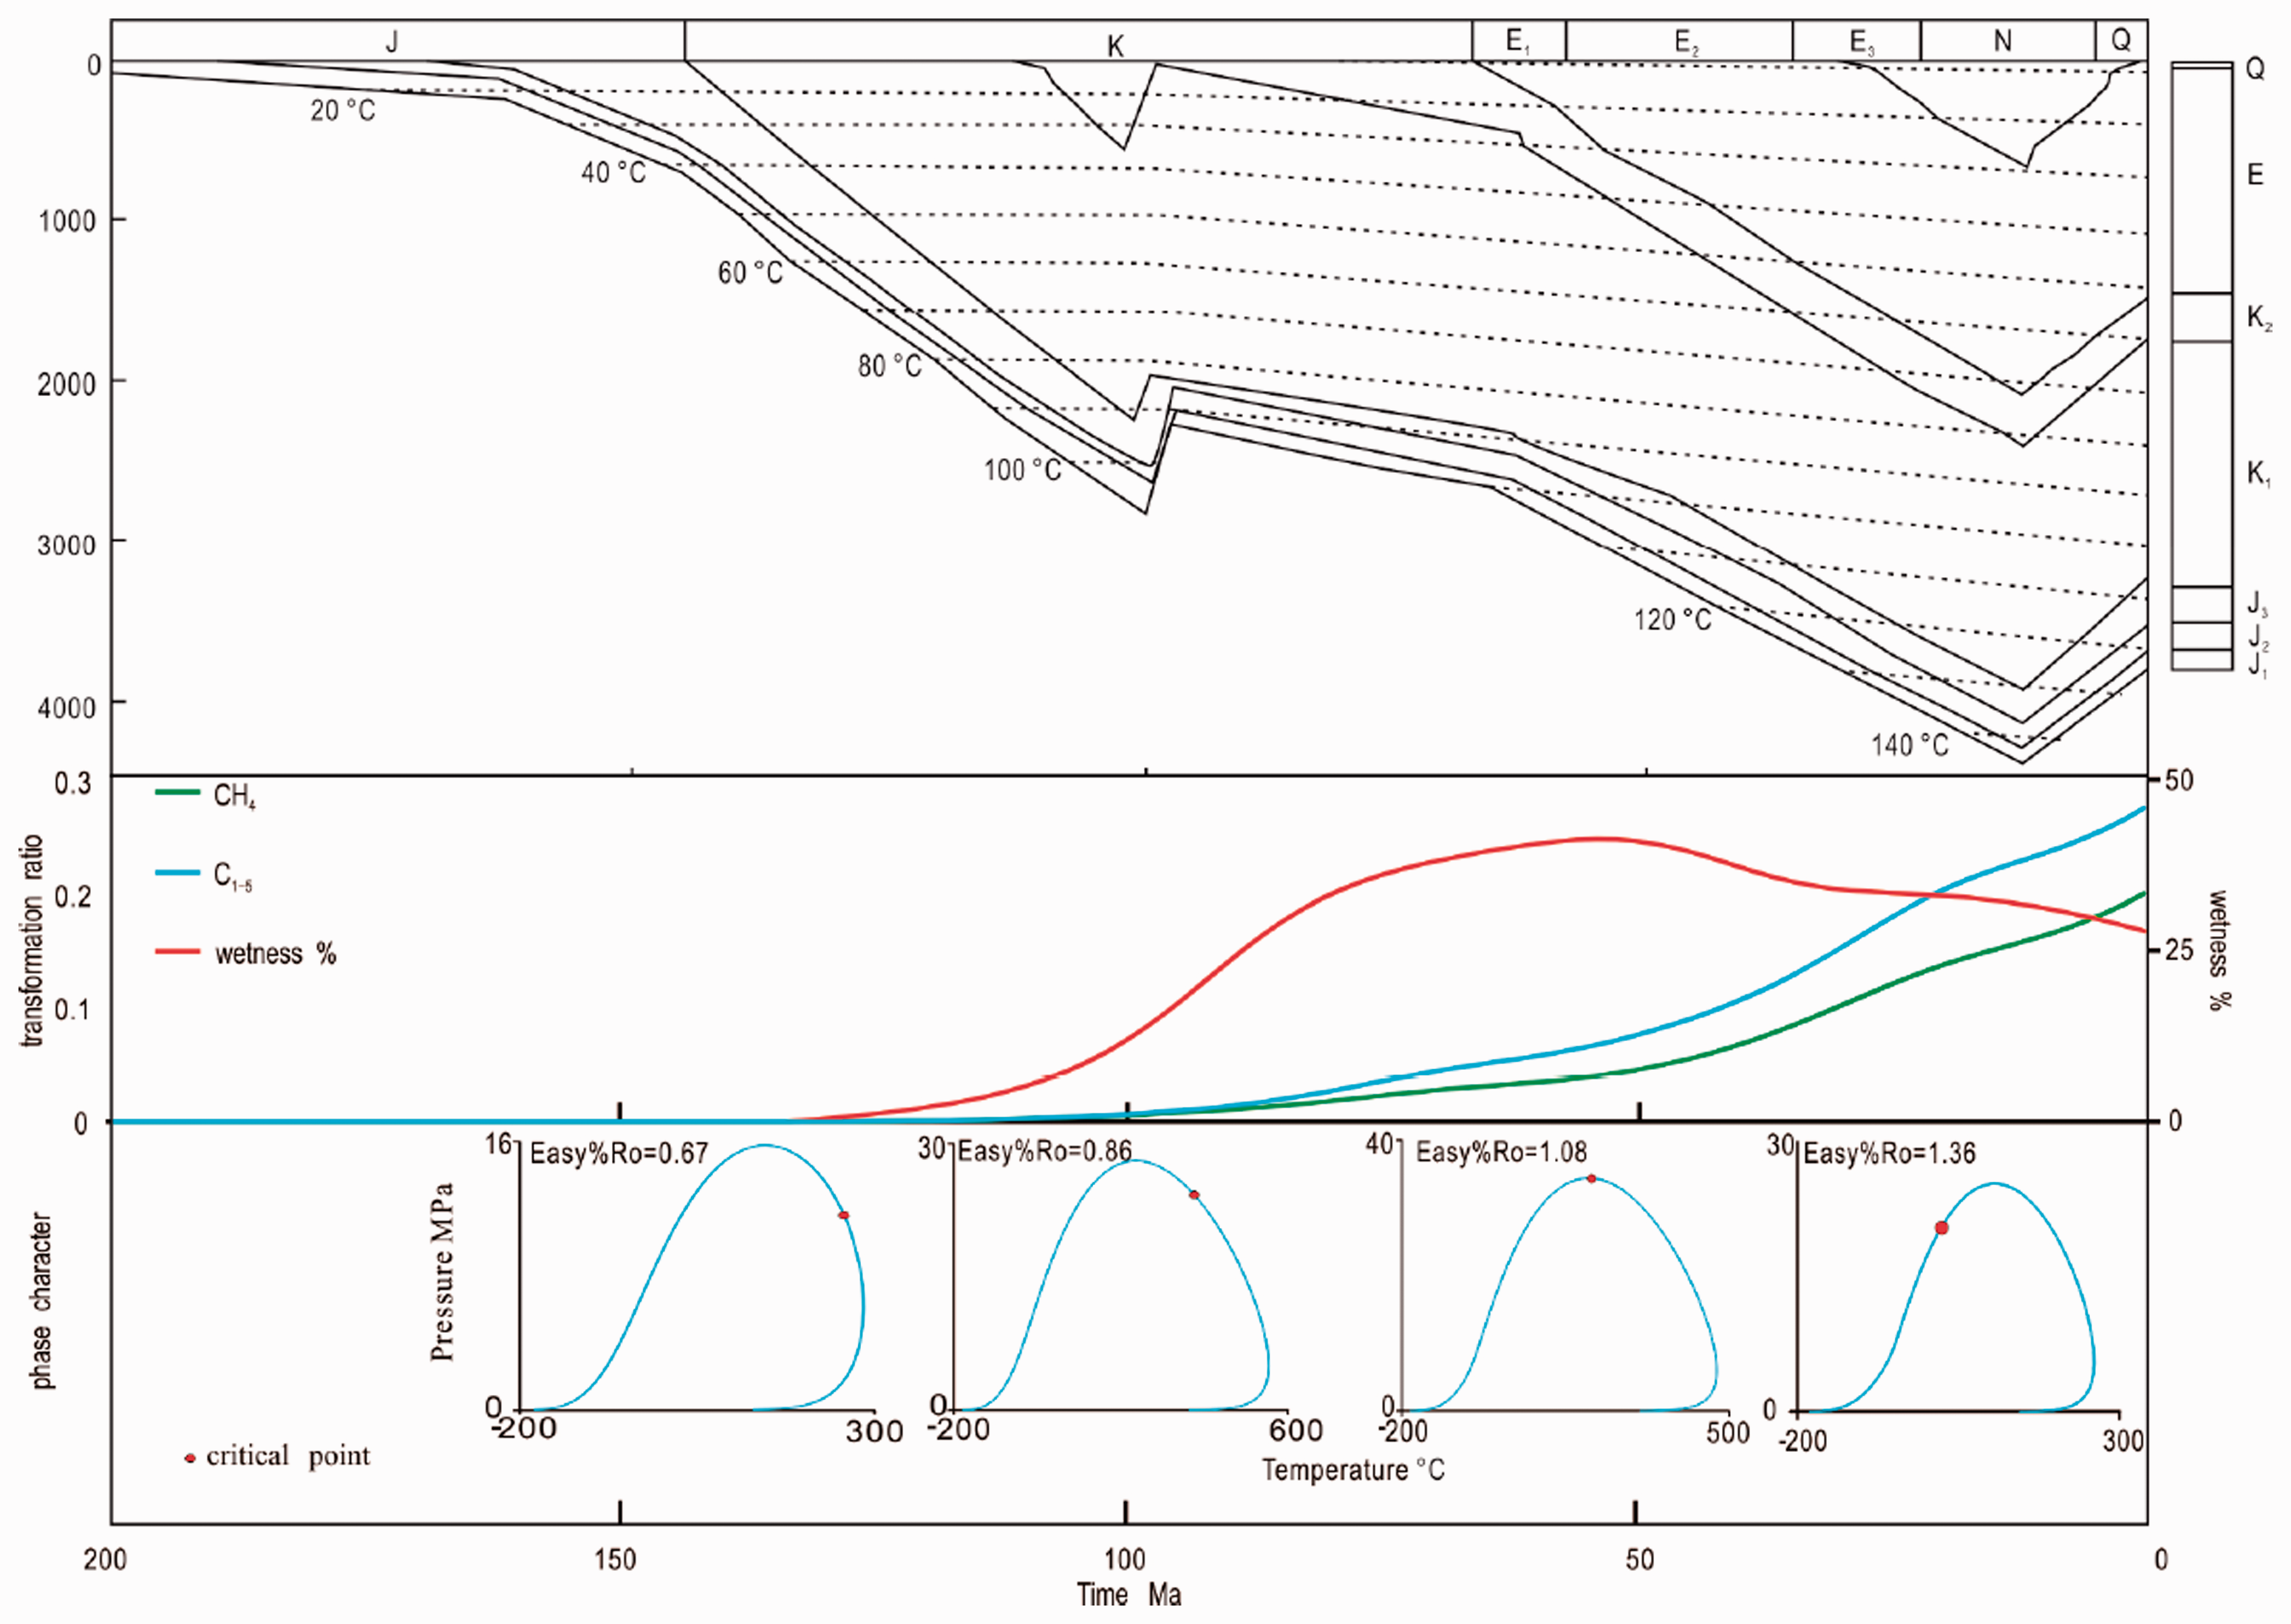
Relationship between gas generation and phase evolution characteristics of Bacan 1 well.
The gas generation history and phase evolution are shown in Figure 8. The simulation results shows that the hydrocarbon generation from the Jurassic coal started in the Early Cretaceous as an oil phase, with the rise of thermal maturity, the cricondentherm increased, and when the uplifts in the late Early Cretaceous occurred, the fluid phase have changed from oil phase to oil–gas phases. The Minhe Basin experienced a period of stable deposition from the Late Cretaceous to the Miocene and the transformation ratio (TR) of CH4 and C1–5 increased rapidly. The wetness coefficient reached a maximum of 40% in the Eocene, with the fluid transitioning to a near-critical phase. The fluid changed to a gas phase after the Miocene. The uplifts that began in the Miocene did not change the fluid phase because the Jurassic formation pressure should be higher than the cricondenbar of the fluid, and the source rock is currently still in the gas generation stage.
Both the experimental data of the coal and the simulated result of the Bacan 1 well show that the coal-generated hydrocarbon fluid produced a low yield of liquid hydrocarbon and a large amount of the gaseous hydrocarbon. Considerably more gaseous hydrocarbon indicates a higher GOR, and hydrocarbon migration is much easier. From empirical methods and EOS calculation methods, England et al. (1987), England and Mackenzie (1989), and Ungerer et al. (1981) concluded that there is no oil–gas phase expulsion when the fluid undergoes initial hydrocarbon expulsion in the source rock. However, gaseous hydrocarbons promote the asphaltene precipitation (Werner et al., 1996), which means that the initial migration of the coal-generated hydrocarbons would enrich the light hydrocarbon components and that phase differentiation will occur and lead to an oil–gas phases when the fluid saturation pressure is reached during the petroleum migration process (Larter and Mills, 1991).
Conclusions
The mean values of activation energies of C1 and C1–5 are 64.55 kCal/mol and 63.93 kCal/mol, respectively, with a fixed frequency factor of 1.0 × 10¹⁴/s.
The coal-generated hydrocarbon fluids under geological conditions shows that there should be an undersaturated oil phase or an oil–gas phase when the Easy%Ro < 1.08; any phase is possible when the Easy%Ro is between 1.08 and 1.36; an undersaturated gas phase or an oil–gas phase when the Easy%Ro is between 1.36 and 2.05; and a gas phase when the Easy%Ro > 2.05.
The hydrocarbon generation from the Jurassic coal of the Minhe Basin started in the Early Cretaceous as an oil phase, and the fluid phase may have changed from oil phase to oil–gas phase in the late Early Cretaceous. The fluid changed to gas phase after the Miocene, and the source rock is still in the stage of gas generation.
Footnotes
Authors' Note
Xu Guosheng is now affiliated with College of Energy, Chengdu University of Technology, Chengdu, PR China. Tian Tao is now afiliated with Key Laboratory of Coal Exploration and Comprehensive Utilization, Ministry of Land and Resources, Xi'an, PR China.
Declaration of conflicting interests
The author(s) declared no potential conflicts of interest with respect to the research, authorship, and/or publication of this article.
Funding
The author(s) disclosed receipt of the following financial support for the research, authorship, and/or publication of this article: This research is financially supported by the National Science and Technology Major Project, Grant No. 2016ZX05003002-004 and 2016B-05–02; the Independent Project of Key Laboratory of Coal Exploration and Comprehensive Utilization, Ministry of Land and Resources (ZP2018-1); and National Natural Science Foundation of China, Grant No. 41872147.