
Abstract
Accurate estimation of carbon dioxide adsorption capacity in coal seam is very important for planning the carbon dioxide storage efforts of carbon capture and storage technology; however, an appropriate model is needed to convert the measured adsorption quantity to absolute adsorption quantity. In this work, carbon dioxide adsorption behavior is demonstrated and accurately predicted under a wide range of temperature and pressure using the dual-site Langmuir model. This model sufficiently explains the laboratory measurements of carbon dioxide adsorption equilibrium data across critical points in coal. The results show that the isotherms crossover beyond the Gibbs excess maximum and higher temperatures now result in higher excess uptake at equivalent pressures. Adsorbed phase volume and gas phase density of carbon dioxide change with equilibrium temperature and pressure, and the contribution of the volume–density term for the absolute adsorption gradually becomes less pronounced as the temperature increases. If only the excess adsorption quantity is taken, the result is a very large underestimation of the contribution of adsorbed carbon dioxide to the total content. As the coal seam depth increases, the contribution rates of actual adsorbed carbon dioxide quantity to total carbon dioxide storage quantity gradually decrease; however, the contribution rates of free carbon dioxide phase content gradually increase. The method used herein, with limited formulas and fast computing solutions, provides accurate estimations of the true carbon dioxide storage, which will lay the foundation for the research and development of carbon capture and storage technology.
Keywords
Introduction
Due to the high consumptions of fossil fuels (coal, oil, natural gas, etc.), global atmospheric carbon dioxide (CO2) and other greenhouse gases concentrations have been increasing substantially in the last few decades, which causes global warming and other environmental issues (Aminu et al., 2017; MacDowell et al., 2010; Merey and Sinayuc, 2016; Shukla et al., 2010). Many countries are actively developing new and renewable energy sources, such as solar energy, hydroenergy, nuclear energy, biomass energy and so on, but these alternative energy sources only account for about 13% of world energy consumption and are far from enough to meet the world energy demands, which means that greenhouse gas emissions generated by direct consumption of fossil fuels (coal, oil and natural gas) will continue to increase in the future for a very long time, and the global warming will exacerbate the environmental degradation (Ranathunga et al., 2017). In order to slow down the speed of environmental degradation and not affect economic development, the key issue is to reduce greenhouse gas emissions, especially CO2. And as one of the implementing measures, carbon capture and storage (CCS) technology is the most effective way (Bruant et al., 2002; Haszeldine, 2009; Merey and Sinayuc, 2016), which can capture up to 90% of the CO2 emissions produced from the use of fossil fuels in electricity generation and industrial processes. In recent decades, a series of geological storage technologies have been developed for enhanced recovery of conventional oil and gas, coalbed methane and shale gas by injecting CO2, and CO2 is stored in oil and gas fields, coal seams and shale rock (Brown et al., 2017; Massarotto et al., 2010; Merey and Sinayuc, 2016; Ranathunga et al., 2017; Saghafi, 2010). And CO2-enhance oil recovery (CO2-EOR) and CO2-enhance gas recovery (CO2-EGR) have obtained the considerable development.
Compared with CO2-EOR and CO2-EGR, CO2-enhanced coal bed methane (CO2-ECBM) is still in the attempt and grope stage; however, coal seams have considerable potential for CO2 sequestration reaching 300–964 Gt in the world (Kuuskraa et al., 1992), which has aroused extensive attentions of many scholars (White et al., 2005; Zhang et al., 2011). So far, the research achievements of CO2 sequestration in coal seams mainly include the following five aspects: (1) pure CO2 or CH4 adsorption properties in coal under the different reservoir conditions (temperature, pressure, coal metamorphism degree and equilibrium water content) (Dutta et al., 2008; Fitzgerald et al., 2003; Kuuskraa et al., 1992; White et al., 2005; Zhang et al., 2011), (2) Mixed CO2/CH4 adsorption properties in coal under the different reservoir conditions (Clarkson and Bustin, 2000), (3) CO2 displacement behavior for saturated CH4 in coal (Zhang et al., 2011; Zhou et al., 2013), (4) coal matrix swelling effect of CO2 adsorption (Perera et al., 2011), and (5) CO2 sequestration potential evaluation and example analysis in coal seam (Bachu, 2007; Saghafi et al., 2008). All these researches will be helpful to understand the potential benefits and practical issues for CO2 sequestration in coal seams (Connell et al., 2013; Sams et al., 2005; White et al., 2005; Wong et al., 2007).
According to the results of previous experiments, as we all know, the adsorption amount of CO2 in coal is much larger than that of methane under the same temperature and pressure, which indicates that the affinity between CO2 and coal is higher than that between methane and coal (Busch et al., 2003; Clarkson and Bustin, 2000; Dutta et al., 2008; Fitzgerald et al., 2003; White et al., 2005; Zhang et al., 2011). In order to evaluate the CO2 storage potential of coal seams, especially deep unmineable coal seams, the first step is to evaluate the adsorption capacity of CO2 in coal via isothermal sorption tests (Wang et al., 2009). However, because of the heterogeneous properties of coal, scCO2 (supercritical CO2) adsorption behavior in coal has not attracted research attention. And there are inconsistent test phenomena reported regarding scCO2 adsorption in coal. Some researchers show a monotonically increasing quantity of scCO2 excess adsorption with increasing pressure for a physical adsorption system, which satisfies type I adsorption (Abunowaraa et al., 2016; Guan et al., 2018; Prusty, 2008; Ranathunga et al., 2017; Saghafi et al., 2008; Vishal et al., 2015). However, other researchers suggest that the shape of CO2 adsorption isotherm in coal also belongs to type I at low pressures. The adsorbed quantity will reach a maximum value with the increase of pressure and then gradually decrease (De Silva and Ranjith, 2014; Fitzgerald et al., 2003; Kim et al., 2011; Massarotto et al., 2010; Pini et al., 2010; Romanov et al., 2013; Sakurovs, 2012). In fact, even at higher temperatures, the adsorption isotherm will also have a maximum value if the pressure is high enough (Malbrunot et al., 1992). At the same time, there is an issue that the measured adsorption isotherm of CO2 in coal is the excess adsorption quantity of CO2, while the absolute adsorption quantity of CCS is actually applied. Therefore, it is necessary to build an appropriate model which not only describes the adsorption isotherm of supercritical gas but also reveals the adsorption mechanism. This is one of the basic steps to develop CCS technology. At present, a number of semi-empirical models have been adopted by revising the classic Dubinin–Astakhov (D–A), Dubinin–Radushkevich (D–R), Langmuir and Toth equations to describe the sorption behavior of scCO2 in coal by fitting each isothermal adsorption curves independently (Bae and Bhatia, 2006; Day et al., 2008; Fitzgerald et al., 2003; Pini et al., 2010; Sakurovs et al., 2007). However, all above models are assumed that the density of adsorbed phase in coal is density of liquid CO2, or the volume of adsorbed phase in coal is a constant. Even though good fitting results are obtained by many researchers, the physical meaning of the obtained parameters from these revised classical equations still needs to be confirmed. Furthermore, these models are helpless to predict adsorption isotherms beyond test temperatures. However, the prediction of adsorption isotherms under high pressure and temperature geological conditions is critical for CO2 storage capacity estimations in the deep subsurface. Therefore, in order to reasonably interpret the adsorption behavior of scCO2 in coal and predict adsorption isotherms under high temperature and pressure in situ conditions, a more concise and robust adsorption model is needed.
In order to develop CCS technology better and tentatively solve the above-mentioned issue, it is necessary to establish the appropriate adsorption model of scCO2 in coal seam, which can be applied to wider temperature and pressure range. In this work, first, the measured data of high pressure scCO2 adsorption in coal are obtained at different temperature in order to obtain the change law of adsorption isotherm. Then, the dual-bite Langmuir model is derived to describe the observed scCO2 adsorption behavior in coal by considering the adsorbed phase. Last, the CO2 storage capacity is predicted theoretically by considering the real geologic situation with the contribution of the adsorbed phase.
Measurements of CO2 adsorption isotherm in coal sample
Test device
In order to achieve the laws of CO2 adsorption in coal sample at different temperatures, the test system for adsorption was built (shown as Figure 1) with the temperature control system. This test system mainly includes four units: temperature control unit, vacuum degassing unit, gas adsorption unit and real-time data acquisition unit. The test temperature is controlled by temperature frequency conversion in the test box. The temperature range is between –50°C and 100°C with a deviation less than 1°C and a fluctuation less than 0.5°C.
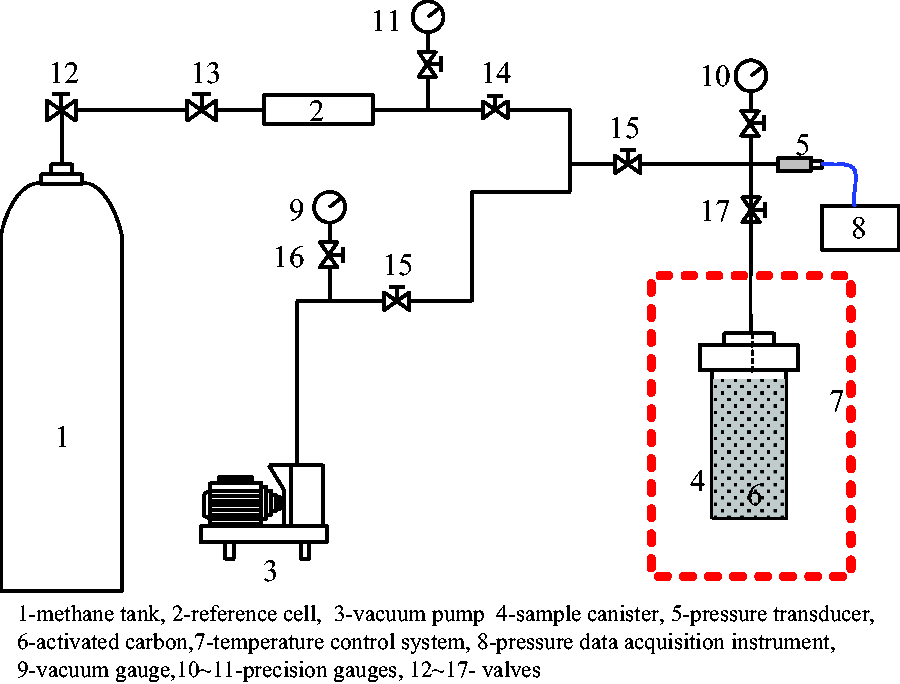
Diagram of CO2 adsorption device.
Test process
Coal samples are taken from Pingdingshan coal mine, Henan Province, China. The average porosity and density of the samples are 7.8% and 1.46 g/mL, respectively. The fresh coal samples are sealed in the working face. The samples are broken into coal particles between 0.18 and 0.25 mm based on standard of experimental method of high-pressure isothermal adsorption to coal (GB/T19560-2008). Before test, the sample is placed in the oven at 105°C for 24 h to dehydrate. The adsorption of CO2 gas (99.99%) in coal sample is carried out by volumetric method.
The test of CO2 adsorption in coal sample is mainly divided into the following five steps: (1) sample canister filled with dry coal particle is placed into the test box, and the test temperature is set by control system, (2) sample canister is evacuated until the pressure is lower than 10 Pa, (3) the certain CO2 gas is filled into sample canister via the reference gas cell, and adsorption happens in coal sample until the pressure remains unchanged for 4 h, (4) step 3 is repeated to get the adsorption equilibrium under different pressure, and (5) the test temperature is reset to carry out adsorption equilibrium tests under other temperatures.
Measured results and analysis
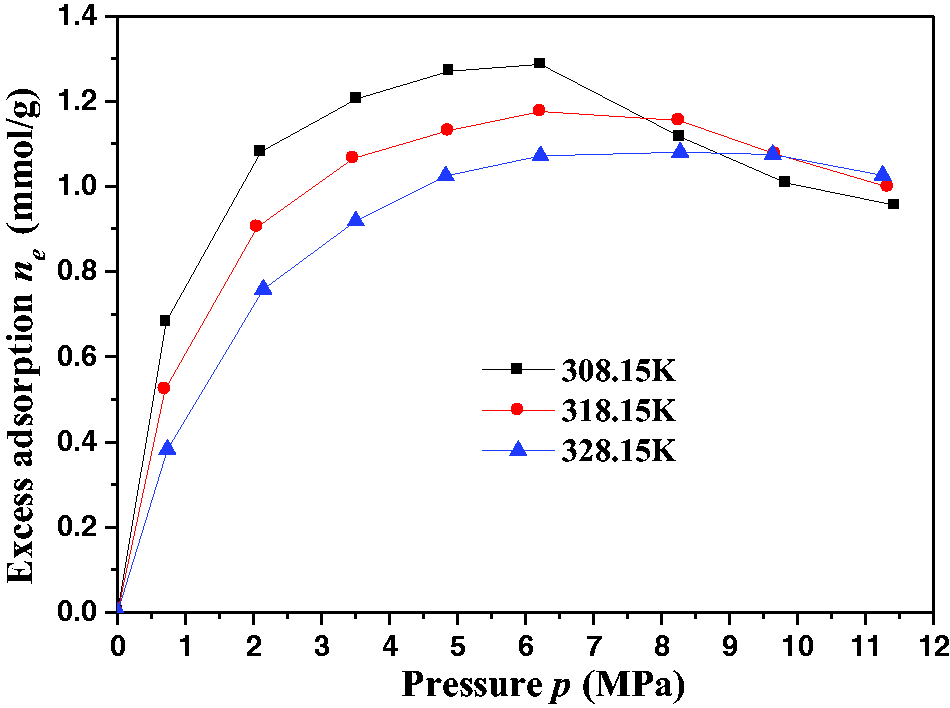
When the temperature of CO2 is higher than 304.25 K (31.1°C) and the pressures is greater than 7.38 MPa (critical point), CO2 is in the supercritical state. To consider the temperature influence of CO2 adsorption in coal, the tests will be conducted at three temperatures of 308.15 K, 318.15 K and 328.15 K, and the pressure of all adsorption isotherms almost reaches up to 12 MPa. The range of temperature and pressure basically reaches the temperature and pressure of coal seam (at depth of 1200 m) of Pingdingshan coal mine. And the adsorption isotherms of CO2 in coal sample under different temperatures are shown in Figure 2.
Adsorption isotherm at different temperature.
As it can be seen from Figure 2, the laws of CO2 adsorption in coal sample are coincident: in all isotherms, with increasing pressure the observed uptake of Gibbs excess adsorption increases up to a maximum value, and then gradually decreases. When the pressure is lower (about below 6 MPa), the excess adsorption is always larger at lower temperature. This is because CO2 molecule energy level is reduced at lower temperature and the free CO2 molecule is absorbed more easily. The adsorbed CO2 molecules are also difficult to obtain enough energy to overcome the physical adsorption force returned to the gas phase; therefore, the gas adsorption capacity enlarges. And the higher the temperature is, the larger the maximum uptake of Gibbs excess adsorption is. However, beyond the maximum of Gibbs excess adsorption, the adsorption isotherms will crossover at a point somewhere, that is to say, lower temperature causes the lower excess uptake at same pressure. This phenomenon is consistent with the measurement results of some researchers (De Silva and Ranjith, 2014; Fitzgerald et al., 2003; Kim et al., 2011; Massarotto et al., 2010; Pini et al., 2010; Romanov et al., 2013; Sakurovs, 2012).
Under such conditions, the conventional adsorption models (such as Langmuir model, BET model, Freundlich model, D–R model, L-F model) that neglect the real volume of the adsorbed phase cannot reasonably explain such adsorption behavior. Therefore, it is imperative to use a more sophisticated approach (dual-site Langmuir model) to obtain the absolute isotherms from observed Gibbs excess isotherms at high pressures.
Dual-site Langmuir adsorption model
The measured adsorption quantity in gas–solid adsorption system is also called the Gibbs excess adsorption uptake, and its Gibbs equation expresses as (Tang et al., 2017):
In equation (1) as the bulk gas phase density (ρg) is much smaller than the adsorbed phase density (ρa), ne (the uptake of excess adsorption) is approximately equal to na (the actual adsorbed amount). However, with the gas pressure increasing, the bulk gas phase density (ρg) increases more rapid than the adsorbed phase density (ρa), and it is similar to the adsorbed phase density (ρa) at high pressure. And the growth rate of the second item (ρg*Va) on the right side of equation (1) is more than first items (na), so the observed adsorption quantity must reach a maximum value and then decrease. However, the absolute adsorption quantity (na) contains the excess adsorption quantity (ne) and the main gas phase quantity (ρg*Va), so with increasing pressure it should always show a monotonic increasing with increasing pressure in a physical adsorption system.
The absolute adsorption quantity (na) can be simply described with the Langmuir equation:
According to the observed uptake of Gibbs excess adsorption, the absolute adsorption amount can be obtained, but the adsorbed phase volume (Va) or the adsorbed phase density (ρa) must be known. However, it is impossible to measure directly Va or ρa. Therefore, the approach, according to one of numerous empirical relationships, is widely used to estimate the adsorbed phase density (ρa) (Busch et al., 2006; Pini et al., 2010; Sakurovs et al., 2007). Usually, the adsorbed phase volume (Va) is considered as a function with adsorption uptake or only dependent on temperature, which is not a reasonable assumption to illustrate the relation between the adsorbed phase volume (Va) and adsorption uptake.
In the new adsorption model, the adsorbed phase volume (Va) is as an independent parameter, which is expressed as equation (4) (Stadie et al., 2015; Zhou et al., 2001),
Combining equations (1) to (4), the excess adsorption uptake can be obtained as shown in equation (5):

However, lots of real gas-solid adsorption systems can be sufficiently described with the single-site Langmuir model of equation (5) (Do and Do, 1997; Graham, 1953). As a matter of fact, the surfaces of almost all real-world materials are heterogeneous, so the adsorption energy is different for the local chemistry and structure at each site, and the application of the single-site Langmuir model is restricted (Do and Do, 1997; Graham, 1953). During the adsorption process, the gas molecules will fill firstly on the most favorable sites, then on the other less favorable sites. In order to describe adsorption differences caused by heterogeneous adsorbents, two different sites are available in the Langmuir model, where K1(T) and K2(T) are modeled as a separate equilibrium constant for each site.

A weighting coefficient α (0<α < 1) is introduced, the dual-site Langmuir model of the absolute adsorption quantity (na) can be expressed as the following equation:
Therefore, in the dual-site Langmuir model, the excess adsorption quantity (ne) can be expressed as:
Based on the assumption that the adsorbed phase volume increases linearly with the amount of adsorption up to a monolayer completion Vmax, the absolute adsorption amount can be obtained with single-site model (equations (2) and (5)) or dual-site model (equations (7) and (8)) via a least-squares fitting analysis from the measured adsorption data. However, the real-world material like coal has large amount of different adsorption sites, and dual-site model has been found that it is sufficient to describe a system with lots of independent fitting parameters (Stadie et al., 2015; Zhou et al., 2001). It is desirable to decrease the number of unnecessary such parameters when using a global fitting method (Murialdo et al., 2015).
Application of dual-site Langmuir model
Modeling of observed Gibbs excess adsorption
Based on the differential evolution method, the dual-site Langmuir model (equation (8)) is applied to fit simultaneously the measured data of three Gibbs excess adsorption isotherms by a least-squares residual minimization algorithm. By means of achieving the global minimum of the residual-squares value, seven independent fitting parameters are limited as follows: 0<nmax<100 mmol/g, 0<Vmax<10 cm3/g, 0<α < 1, 0<E1<100 kJ/mol, 0<E2<100 kJ/mol, A1>0, A2>0. In order to achieve a global minimum, it is assured that excess of 100 unique times is performed by changing the random seed. Once determining the seven fitting parameters, it is easy to calculate the absolute and excess adsorption uptake at any temperature and pressure through equations (7) and (8).
Excess adsorption uptakes of CO2 in coal sample measured in the laboratory are fitted using equation (8), and the fitting curves are shown in Figure 3. As seen in Figure 3, the observed maximum of Gibbs excess adsorption quantities is 1.2642 mmol/g, 1.1761 mmol/g and 1.0948 mmol/g at 308.15 K (5.9 MPa), 318.15 K (6.87 MPa) and 328.15 K (8.08 MPa), respectively. With the temperature increasing, it needs higher pressure to the Gibbs excess maximum. For supercritical gas adsorption, this phenomenon is well-known (Zhou et al., 2007). A good global fit of the observed data is obtained by dual-site Langmuir adsorption model (equation (8)), and the values of seven best-fit parameters are shown as follows: nmax=1.567 mmol/g, Vmax=0.0339 mL/g, α = 0.69, E1=36.8076 kJ/mol, A1=6.6361 × 10⁻⁷ MPa−1, E2= 45.4636 kJ/mol, A2= 2.2287 × 10⁻⁸ MPa−1. Herein, it should be emphasized that these seven parameters can be applied to all measured adsorption isotherms of these coal samples. A most general understanding of the properties of the adsorbent–adsorbate system can be achieved by performing a single global fit to all the data at once.
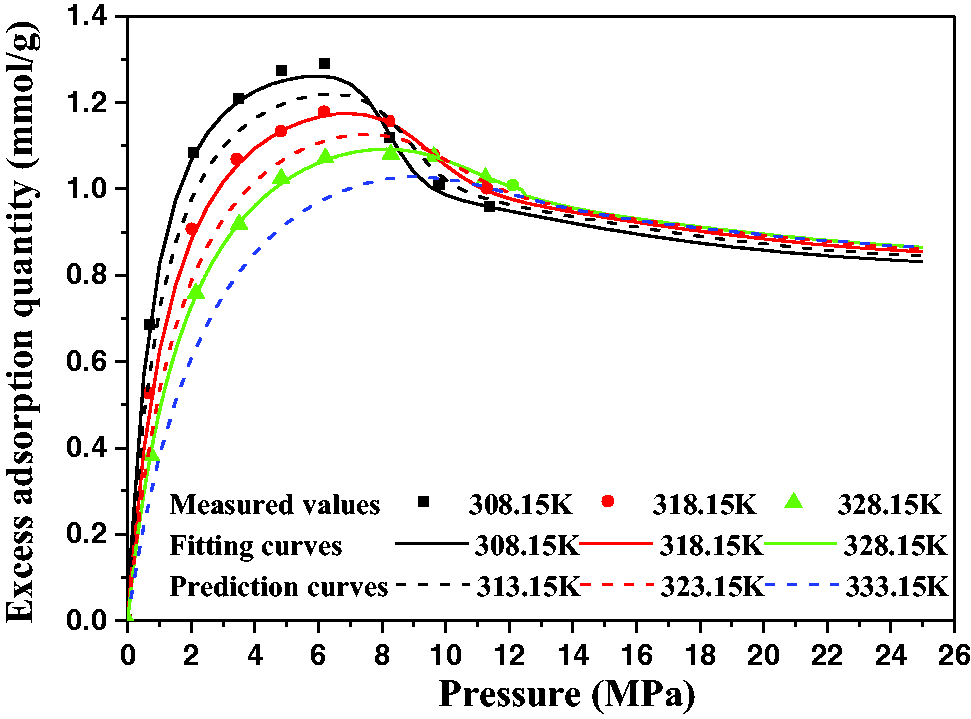
Gibbs excess adsorption isotherms of CO2 adsorption in coal sample with dual-site Langmuir model fits (solid lines) and predictions of excess adsorption isotherms under other conditions (dotted line).
Based on equation (8) and its fitting parameters, the excess adsorption isotherms are obtained at other temperatures (313.15 K, 323.15 K and 333.15 K), which are shown in Figure 3. It can be seen in Figure 3, the excess adsorption isotherms show the same temperature dependence at all pressures, i.e. increasing excess uptake with decreasing temperature, however, at high pressure the differences of excess adsorption quantities at different temperatures gradually decrease. At the same time, the crossovers of the excess uptake isotherms are observed when the pressure is big enough. This is an interesting phenomenon for any two excess adsorption isotherms, the relation between excess adsorption capacity and temperature is reversed. Before the crossover, higher the temperature is, larger the excess adsorption capacity is. However, after the crossover, higher the temperature is, less the excess adsorption capacity is.
Predictions of absolute adsorption
The adsorbed phase volume of CO2 changes with temperature and pressure following the dual-site equivalent of equations (4), which is shown in Figure 4. The adsorbed phase volume increases rapidly at low pressure, however, increases slowly at high pressure. And the gas phase density of CO2 also changes with pressure and temperature following the dual-site equivalent of equation (4), as shown in Figure 5, which are good agreement with the experimental results. The density of the gas phase gradually increases at low pressure, sharply increases from about 7 MPa, and lower the temperature is, more pronounced the mutation is.
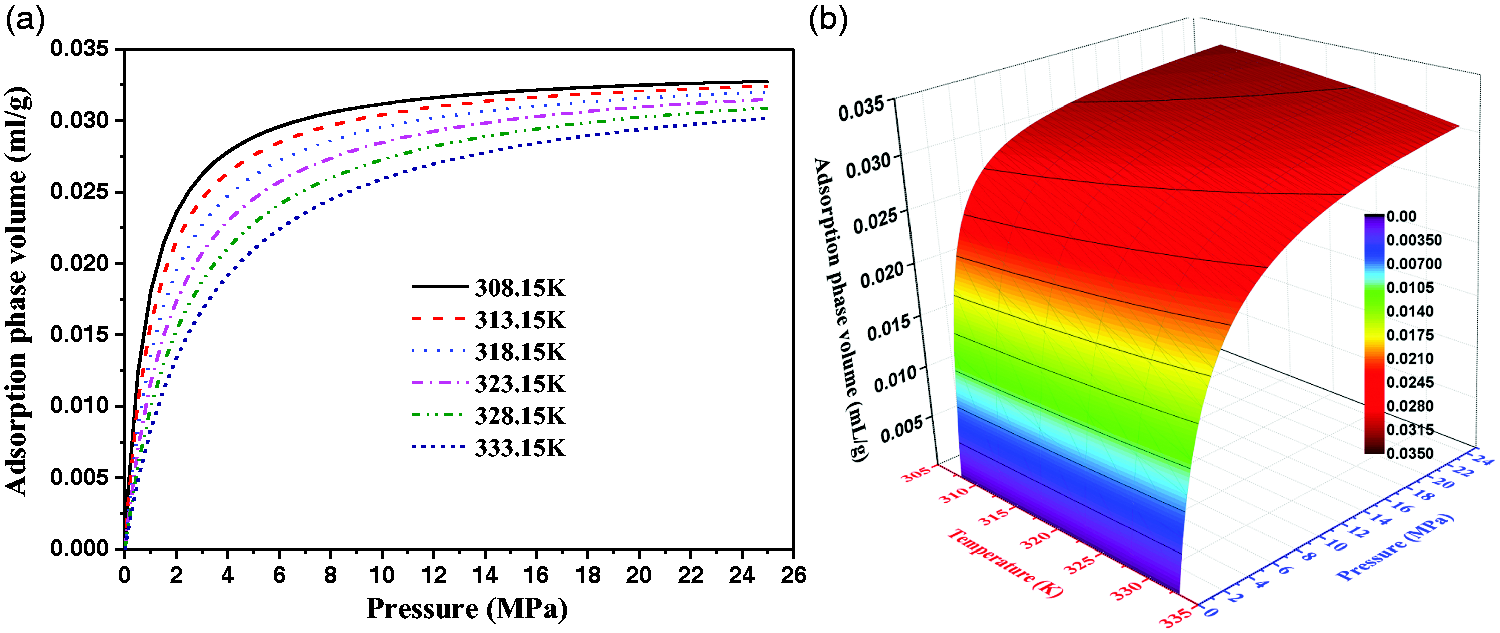
The volume of the adsorbed CO2 phase changes with pressure and temperature. (a) Curve graph of adsorption phase volume and pressure. (b) 3D colormap surface of adsorption phase volume, pressure and temperature.
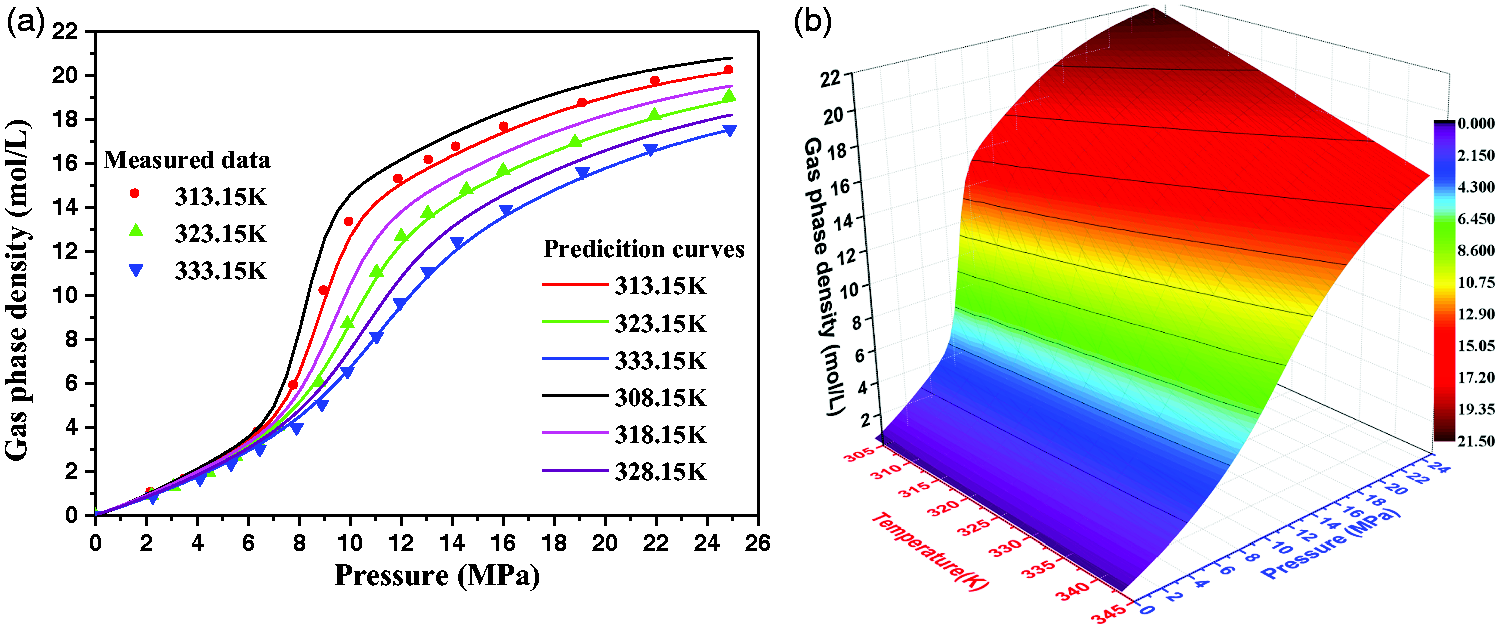
The density of the CO2 gas phase changes with pressure and temperature. (a) Curve graph of gas phase density and pressure. (b) 3D colormap surface of gas phase density, pressure and temperature.
Compared to the volume–density product, the Gibbs excess maximum phenomenon can be explained by examining the change in the adsorbed phase volume, as shown in Figure 6. With the pressure increasing, the volume–density term (ρg*Va) in equation (1) increases, but at different temperatures its difference of volume–density term (ρg*Va) becomes more pronounced. The volume–density term (ρg*Va) at higher temperature is always lower than that at lower temperature; however, the maximum of absolute adsorption quantity (nmax) has nothing to do with temperature or pressure, only with the properties of coal, so it is a constant. So, the crossovers of the Gibbs excess adsorption isotherms are resulted at different temperatures and pressures. As a result, with the support of the observation of the crossover phenomenon in Figure 3, the previous assumption of the adsorbed volume of CO2 changes with temperature and pressure is reasonable in a dual-site Langmuir-type model. This is the real distinction with other work where the adsorbed phase is considered approximately as a constant.
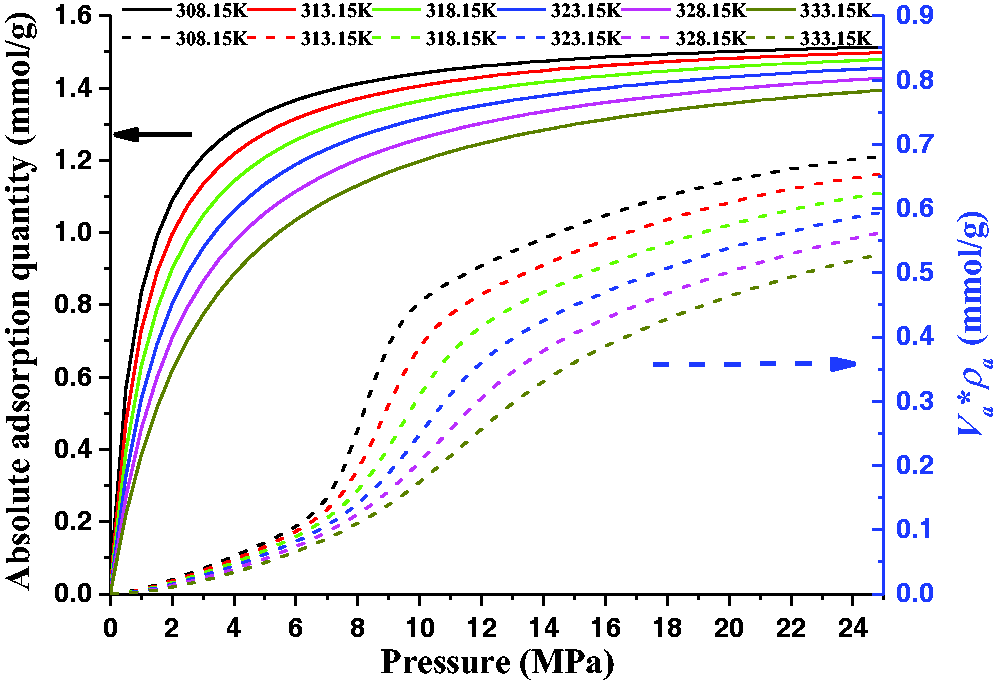
Modeled values of Absolute adsorption (na) (solid lines, left major axis) and the volume–density term (ρg*Va) (dotted line, right minor axis).
Absolute adsorption isotherms of CO2 in coal based on equation (7) are shown in Figures 6 and 7. As the characteristic of Langmuir equation, the isotherm of absolute adsorption quantity increases monotonically with the pressure increasing up to 25 MPa, which is consistent with the physical nature of adsorption. Significantly, the observed Gibbs excess quantity is obviously lower than the absolute adsorption quantity at higher pressure. This implies the adsorbed phase volume of CO2 in coal, which is neglected in the observed Gibbs excess adsorption isotherms, has the significant contribution toward the absolute adsorption content.
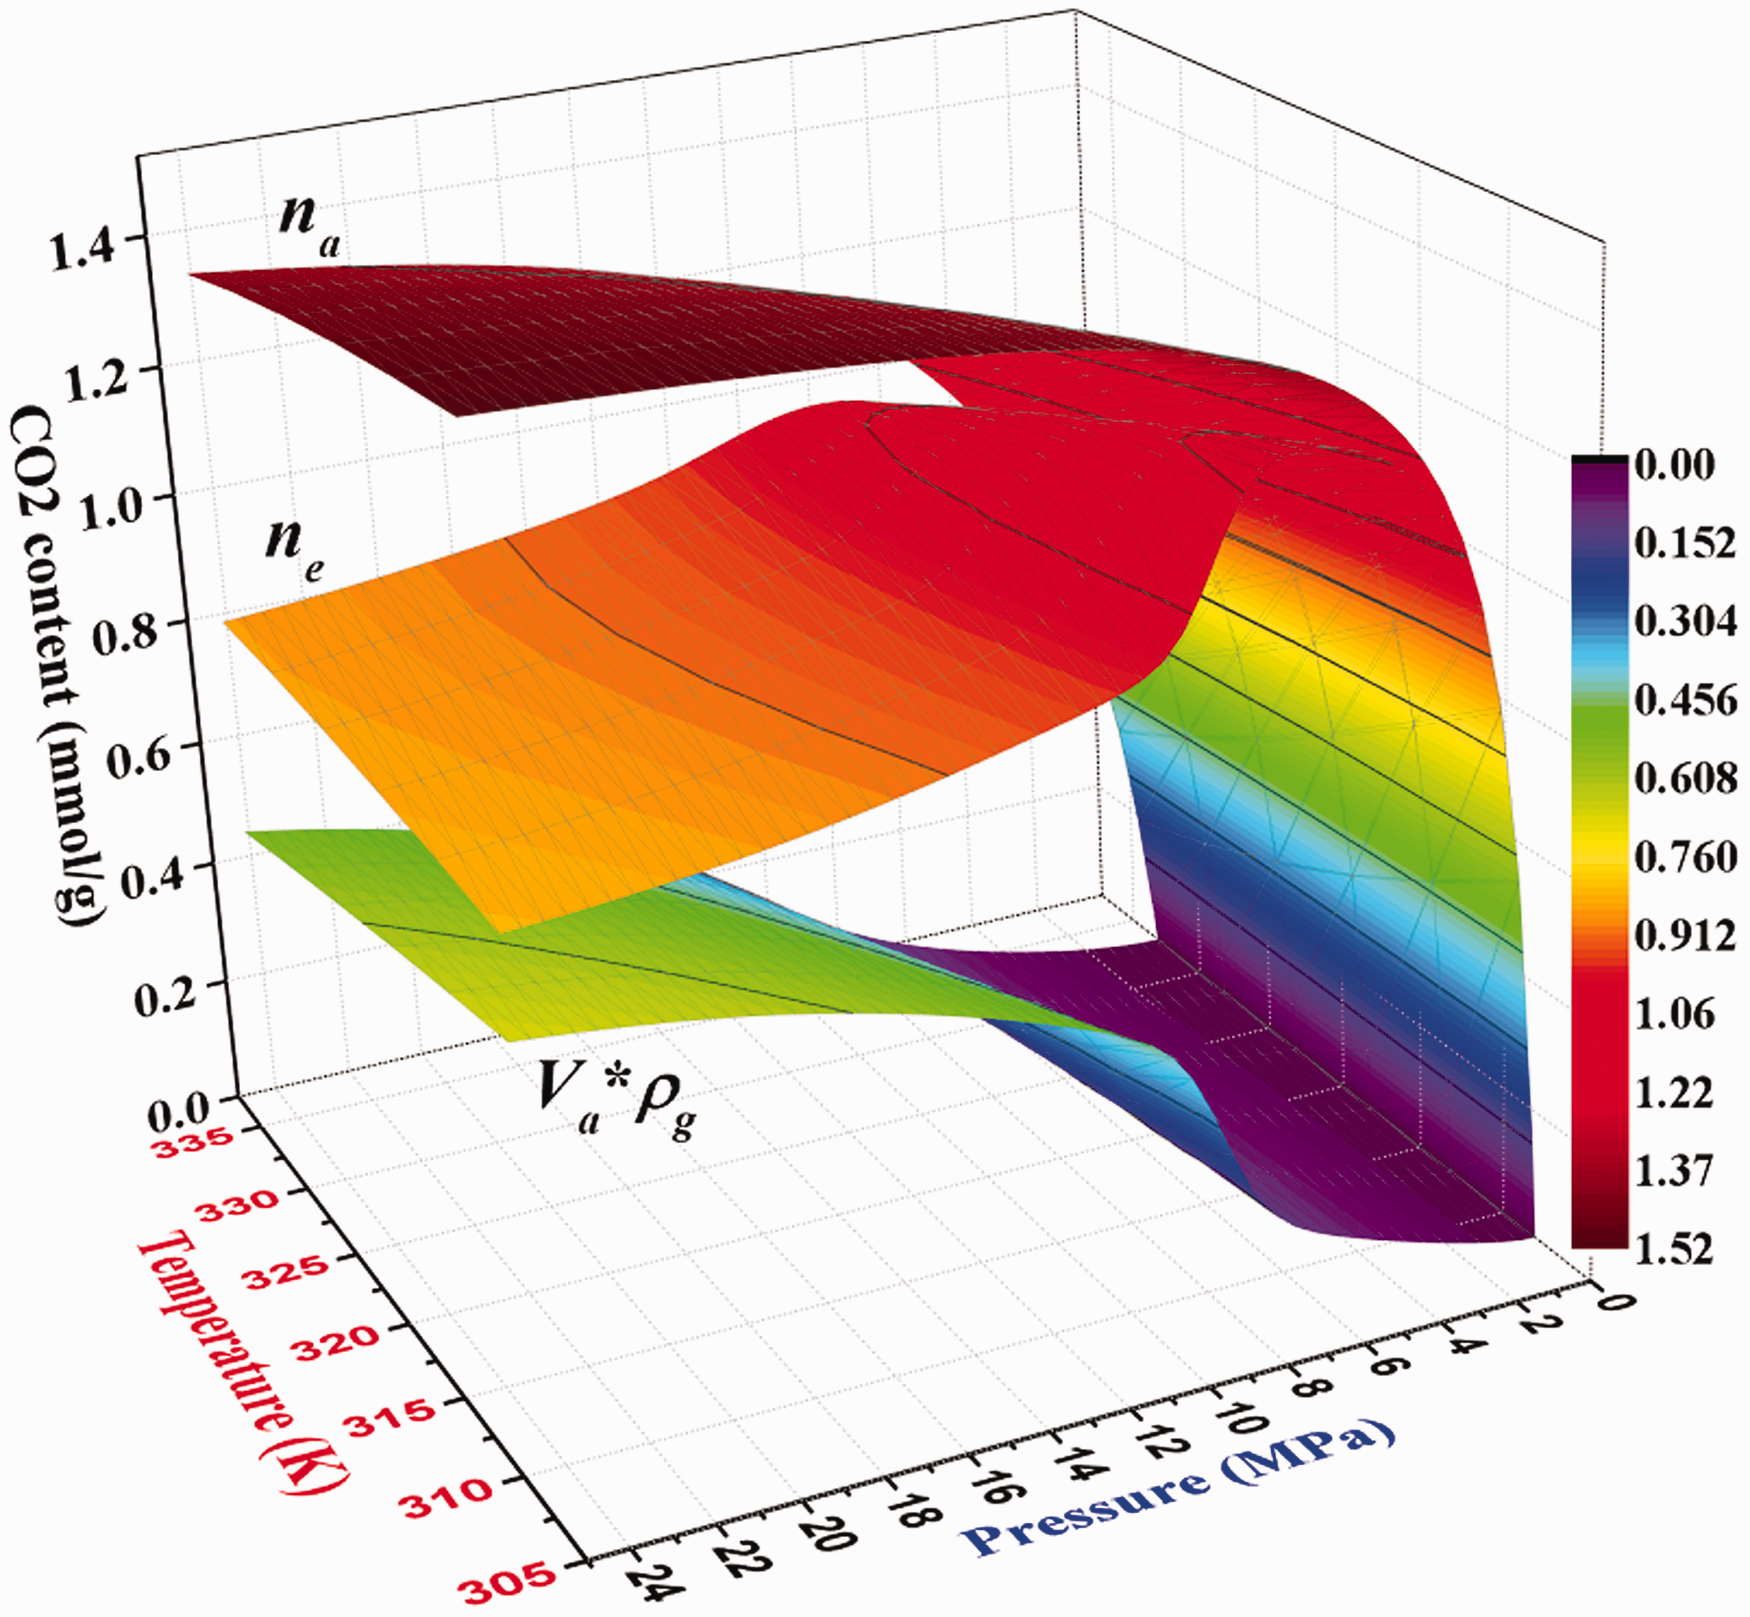
Comparison with absolute adsorption quantity (na), excess adsorption quantity (ne) and volume–density quantity (ρg*Va).
In addition, the large difference between the observed adsorption uptake and the absolute adsorption uptake at these pressures demonstrates the importance of using an accurate model of CO2 content in coal. In other reports, the absolute adsorbed amount is estimated by simply fitting the excess adsorption quantities along a single isotherm to a single site Langmuir isotherm (Curtis, 2002), which cannot accurately describe the changing volume of the adsorbed phase that is taking place. Figure 7 also shows that as the temperature increases, the contribution of the volume–density term for the absolute adsorption gradually becomes less pronounced. At the same time, it should be noted that the temperatures (313.15 K, 323.15 K and 333.15 K) are out of the range of data measured in this work. Nevertheless, the dual-site Langmuir model can be used to predict both the Gibbs excess adsorption isotherms and the absolute adsorption isotherms under different temperature and pressures.
GIP content of carbon dioxide storage
Prediction model from adsorption measurements
Equilibrium CO2 adsorption measurements in coal can be used to estimate the gas-in-place (GIP) content of CO2 storage. It is important to note that this method does not consider the presence of other gaseous components of natural gas and moisture which can reduce the CO2 adsorption capacity. The GIP is estimated herein as the total amount of CO2 present in the gaseous and adsorbed phases in coal. Conceptually, this amount (nGIP) is accessible via the sum of the free gas phase content (nfree) and the absolute adsorbed phase content (na).

The amount of gaseous CO2 is equal to the bulk CO2 density multiplied by the gas phase volume alone (excluding the adsorbed phase volume) as shown in Figure 8. However, the entire empty volume of coal, occupied a finite volume by the adsorbed phase, is not the same as the volume accessible to the free gas, which is significant at high pressure. Because of the Gibbs definition (from equation (1)), it is simpler way to obtain the total GIP amount, which can be expressed as the sum of the entire free volume (Vtot) of the empty coal with the bulk gas phase density and the excess adsorbed amount.

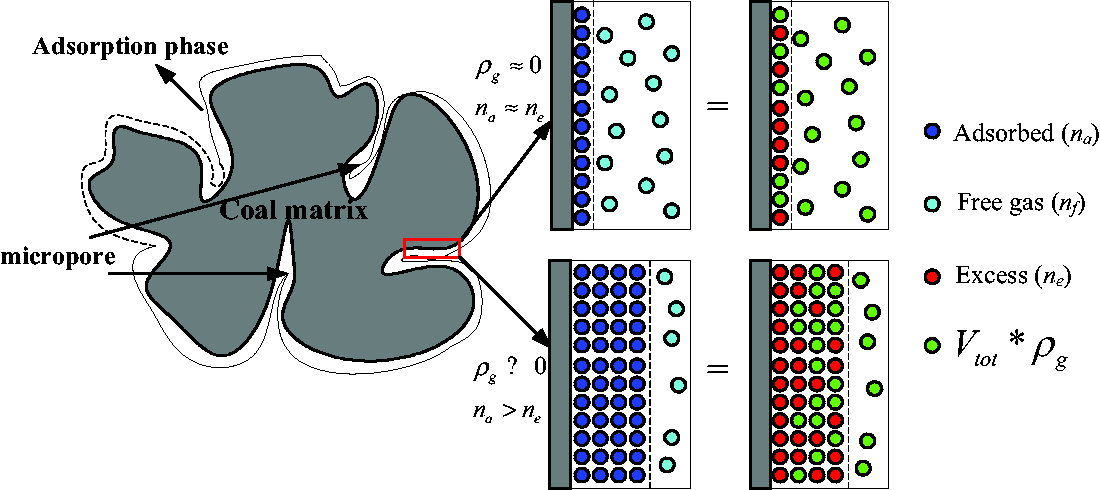
Schematic of gas–solid adsorption in two distinct conditions: at lower pressure (top) and at higher pressure (bottom).
In equation (10), all three of the quantities are directly measured: the total empty volume accessible to gas in coal (Vtot), the pure gaseous CO2 density at the equilibrium conditions (ρg), and the measured data of the excess adsorbed amount under these conditions (ne). Therefore, based on the experimental outcome of the excess adsorbed amount (ne), the simplest and most accurate approach must be emphasized to estimate the total GIP content via equation (10), which is the advantage of this model to obtain the total GIP content in this way, but none of other adsorption models can do it.
Prediction of CO2 storage in coal
Predicting adsorption isotherms in coal at different temperatures are a fundament for CCS (CO2-capture and storage). It is impractical to measure large amount of isotherms at different temperatures for CO2 storage capacity in coal. Thus, the advantage of the dual-site Langmuir model is to predict isotherms at arbitrary temperatures near the measured isotherms, which is impossible to fit individually for each isotherm of the case in other studies, and the global fit across numerous isotherms used in this paper is an extremely desirable feature of a particular model. Among the test temperatures, the adsorption isotherm at some temperature is highly accurately predicted with interpolation method of the measured data, and for higher or lower temperatures than measured, the adsorption isotherm is highly accurately predicted with extrapolation method of the measured data. Although it is performed with caution for outside of the measurement region, extrapolation results always provide valuable information.
Based on equations (9) and (10), CO2 storage quantity (nGIP) and free gas phase content (nfree) in coal are predicted between 0.1–16 MPa and 308.15–333.15 K. As shown in Figure 9, both pressure and temperature affect not only absolute adsorption quantity but also free gas phase content. Figure 9 shows that there are significant differences between the CO2 storage content (nGIP) and absolute adsorption quantity (na). And these differences are the significant contribution of free CO2 phase content (nfree) in coal toward CO2 storage content (nGIP). The contribution of free CO2 phase content for CO2 storage quantity gradually becomes more pronounced as the temperature decreases.
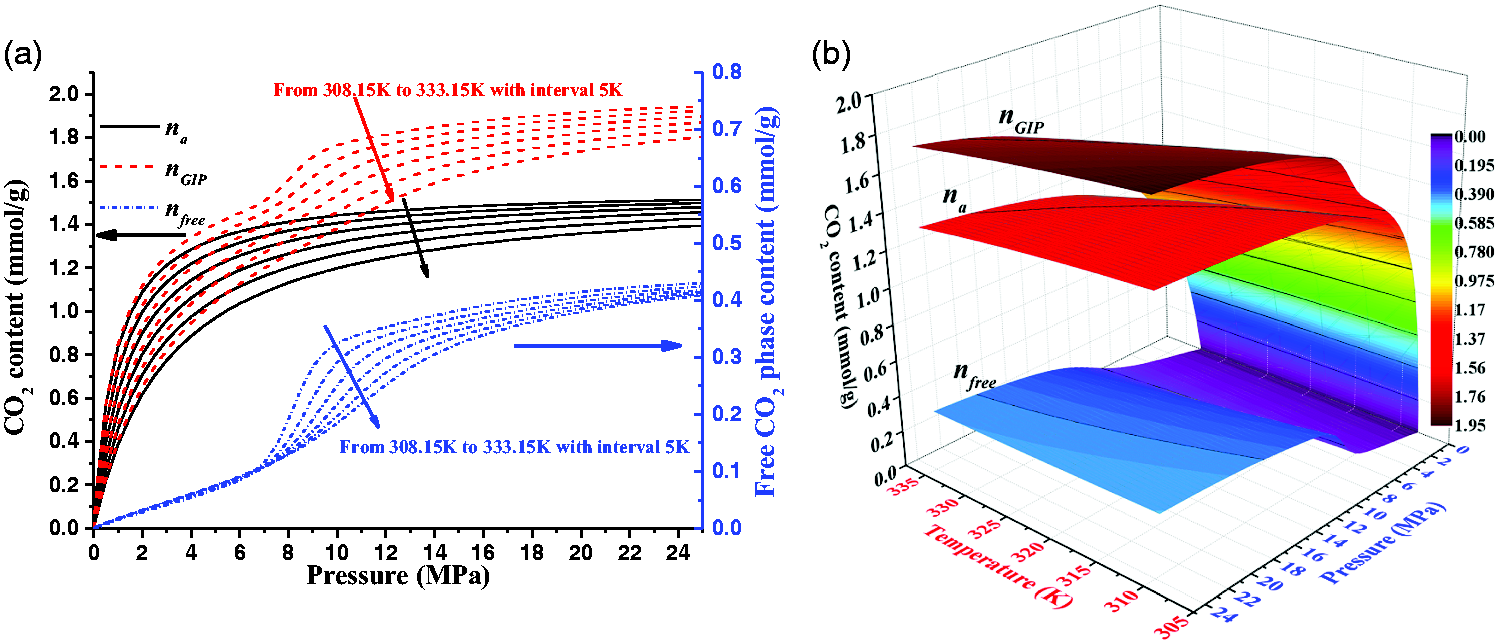
Comparison with absolute adsorption quantity (na), CO2 storage quantity (nGIP) and free gas phase content (nfree). (a) Curve graph of CO2 content and pressure. (b) 3D colormap surface of CO2 content, pressure and temperature.
Geological gas-in-place CO2 storage estimation in coal seam in Pingdingshan, China
Herein, the geological GIP content of CO2 storage in Pingdingshan coal mine in China is estimated as an example. The depth of coal seam mining has reached 1200 m below the surface and there are dozens of unmineable coal seams that can store CO2. The crustal stress and formation temperature with reservoir depth measured by Pingdingshan Coal Industry Group Co., Ltd. are shown in Figures 10 and 11. In Figures 10 and 11, the pressure coefficient and the geothermal gradient can be obtained from the function relations of the pressure, the temperature and depth. They are 14.897 MPa/km and 3.5245 K/100 m, respectively, which belongs to the abnormal geothermal region.
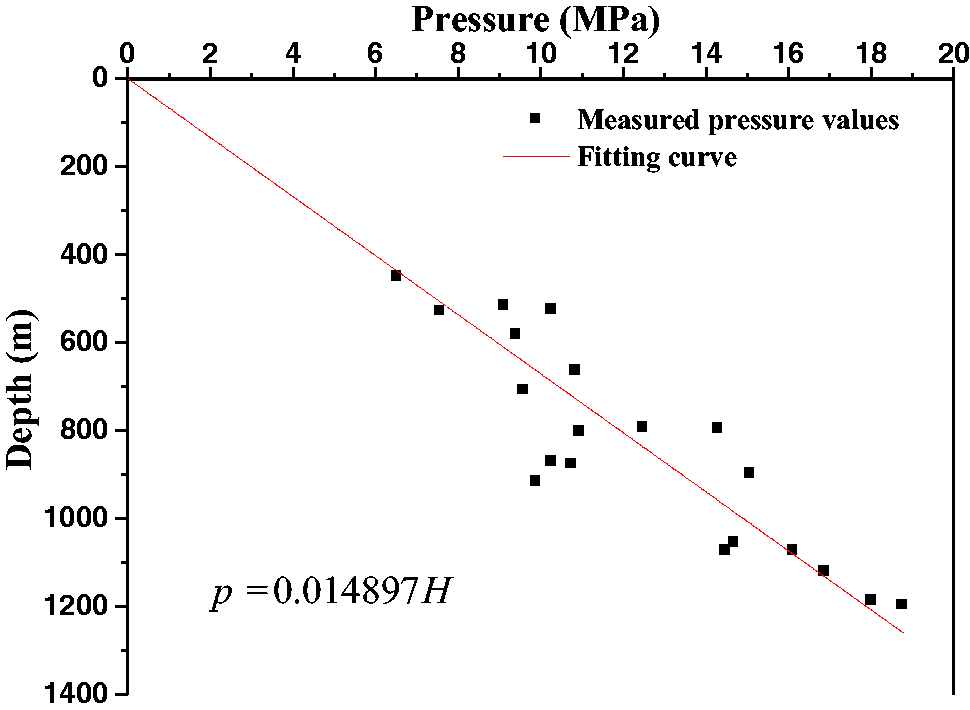
The crustal stress changes with depth.
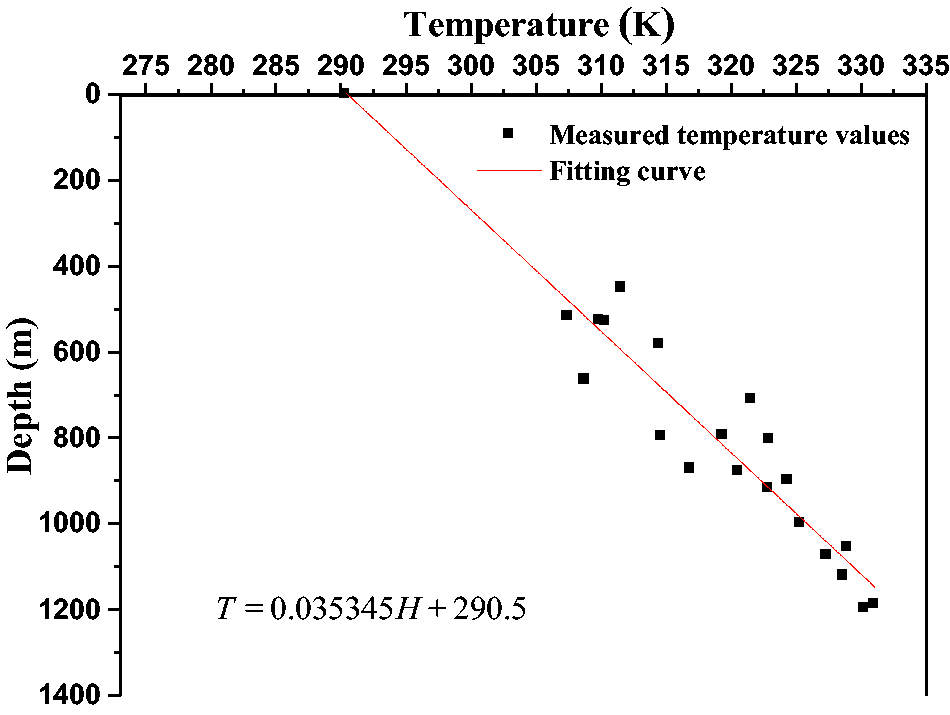
The formation temperature changes with depth.
CO2 storage in deep coal seam is in a different geological situation, coal seam is up to 1200 m deep, where the reservoir pressure reaches up to 20 MPa and the reservoir temperature can be up to 335 K. Therefore, both pressure and temperature effects on the adsorbed CO2 content cannot be neglected. In this case, both the temperature and the pressure of the actual coal seam at maximum depth are out of the range of data measured in this work. Nevertheless, the dual-site Langmuir model can be used to predict both the Gibbs excess adsorption isotherms and the absolute adsorption isotherms under different temperature and pressures, as previously discussed. Figure 12 shows that there are significant differences between the observed Gibbs excess adsorption quantity, true absolute adsorption quantity, the CO2 storage content and the free CO2 phase content (as determined by the dual-site Langmuir model). It can be seen from Figure 12 that the difference between the absolute adsorption quantity and the CO2 storage content are getting bigger and bigger below about 200 m, which is because the contribution of the free CO2 phase content for the CO2 storage content gradually becomes more pronounced, especially from 400 m to 700 m depth the free CO2 phase content rapidly increases.
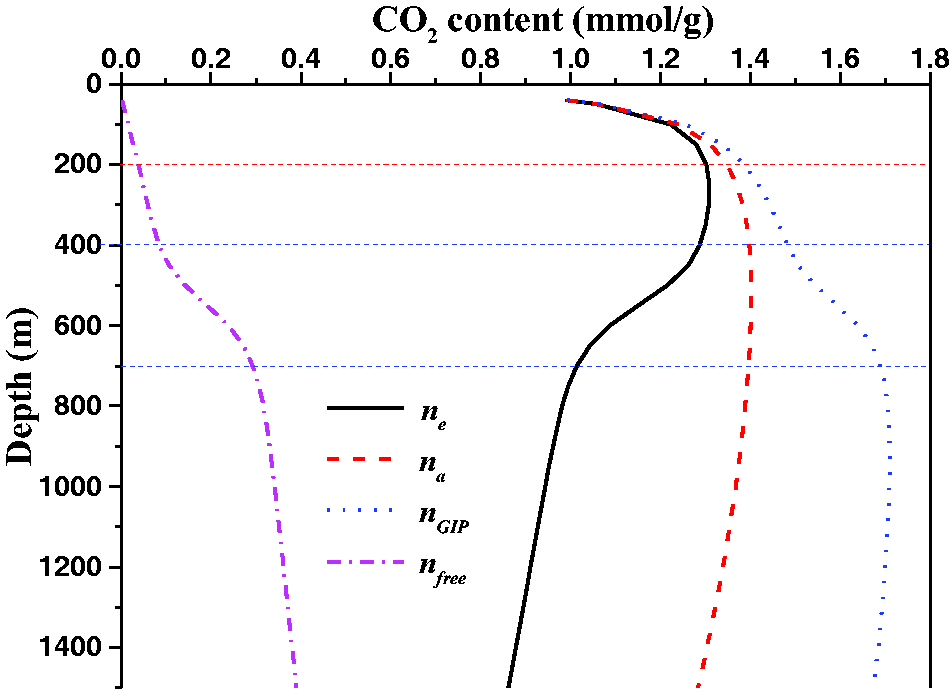
Comparison of CO2 content in Pingdingshan region coal seam under geological temperature and pressure conditions as they vary with depth.
The ratio of the adsorbed CO2 and free gas phase content in the total GIP storage is shown in Figure 13. The actual amount of adsorbed CO2 accounts for 78.74% of the total GIP content at a depth of 1200 m, but if only the excess adsorption quantity is taken, the result is a very large underestimation of the contribution of adsorbed CO2 to the total GIP content: only 53.58% at a depth of 1200 m. And it also can be seen in Figure 13 that as the coal seam depth increases, the contribution rates of actual adsorbed CO2 quantity for total CO2 storage quantity gradually decrease. On the contrary, the contribution rates of free methane phase content gradually increase, which is because the increasing temperature is bad for CO2 adsorption in coal seam.
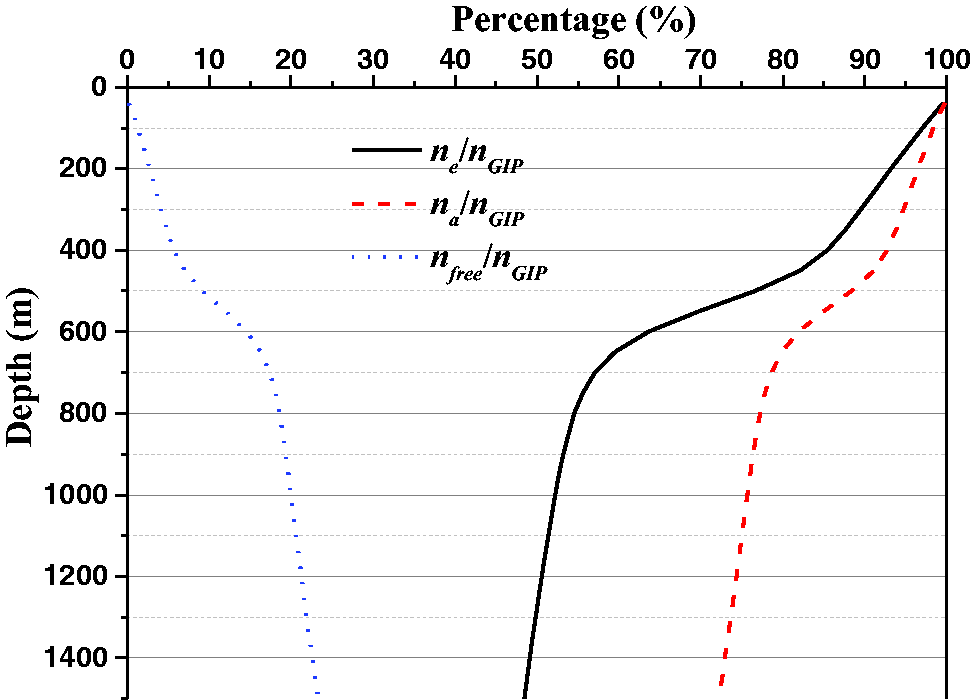
Comparison of the estimated contribution to total GIP content.
Conclusion
Based on the adsorption characteristics of CO2 in coal, an accurate prediction model for the application of CCS is provided. In this work, the CO2 adsorption quantities in coal are measured between 308.15–328.15 K and 0.1–12 MPa. Then, the dual-site Langmuir model is applied to describe and accurately predict high pressure CO2 adsorption behavior. Finally, the CO2 storages in coal seam under wide range of temperature and pressure are accurately predicted. Several preliminary conclusions can be made.
The CO2 excess adsorption isotherms show the same variation characteristics: the adsorption quantity will reach a maximum value and then gradually decreases with the increase of pressure. The dual-site Langmuir model can not only accurately describe observed adsorption isotherms but also can extrapolate adsorption isotherms beyond test data without using any empirical relationship. The crossovers of the adsorption isotherms under high pressures and high temperatures are observed and reasonably interpreted, for any two excess adsorption isotherms, the relation between excess adsorption capacity and temperature reverses across crossover point. The adsorbed phase volume of CO2 changes with pressure and temperature. The contribution of the volume–density term for the absolute adsorption gradually becomes less pronounced as the temperature increases. As the coal seam depth increases, the contribution rates of actual adsorbed CO2 quantity for total CO2 storage quantity gradually decrease; however, the contribution rates of free CO2 phase content gradually increase. The dual-site Langmuir model allows accurate estimations of the true CO2 storage, which will lay the foundation for the research and development of CCS storage technology.
Footnotes
Declaration of conflicting interests
The author(s) declared no potential conflicts of interest with respect to the research, authorship, and/or publication of this article.
Funding
The author(s) disclosed receipt of the following financial support for the research, authorship, and/or publication of this article: The authors are grateful for financial support from the National Natural Science Foundation of China (No. 41772163, No. 51274090) and the support from the science and technology innovation team in Henan province (No. 15IRTSTHN029, No. 17IRTSTHN030). The authors are also indebted to the anonymous reviewers for their comments which have helped improve the manuscript.