
Abstract
As faults in the solar water heaters are structurally complicated and highly correlated, an approach of fault diagnosis on the basis of support vector machine and D-S evidence theory has been proposed in this study, attempting to enhance the system’s thermal efficiency and ensure its safety. In the approach presented, information of audio conditions, temperature at the outlet of solar thermal collectors, hourly flow and hourly heat transfer rate are accessible, which facilitate the feature evidence and are diagnosed by using “one-against-one” multi-class support vector machine. Experiments are conducted to diagnose fault information fusion and the results show that the diagnosis approach proposed in this study is of high reliability with fewer uncertainties, indicating that the approach is capable to recognize and diagnose solar water heater faults accurately.
Keywords
Introduction
As the social demand for energy has been on the rise, solar water heaters (SWHs), an efficient means exploiting solar thermal energy, have gained popularity. SWHs are in different forms as the demand and the installation site vary, yet the necessary ones are the solar collector, storage tank, tubes, pumps, auxiliary energy source and a controller. Of all the means utilizing the solar thermal energy, SWHs enjoy enormous economic value and thus have been widely accepted. The water heated by the solar thermal energy has been used for residential and industrial applications, and can be stored in the form of cold and heat source in other systems (Han et al., 2010). The solar collector combined consists of several collectors in arrays. The circulating tubes connecting SWH configurations should be installed by considering practical conditions in site. For better performance, heat insulation measures are demanded, and the circulating tank and the supplementary tank are necessarily installed right above the water tank (Zhang et al., 2015). Due to the stable irradiation of solar energy, auxiliary energy sources should be provided, which are determined according to the reality or requirements from users, for example, supplementary electricity heating appliances and the coal or oil burning boiler can be used. In addition, sensors can be installed based on the condition of SWHs, including temperature sensor and water level sensor (Fu et al., 2018). The position of the storage tank should be determined by the local conditions. For sale of circulation power, most SWHs are in active circulation where a pump is used for power as shown in Figure 1.
Solar water heaters in work.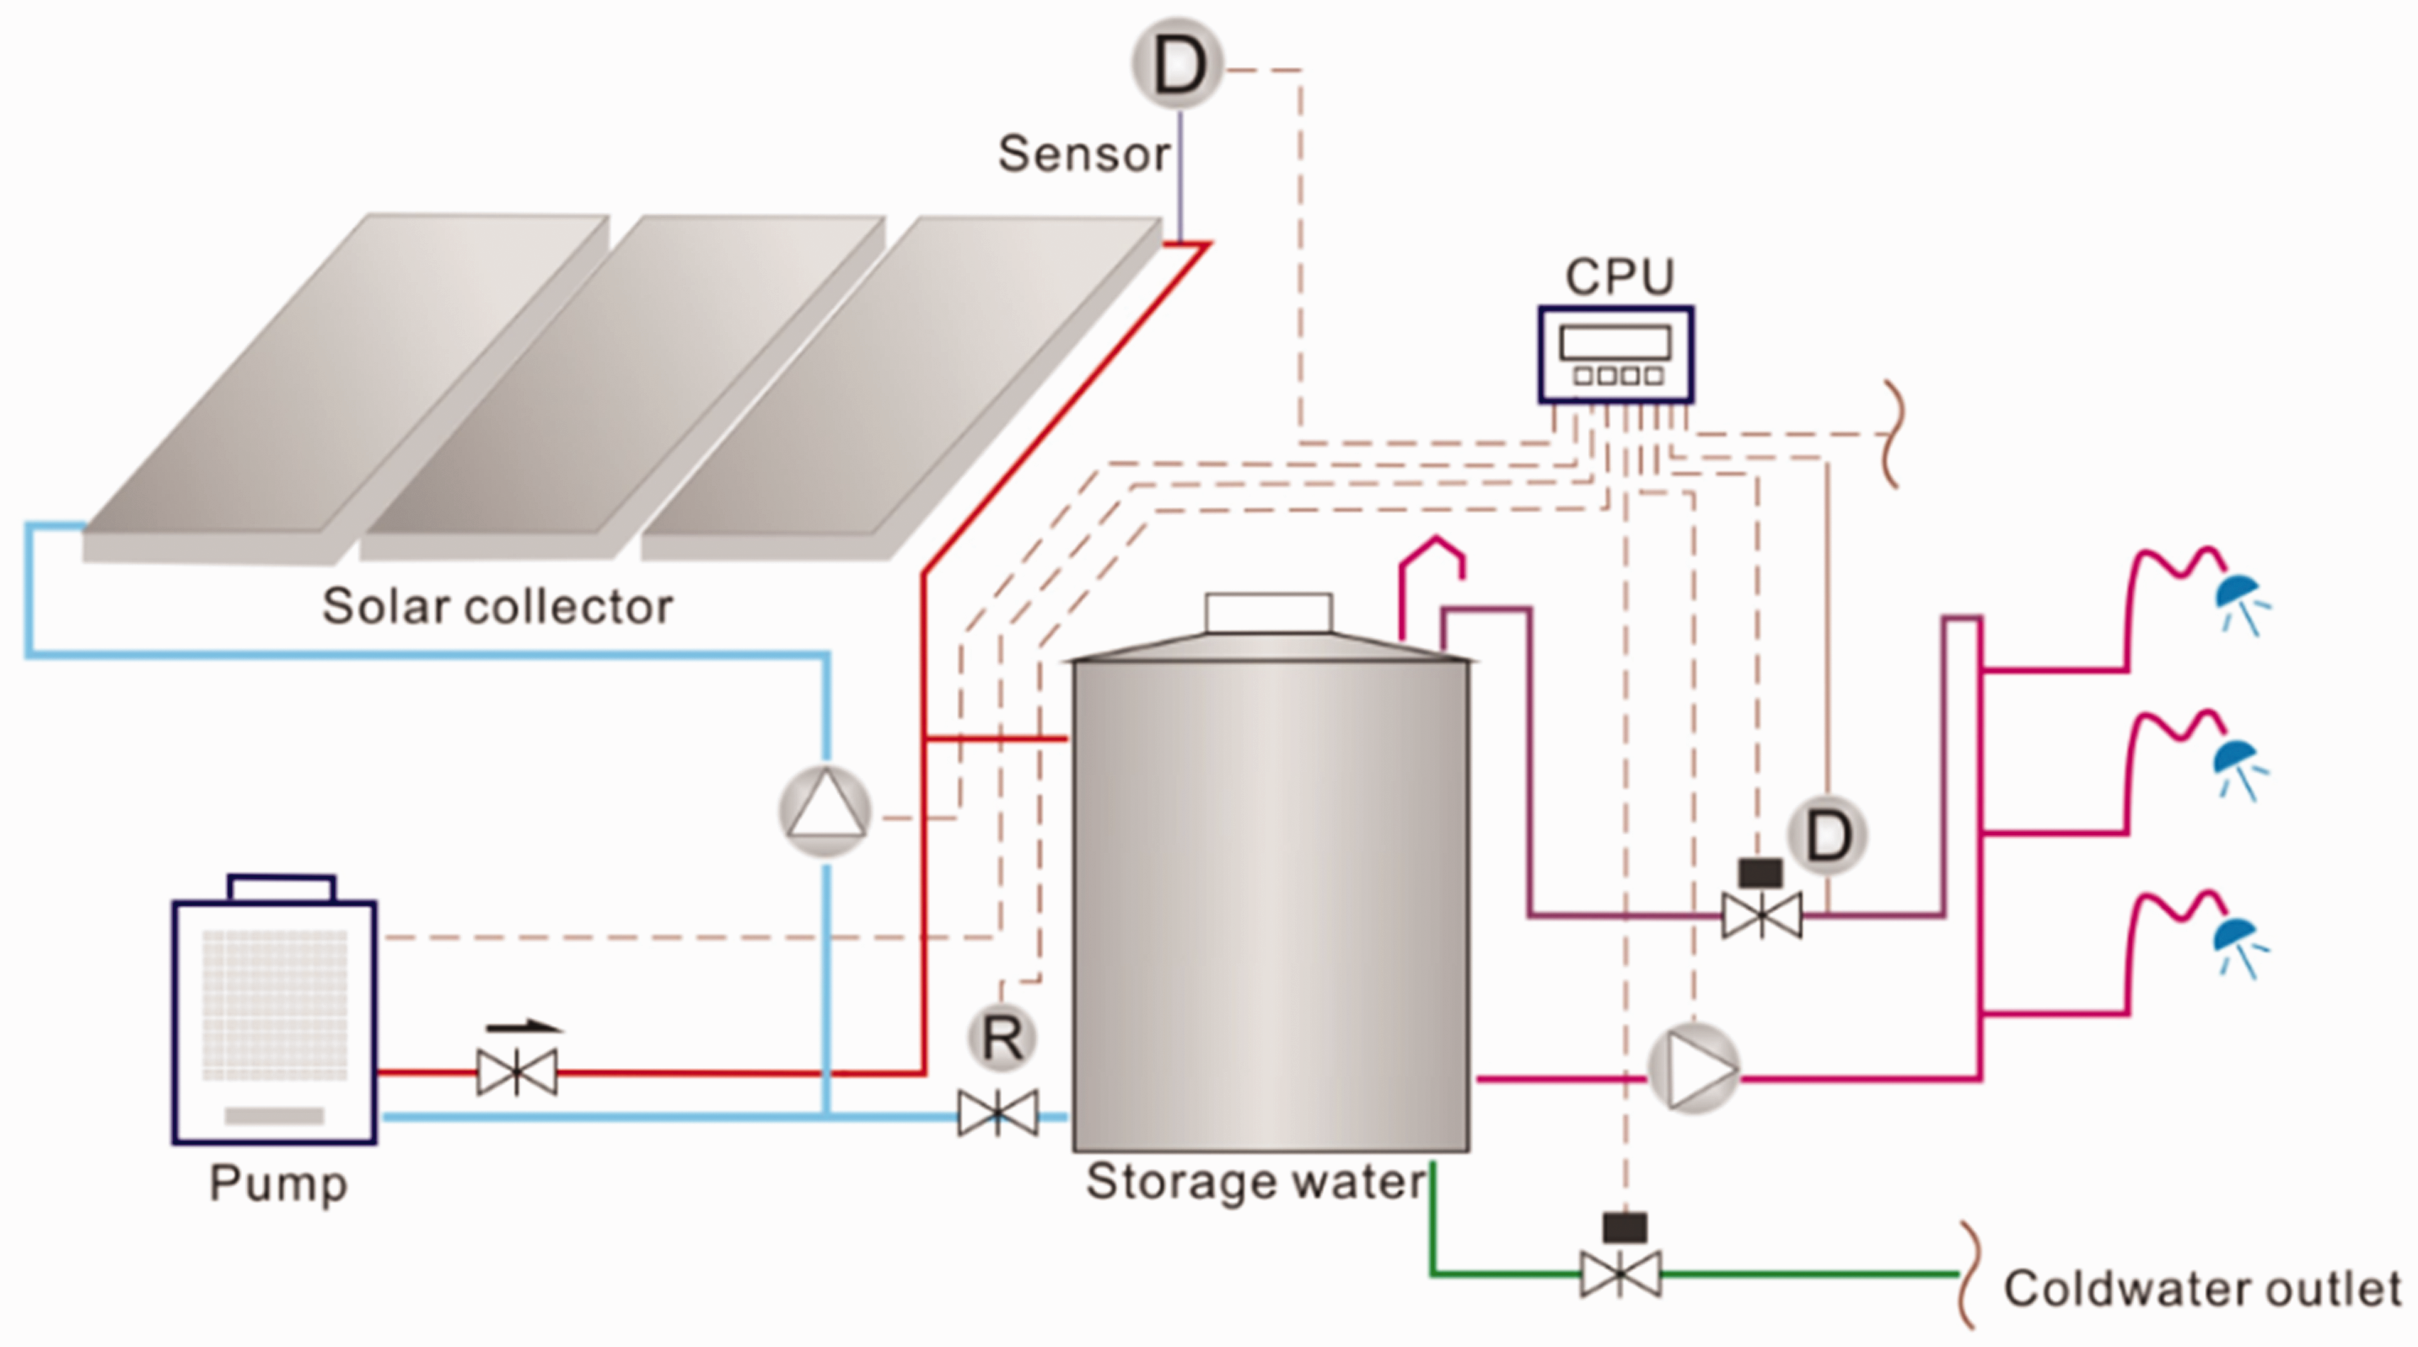
For SWHs in practice, a variety of faults lead to the system’s failure in meeting the planning, which triggers a huge waste of energy (Shrivastava et al., 2017). With fault monitoring and diagnosis, the system failure can be examined to improve the stability in this performance and reduce heat loss. In this view, it is of necessity to conduct fault diagnosis in SWHs. SWHs are susceptible to weather conditions given its complex system which is usually at the roof or in the open air (Rosas-Flores et al., 2016). Component loss or poor maintenance may give rise to severe consequences. Classification of the faults is important, as theoretical findings and survey results evidence that construction energy consumption can be reduced by 20–30%, provided that efforts are made in fault diagnosis and improving the operation of air conditioning in an HVAC system. With the development of technology, the energy-saving technology is promoted significantly. Thus, besides its performance, the design of HVAC also pays attention to energy-saving technology and environmental protection (Liu et al., 2018b; Sun et al., 2018). Over the entire domain, the energy conservation and environmental protection which are the crucial control points attract tremendous attention (Sun et al., 2017a). The combination of solar energy technology and heat pump technology which can mutually complement each other can promote the development of HVAC and relieve the pressure of resource shortage (Liu et al., 2018a; Sun et al., 2017c). Likewise, for solar water heating system (SWHS) haunted by faults, a study of fault detection and diagnosis is of economic and practical significance (Madeti and Singh, 2017; Milani and Abbas, 2016; Varghese and Samsher, 2017).
Major faults in SWHs
Classification of faults in SWHs
SWHs have gained popularity as it is energy-saving, environment-friendly, safe and less costly. SWHs are susceptible to failures owing to the weather. A sound classification of faults is helpful in learning the failures and thus making solutions. The classification can be made in various ways based on different considerations (Veeraboina and Ratnam, 2012). There are component faults and man-made faults. The component faults refer to the inevitable system failures, while the man-made faults are the ones trigged by improper operation or inexperienced maintenance staff, which is in disguise and happens from time to time. In terms of the level of faults, there are soft faults and hard faults as shown in Figure 2 (Fu and Liu, 2017a; Kai et al., 2018). The hard fault happens when a system configuration fails to work, such as stuck valves, pump failures, and no digit on the sensor. These faults are severe to the SWHs, yet it is not difficult to track down them since they are shown in data and curves. On the contrary, the soft fault refers to the imperceptible system under-performance. In fact, this fault is more detrimental, as it is hardly noticeable. When it is found, a loss is on the way. The four types of faults are classified by different criteria. The hard fault is easy to be noticed, thus here we will not discuss it. Generally, we describe both fault detect and diagnosis. But there are two different concepts, two different steps in the analysis of fault (Chen et al., 2013; Wang et al., 2018a; Yang et al., 2018). Fault detect is to check fault whether it happens while the fault diagnosis is a detailed analysis of fault, such as the specific location, categories and severity degree. In SWHs, sensor drift, valve leakage, dusty solar thermal collectors, increasing heat loss in solar and less insulated water tank are among the major soft faults. In this study, our research focuses on the soft faults in SWHs, including dusty solar thermal collectors, heating empty collectors, heat transfer inefficiency and leakage due to loose valve.
Classification of faults in SWHs.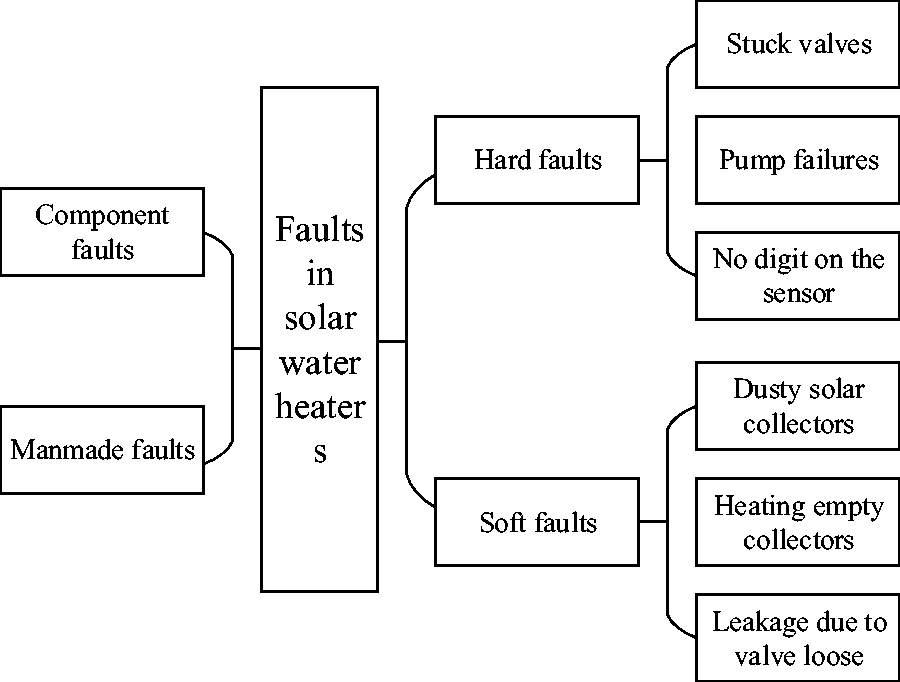
The dusty solar collector is one of the major faults. Collectors are prone to be dusty outside, which grow worse in sand storm days. Therefore, thermal efficiency of the dusty collectors will be lower as the sunshine is less permeable. This problem is barely noticeable, adding that maintenance personnel seldom keep an eye on it (Maisto et al., 2016). Apart from lowering the thermal efficiency of collectors, dust also leads to a low temperature at the outlet of collectors and thus the hourly heat gain also drops. Heating empty collectors happens when the waterless glass tubes in solar thermal collectors expose to sunshine, the heat collected from solar radiation is absorbed by the material due to an absence of working fluid and thus the temperature surges, even leading to an explosion (Chen et al., 2017; Sun et al., 2017b). In this case, El-Amin and Sun (2010) proposed that the temperature at the outlet of collectors climbs dramatically while the flow remains zero and the temperature of water tank stays unchanged. In SWHs, there is a variety of valves prone to be worn-out after a long-time working, and the system may suffer a leakage. The system is in connection with the outside. When water is running out, temperature at the outlet of collectors may climb due to air press and the flow is decreasing. A mixed flow of water and air is observed inside the tubes when air is pressed into the tubes. As instable as fluid is, temperature at the outlet of collectors and flow are also instable, which lead to a continuing fluctuation (Chen et al., 2017).
Review of fault diagnosis in SWHs
Researches regarding fault diagnosis mainly focus on HVAC systems, such as central air-conditioning, refrigeration units and VAV, yet little attention has been paid to SWHs. The investigation in HVAC systems is of great theoretical significance. Therefore, reviewing the development of fault diagnosis in HVAC systems theoretically facilitates us in tracking down the faults in SWHs (Liu et al., 2017b; Onea and Rusu, 2016; Yu et al., 2016). Fault diagnosis in HVAC systems, starting in 1980s, has been studied for a long time and received much attention since 1990s, when facilities of refrigeration equipment and air conditioners were the study objects. At that time, major work was the diagnosis of facilities’ parameters for further analysis. The diagnosis was conducted to figure out the relationship between physical objects and the subsequent analysis was made on the surface without touch the deep-seated problems. When a facility is in failure, it is in various changes mechanically, electrically, physically and chemically which is on the rise as the failure grows worse, and the failure can be studied by monitoring it with many detecting measures. Facing the complicated scenarios in SWH faults and an insufficient knowledge mankind created, technologies of internet of things and AI diagnosis have been introduced. Multi sensors allow us to obtain the parameters of SWHs. AI is adopted to construct a model for diagnosing SWH faults (Barbour et al., 2014; Elwalid et al., 2006; Urban et al., 2016), which can learn the working mechanism of SWHs and in turn identify faults. For fault diagnosis in practice, a rational and accurate diagnosis depends on an integrated analysis based on the characteristic information of various respects. Fault diagnosis is of substantial significance in ensuring safety in working SWHs, as it applies theoretical studies into engineering practice with much progress made in fields of signal obtaining and sensor technology. Yeo et al. (2016) state clearly the relationship between mechanism and presentations of faults, signal processing and diagnose method, smart decision-making and diagnostic system.
AI diagnosis technologies chiefly refer to artificial neural networks, expert system, wavelet analysis and support vector machine (SVM) (Jiang et al., 2018; Souliotis et al., 2009). McKellar (2012) set an auto fault diagnosis system by exploring a physical model of steam compression refrigerating machine. It is in the project founded by International Energy Agency (IEA) that breakthrough was made in fault diagnosis in HVAC conditioners. The institute proposed an array of sub-projects looking into air conditioning system in improving control simulation, diagnosing faults, simulating faults and setting a platform for verifying diagnosed faults (Li et al., 2018; Maestri et al., 2014; Okochi and Yao, 2016; Wang and Wang, 2019; Yang et al., 2014). The projects were undertaken by experts and professionals of faults diagnosis in HVAC conditioners. In this field, there are many distinguished Chinese experts who are Chen et al. (2016) from Hu Nan University, Wang and Wang (2002) from Hong Kong Polytechnic University, Li and Li (2015) from Xi’an University of Architecture and Technology and Liu et al. (2015) from North China Electric Power University.
US Department of Energy (DOE) also sponsored the projects, including the one exploring energy consumption in buildings and operating fresh air handling units. Experts including Salsbury set a faults diagnosis model for AHU which has proven to be highly efficient (Ma et al., 2012). Meanwhile, DOE also founded researchers including Sreedharan (2013) in exploring the effect of faults diagnosis in cooling water unit. Similar efforts have been made by Mashraei et al. (2016) in probing into online faults diagnosis kit for HVAC conditioners. When it comes to faults diagnosis in SWHS, Han et al. (2010) have investigated the major faults in SWHs with a passive system. By referring to HTS, Liu et al. (2017b) designed and selected the potential external features combinations of SWHs with glass evacuated tube collectors which are efficient in incepting heat. By predicting the heating rate, the complex correlation between the external features and the heating rate is revealed.
From the above review, it can be found that little research works concern in faults diagnosis in SWHs, so does the efforts relating to SVM and evidence theories. The SWHs are prone to hit by complex and unnoticeable faults (Liu et al., 2017a). In this study, real-time SWHs data have been collected by sensors in the internet of things. The faults are classified and the parameters are identified after a wavelet packet energy method is adopted to track the features of the faults and create sets of character vectors and the SVM is employed to set a model for diagnosing faults roughly and the results are processed by fusing with decision-making information. This study marks a breakthrough in the real-time fault diagnosis in SWHs, reducing the time and cost spending on maintenance and improving the efficiency of SWHs.
SVM and D-S evidence theory
An introduction to SVM theory
Support vector machine is a novel training machine learning method supporting the linear binary classification problem (Deo et al., 2016), which is theoretically based on Vapnik–Chervonenkis dimension and structural risk minimization principle. In SVM, the kernal function is used to map input vectors into a high-dimensional feature space, and seek for an optimum separating hyper plane as the decision plane in the space. The sum of distances from two sample sets to the plane is maximal so that the classification of samples is fulfilled, transferring the problems from low-dimensional space to high-dimensional space and the presenting curse of dimensionality.
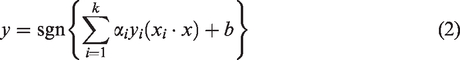
In a linear separable sample set (xi, yi) (xi∈Rd, yi∈{+1,−1}, i = 1,2,…,n), SVM converts the optimum separating hyper plane problem into a convex optimization problem:
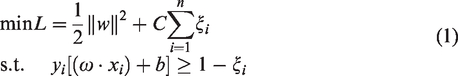
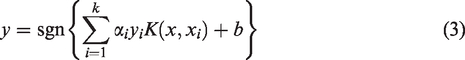
For linearly separable problem, its decision function is:
In the linear inseparable sample set (xi, yi) (xi∈Rd, yi∈{+1,−1}, i = 1,2,…,k), it can be mapped into a high-dimensional feature space by adopting non-linear transformation
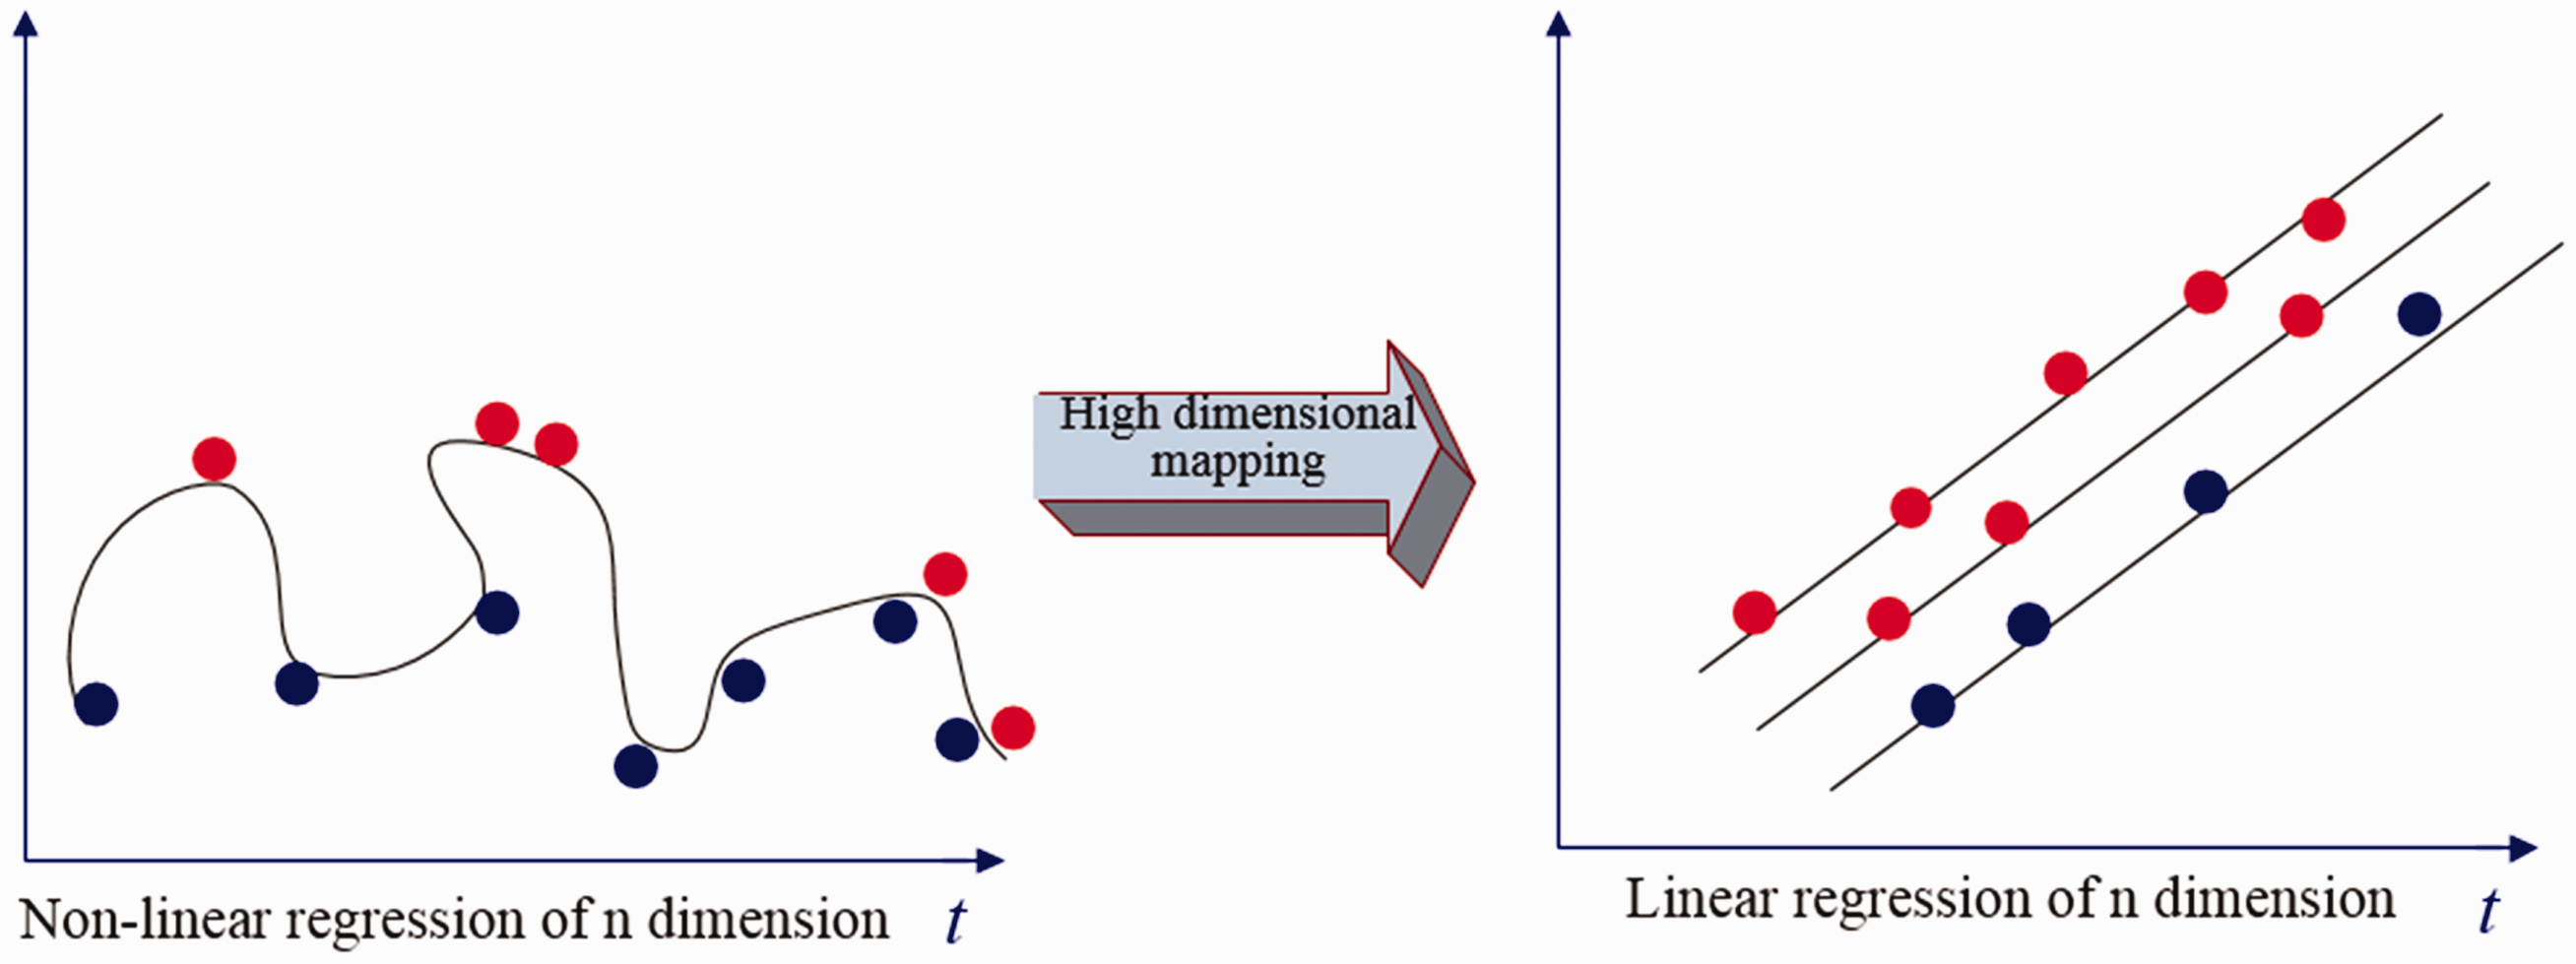
The mapping relationship between nonlinear regression and linear regression.
SVM usually deals with binary classification problems; however, when it comes to fault diagnosis, how to work out multi-class problems is the task. The proposed multi-class SVM methods include one-against-many, one-against-one, directed acyclic graph, binary tree and error correction code. In this study, multi-class classifiers are constructed based on the “one-against-one” (Kang et al., 2015; Raitoharju et al., 2018; Wang et al., 2018c) approach whose basic concept is that N (N − 1)/2 SVMs are constructed for n-class problems and one of each two class is trained by one SVM to separate them. “One-against-one” multi-class SVM is an effective approach to address the problem. In the approach, one SVM is designed between random two sample sets and K sample sets require k (k−1)/2 SVM classifiers. Every binary classification is a vote and it is allowed to vote at each data point which is classified as the final point with largest number of votes.
D-S evidence theory
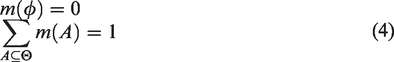
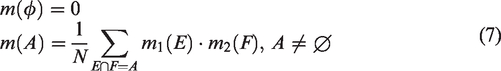
D-S evidence theory essentially is a process in which multiple specific evidence are combined and thus the abstract evidence derives in the framework of discernment. The evidence fuses the information of the specific evidence and focuses on their common views, which gives rise to a rational conclusion (Wang et al., 2018b). Suppose a set of all the possible independent solutions to a problem is a frame of discernment ={F1, F2,…,Fn}, where Fj is the focal elements of Θ and, 2Θ is the power set of Θ, if the set function mapping m:2Θ→[0,1] satisfies:
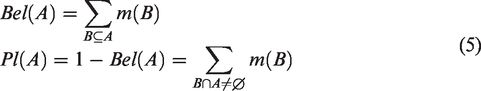
Define the mapping

The combined BPA function m:2Θ→ [0,1] is written as:

SVM and D-S fusion
BPA function. Suppose h-class data, for arbitrary x, sigmoid function proposed by Platt is adopted to evaluate the probability of matching classes, which is denoted as:

For the posterior probability pi,
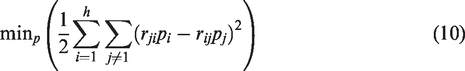
For any “One-against-one” multiclassification SVM, the posterior probability pi is obtained based on equation (10) after completing learning sample set. Testing the learning sample set is necessary and recognition efficiency qi is acquired, so BPA equation can be defined as:

Decision fusion and discriminate rules. With regard to the multi-feature information fusion, enormous calculation may rise if equation (7) is introduced hastily, which makes it unpractical. In this study, D-S compound algorithm based on matrix analysis is adopted to work out the fusion results. When it comes to recognize one object with n-class features, mij, independent basic assignment for m objects with n-class features, and θi, probabilities of uncertainties, are denoted by matrix as:
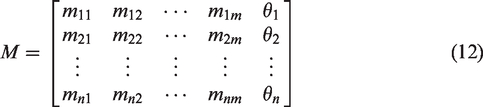

When a transposition of each row in the matrix multiplies another row, a new matrix R (m + 1) × (m + 1) is obtained.
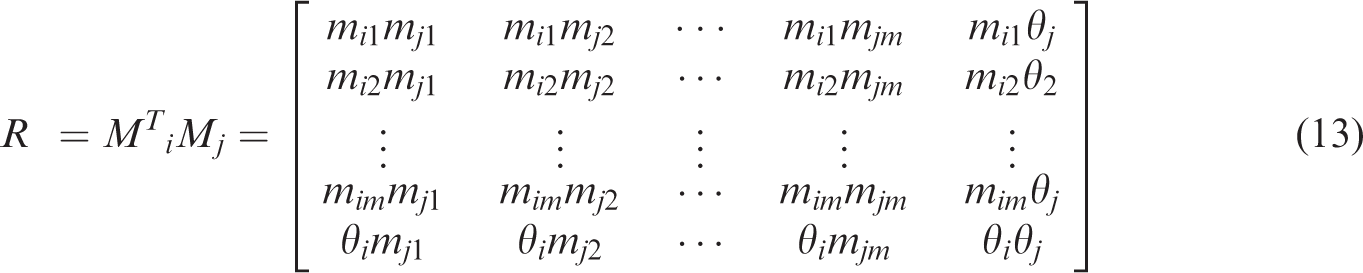
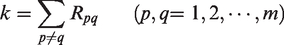
The flowchart of the fusion algorithm is shown in Figure 4. In each execution, (m + 1) column vector multiply (m + 1) row vector in the matrix multiplier calculation, the time for calculations is T ((m + 1) 2), and the time for fusion results is T ((m + 1) 2n), which shows an approximately linear correlation with the number of features n.
Flowchart of fusion arithmetic.
Suppose Ai(i = 1,2,…,n) is the class of faults in SWHS, Aw is the target class. When the confidence of Ai and the uncertainty of evidence mj(θ) in frame Θ are obtained, classification decision should comply with the following rules:
m (Aw)=max{m (Ai)}, indicating that the target class is the one with maximal confidence. m(Aw)-m (Ai)>ε1(ε1> 0), indicating that the difference of the target class and other classes must exceed a threshold. m(Aw)-m(θ)>ε2(ε2> 0), indicating that the confidence of the target class must exceed the assignment of the uncertain confidence.
m(θ)<ε3(ε3>0), indicating that the assignment of the uncertain confidence must be less than a limit, i.e. there should be less uncertainty of evidence supporting the target class.
SVM-DS fusion based fault diagnosis in SWHs modeling
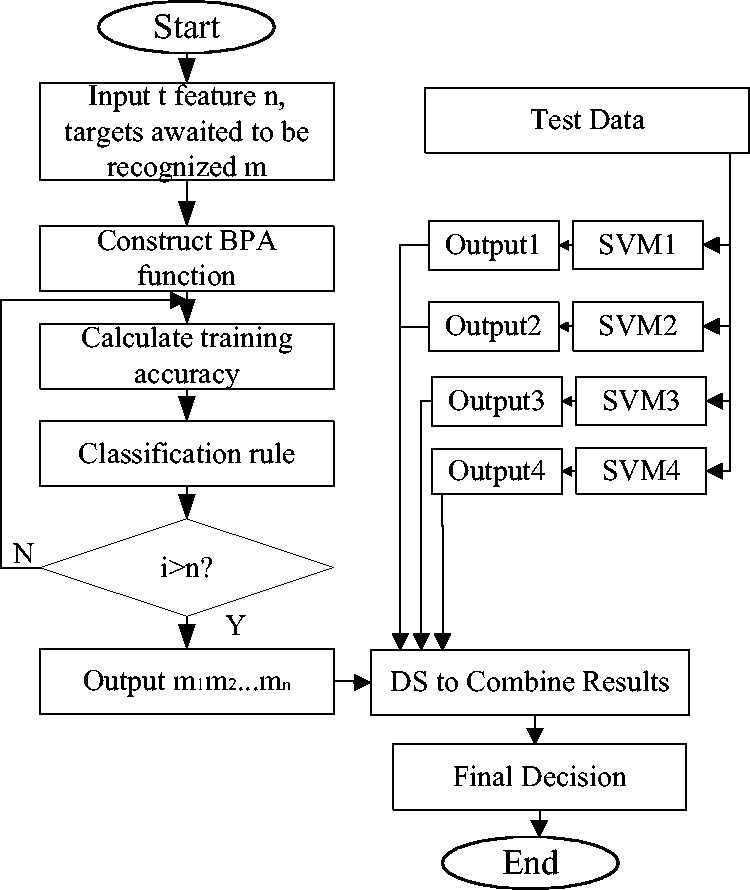
The model of SVM-DS fusion based fault diagnosis in SWHs involves SVM classification model and decision fusion model. SVM is used to train, test and classify preliminarily the parameter characteristics pertaining to the performance of fault samples (Hui et al., 2017). A decision-making fusion is conducted among the results of preliminary classification, which gives rise to optimal results. The model is shown in Figure 5:
SVM-DS fusion based fault diagnosis model.
Constructing the soft fault space and a frame of discernment. It is required to investigate the operation and fault mechanism of SWHS and find out the major soft faults, which allows us to construct a set of soft faults Θ={F1, F2,…, Fk}.
Constructing the fault parameters space. It is required to use multi-class sensors to obtain the original data of faults, extract the character parameters from the sensors and classify them. A set of fault parameters space is constructed based on multiple feature sub-spaces and written as E={E1, E2,…, En}.
Constructing evidence and calculating BPA. The fault parameters in feature sub-space are preliminarily diagnosed in the local diagnostic sub-modules in SVM. When the diagnostic results are obtained, the evidence for fault diagnosis in SWHS is thus constructed. Based on the preliminary diagnostic results, equations (9), (10) and (11) are used to calculate the basic belief assignment function set M={m1 (Fj), m2 (Fj)…, mn (Fj)}, j = 1,2,…, k.
Basic belief assignment m1 (Fj) of the evidence in each feature space is used to calculate the belief range of each proposition in the frame of discernment which is supported by single evidence [Beli, Pli]. In traditional SVM, the input is hard decision as inputting class information {1,−1}. BPA is possible when hard decision is mapped into [0,1].
According to the rule governing the fusion diagnosis decision, the conclusion regarding fault diagnosis in SWHS is finally made.
Laboratory test
Experiment description and data obtaining
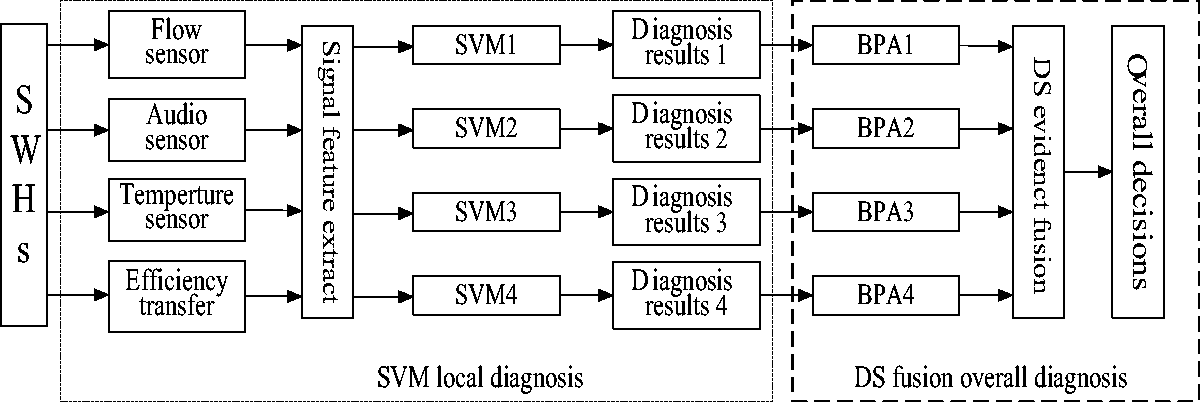
For obtaining fault data, a test is conducted in solar energy testing center located in Shun Yi, Beijing, China. The SWH in the test is an ordinary SWH with a flat-plat solar collector (Sun et al., 2017c). The hot water is stored in the tank to bring heat to rooms. Fault-free test is first conducted. Detection and diagnosis are all made by way of comparison, since fault is a change in normal state. Any detection and diagnosis are modeled based on normal data. The test lab is shown in Figure 6.
Test system site. (a) Flat-plat solar collector. (b) Test lab indoor.
Fault data are captured by way of calculating thermal efficiency with the installed flow sensor, voice sensor, and temperature sensor (Sun et al., 2017d). After studying the experimental data of faults including dusty solar collector, heating empty collector, heat transfer inefficiency and leakage due to the loose valve, we find the frame of discernment for the SWH in diagnosis Θ={F1, F2, F3, F4}, where F1 refers to dusty solar thermal collector, F2 refers to heating empty collector, F3 refers to heat transfer inefficiency, and F4 refers to leakage due to the loose valve. Before extracting features, we preprocess the signal data by waveform interception and signal de-noising.
Extracting features of voice data
For generality, set of features regarding singles of above samples are extracted from wavelet domains including time domain, frequency domain and time–frequency index and wavelet packet domains with equal interval time–frequency.
Extracting the wave feature in time domain
After obtaining the absolute value of sample singles, we introduce the low-pass filtering to produce the waveform envelops of the samples. The results are normalized. Five hundred and twelve dots intercepted with the peak of the waveform as the sym-center are regarded as the valid waveform data. The data are evenly divided into four segments and the mean value, variance, the mean value of slope, variance of slope and normalized cumulant, as well as the mean value and variance of all the waveform data are calculated in each segment (Prendergast et al., 2011). By combining all these values into a vector, the waveform feature in time domain of samples is thus determined, which displays the waveform and energy distribution of signals in time domain.
Extracting amplitude spectrum feature in frequency domain
The amplitude spectrum of sample signals is obtained by applying fast Fourier transform. Considering to the frequency brand range of ultrasonic testing singles, we divide the amplitude spectrum into four segments by referring to the center frequency of transducer which is regarded as the sym-center. In each segment, the mean value, variance, the mean value of slope, variance of slope and normalized cumulant, as well as the mean value and variance of all the waveform data are calculated (Kang et al., 2018). By combining all these values into a vector, the amplitude spectrum feature in frequency domain of samples is thus determined, which displays the waveform and energy distribution of signals in frequency domain.
Extracting energy distribution features in wavelet domain
The wavelet decomposition algorithm is adopted to decompose sample singles in six layers whose approximation coefficients and detail coefficients are obtained subsequently. Ratio of the coefficients square in each segment and data length is calculated. The energy distribution features in wavelet domain of sample signals are revealed by combining the 12 values into a vector (Duan et al., 2018). When determining the mother wavelet in wavelet decomposition, we take its correlation with decomposed signals into account. In this study, wavelet sym4 with similar waveform is determined. Energy distribution features in wavelet domain show the distribution of signal energy in index band domain.
Extracting energy distribution features in wavelet packet domain
The wavelet packet decomposition algorithm is adopted to decompose sample singles in five layers whose 32 subband coefficients are obtained subsequently. The frequency of decomposition is equal and the later 16 subband coefficients are regarded as the high frequency segment due to sample frequency, which is out of the frequency band of ultrasonic testing signals. Therefore, the first 16 subband coefficients are regarded as valid data (Yu et al., 2018). The quadratic sum of each subband coefficient is calculated and the obtained results are combined into a vector as the energy distribution features in wavelet packet domain. Likewise, wavelet sym4 is considered as the mother wavelet (Ekici et al., 2008). The energy distribution features in wavelet packet domain display the distribution of signal energy in wavelet domain with equal frequency.
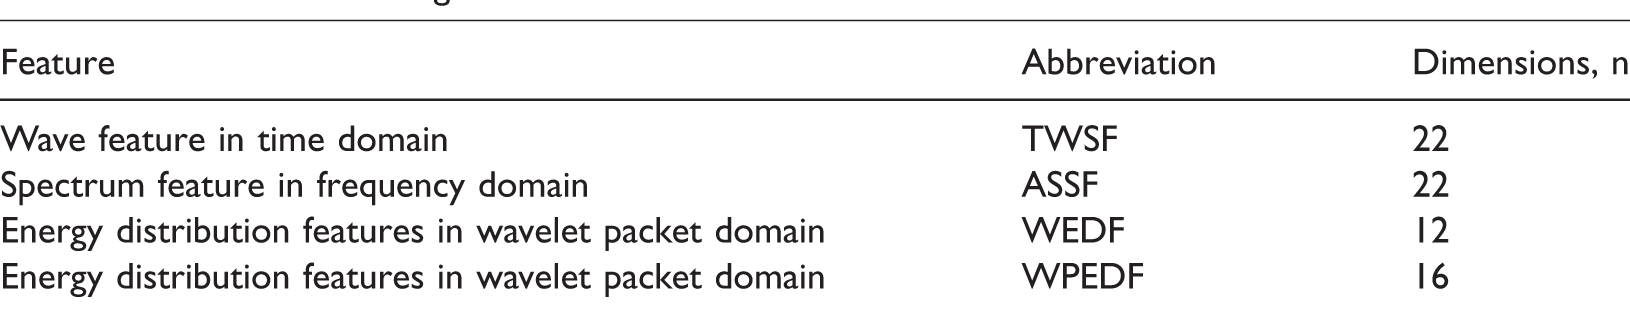
The above stated methods are applied into practice to extract features of all samples. All the features are normalized to dent susceptibility of recognizer in finding the set of training sample features and enhance its generality. The methods for extracting features and their description are shown in Table 1.
Features extracting measures.
SVM training and confidence calculation
Data of the four faults are used to construct a model D eer ∈R and the SVM training vector D train ∈R is constructed, where the kernel function in SVM model is radical basis function (RBF), and the cross grid method is adopted to determine penalty variable c and gamma function g which is optimized by PSO algorithm. Figure 7 shows the process of SVM parameters optimization in which the optimal parameters c = 6.673 and g = 0.154 are determined by PSO algorithm and the SVM global and local confidence are calculated by its confusion matrix with the former being γ0 = 0.864 and the latter being ω0={0.645, 0.836, 0.886, 1.00}.
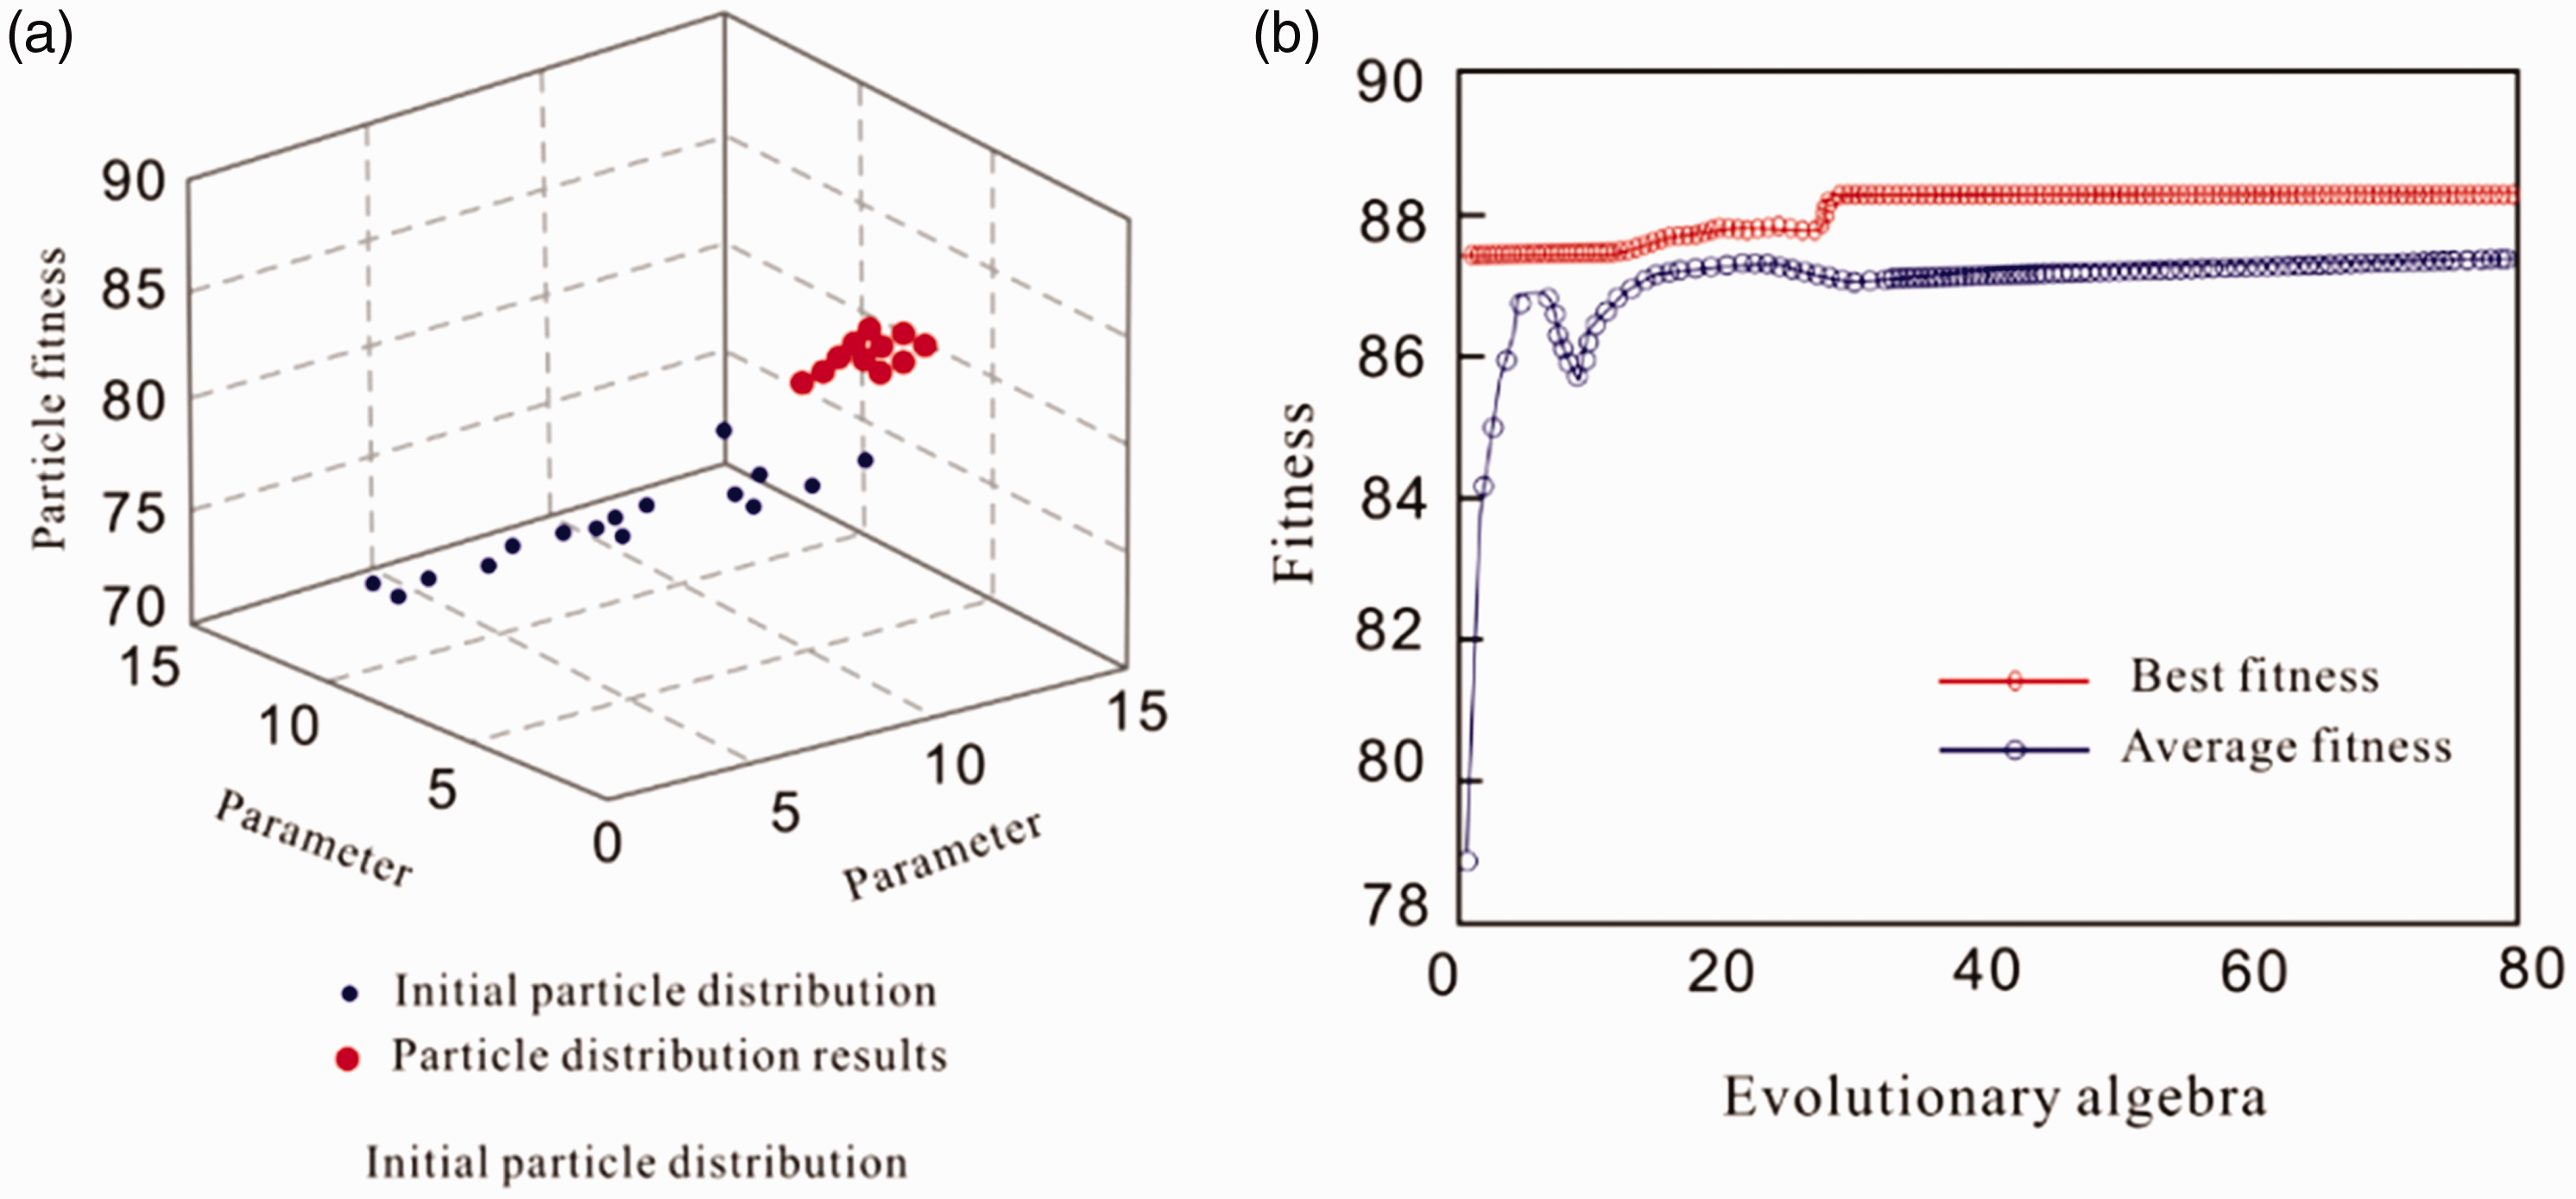
Parameter optimization using PSO.
Results and discussion
Based on the real-time data collected in the system, the above-mentioned extracting methods are adopted to process the audio data of faults in SWHS and find their weighted averages. Their signal features are extracted and make analysis on them. The mapminmax function in MATLAB is used to normalize the original vibration data and audio data (Mirvakili et al., 2012) which are decomposed and restructured by wavelet packet transform. Although audio data are difficult to be digitized, the sound of water heater collected can be transformed into waveform data which are used in research (Fu and Liu, 2017b). We calculate the energy valve in each frequency band whose share in the total energy is referred to construct a set of diagnostic feature vectors E1={A1,A2,A3,A4,A5,A6,A7,A8}; extracting the signal features of temperature and flow depends on a fusion of multiple sensor data in different conditions at different time. Heat transfer rate is hourly calculated based on the above parameters, and thus a set of diagnostic feature vectors is constructed. The correlation between features’ parameters and faults is determined, which facilities the classification of faults.
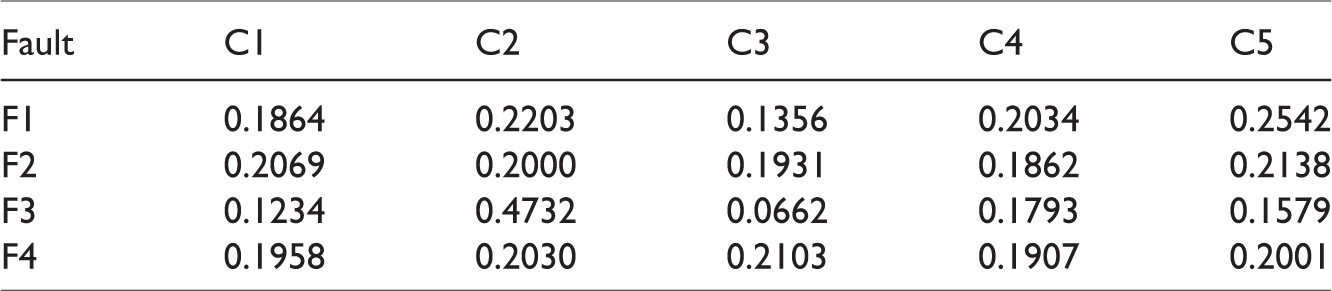
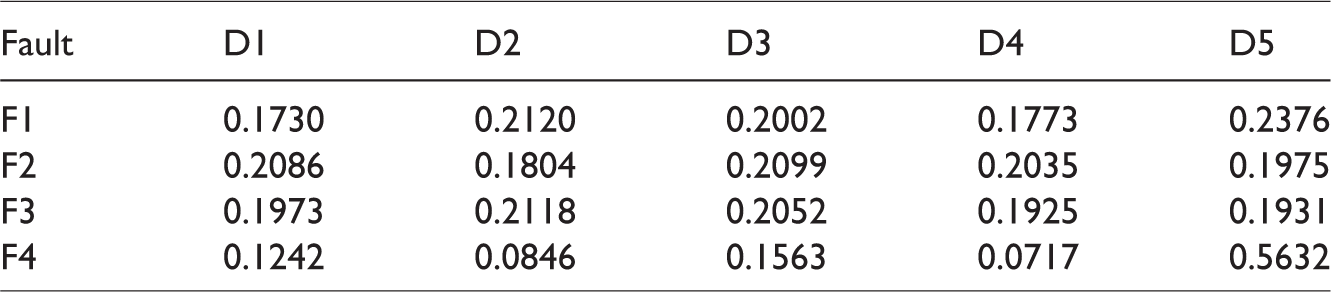
The data of temperature at outlet of the solar thermal collector, hourly flow and hourly heat transfer rate of the SWH are collected with multiple sensors and normalized to construct sets of diagnostic feature vectors E2={B1,B2,B3,B4,B5}, E3={C1,C2,C3,C4,C5} and E4={D1,D2,D3,D4,D5}. The four sets mentioned above constitute the faults parameter space of the SWHS E={E1,E2,E3,E4} as shown in Tables 2 to 5.
Sample space data of audio feature evidence.
Sample space data of temperature feature evidence.
Sample space data of flow feature evidence.
Sample space data of heat transfer rate feature evidence.
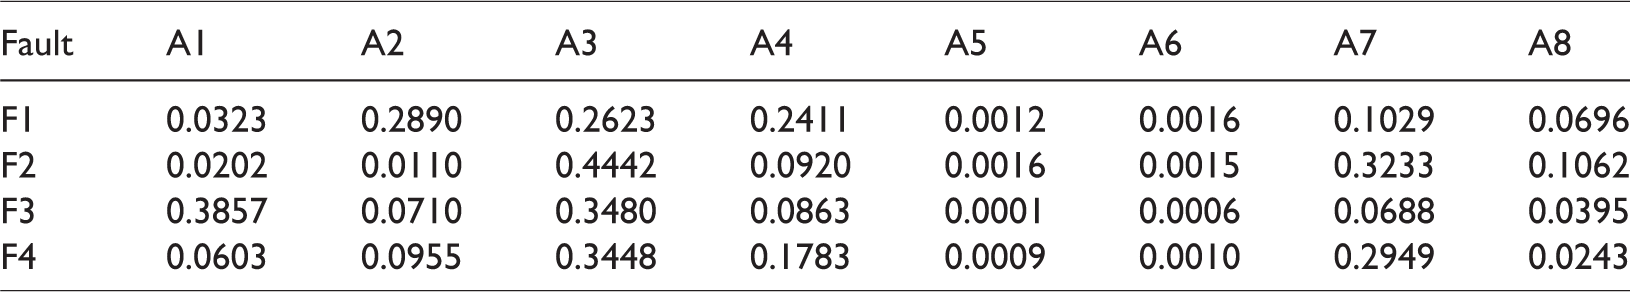
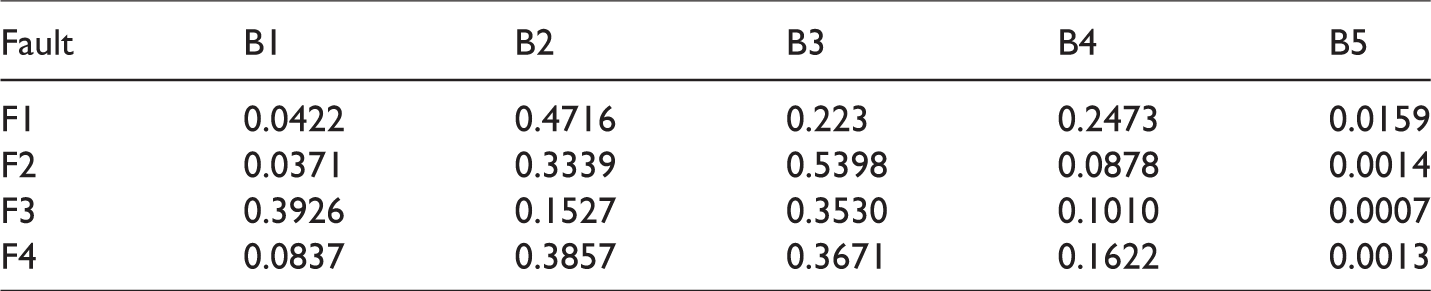
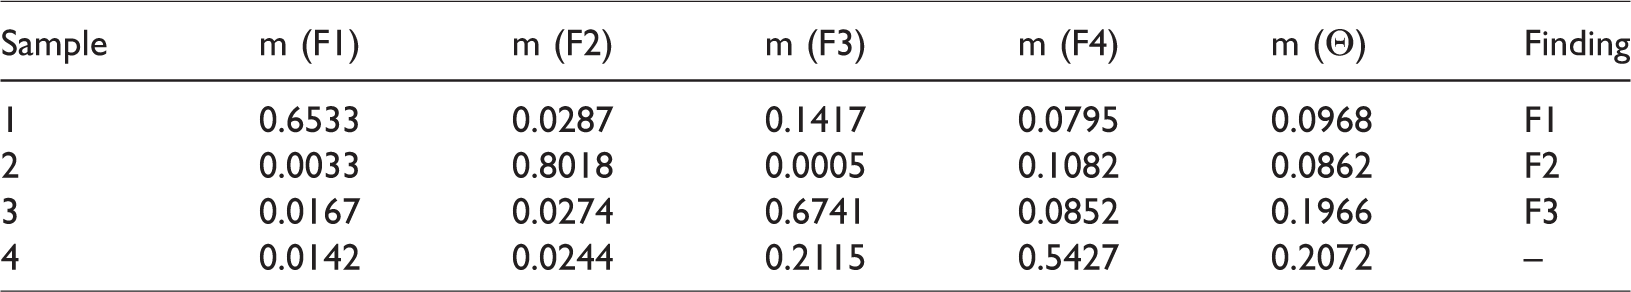
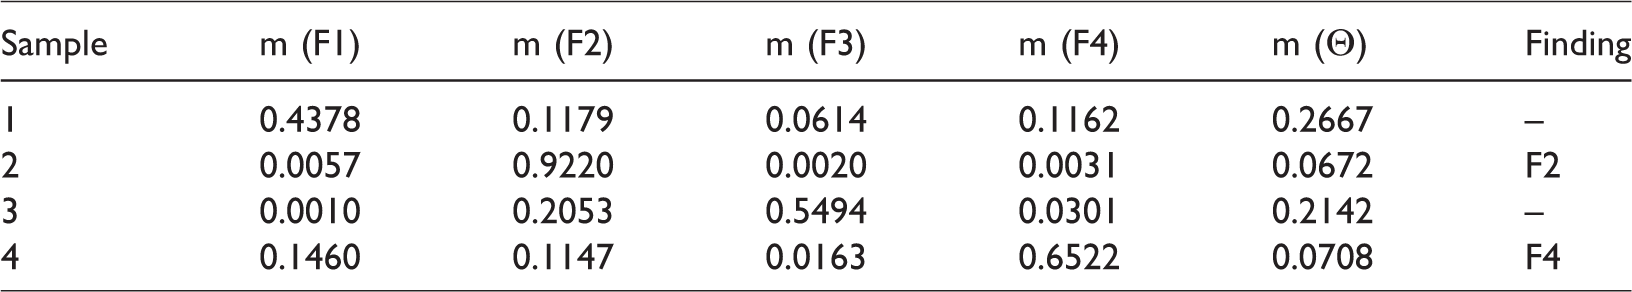
Based on the above data, “One-against-one” multi-class SVM is adopted to diagnose the soft faults in the SWH, which is made by LIBSVM on MATLAB, a software developed by Lin Zhiren, an associate professor at Taiwan University. Specifically, the sample data in fault parameter spaces are inputted into the SVM preliminary diagnosis model, and the data are trained, verified and tested afterwards, so that the preliminary results in SVM diagnosis are obtained, and the evidence of feature spaces are constructed whose basic belief are worked out as M1, M2, M3 and M4 shown in Tables 6 to 9.
Basic belief assignment M1.
Basic belief assignment M2.
Basic belief assignment M3.
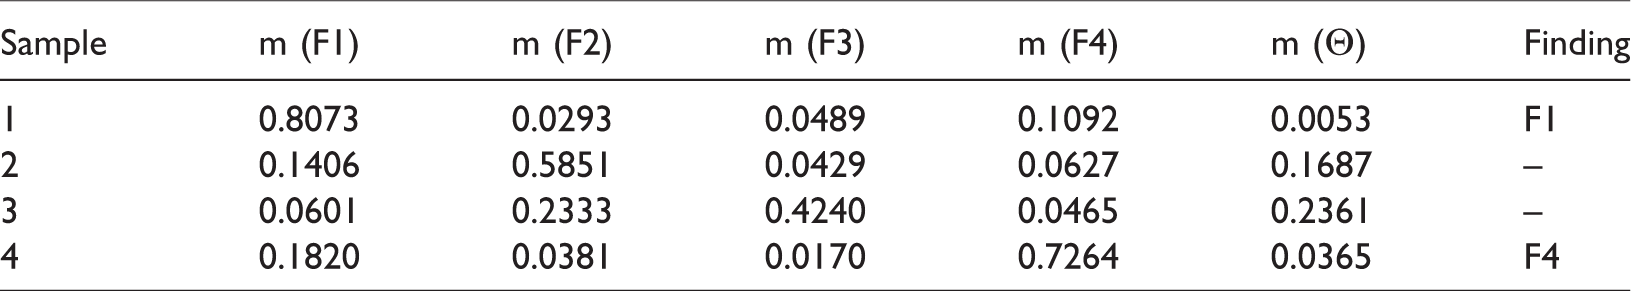
Basic belief assignment M4.
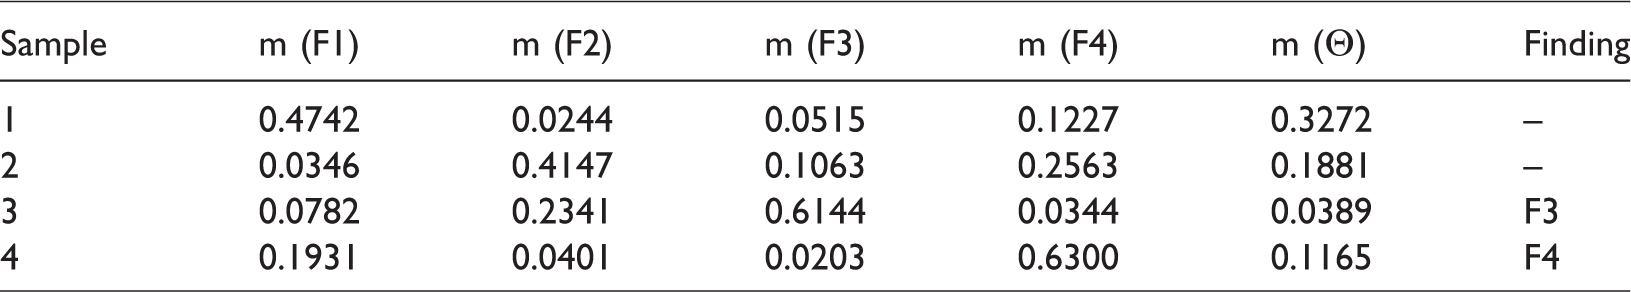
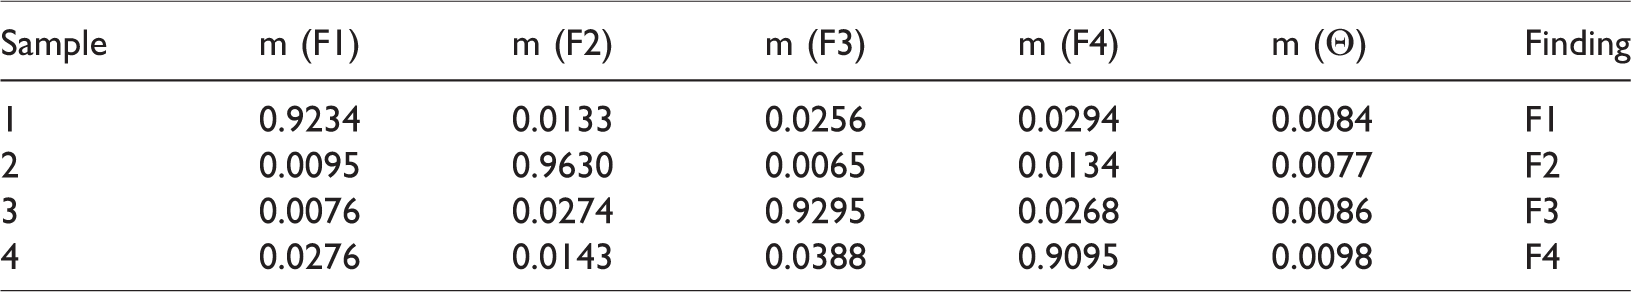
From these tables, it can be summarized that lower level of belief, more uncertainties and unrecognizable faults may arise when fault diagnosis is conducted based on the features of one evidence. Therefore, the basic belief assignment M is a result of M1, M2, M3, and M4 which are fused by D-S evidence fusion theory algorithm. Table 10 reveals that when M is calculated, the belief grows higher and uncertainties drop noticeably, and this improvement is also found in the belief. Therefore, an accurate recognition of the SWH’s faults is accomplished. It can be concluded that a fusion of multiple feature evidence leads to less uncertainties in fault reorganization.
Fused basic belief M.
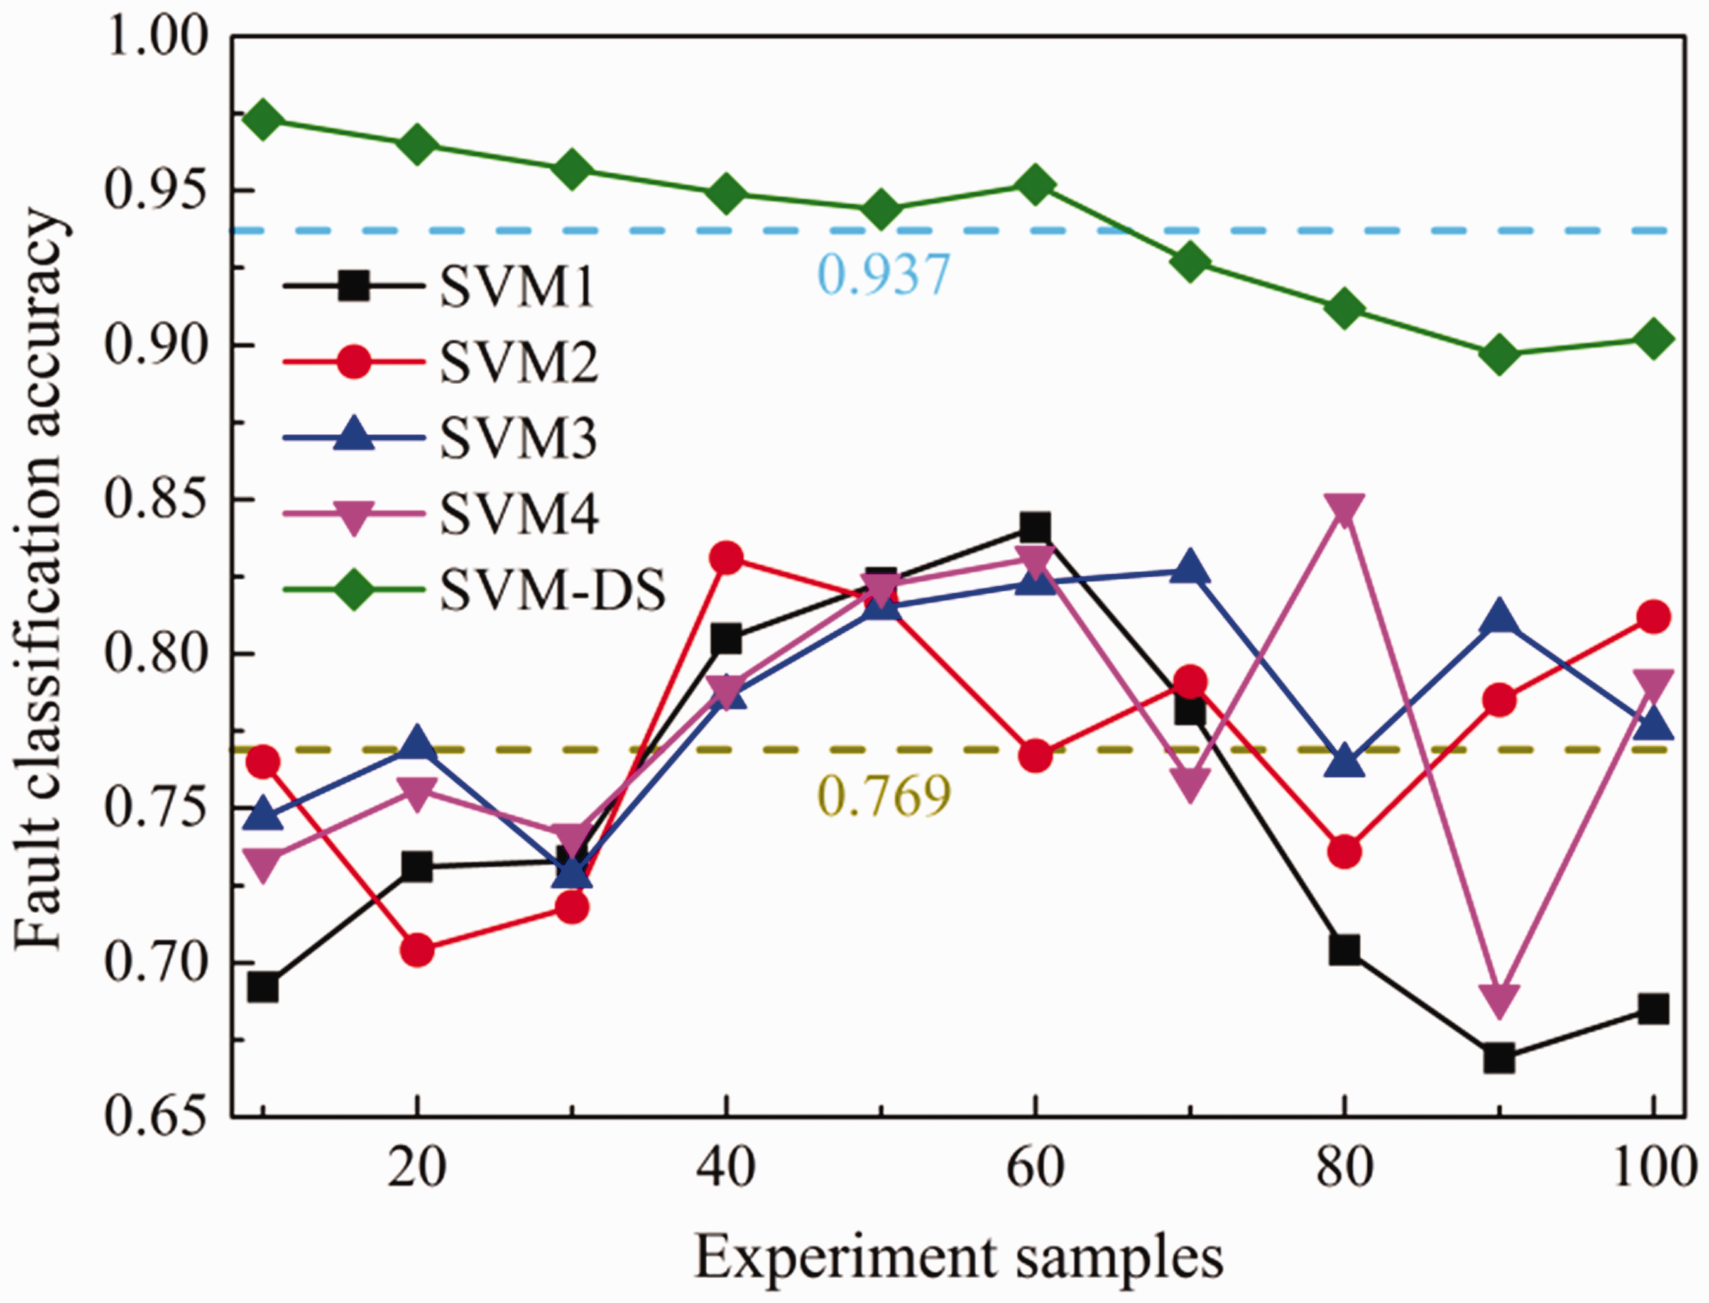
For further validation of the accuracy of the fault diagnosis approach proposed in this study, additional experiment and analysis are made with more data samples to testify the accuracy of fault classification, which is shown in Figure 7. Diagnosis results reveal that the SVM-DS fused approach shows a high accuracy in recognizing faults in SWHS.
As is seen in Figure 8, in 100 tests, the classification based on the SVM-DS fused fault diagnosis approach shows a minimal accuracy rate in scores 89.7%, with a mean value of 93.7%. The highest accuracy rate of traditional method is 84.7% and the average value is only 77.6%. Contrast experiments evidence shows that an improvement from the SVM based fault diagnosis model is observed in the approach proposed in this study in terms of accuracy and stability.
Accuracy of fault diagnosis in SWHs in mines.
Discussions on two concerns
Differences shown in faults of pumps and valves
In the SWH, valves include inlet water valve, cold water inlet valve, back-water valve and pumps installed in circuit. Pumps in SWHs are categorized in the valves since valves and pumps are in consistency logically as all the valves in the SWH are switchable and the pumps are under start and stop control (Liu et al., 2014). Well-functioned valves are critical for a stable system. In automatic control theory, they are referred to as logic switches in 0 or 1. Temperature sensor and water-level sensor are continuous, allowing an over-all description in various system features.
Difference shown in faults of static pattern and dynamic pattern
The static pattern and the dynamic pattern are the major working mechanisms found among SWHs in practice. The static pattern is about when the system is not working, which usually occurs at night or when the temperature difference for water circuit is lower than expected, for example, low temperature at the collector outlet fails to switch on pumps. The dynamic pattern is on when the temperature difference between the collector outlet and the storage tank is high enough to switch on pumps to circuit. Due to factors including heat radiation, outdoor temperature and wind speed, the working time of the system with switch-on pumps is short in a daily route (Fuentes et al., 2016). In static pattern, the circuit pump in SWHs does not work when all configurations are in a relative stability with changes seen due to outdoor meteorological factors. This stability allows us to validate the reliability of the sensors positioned by referring to long-term data observation and the logical relationship between SWHs in normal operation (Warner et al., 2013). In dynamic pattern, temperature difference between the collector outlet and the storage tank meets the requirement and the SWHs stay in the major state when configurations are working in accordance with physical models and computational relationships, which allows us to validate the accuracy of sensors.
Conclusions
Solar energy is mainly exploited and consumed by the way of SWH, yet a survey among facilities in practice reveals that SWHS is low-efficient and failures arise from time to time, leading to waste. As intelligent building advances and the cost arising from running electronic devices and measuring equipment go downhill, sensors have been widely applied in engineering to facilitate data acquisition and control system inspection. In the long-term operation, however, it is unlikely to ensure stability in the sensors. To address this problem, a fault diagnosis approach in SWHSs is proposed to detect and diagnose common faults and improve stability.
In this study, it is introduced that the internet of things to support data acquisition technologically adopted in the working mechanism of SWHs. Subsequently, a novel SWHs fault diagnosis approach based on SVM-DS fusion is presented, which regards data of audio, temperature, flow and heat transfer rate as SVM inputs and local classification results are outputted after diagnosis. Afterwards, a sound overall fault classification results are found by adopting the D-S evidence theory to make decisive information fusion. It should be pointed out the SVM appears to be excellent in terms of small-sample learning and generality and the evidence theory is of objectivity in dealing with uncertainties. Data from multiple sources are fused to diagnose the faults in SWHs. This treatment is believed to be superior, as it is highly applicable and reliable in SWHs, allowing following researchers to further explore space and time. With this method studying objective feature dimensions of SWHs as a whole, our detection becomes more targeted. And it ensures a higher space resolution, so that SWHs are less susceptible yet more adaptable to faults, leaving SWHs in high performance. SWHs are complicated structurally, leading to unnoticeable sort faults. The fault diagnosis approach presented in this study is advanced for its high accuracy, well above 90%. It is thus feasible to prevent faults when their signs appear, as a result, the spending on maintenance is about to drop. It is summarized the approach is considered to be effective in fault diagnosis in SWHSs and makes the system productive.
As SWHs work as a whole, one component in failure might exert unpredictable effect on others. Faults appear more troublesome with much more challenge in maintenance, when two failed components are coupled and interacted. Based on the analysis in this paper, future studies on faults diagnosis in SWHs are expected to focus on the following:
For the approaches optimizing and comparing sensor fault diagnosis, reliability highly depends on completeness of relationship between the measured parameters. This is associated with the system size, i.e. the larger the system’s sensors are, the more rules are found and thus more reliable the system is. This study attempts to describe SWHs, yet it is not sufficient. For the further study, it is suggested to describe SWHs in detail. Theoretically, faults do not occur simultaneously. One fault is likely to be the result of an array of faults; therefore, it is possible that faults may arise at the same time in practice. Multiple faults coupling is believed to be the critical yet challenging research area. But the calculation module of design is not perfect, which still needs further improvement. Authentic fault data are acquired to validate the model presented in this study, but due to practical application, only four faults are under consideration. Further study is expected to test the model in diagnosing more faults if it is allowed. This paper testifies the rules of fault diagnosis analysis by observing the data of fault system. However, there will be a better diagnosis effect if more in-depth analysis of the system is conducted by studying more character parameters.
Footnotes
Acknowledgements
We would like to acknowledge Mr. Qinghua Gu from Xi'an University of Architecture and Technology, for his critical assistance in the work, which significantly improved the quality of the manuscript. We are also grateful to the solar energy testing center, Shun Yi, Beijing, China for providing their in-house database.
Declaration of conflicting interests
The author(s) declared no potential conflicts of interest with respect to the research, authorship, and/or publication of this article.
Funding
The author(s) disclosed receipt of the following financial support for the research, authorship, and/or publication of this article: The authors would like to thank the financial support from the Natural Science Foundation of China, “Research on 5D Refined Mining Production Scheduling Model and Collaborative Optimization Method in Metal Open Pit under Constraints of Grade-Price-Cost” (No. 51774228), the Natural Science Foundation of Shaanxi Province, “Intelligent fusion and early warning of multi-source heterogeneous flow data based on rock failure” (No. 2017JM7005), the Key technology projects of safety prevention and control of major accidents in State Administration of work safety, “Research on safety monitoring and warning system of ultra-deep shaft surrounding rock based on multi-source heterogeneous information fusion” (No. 2017G-B1-0519) and the Excellent doctorate cultivation fund of Xi'an University of Architecture and Technology, “Intelligent fusion of multi-source heterogeneous flow data and early warning of rock failure” (No. 604031715).