
Abstract
A combinative use of the photovoltaic modules and roof coating on building was implemented for an institutional hall in Ghana. Computational fluid dynamics simulation was performed for both coated and uncoated roofs to investigate the heat transfer on the roof with regards to the temperature reduction. Numerical results were compared with the field data. The performance of the solar photovoltaic module deployed on the rooftop was evaluated as well. The results demonstrate that the coated roof gives rise to a significant reduction in temperature, which enhances the thermal comfortability in the building. With the participation of the solar photovoltaic module, a total energy of 427.670 MW h/year could be fed into the national grid. The reduction in the power generation cost is accomplished with the joint application of the solar photovoltaic system and the roof coating.
Highlights
Heat transferred to roof surface was analyzed to investigate the room temperature. Room temperatures were compared for conditions with coated and uncoated roofs. Capability of the coated roof system in lowering the room temperature was assessed. Positive effect of the solar photovoltaic module in energy saving was proved and quantified.
Introduction
Rapid growth of economy has given rise to environmental issues due to the periodic demand on energy sector and the imbalance in the energy supply (Zahedi, 2010). How to meet the balance between the economic vitality and global warming has been a focus in most nations (Hua et al., 2016). One of the best solutions is to reduce the energy consumption rate. This can be realized through effective utilization of renewable energy such as the solar energy. Buildings absorb the solar energy every day and the thermal performance of buildings is significantly affected by roof. Roof color is one of the factors affecting the solar absorptivity of the roofing system (Stavrakakis et al., 2016; Suehrcke et al., 2008). Most of the heat gain is related to the roof structure, and to ensure a sustainable way of reducing the heat gain, a solar system can be installed on the top of the roof (Sirimanna and Attalage, 2016). Most literature in this aspect argues that reflective roof coatings can reduce the consumption intake of electricity during the summer period within the building. The reduction of the average annual external surface temperature and heat flux with roof coatings has been calculated (Brito and Oliveira, 2014).
A novel cool roof heat transfer model was developed specifically by Zingre et al. (2015). It was found that both the peak and indoor temperature were reduced during sunny days with roof coating. A 25°C decrease in temperature on roof surface was accomplished with the application of cool roof (Synnefa et al., 2012). Essentially, heat stemming from the solar energy imposes a significant effect on heat transfer outside and inside buildings (Coons et al., 2017). The coating based on conventional clay tiles was investigated by Pisello et al. (2014). It was observed from the simulation results that the time span during which the indoor temperature went beyond 26°C could be reduced by 18%. White roof was presented by Oleson et al. (2010). It was proved that the roof coating could change emissivity and reflectance and thereby lower the temperature inside buildings. Thus far, coatings with high emissivity and reflectance have been used primarily on flat roofs (Pisello and Cotana, 2014). To examine the reflectivity of cool roofs, both numerical and experimental studies were performed on a laboratory building (Kolokotsa et al., 2012). A comparative analysis was made between concrete and asphalt roofs. It was demonstrated that high reflectance on the roof surface led to cool conditions. With regards to the roof reflectivity, experiments were conducted for different roofing properties; the results are plotted in Figure 1 (Stavrakakis et al., 2016). It is seen that the white roof coating is responsible for high reflectivity.
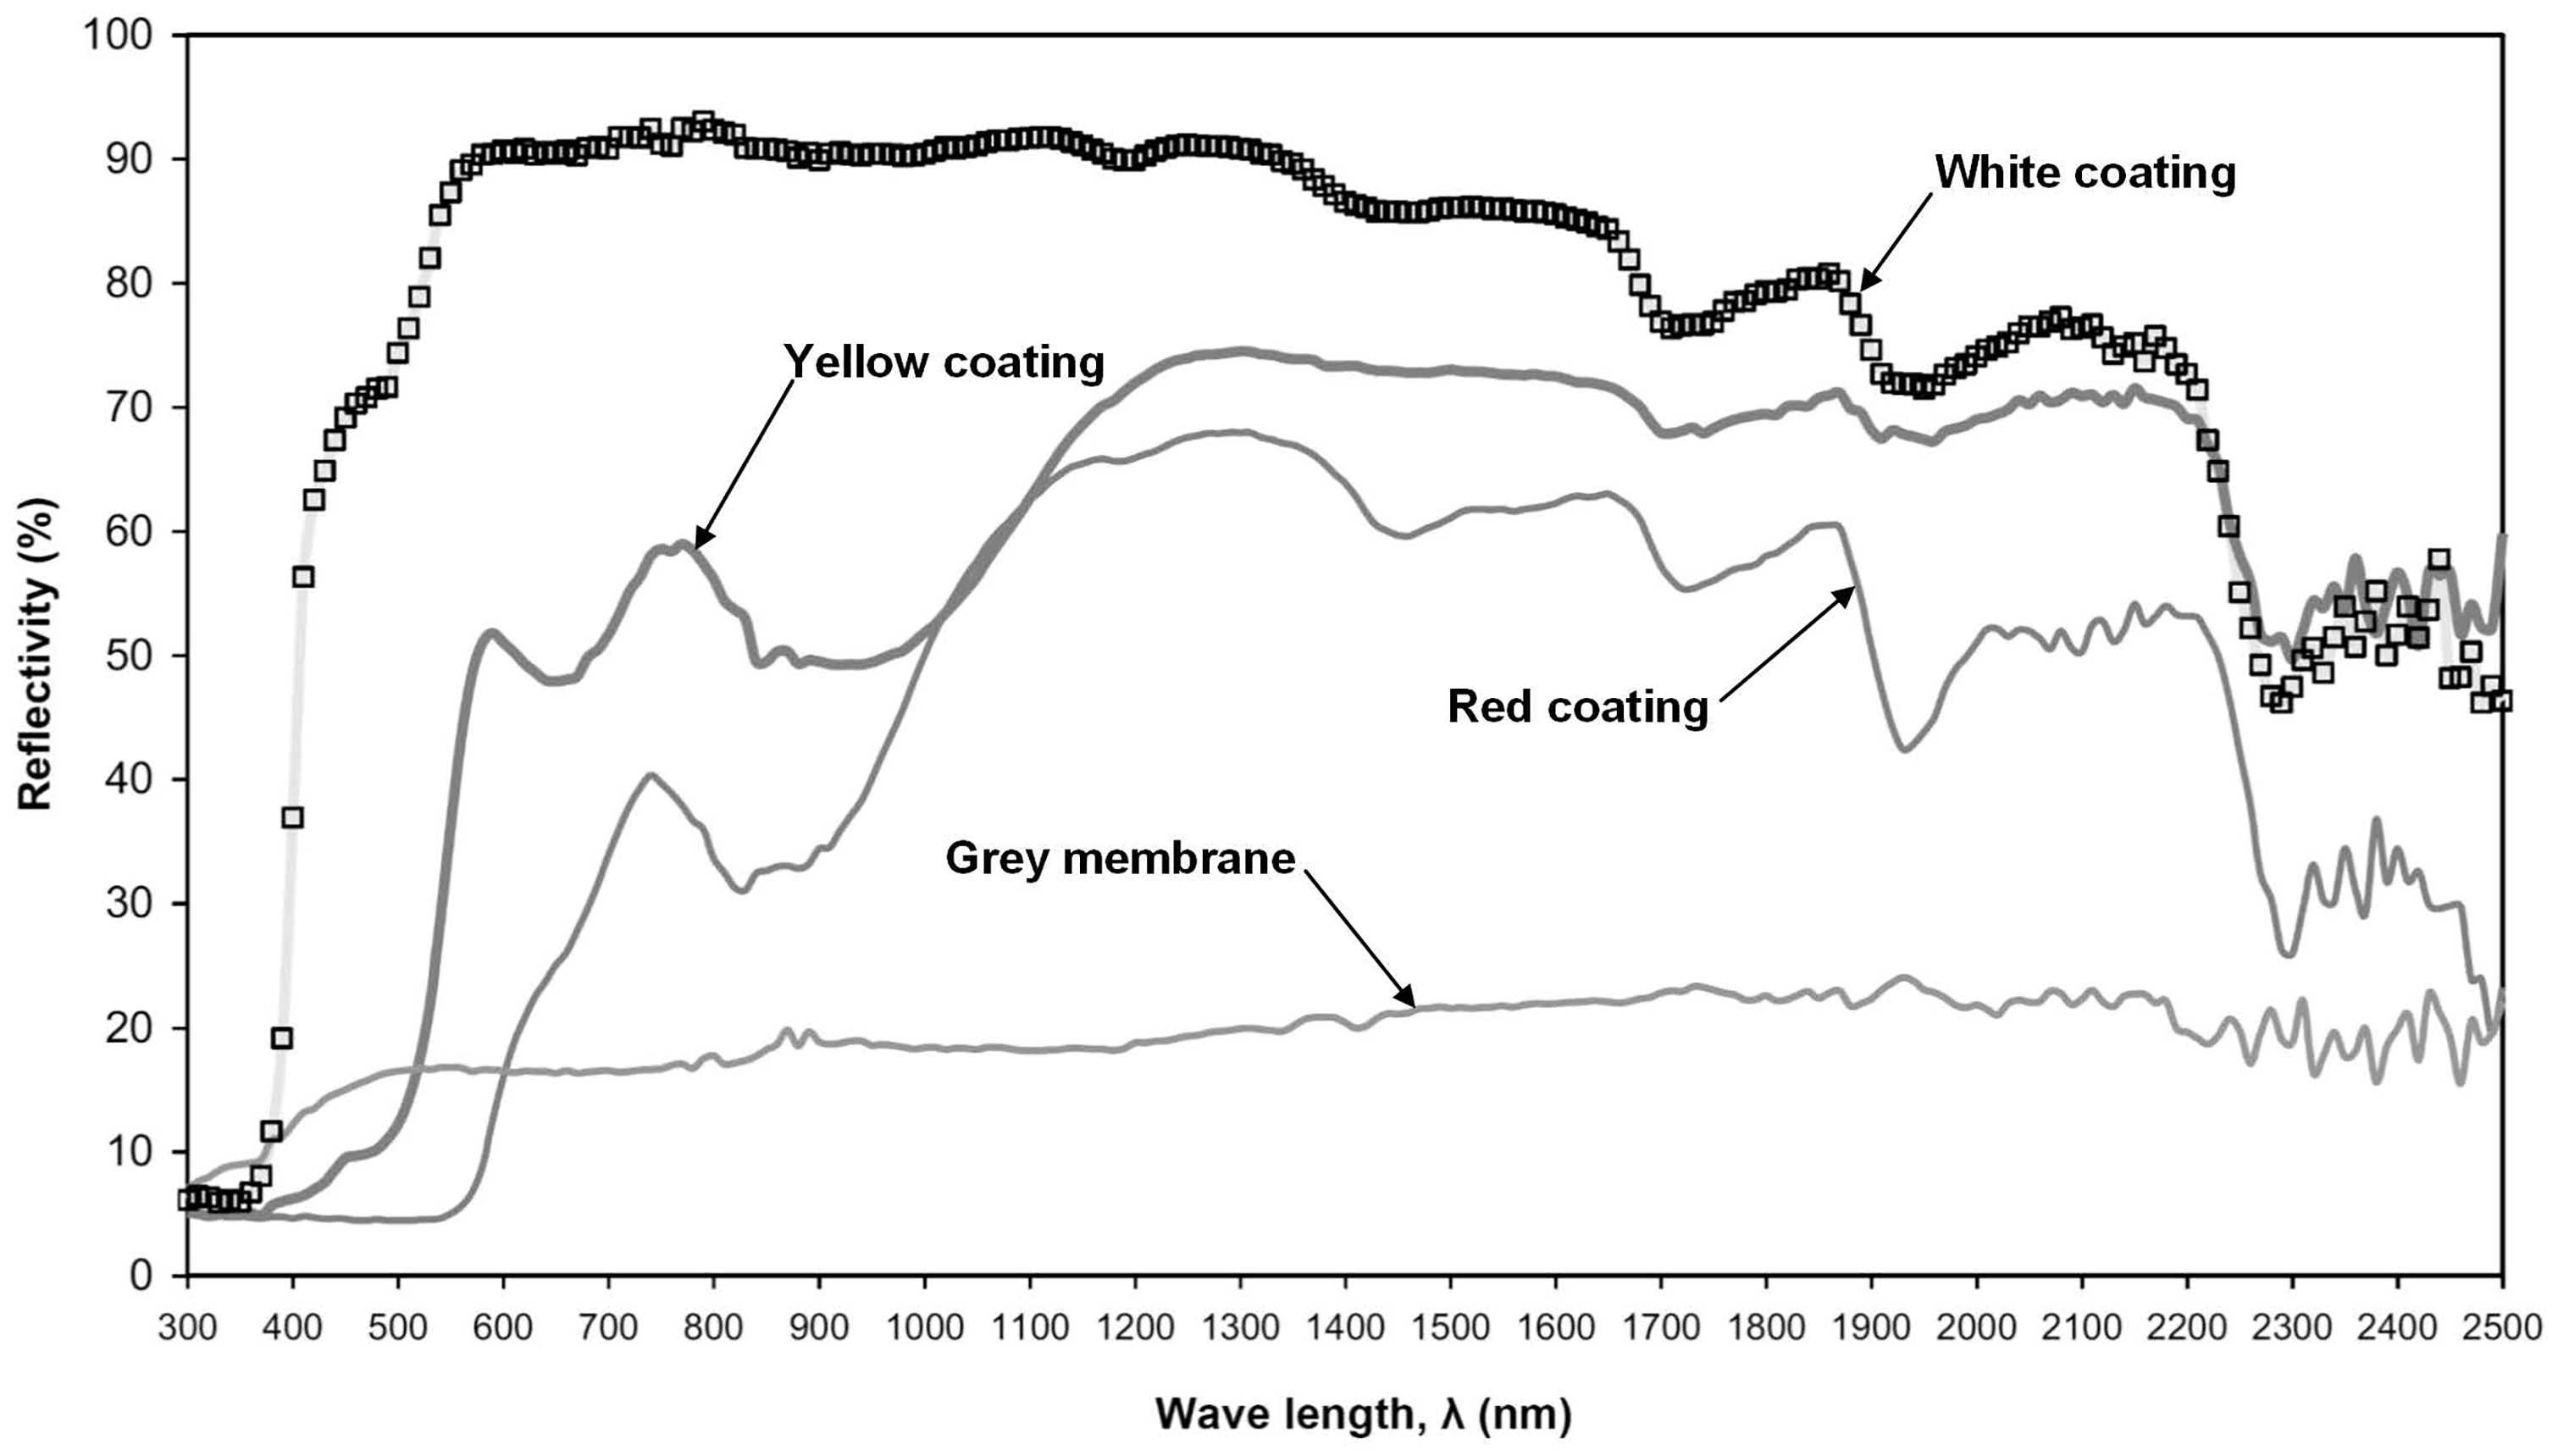
Comparison of reflectivity among different coatings (Stavrakakis et al., 2016).
The effect of the solar reflectance of roof on the heat gain of buildings has been investigated under conditions of hot climate (Stavrakakis et al., 2016). It was disclosed that reflective or light-colored roofs were associated with a considerable attenuation of the downward heat flow compared to those dark ones. The capability of highly reflective roofs in minimizing energy consumption was evaluated in residential buildings in Iraq (Mohamed et al., 2015). The purpose was to reduce the electricity required for cooling. The simulation results manifested that highly reflective roofs could reduce substantially the cost for cooling relative to common roofs. A study was performed on energy saving via mounting photovoltaic (PV) modules on roof (Wang et al., 2017). The decline in the heat gain and cooling load was proved due to the introduction of PV modules.
Thermal analysis for roofs is enabled using numerical simulation (Costanzia et al., 2014). Furthermore, an integral consideration of numerical results and experimental data is badly expected (DeBlois et al., 2013). In this context, computational fluid dynamics (CFD), an important numerical technique, facilitates the treatment of the forced convention heat transfer for buildings (Montazeri and Blocken, 2017). Hitherto, studies considering both flows over the roof and the heat transfer involved have rarely been reported. Meanwhile, most CFD studies on roof coatings focused on flat roofs. These studies took into account high reflectivity of the roof surface instead of the energy-saving mechanism.
Ghana, one of the countries in West Africa, is now facing challenges in power distribution systems due to demand on the high side. Meanwhile, there is abundant sunshine at the tropical regions which can be harnessed to generate power and thereby to reduce the electricity consumption. The objective of the present study is to evaluate the capability of a system involving both roof coating and the PV module in reducing the energy consumption. The study was based on buildings at Takoradi Technical University of Ghana, as shown in Figure 2. CFD was used to describe heat transfer associated with the roofs considered. Both coated roof with solar PV and the uncoated roof were investigated and temperature distributions over the roofs were analyzed. Velocity and pressure distributions were examined as well. A comparison between numerical results and field data was implemented. The energy budget of the building was inspected. It is anticipated to extend the existing knowledge of effective utilization of the solar energy and to provide a reference for the joint application of roof coating and PV modules.
Roof structure
Roofs for the PV system
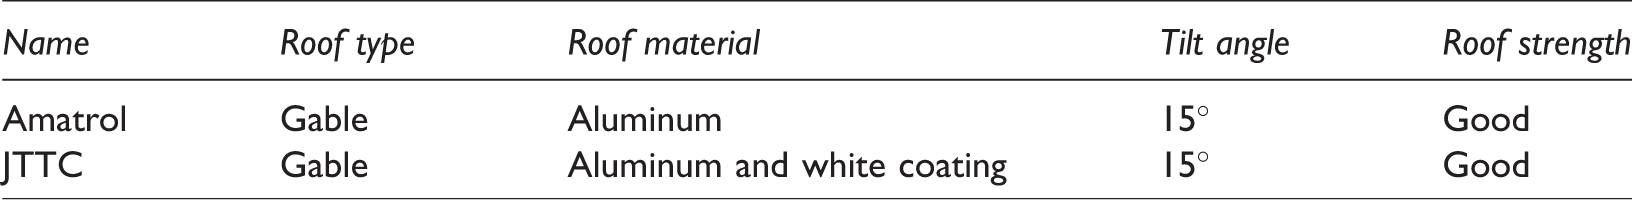
Almost all roofs in service can be used for solar panel installations. The orientation of the PV panel depends on the type of the roof. Actually, proper installation of the solar panel can avoid excessive wear on the roof caused by weather-related factors. Furthermore, for the fixing of solar panels on the roof, the angle of the roof should be considered, and the roof angles close to the latitude of the site are expected. In addition, as the roof faces south to the greatest extent, adequate amount of sunlight will be captured. The dimensions of the roofs of the two building halls considered are shown in Figure 3. Primary roof parameters are listed in Tables 1 and 2.
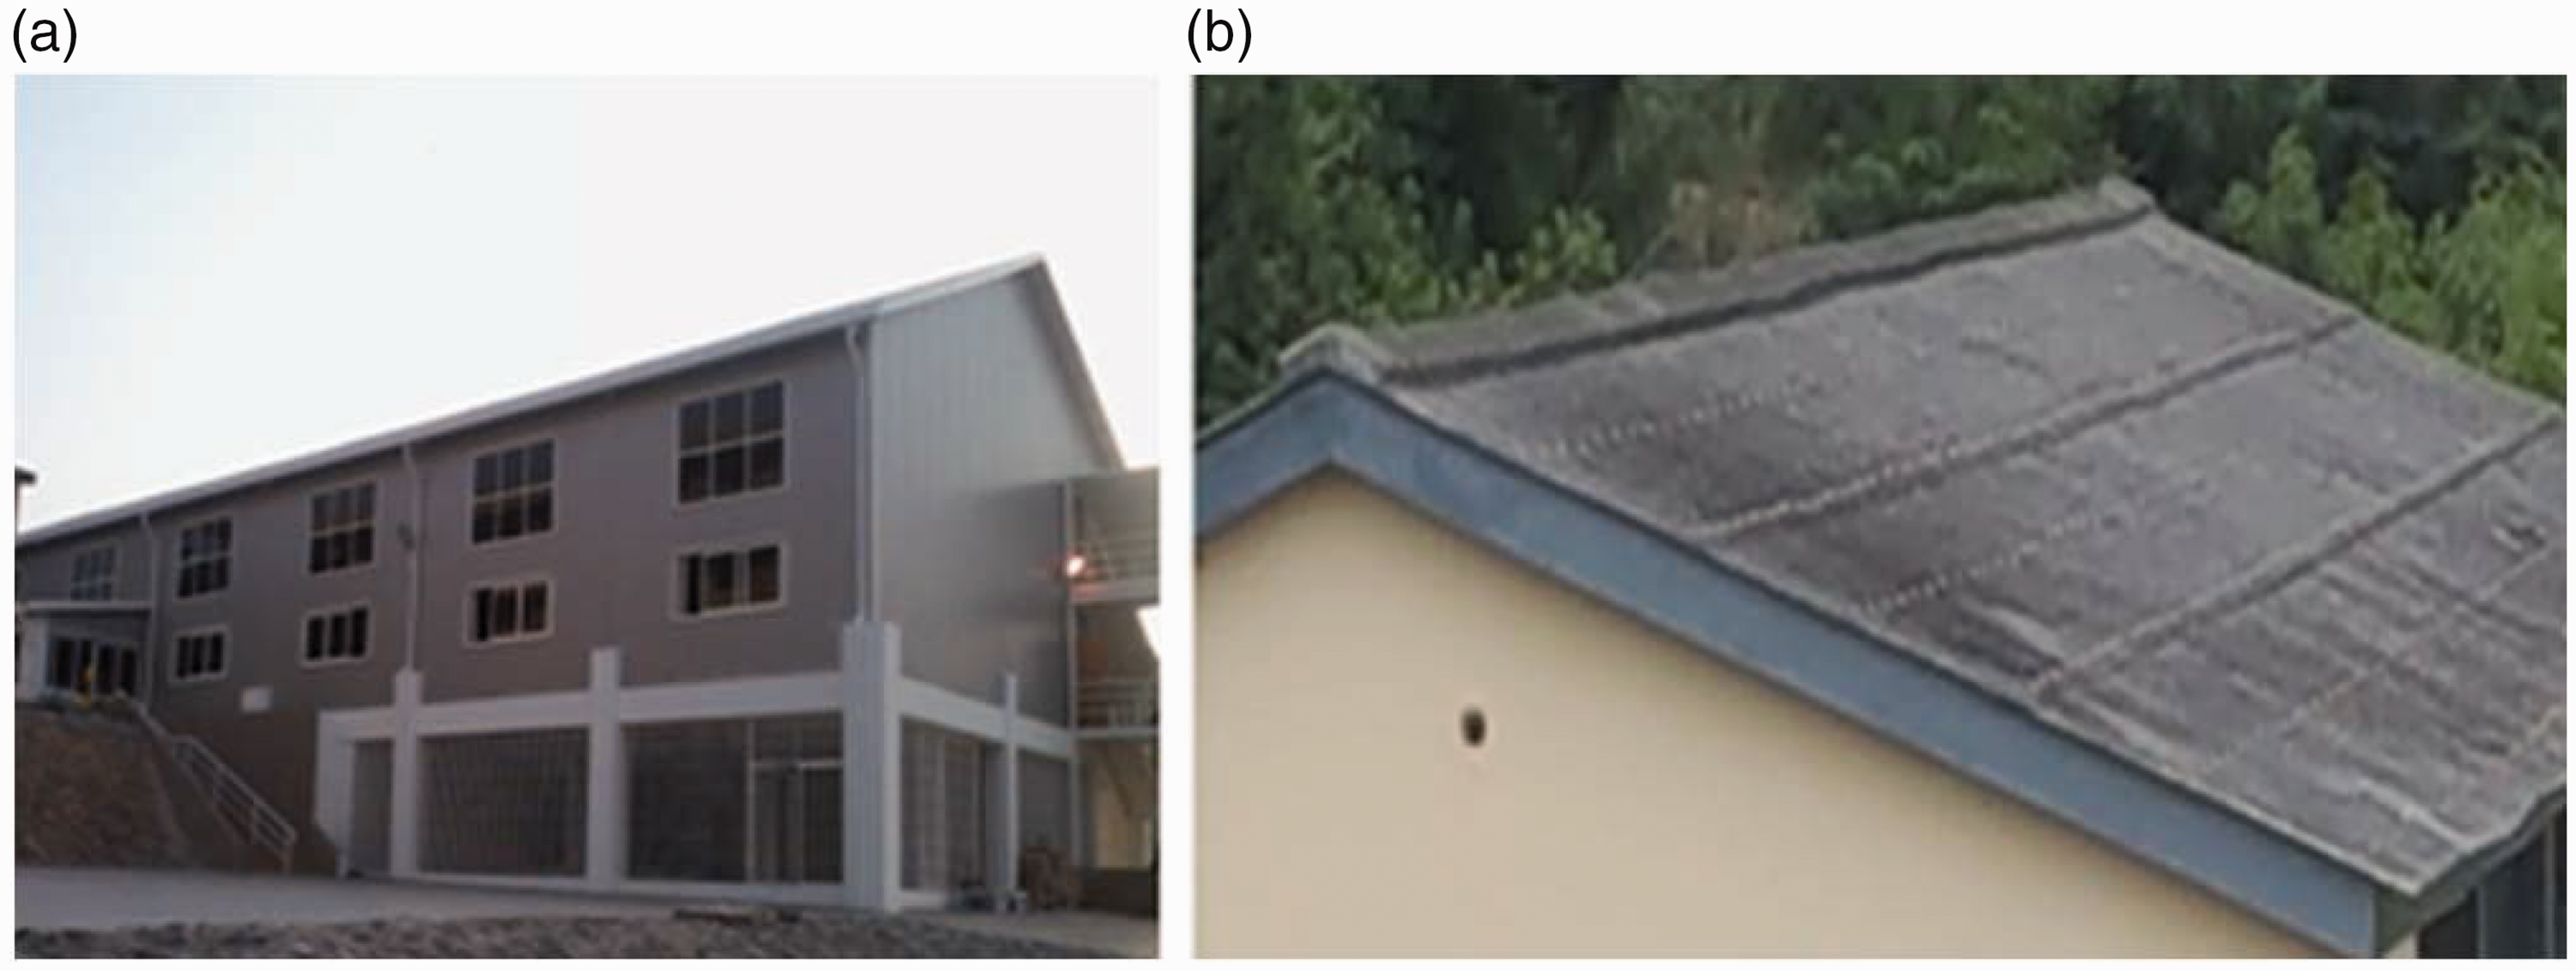
Roof structures of two halls at Takoradi Technical University. (a) JTTC Hall with coated roof and (b) Amatrol Hall with uncoated roof.
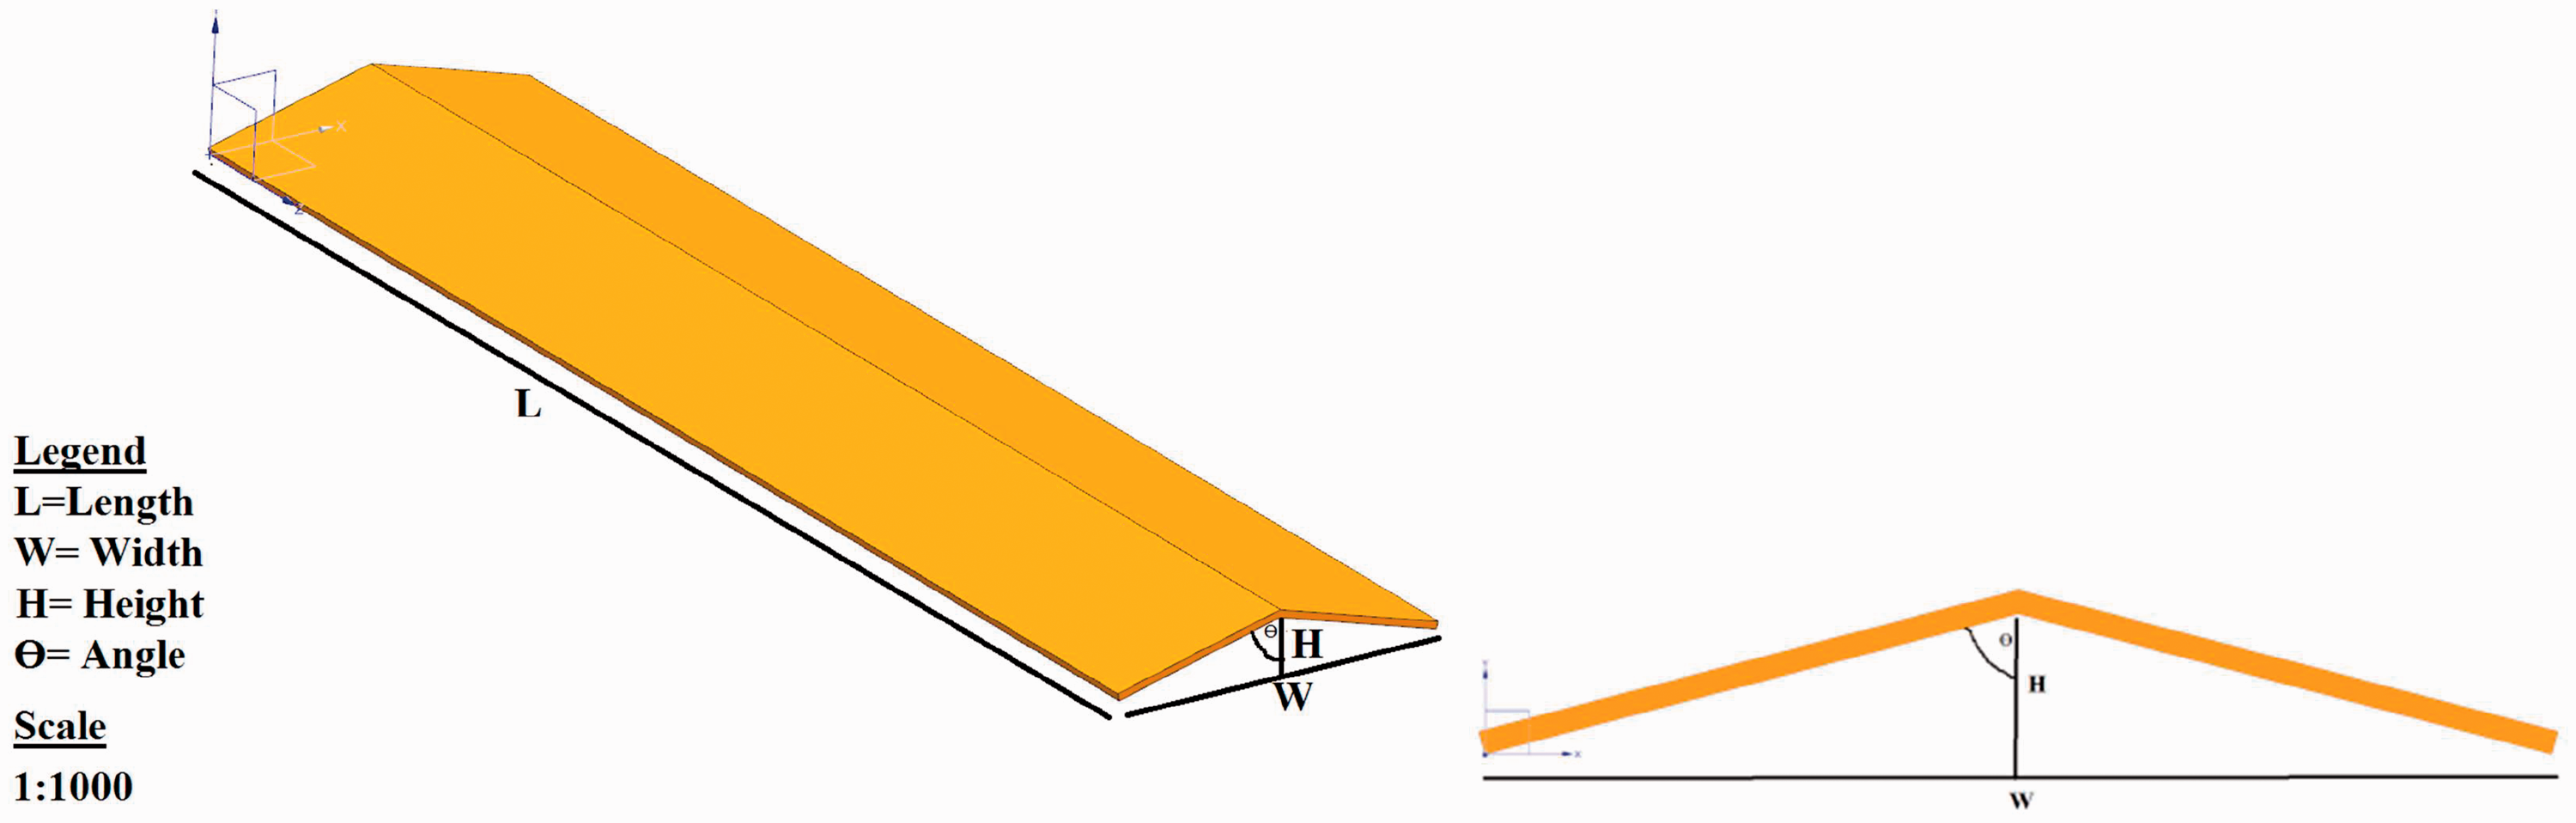
Schematic view of the roof structure.
Roof dimensions.
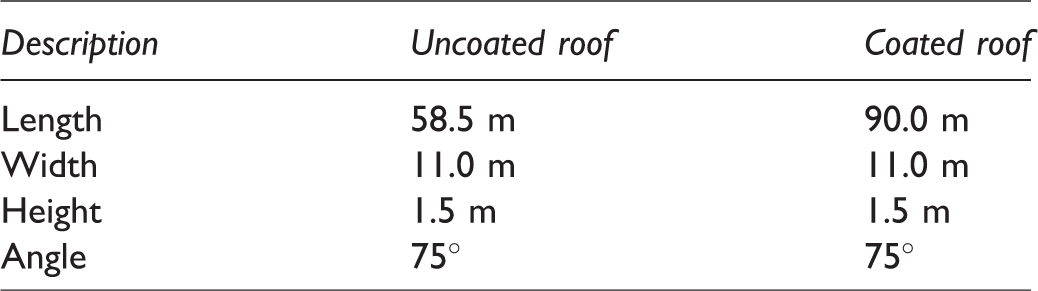
Characteristics of two halls.
Common roofs are schematically shown in Figure 4. All of these roofs have moderate pitches and are perfect for solar panel installations, provided that they have adequately large south-facing surfaces. Moreover, these roofs are adjustable to installations where photovoltaic shingles are preferred relative to separated panels. Most commercial buildings are of flat roofs. On a flat roof, the solar panels are normally mounted on the free-standing structure that can amplify array routine in as much as providing the model tilt and directional orientation. The truth is seen in mansard roofs that include relatively large flat spaces. The quantity of shading from nearby trees or structures constitutes the major threat. The complexity of fixing the panel and the cost comes with the design and the composition of the roof.
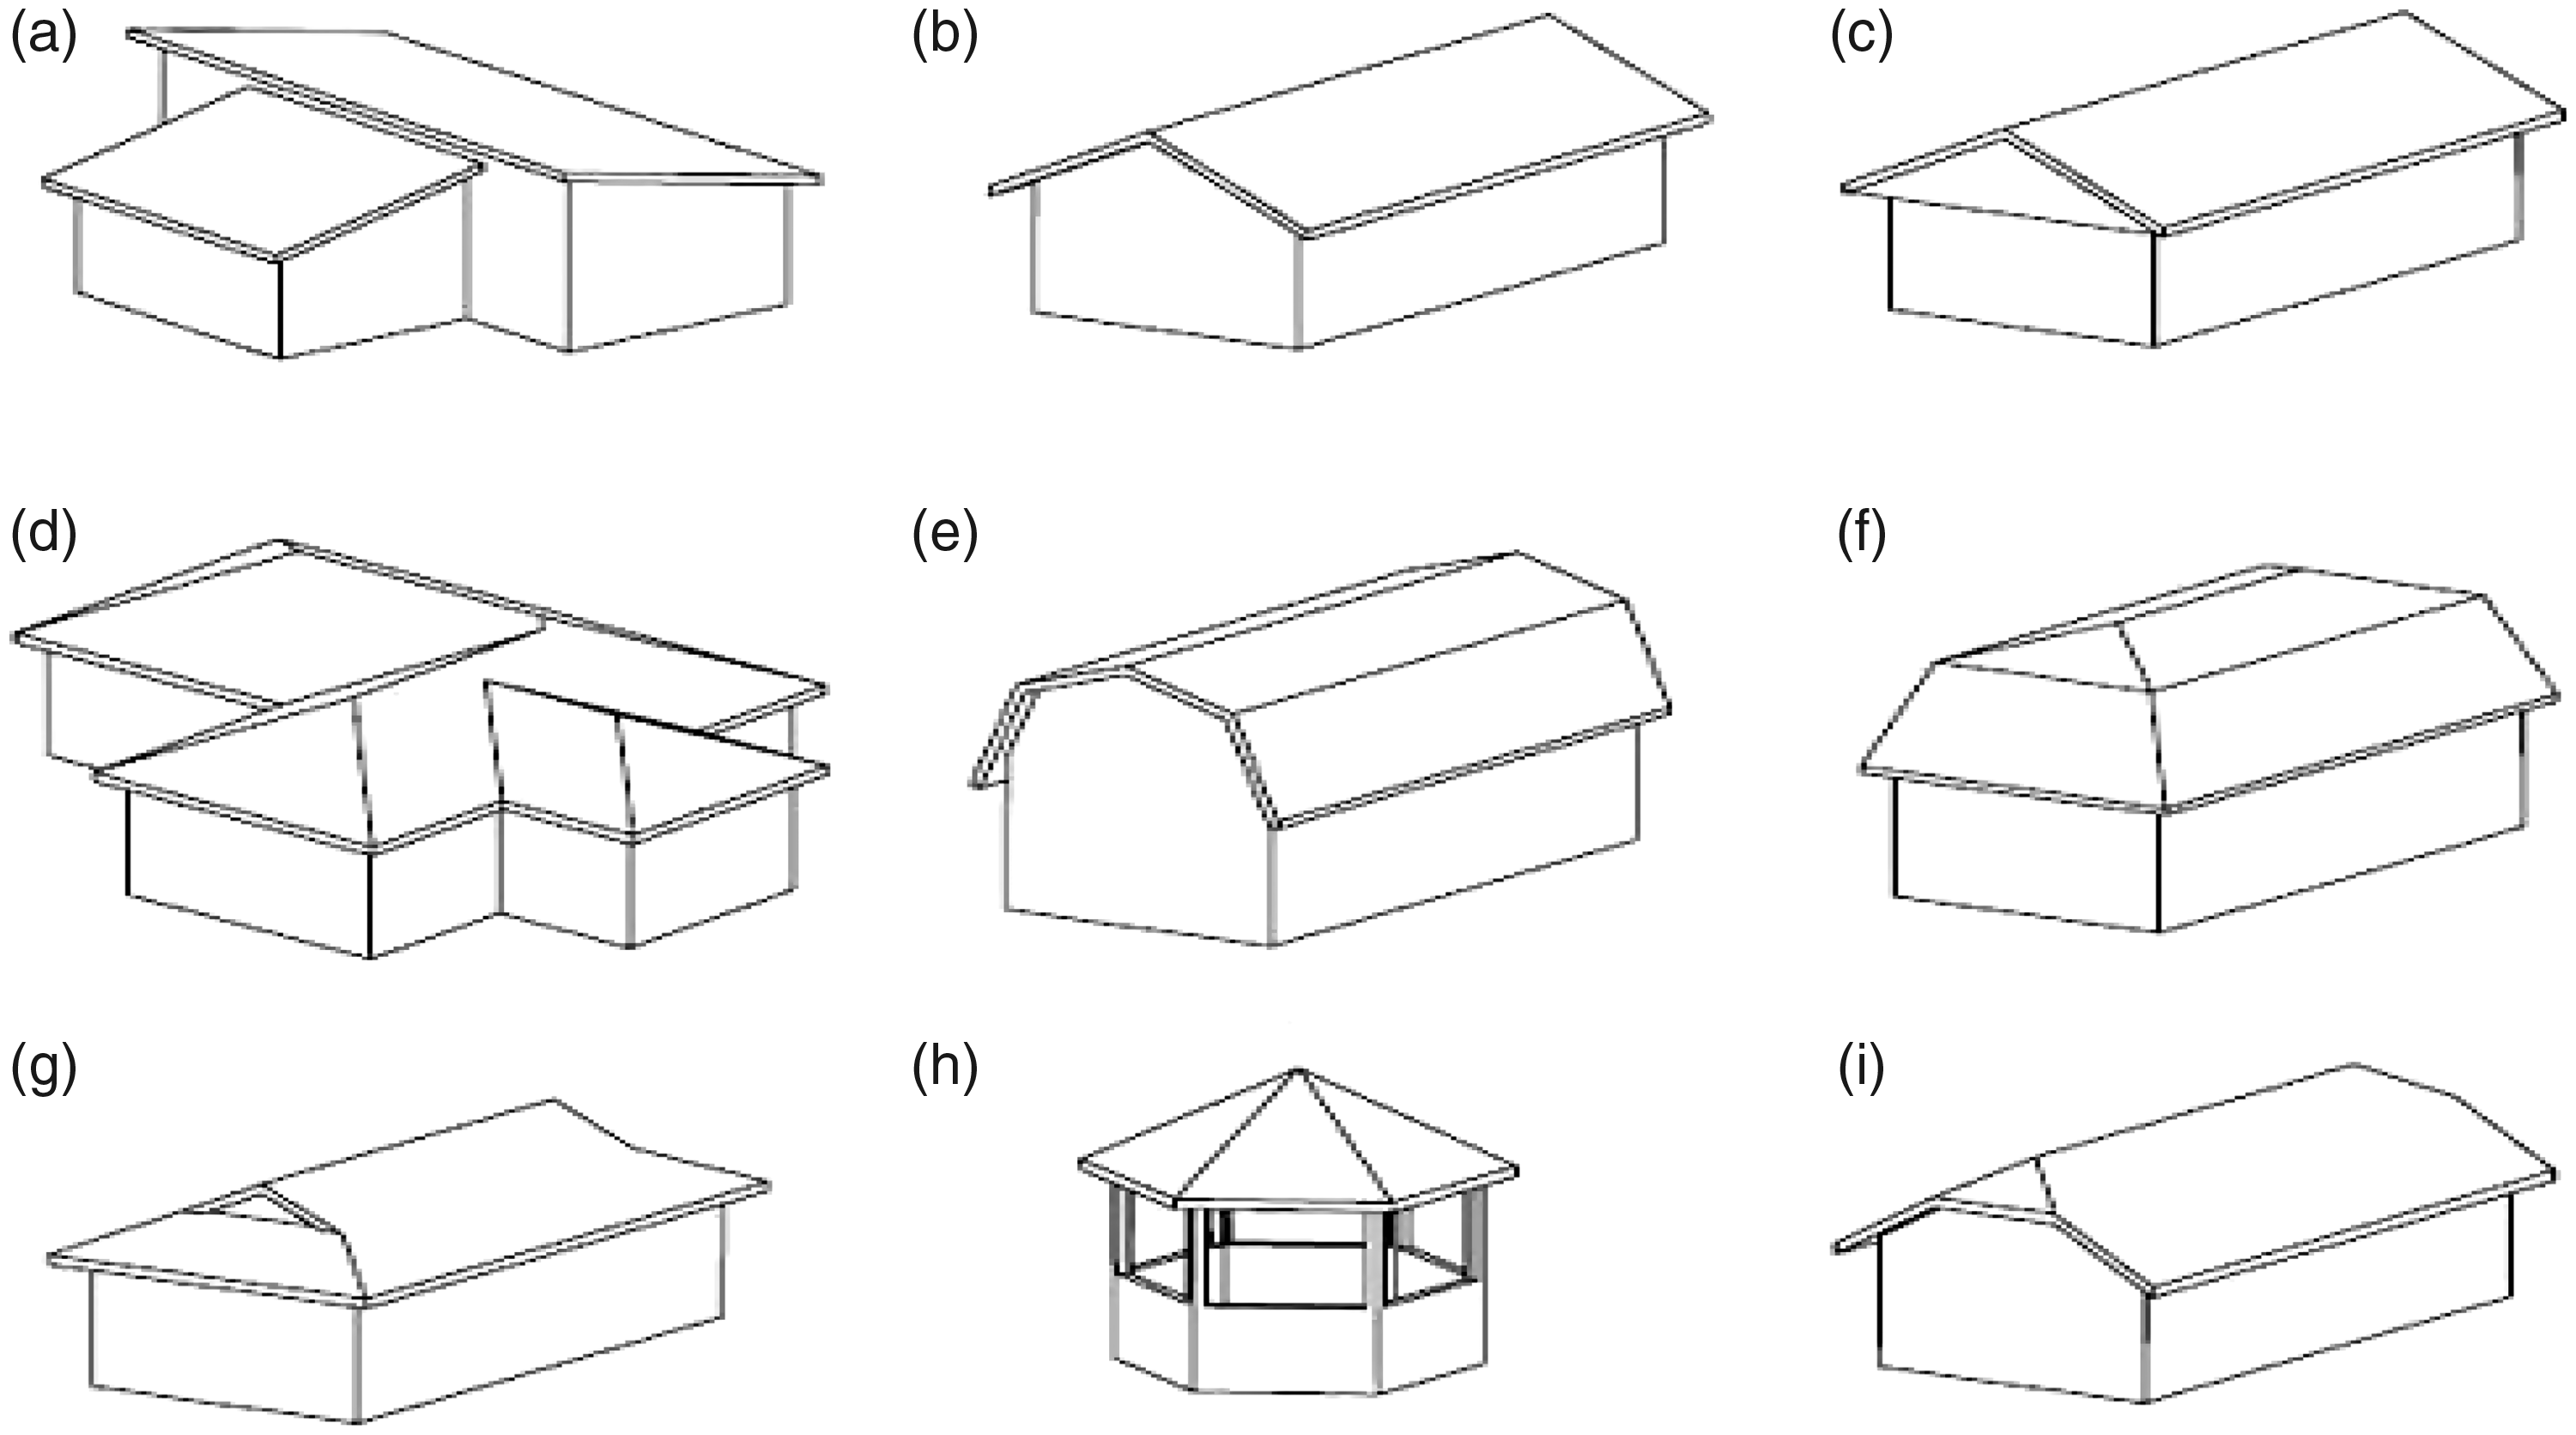
Typical roofs. (a) Skillion and lean-to roof, (b) open gable roof, (c) box gable roof, (d) hip and valley roof, (e) gambrel roof, (f) mansard roof, (g) Dutch gable roof, (h) hexagonal gazebo roof, and (i) Jerkinhead roof.
The function of the cool roof is to sustain a lower temperature in the roofing system than that of conventional roofs. The cool roof emits heat and reflects sunlight better than that of the dark roof due to its high surface reflectance.
In Figure 5, the heat transfer associated with a roof is illustrated. The heat absorption and reflection are encountered as the solar radiation reaches the surface of the roof. However, some parts of the heat are reflected while others are absorbed by the building. The cool roof, roof insulation, and the radiation barrier are basic strategies in curbing heat transfer in the building industry (Santamouris, 2014).
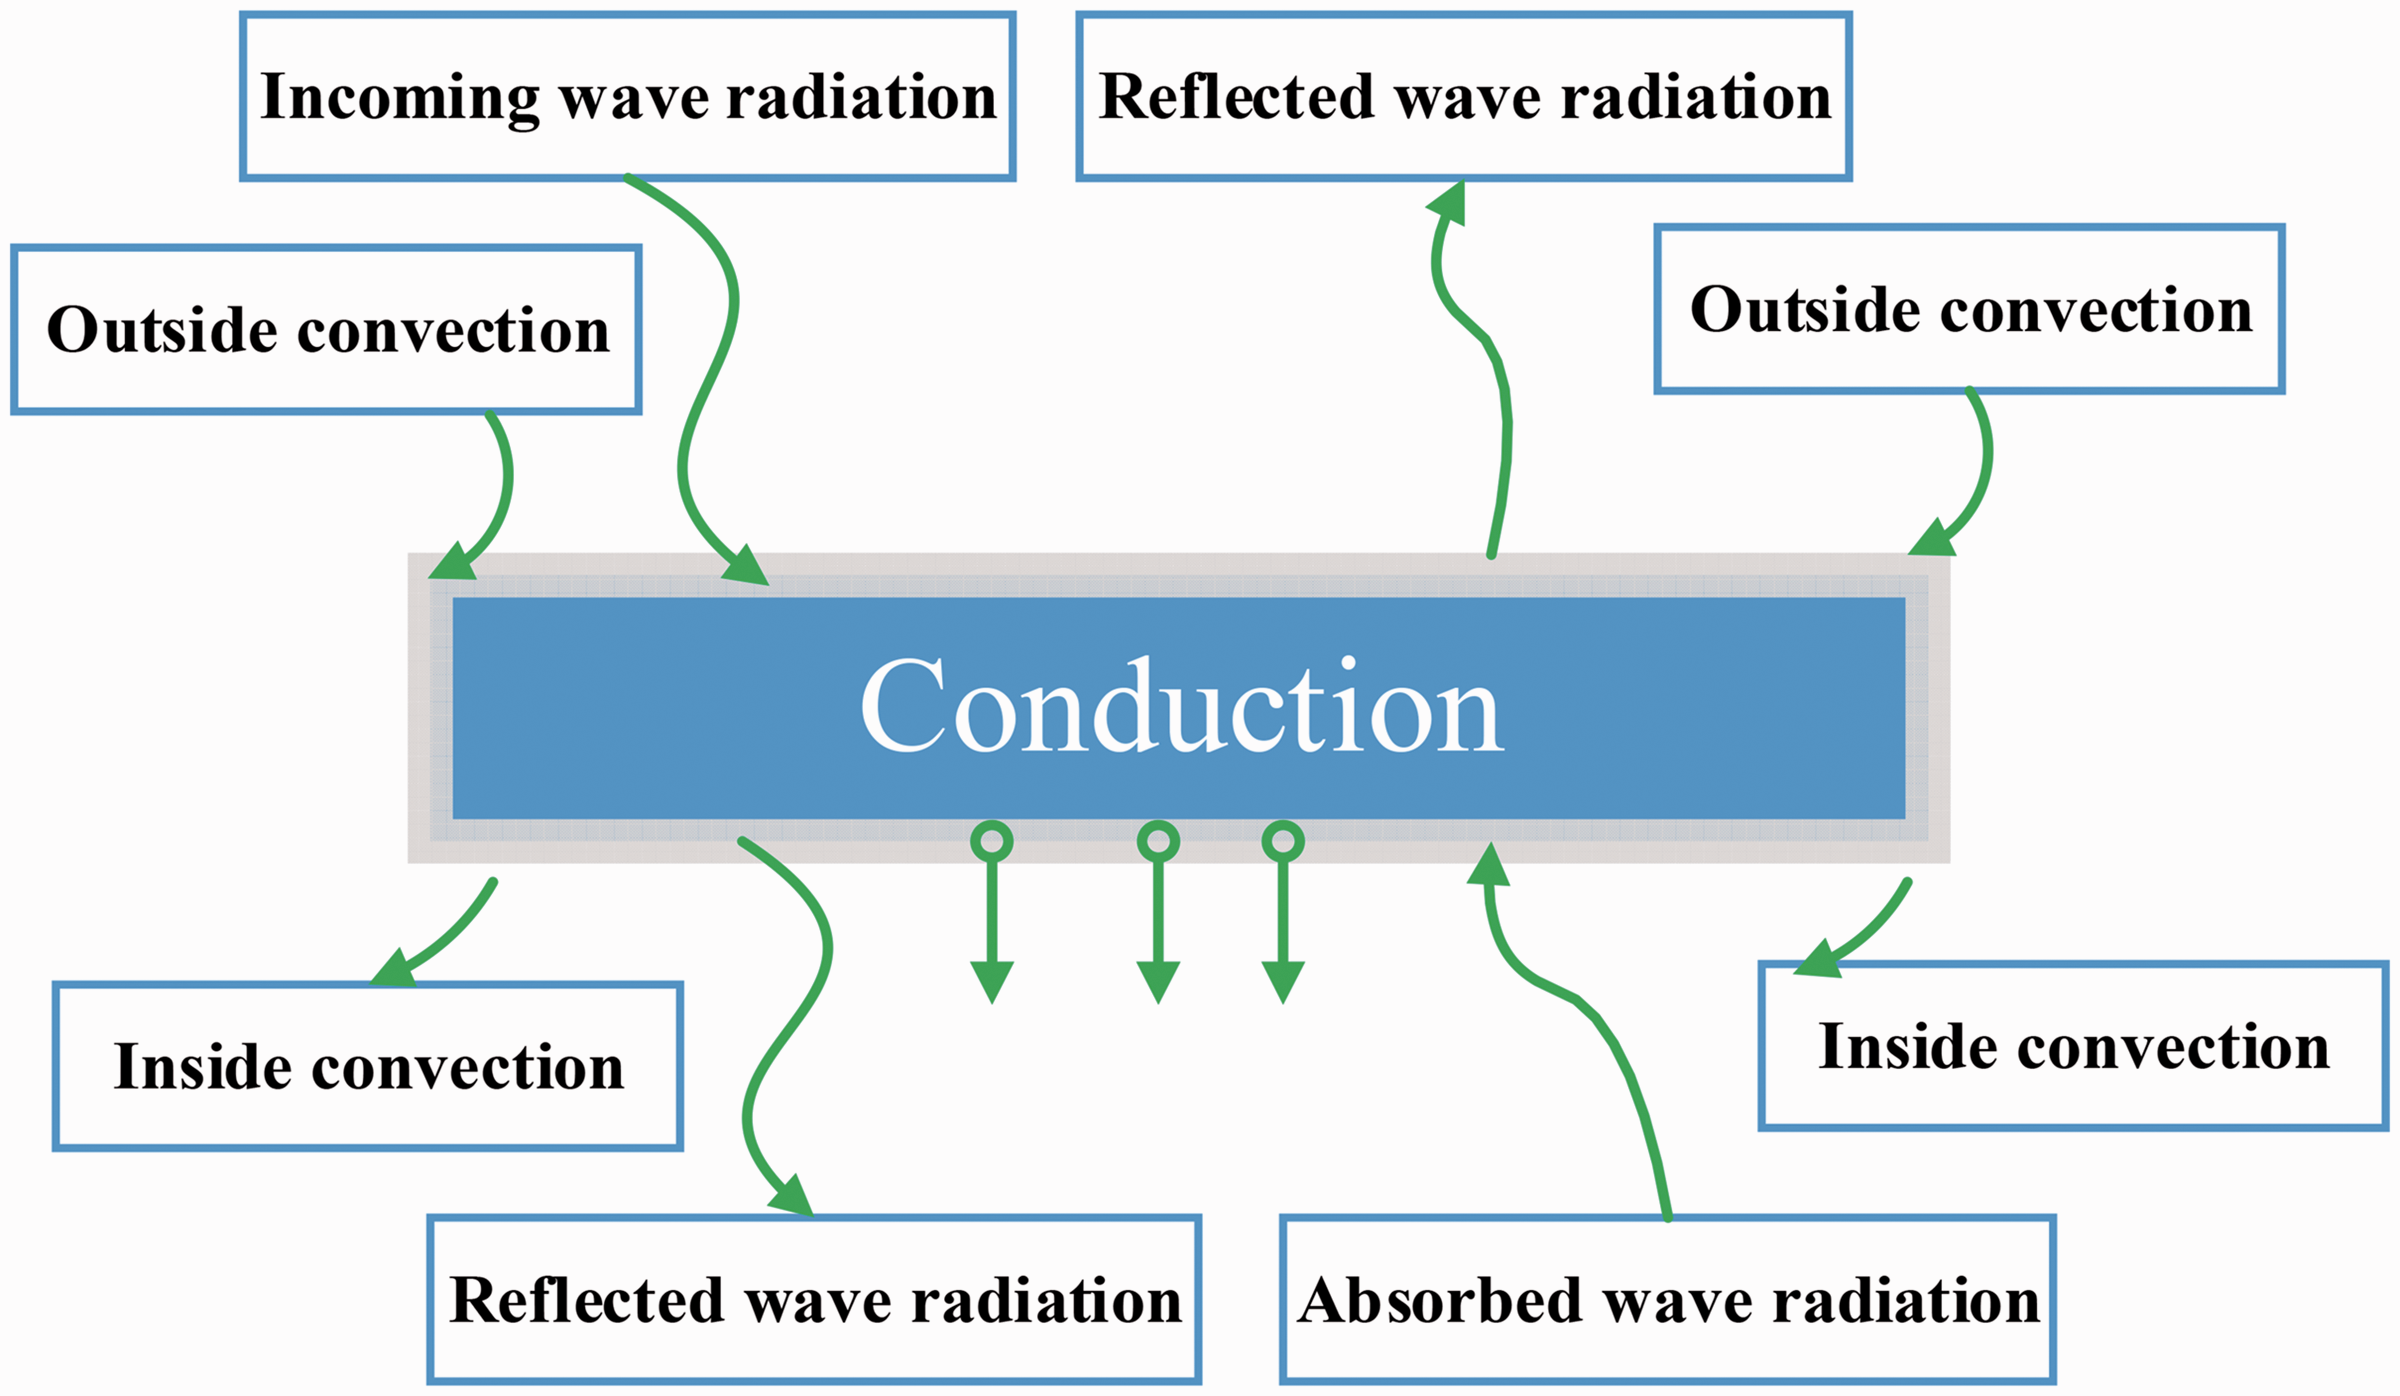
Heat transfer associated with the roof.
The solar radiation intensity coupled with the ambient temperature varies frequently. Furthermore, for the hall, the internal air temperature varies with climate and the roof material. These issues can be addressed using CFD technique. The solar irradiation of a particular place can be obtained from the Meteorological Department of Ghana. Solar resource data can be acquired using software such as NREL dynamic GIS data and RETScreen, which contain data from NASA. Here, RETScreen was chosen. The solar data given in kW h/m2/day for Takoradi are given in Figure 6.
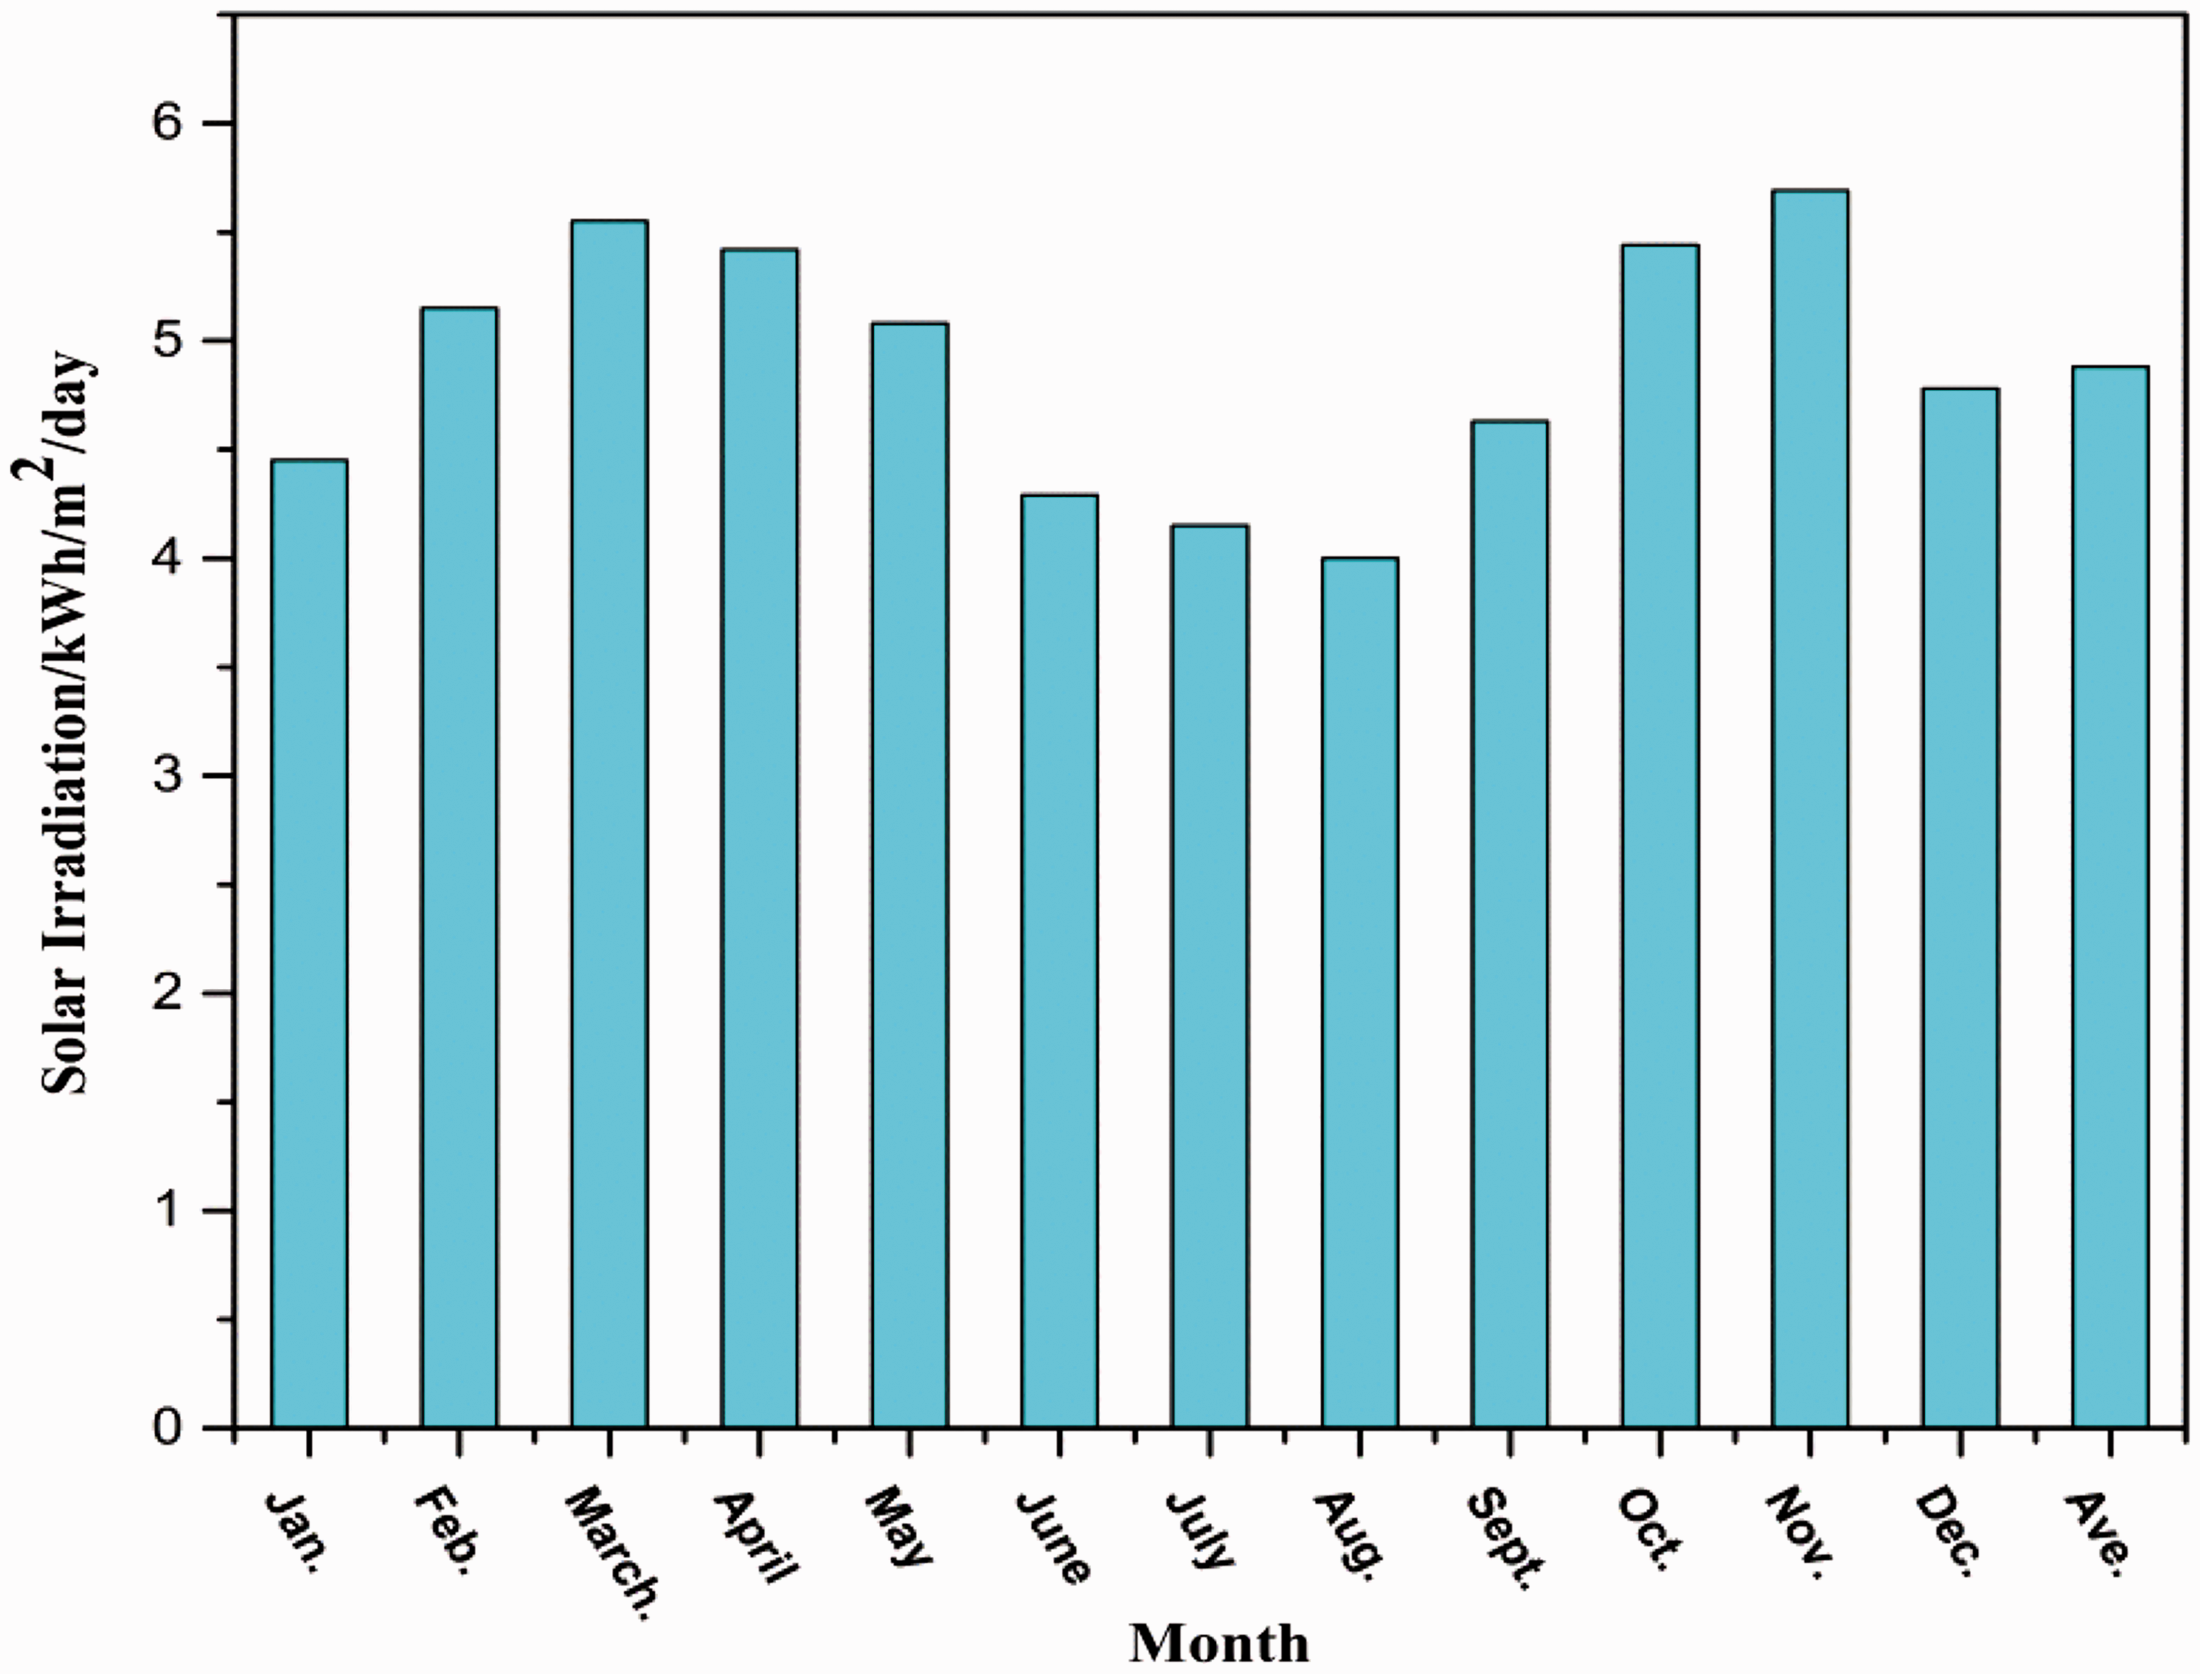
Solar irradiation data for Takoradi.
Takoradi located on longitude 4.90°N and Latitude 1.78°W receives an average solar irradiation of 4.88 kW h/m2/day annually. August receives the least solar irradiation of 4.00 kW h/m2/day while November records the highest solar irradiation of 5.69 kW h/m2/day. It is therefore evidenced that August produces the least energy and November yields the highest energy output.
Numerical setup
The numerical study was carried out using the commercial code ANSYS. The CFD module embedded in ANSYS was used to solve flow-governing equations. The governing equations are composed of continuity, momentum, and energy equations, which are related to heat transfer on the roof. With the governing equations, flow quantities of temperature, velocity, and pressure were expected to be calculated. The realizable k–ε turbulence model was used to arrive at the closure of the governing equations. Rosseland radiation model was used to describe the heat transfer associated with the solar radiation.
The solar PV modules commonly used for solar energy production are polycrystalline, monocrystalline, copper indium disulfide thin film, amorphous silicon, and heterojunction incorporating thin film. Each of these modules has some advantages over the others (Quansah et al., 2017). Here, the polycrystalline PV module was chosen. Such a PV module has high efficiency and longer life (20–25 years). It also has low initial cost than monocrystalline and a good payback time. Polycrystalline proved to be feasible for generators of any size (Chong et al., 2016). Schott solar PV module was used for the design. The power rating of the module is 250 W and the module dimensions are 1640 mm × 990 mm ×45 mm.
The number of Schott modules of 250 W and the total expected peak power can be obtained as follows

Therefore


Therefore

Numerical models
The energy balance of a roofing system exposed to solar rays is illustrated in Figure 7. It is worthwhile to briefly describe how solar radiation and reflection affect the roof of a building. Sun radiation is partially reflected back to the atmosphere while the rest is absorbed by the roof and other parts of the building. Roof material and coating determine to a large extent the absorption rate of the roof. Here, both the coated and uncoated roofs were made of aluminum.
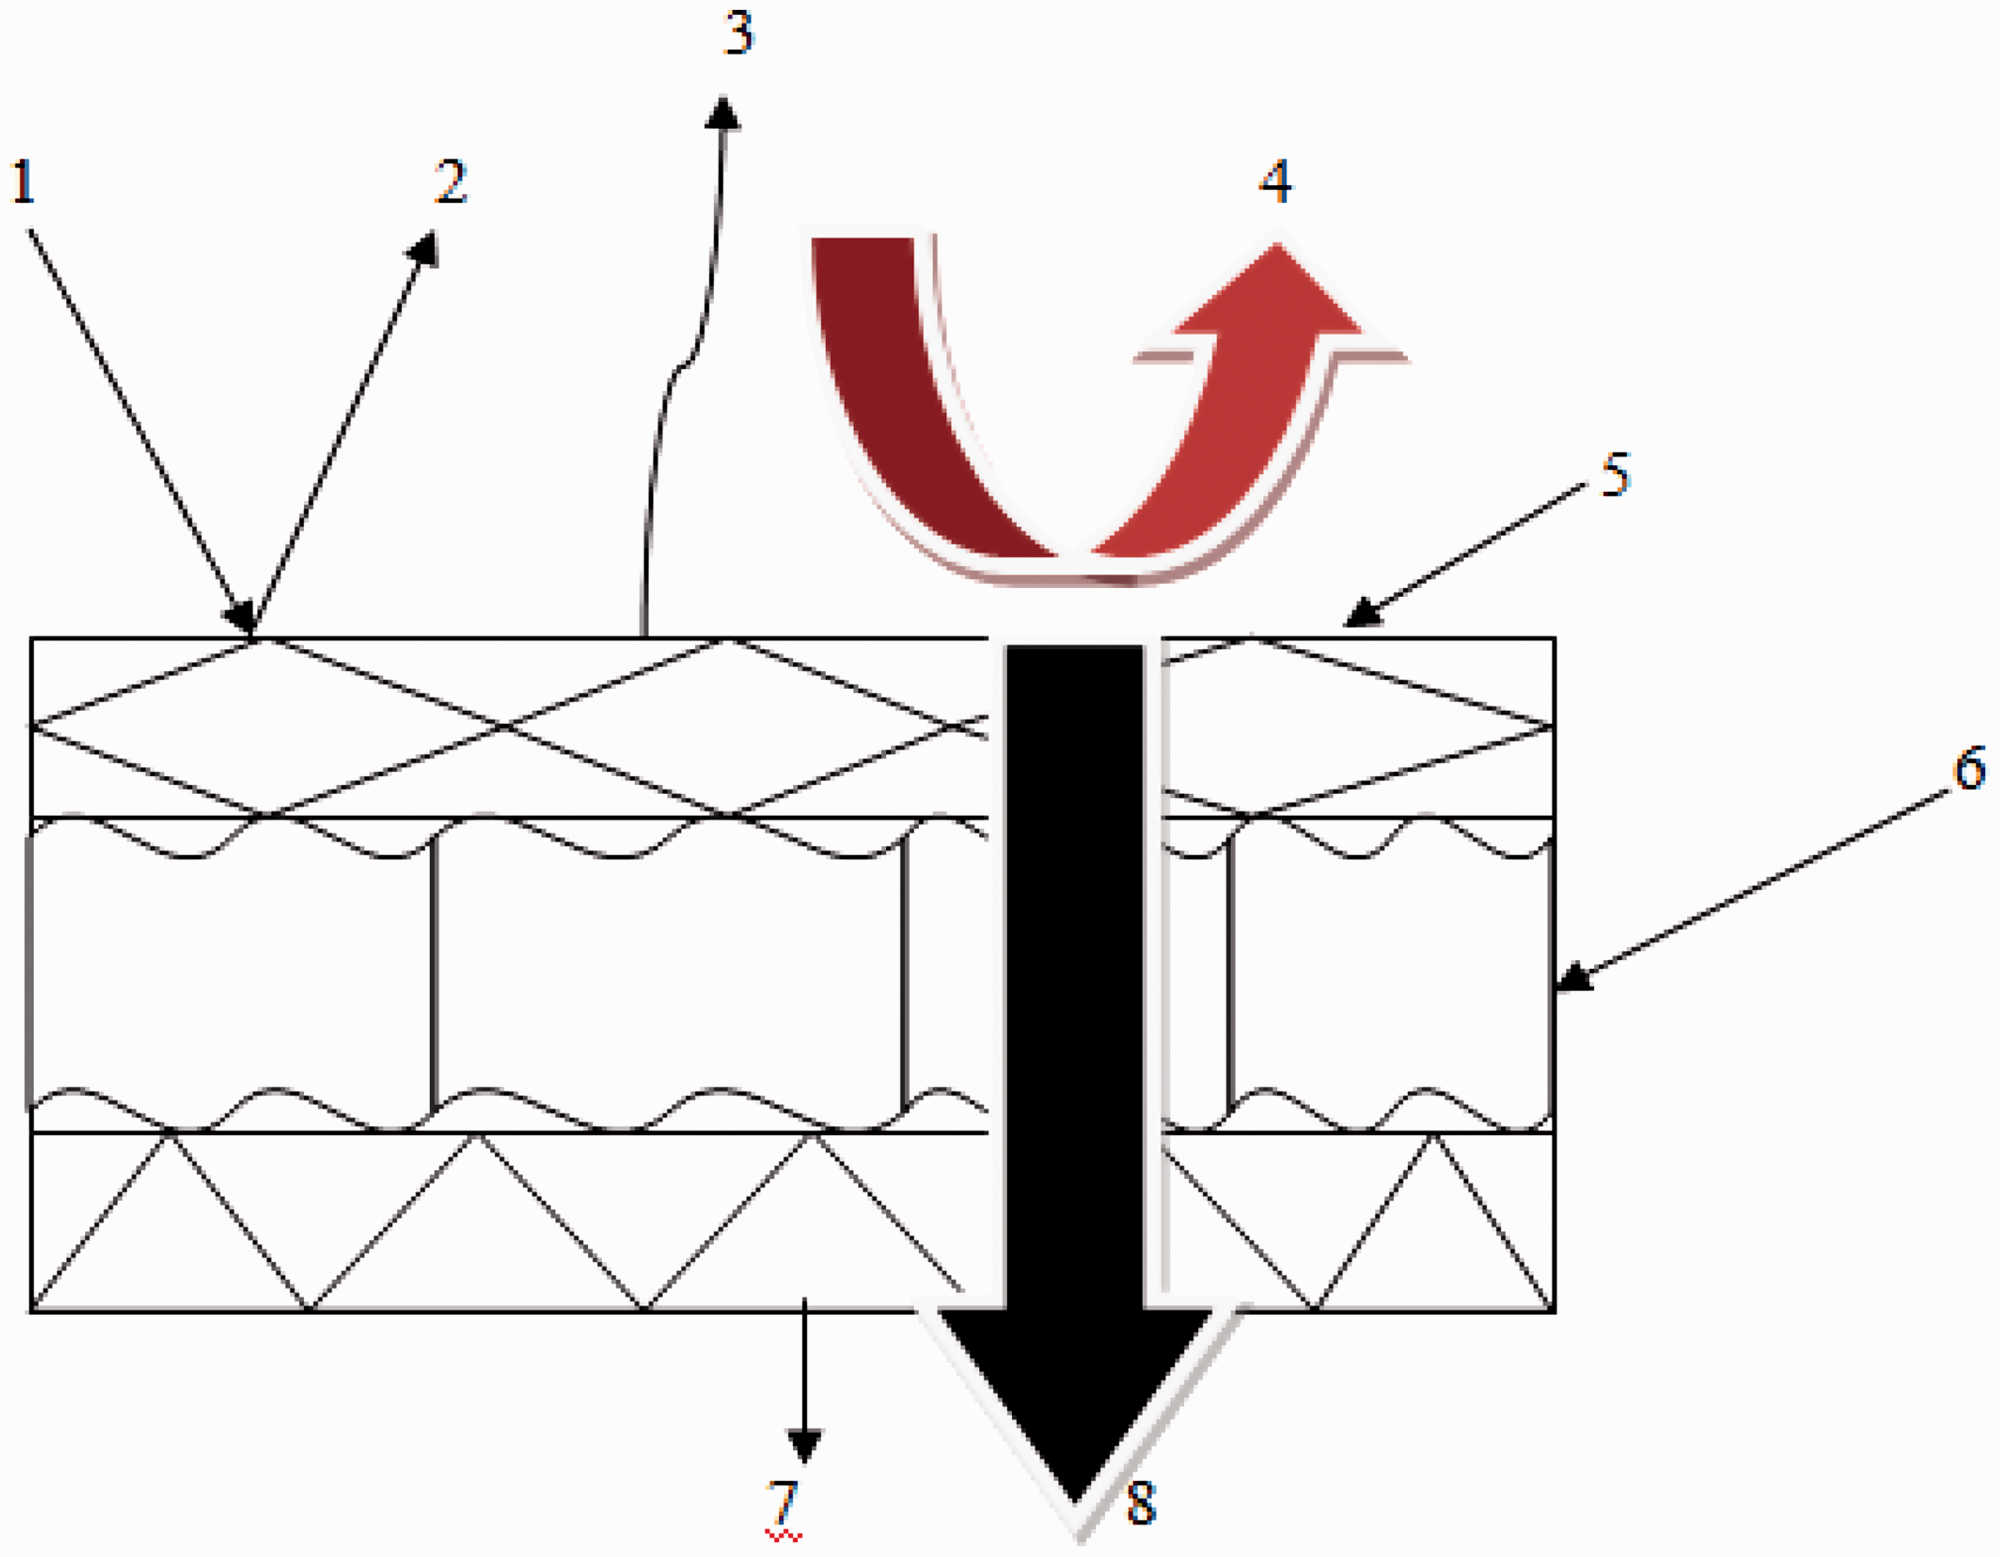
Energy balance of a roof system. 1—solar radiation; 2—reflected solar radiation; 3—sky radiative cooling; 4—convective cooling; 5—surface temperature; 6—insulating material; 7—conductive temperature; 8—conductive heat transfer.
The energy balance for a roof is given by

Convection and radiation are combined and denoted by the coefficient of 
With the introduction of the sol–air temperature, TSAT, the heat transferred into the roof is given by

TSAT is calculated by

As the roof receives the heat emitted by the sun, some heat is absorbed into the walls while the other is absorbed by the internal surface of the roof. The inner heat is assumed to be

It is seen that equation (9) remains the same for roofs with different colors.
Numerical simulation was performed for both uncoated roof and coated roof. The roof was fixed into the rectangular computational domain with dimensions of 58.5 m × 5.7 m, as shown in Figure 8.
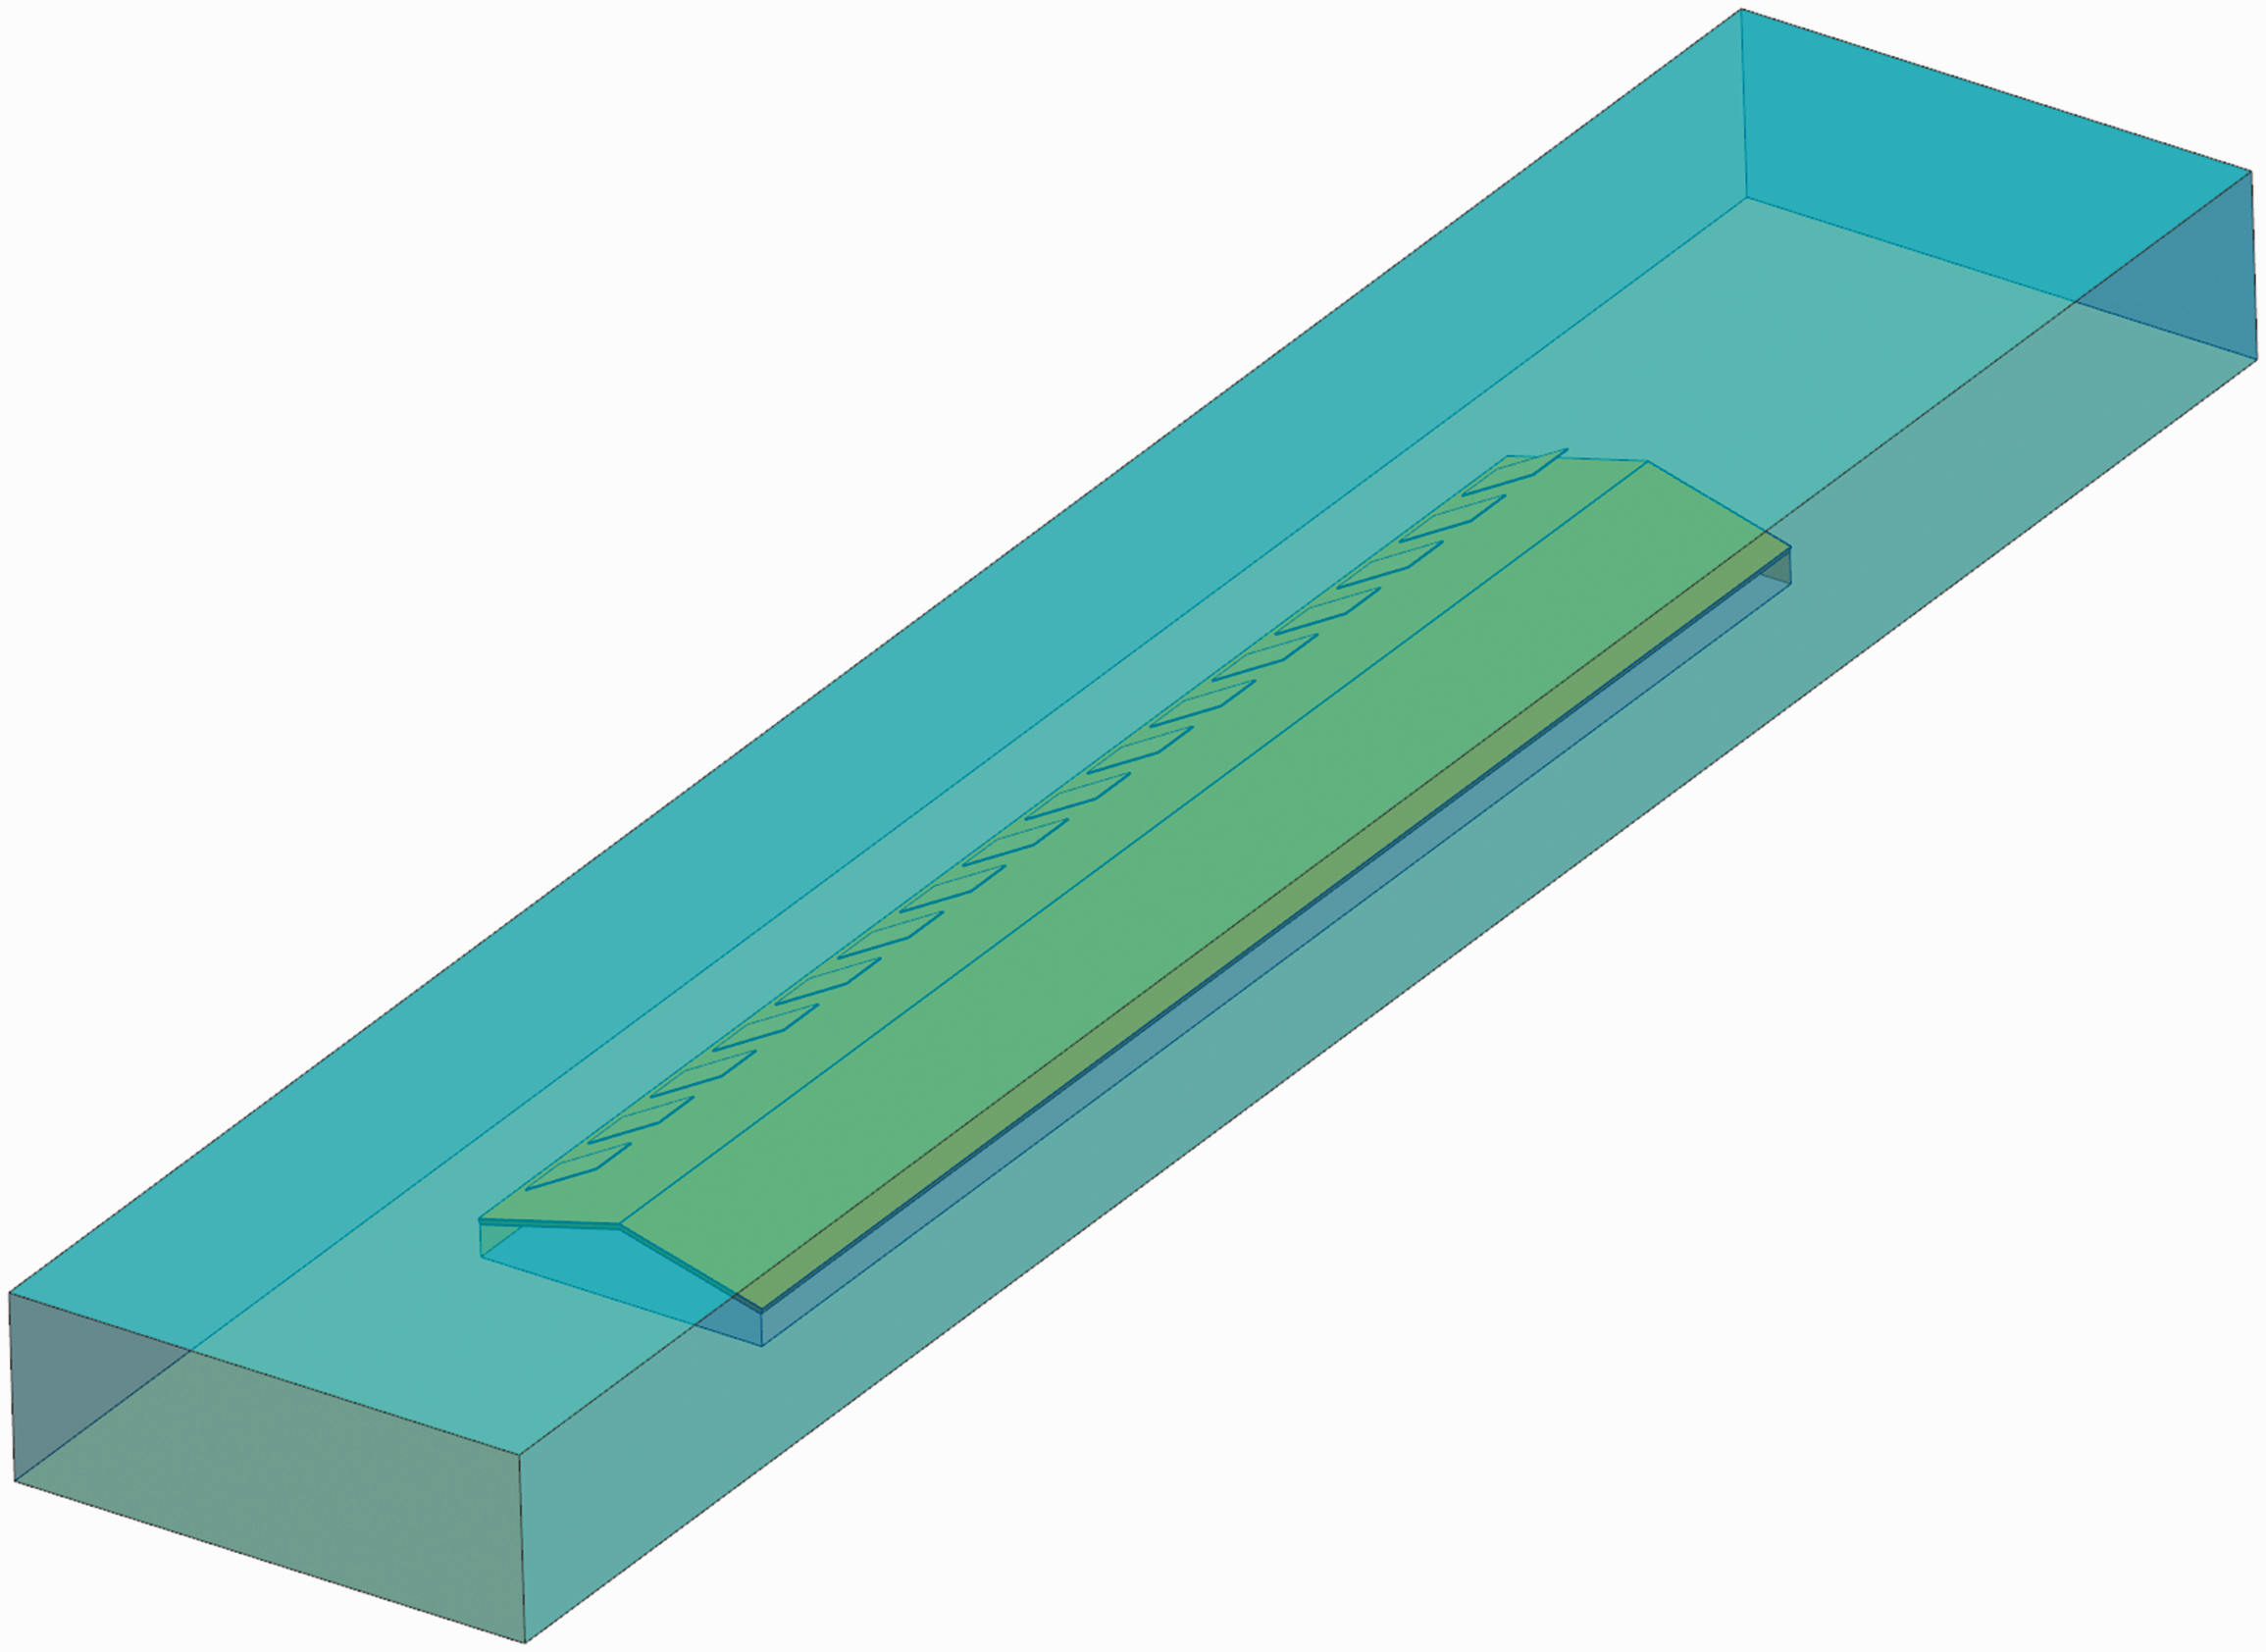
Computational domain containing the roof model.
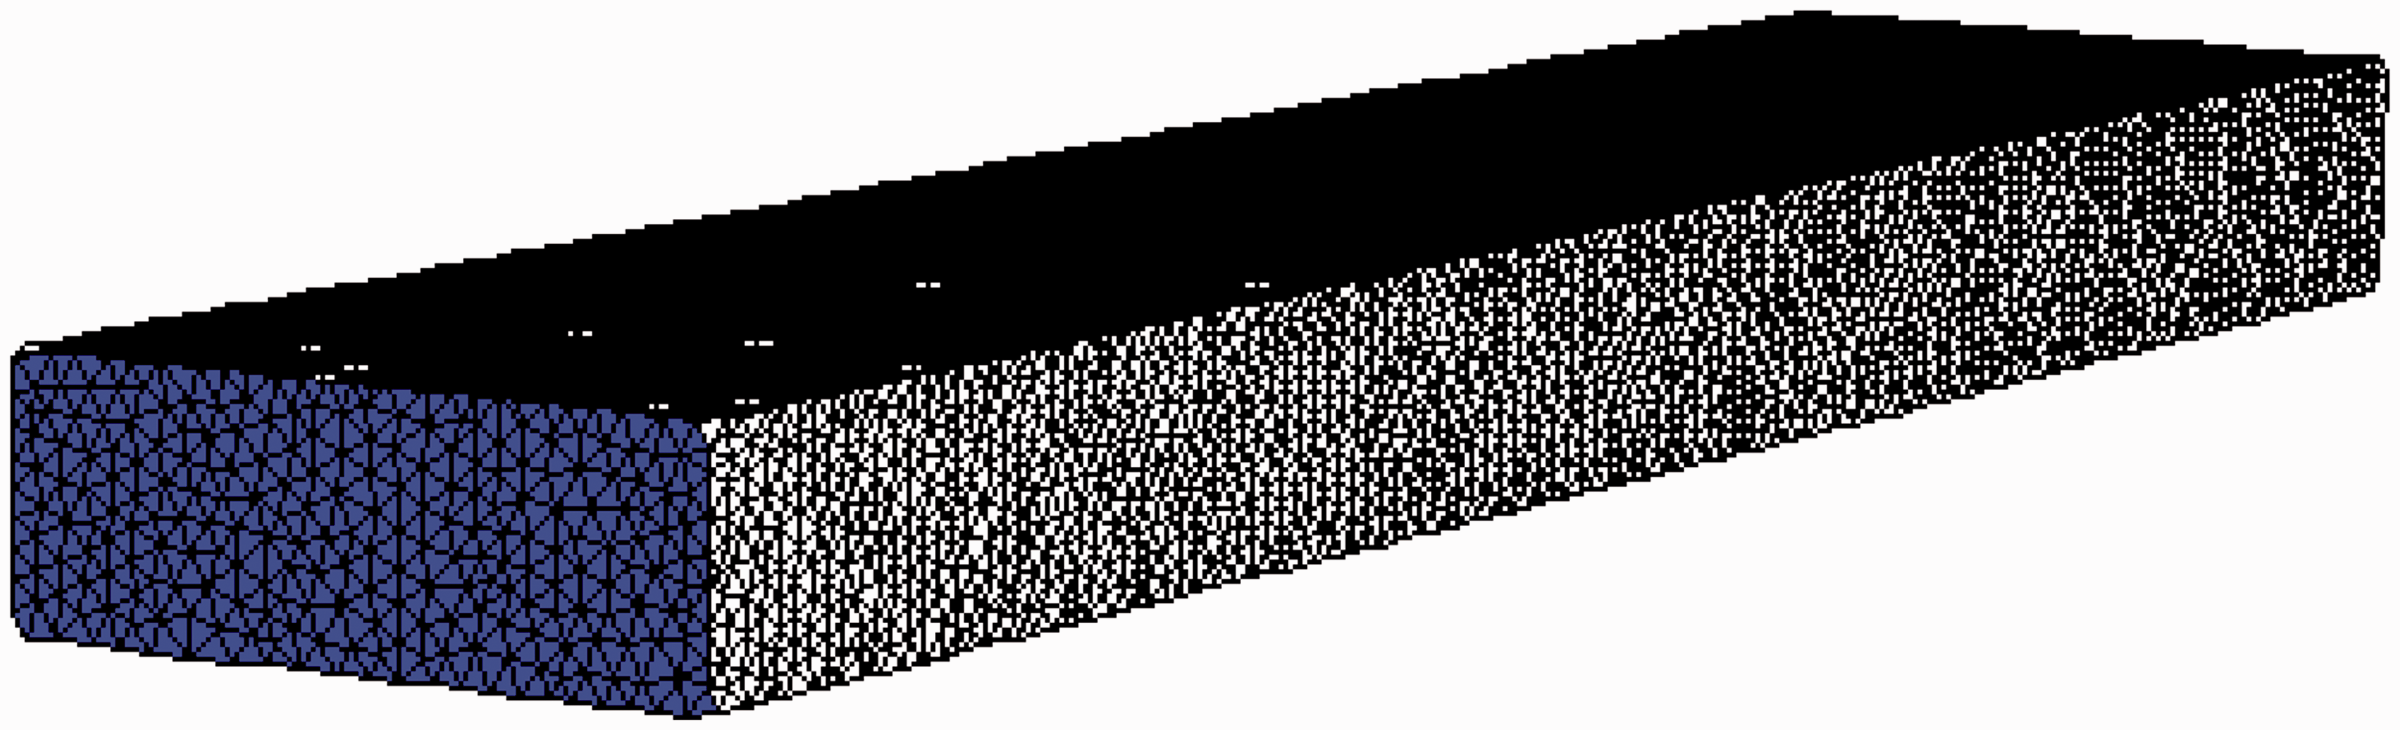
Mesh deployment for the whole computational domain.
Meshes and boundary conditions
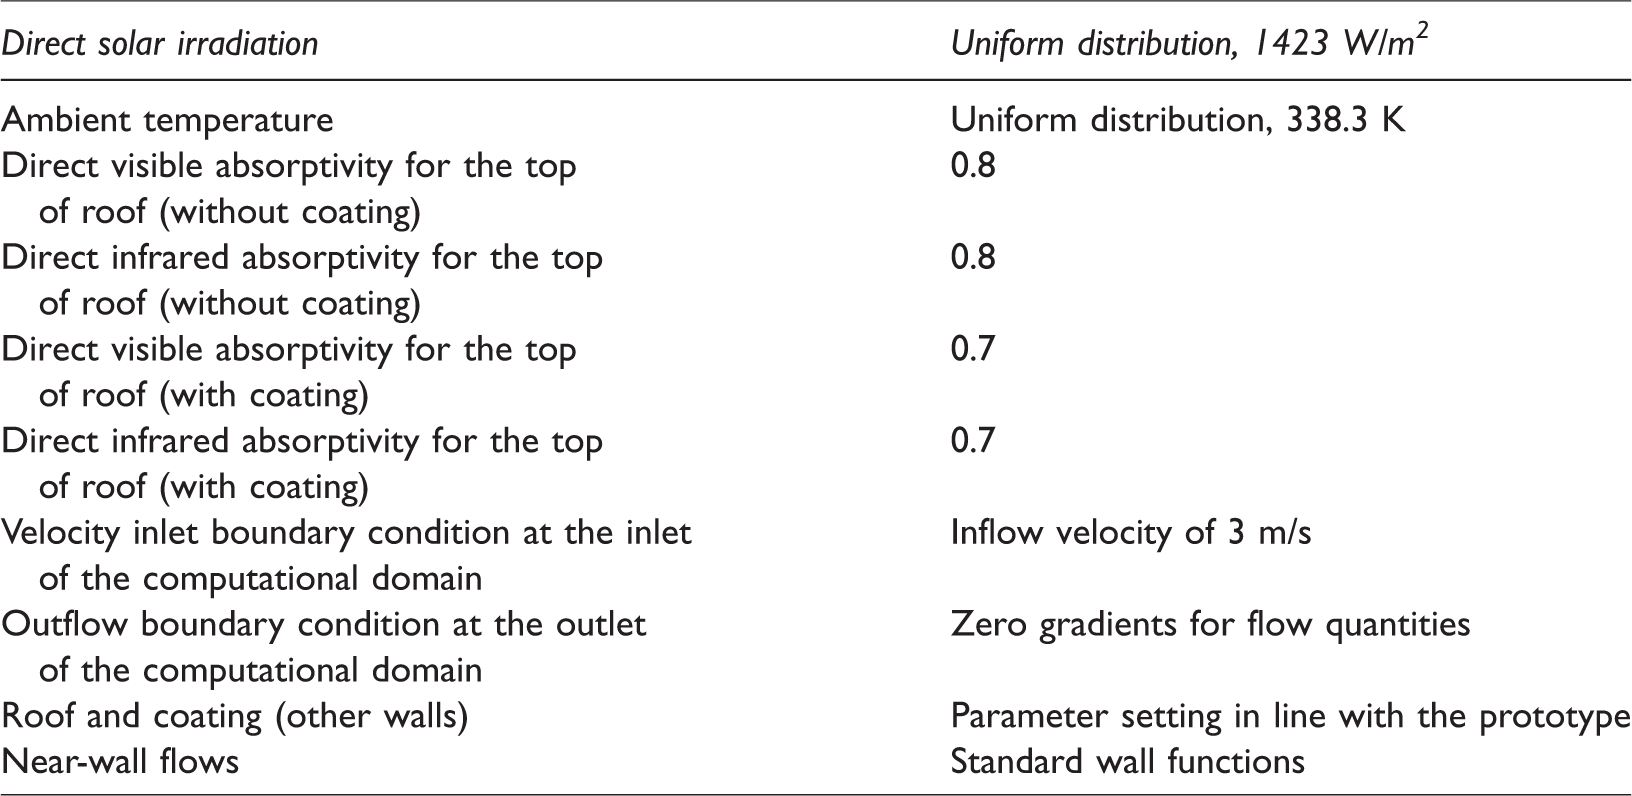
High mesh quality is a prerequisite for reliable numerical results. The ICEM software was used to generate meshes. Nonuniform unstructured meshes were used to discretize the computational domain in space, as shown in Figure 9. Near solid walls, meshes were refined to capture flow phenomena exposed to high gradients of flow quantities. A mesh independence examination was performed to eliminate the influence of mesh number. For the coated roof, the final mesh scheme has mesh number of 983,071. In Table 3, the setting of boundary conditions is explained in detail.
Parameters associated with boundary conditions.
Results and discussion
Velocity distribution
Cross-sectional velocity distributions near the coated and uncoated roofs are displayed in Figure 10. The two distributions are quite similar and the air flow is apparently disturbed by the roof. The coated roof is relatively long and the energy loss due to the friction between air and the roof is higher than that of the uncoated roof. The layer adjacent to the roof surface is critical for heat transfer between air and the roof. It is seen that overall velocity near the uncoated roof is higher than that near the coated roof. In this context, it is perceivable that the heat transfer for the uncoated roof is intensive but not sufficient compared to that associated with the coated roof.
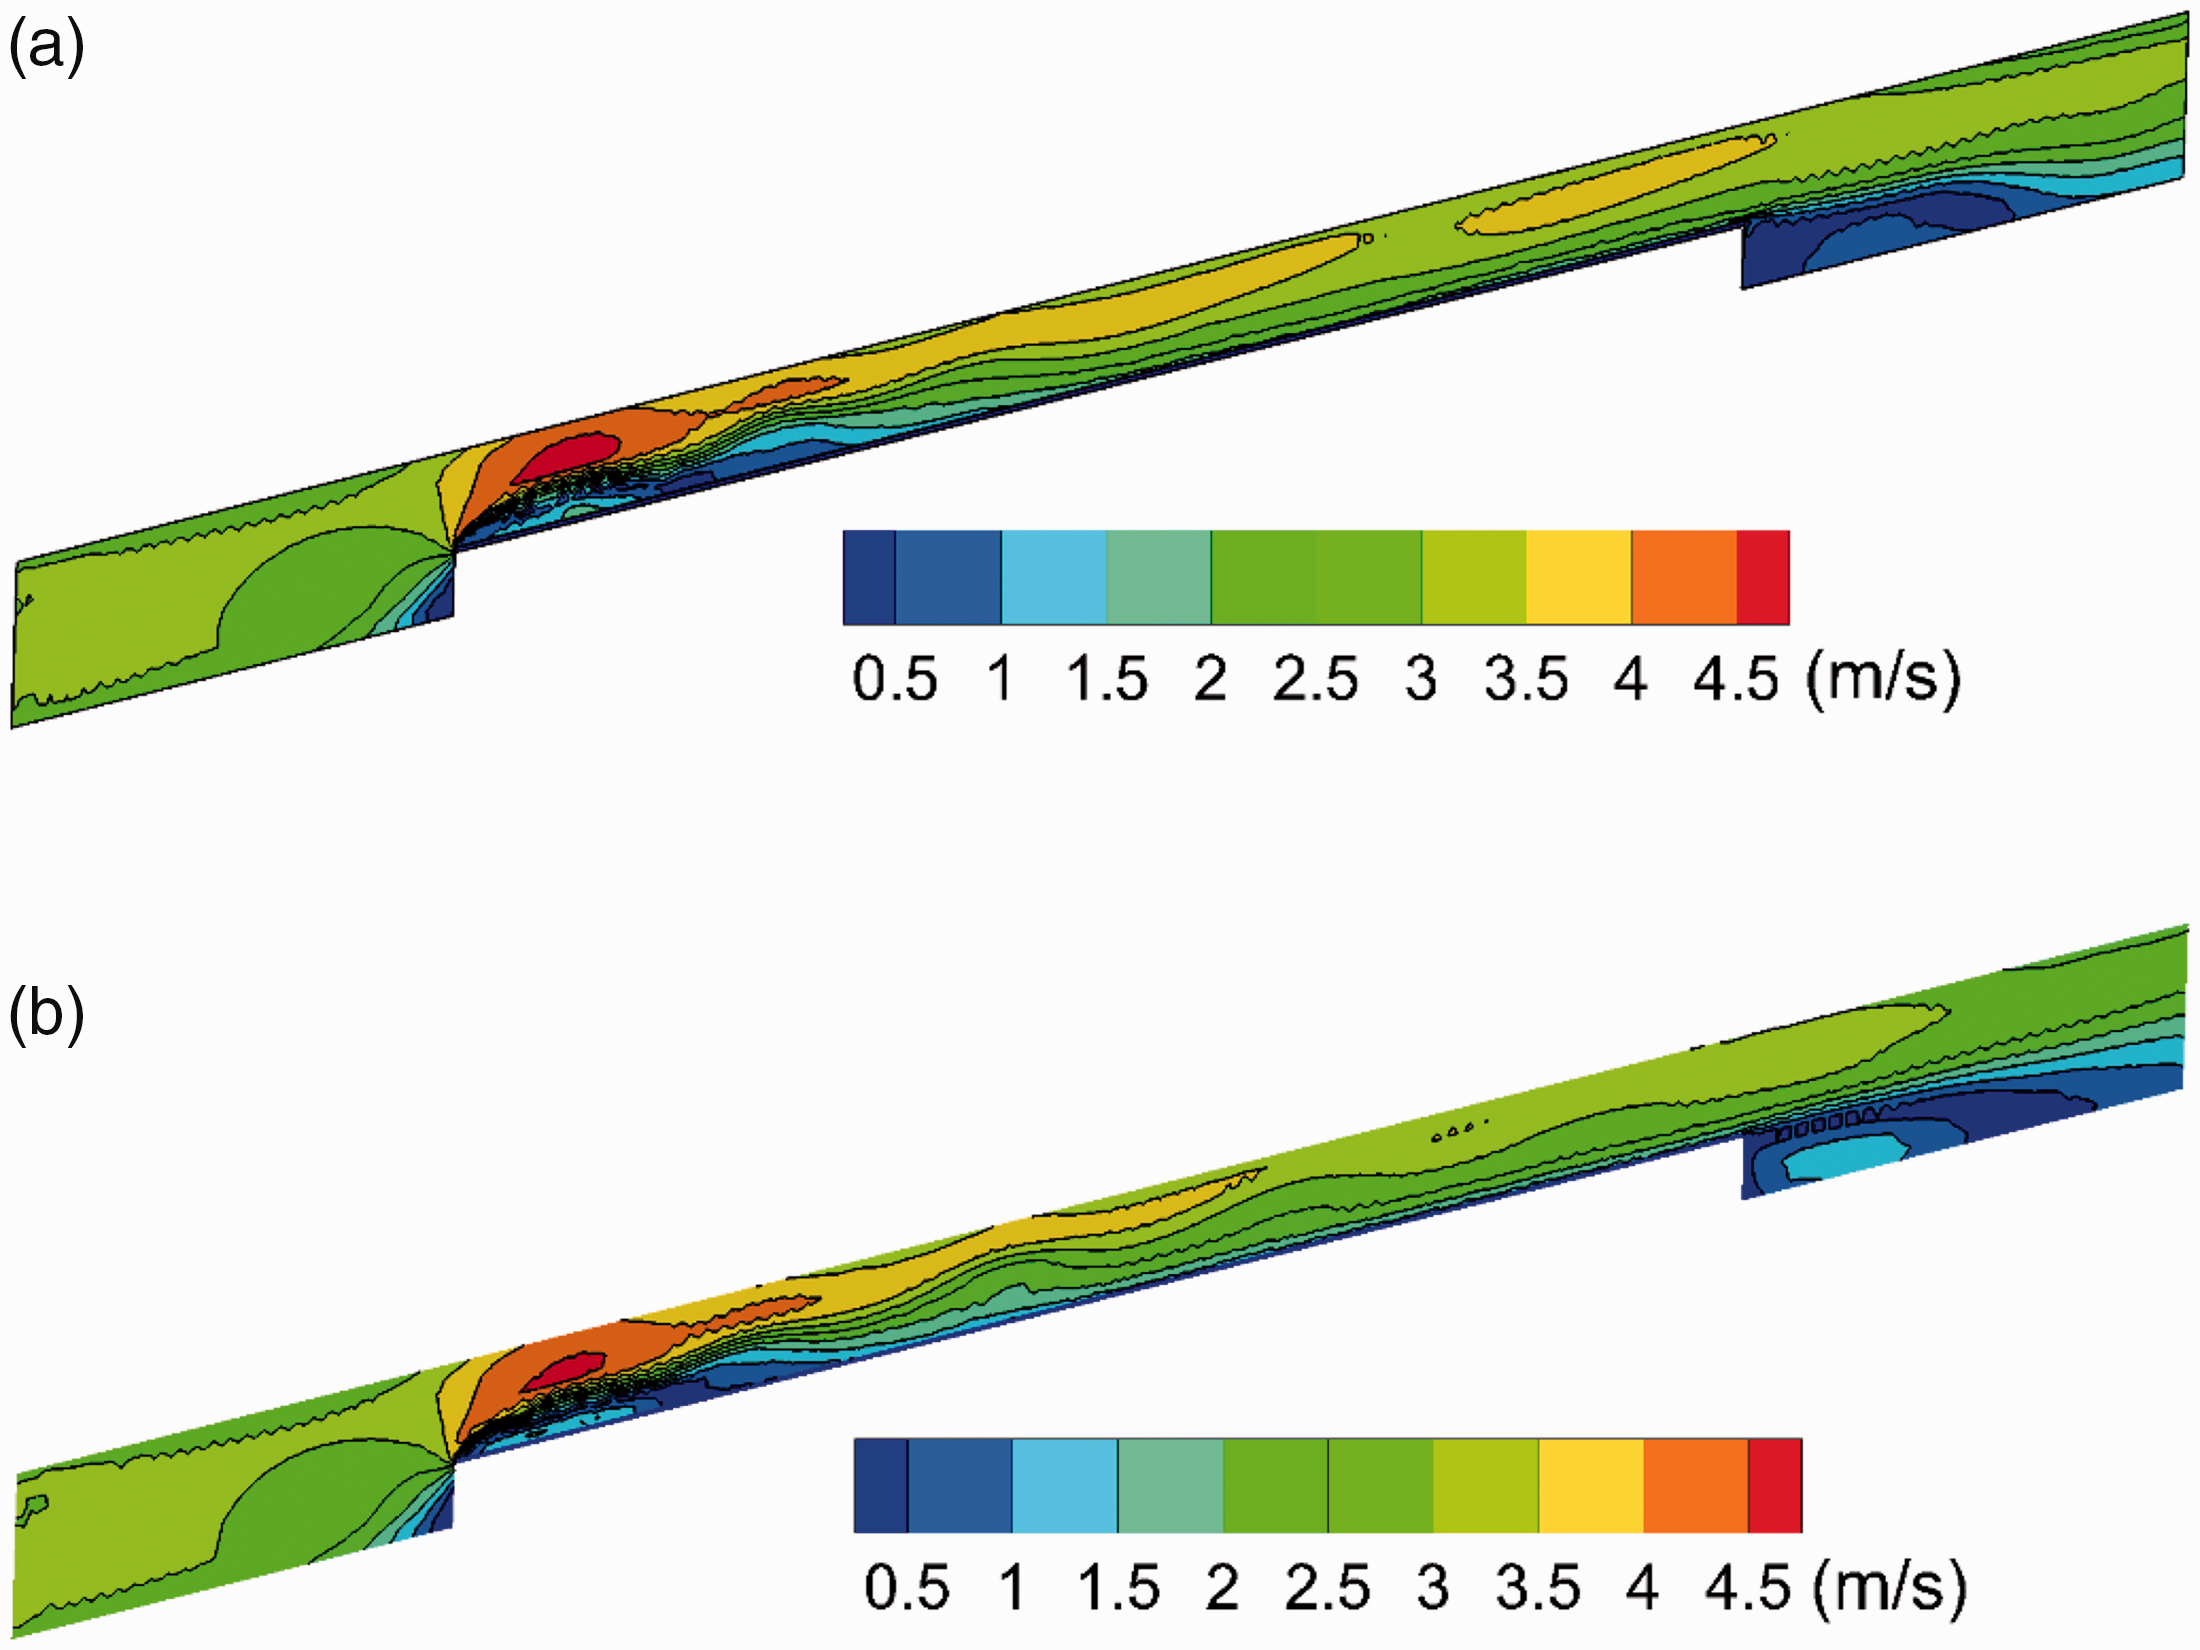
Velocity distributions near coated and uncoated roofs. (a) Coated roof and (b) uncoated roof.
Temperature distributions near coated and uncoated roofs
Cross-sectional distributions of temperature near the coated and uncoated roofs are shown in Figure 11. A high-temperature band is witnessed near the roof surface, which is shared by the two cases. Away from the roof, temperature is low. Meanwhile, away from the roof surface, the temperature distribution is fairly uniform. It is perceptible that heat transfer between the roof and ambient air is intensive. Furthermore, it is seen that temperature near the coated roof is lower than its counterpart, implying an improvement in heat transfer capability. With respect to the maximum temperature, a reduction by 12.5% is accomplished with the coated roof compared to that of the uncoated roof. Furthermore, the installation of the solar PV system on the coated roof contributes to the decrease in the energy demand in the hall. The temperature difference between the coated and uncoated roofs is ascribed to the roof coating. Similarly, it was proved that the introduction of white solar reflective paint on roof surface brought about a drastic decline in heat discomfort and carbon dioxide emissions for single-storey buildings under the environment of humid climate (Yew et al., 2013).
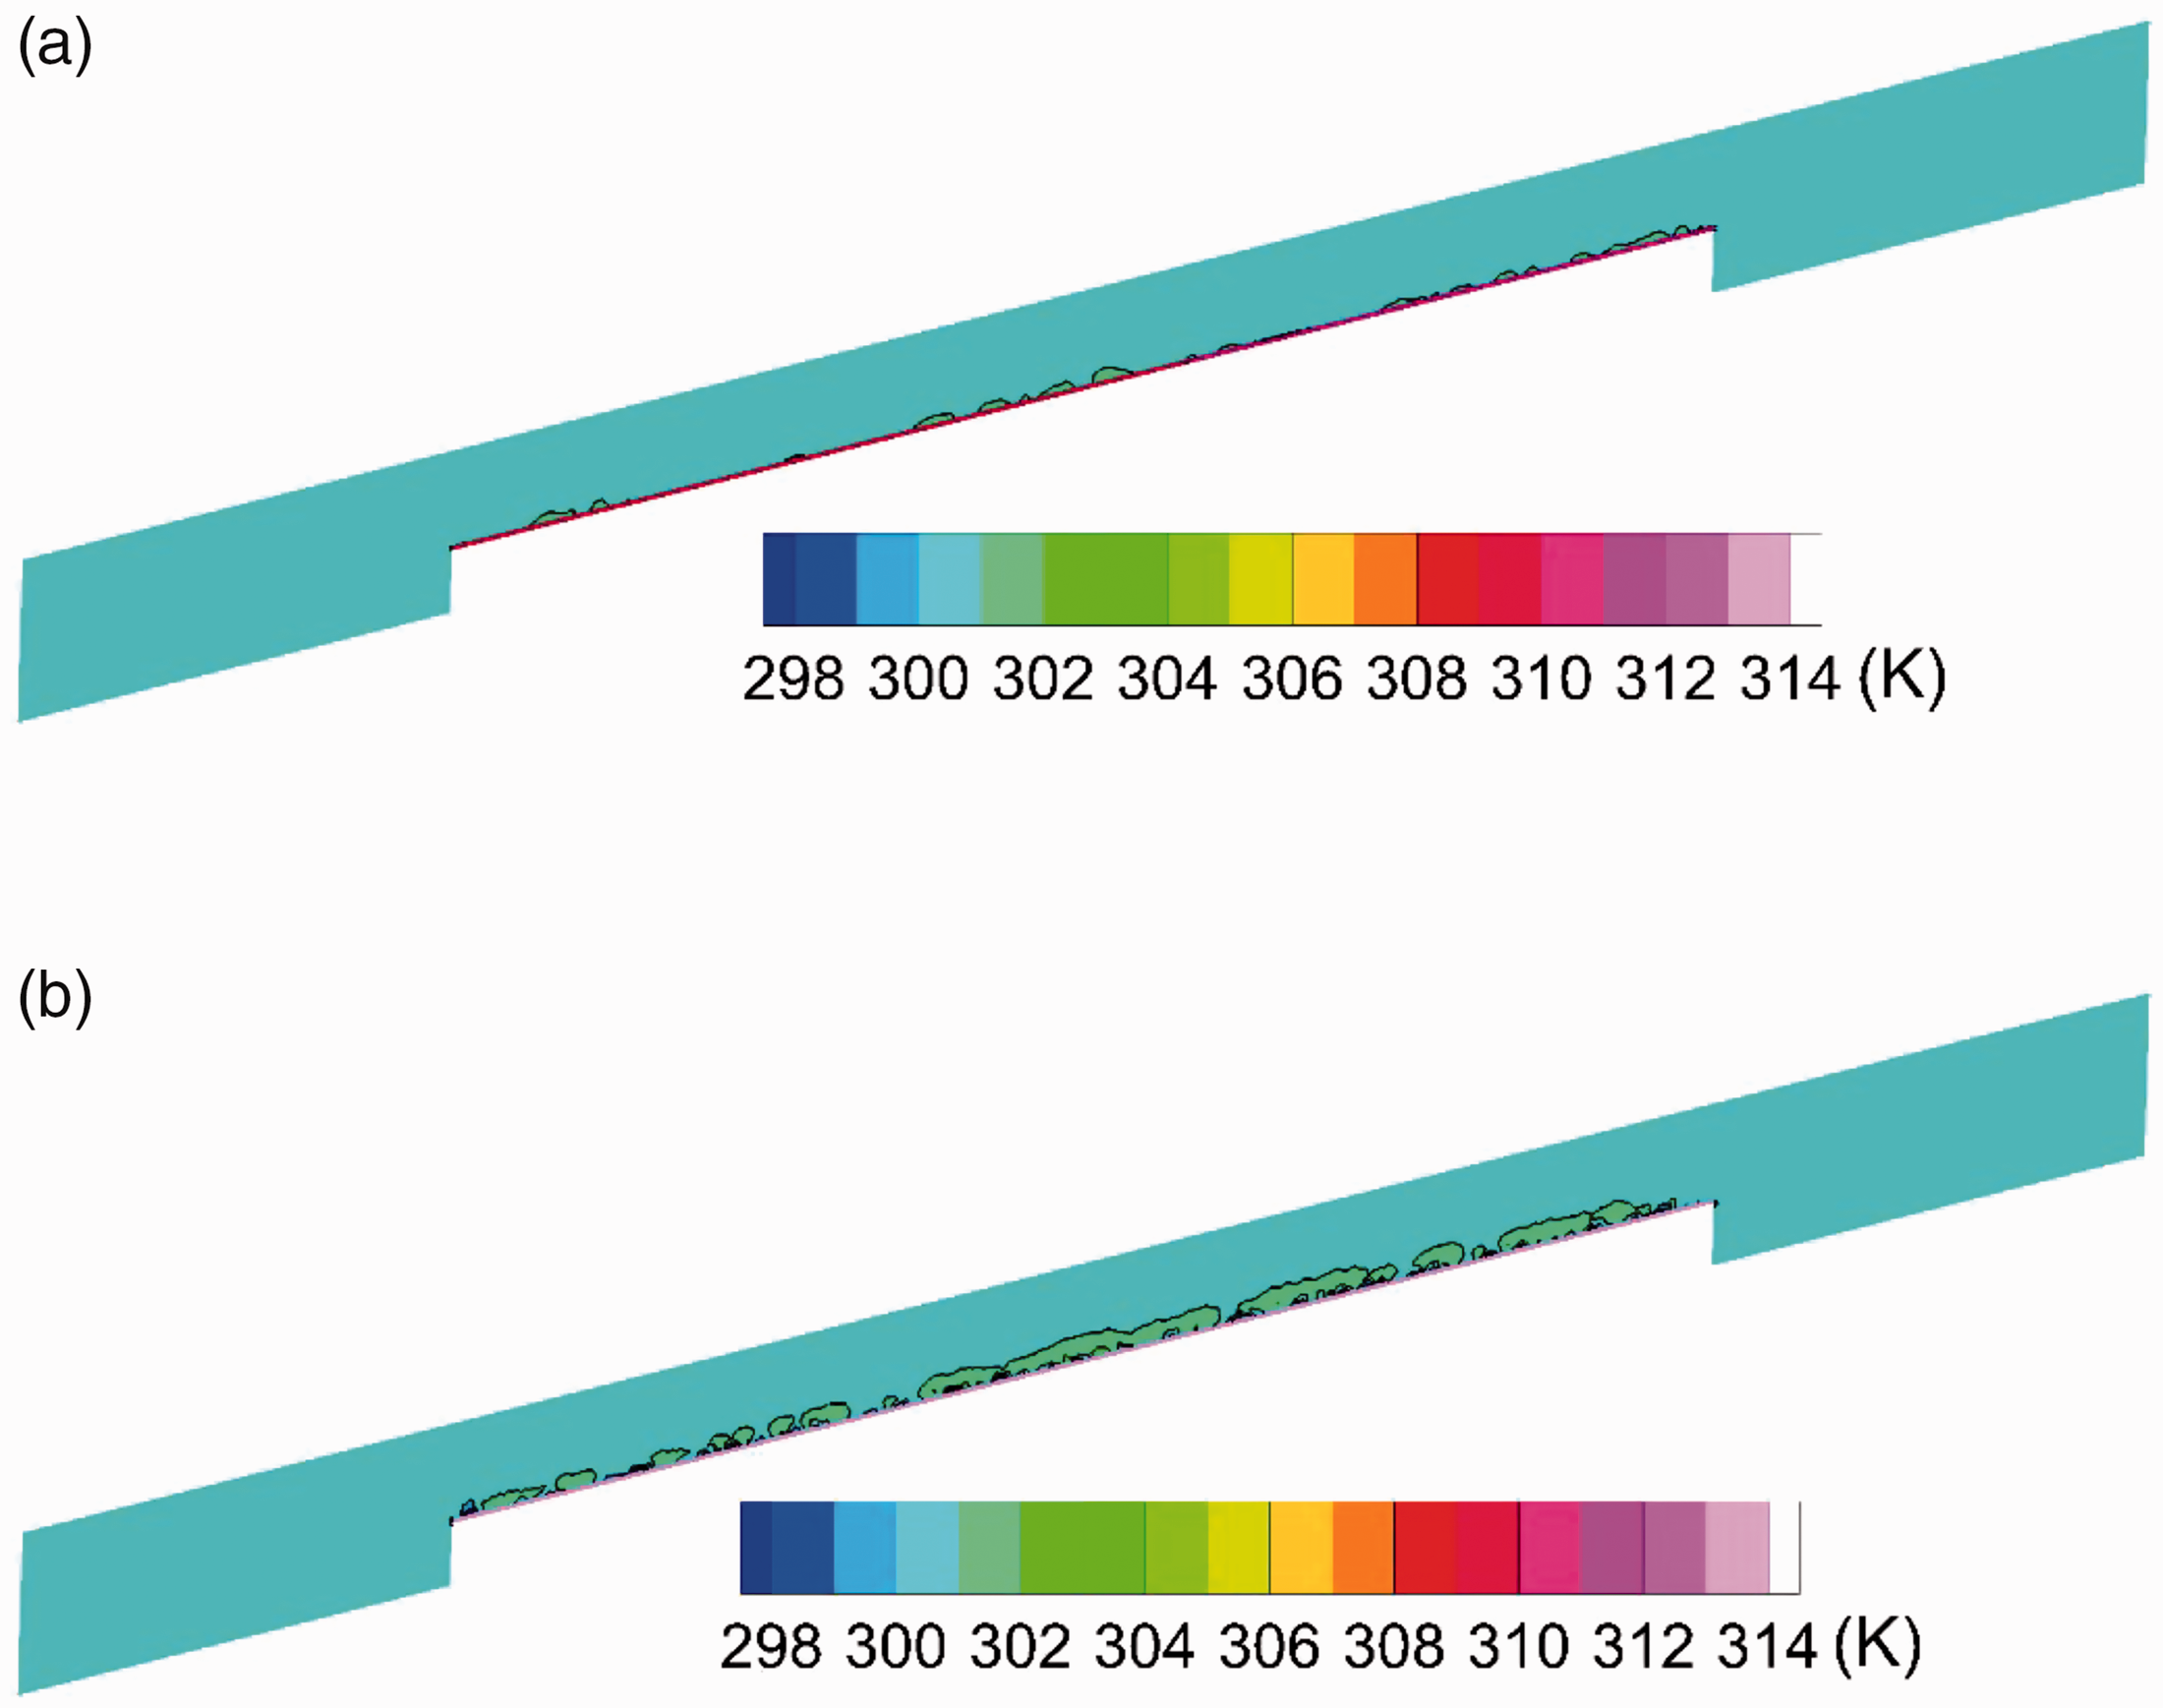
Temperature distributions near coated and uncoated roofs. (a) Coated and (b) uncoated.
Both the interior and external temperatures of the roof were measured using both the thermometer and PT100 platinum–rhodium probes, which can detect temperatures ranging from −50 to +150°C). The field data were acquired with a sampling period of 30 days. Based on field data, a comparison of temperature distributions between coated and uncoated roofs is illustrated in Figure 12. As is clearly evident that the time-dependent temperature with the uncoated roof is consistently higher than that of the coated roof. For the uncoated roof, temperatures range from 20 to 35°C, which was obtained at the solar radiation of 1000 W/m2. Meanwhile, the peak temperature associated with the coated roof is 28°C. Moreover, the variation in temperature with the sampling time is not uniform. It is apparent that the middle segments of the two temperature curves are featured by nearly parabolic patterns. The increase in the roof temperature is proportional to the solar heat gain (Lee et al., 2009). An experiment on the impact of roof reflectivity on the black and white roofs was performed by Scherba et al. (2011), and it was observed that temperature started to rise at the same moments for the two roofs but temperature gradients were different.
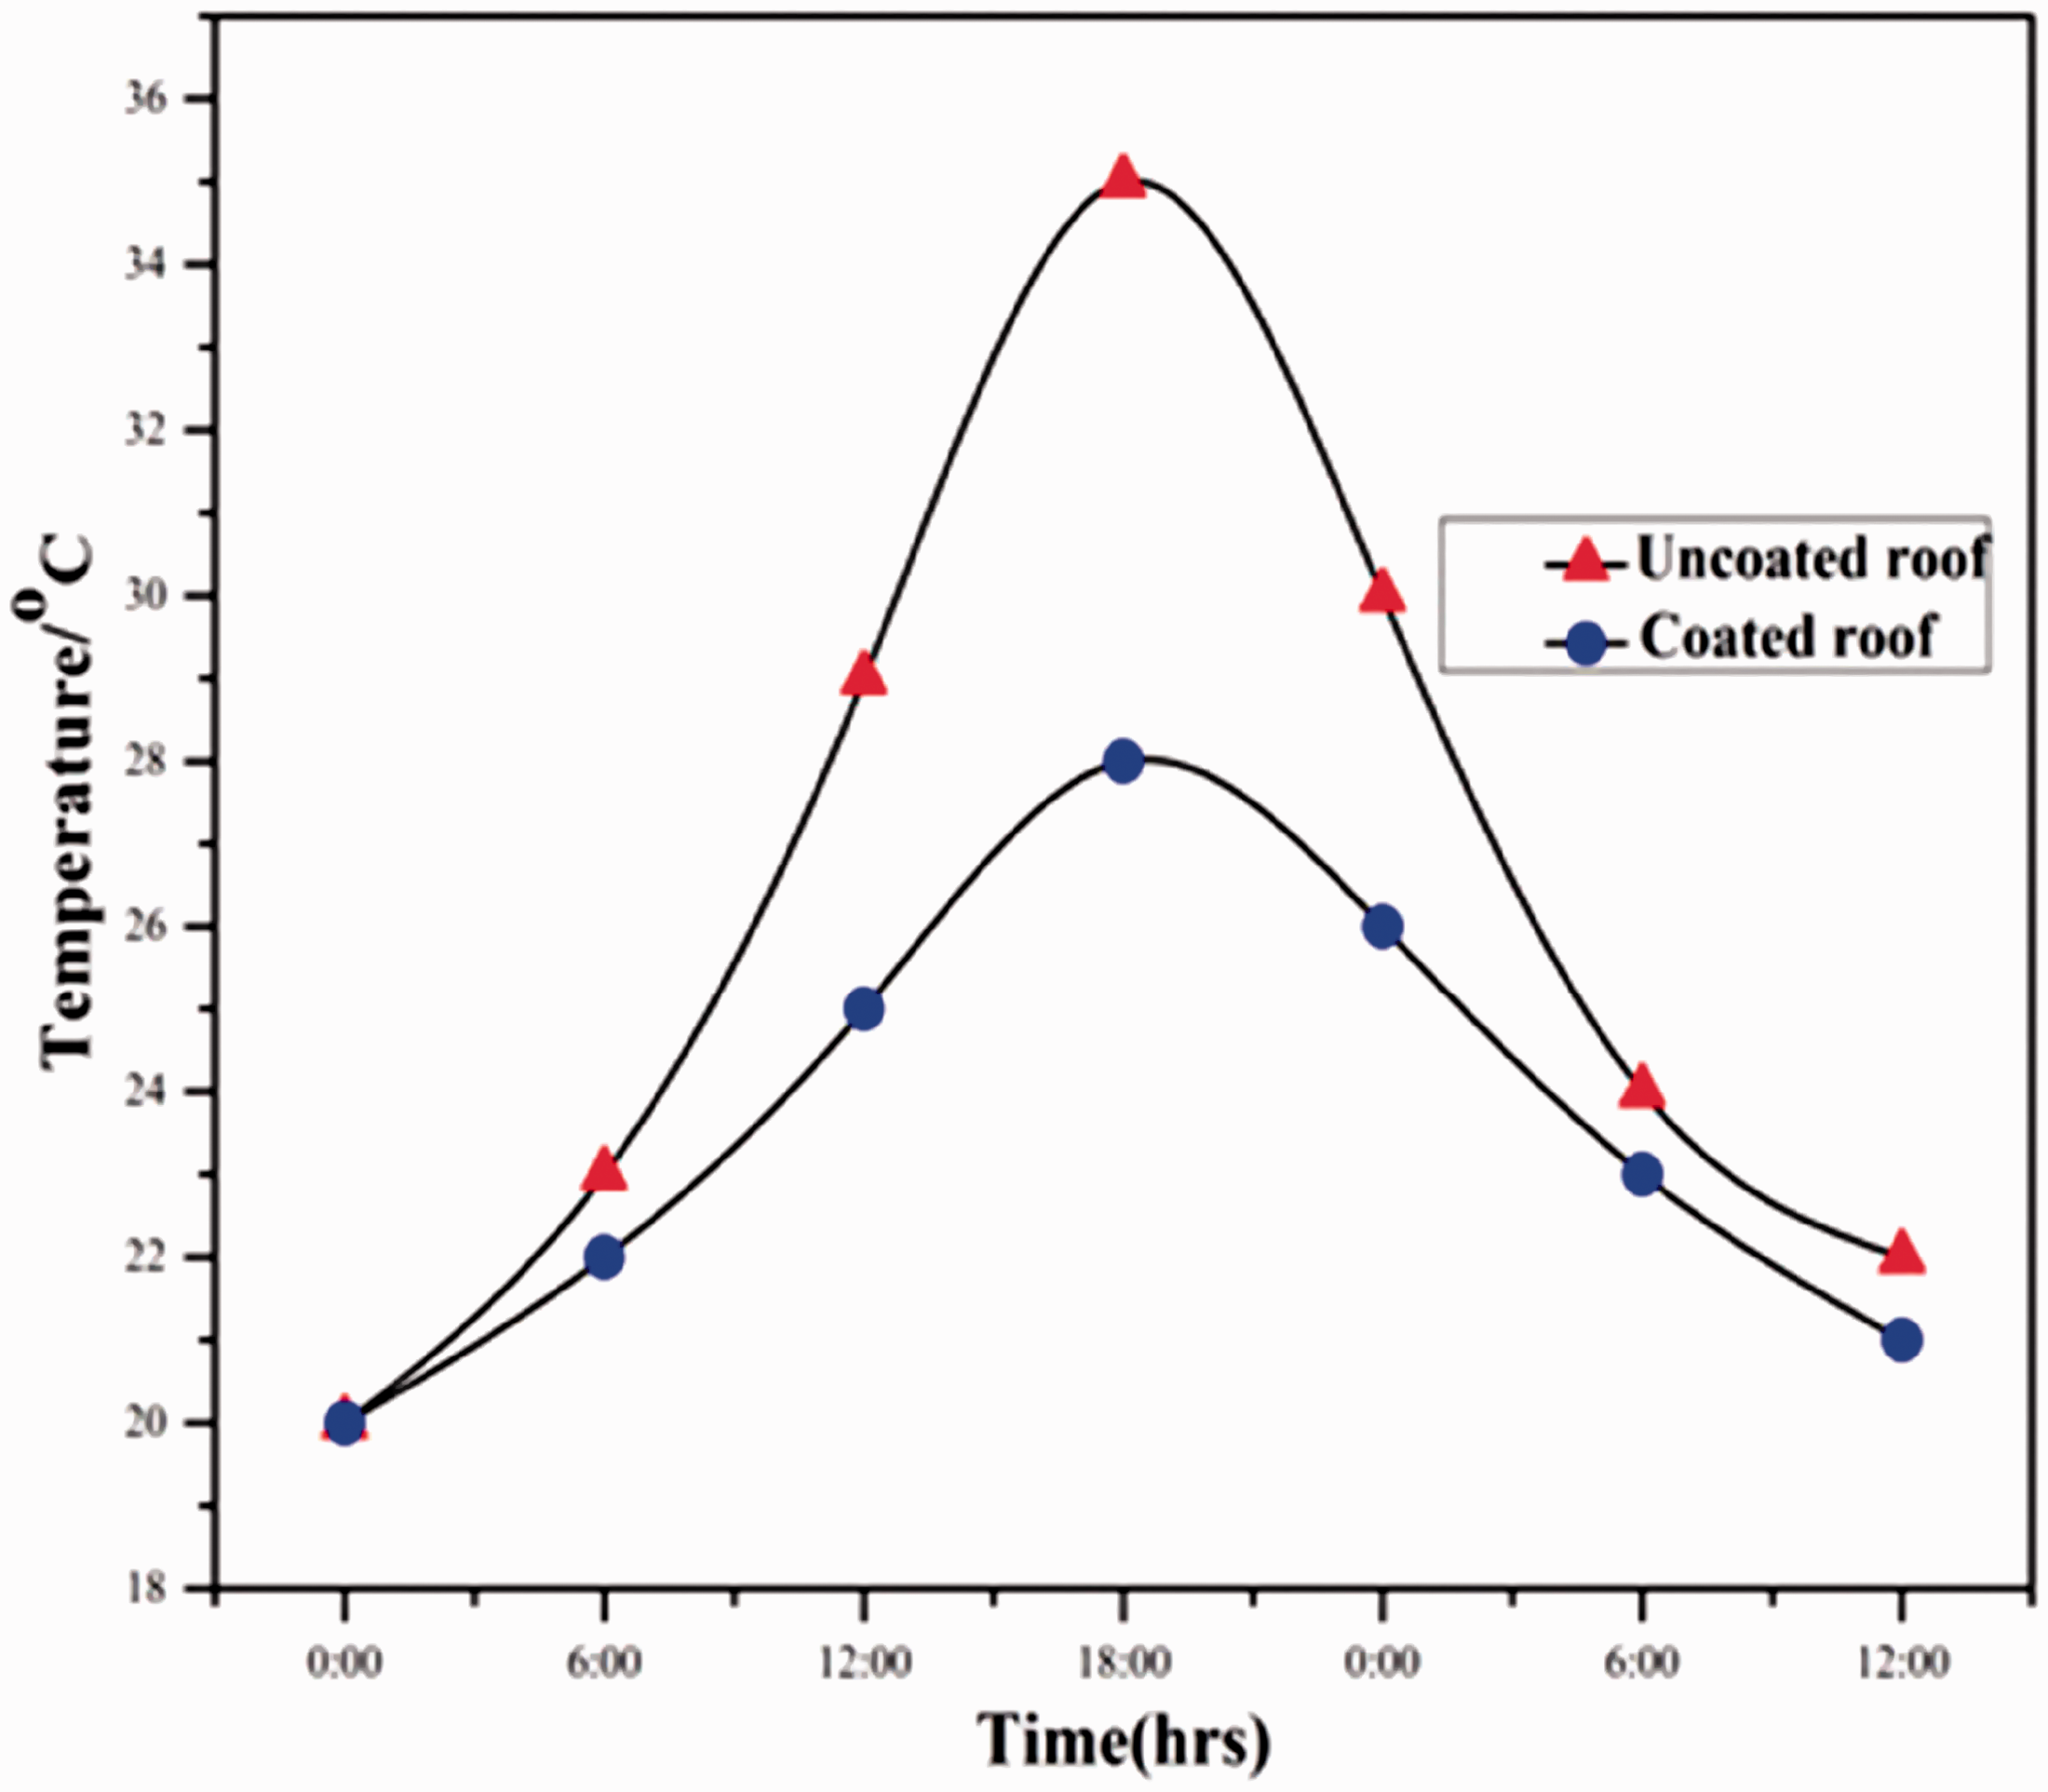
Time-dependent variations of temperature for uncoated roof and coated roofs.
Temperature as well as temperature variation depends on multiple factors. It was witnessed beneath the vaulted roof that temperature varies in different days (Tang et al., 2006). The increase in the roof temperature during cloudy days was limited due to low degrees of solar radiation (Lobera and Valkealahti, 2013). The roof coating plays an important role in temperature modulation, which is essentially related to the heat storage and heat reflection capabilities of the coating. In this context, it was demonstrated that the roof composed of phase change materials had favorable thermal performance (Li et al., 2015).
A comparison of simulation results and field data is illustrated in Figures 13 and 14. The results with the uncoated roof are plotted in Figure 13. It is evident that the two curves are highly correlated. At the initial stage, the simulation results are slightly higher than the field data. Nevertheless, the maximum deviation is less than 6%. Actually, the highest deviation is related to the air flow patterns. In consideration of the accuracy for engineering flow simulations, the deviation is acceptable. For the uncoated roof, heat is directly absorbed by the roof and the ascending of temperature follows an almost linear route.
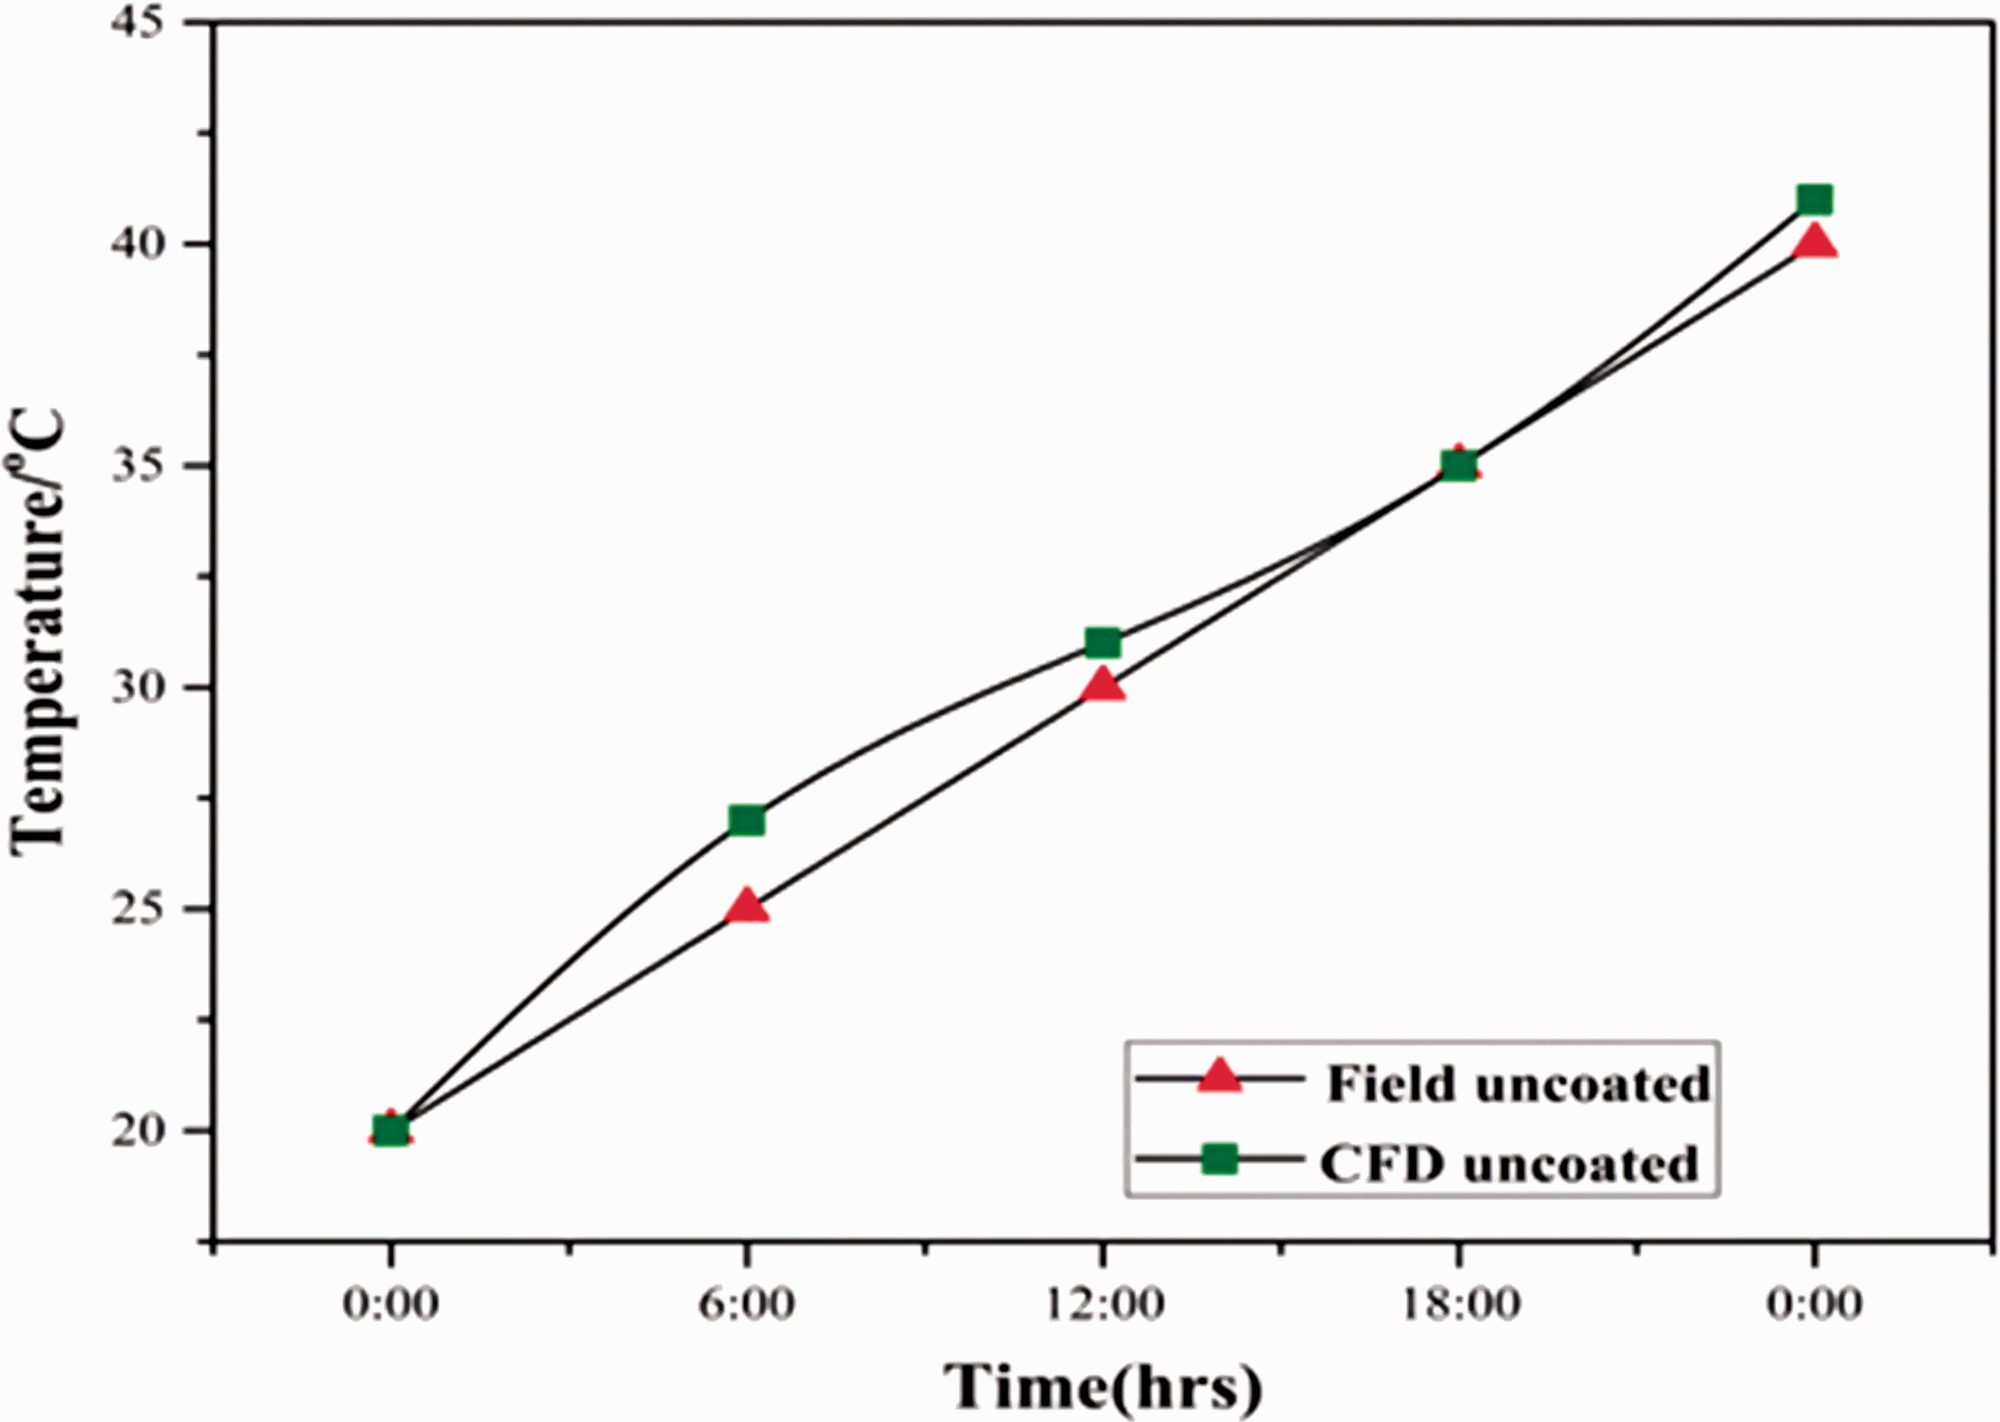
Comparison of simulation and field data for uncoated roof. CFD: computational fluid dynamics.
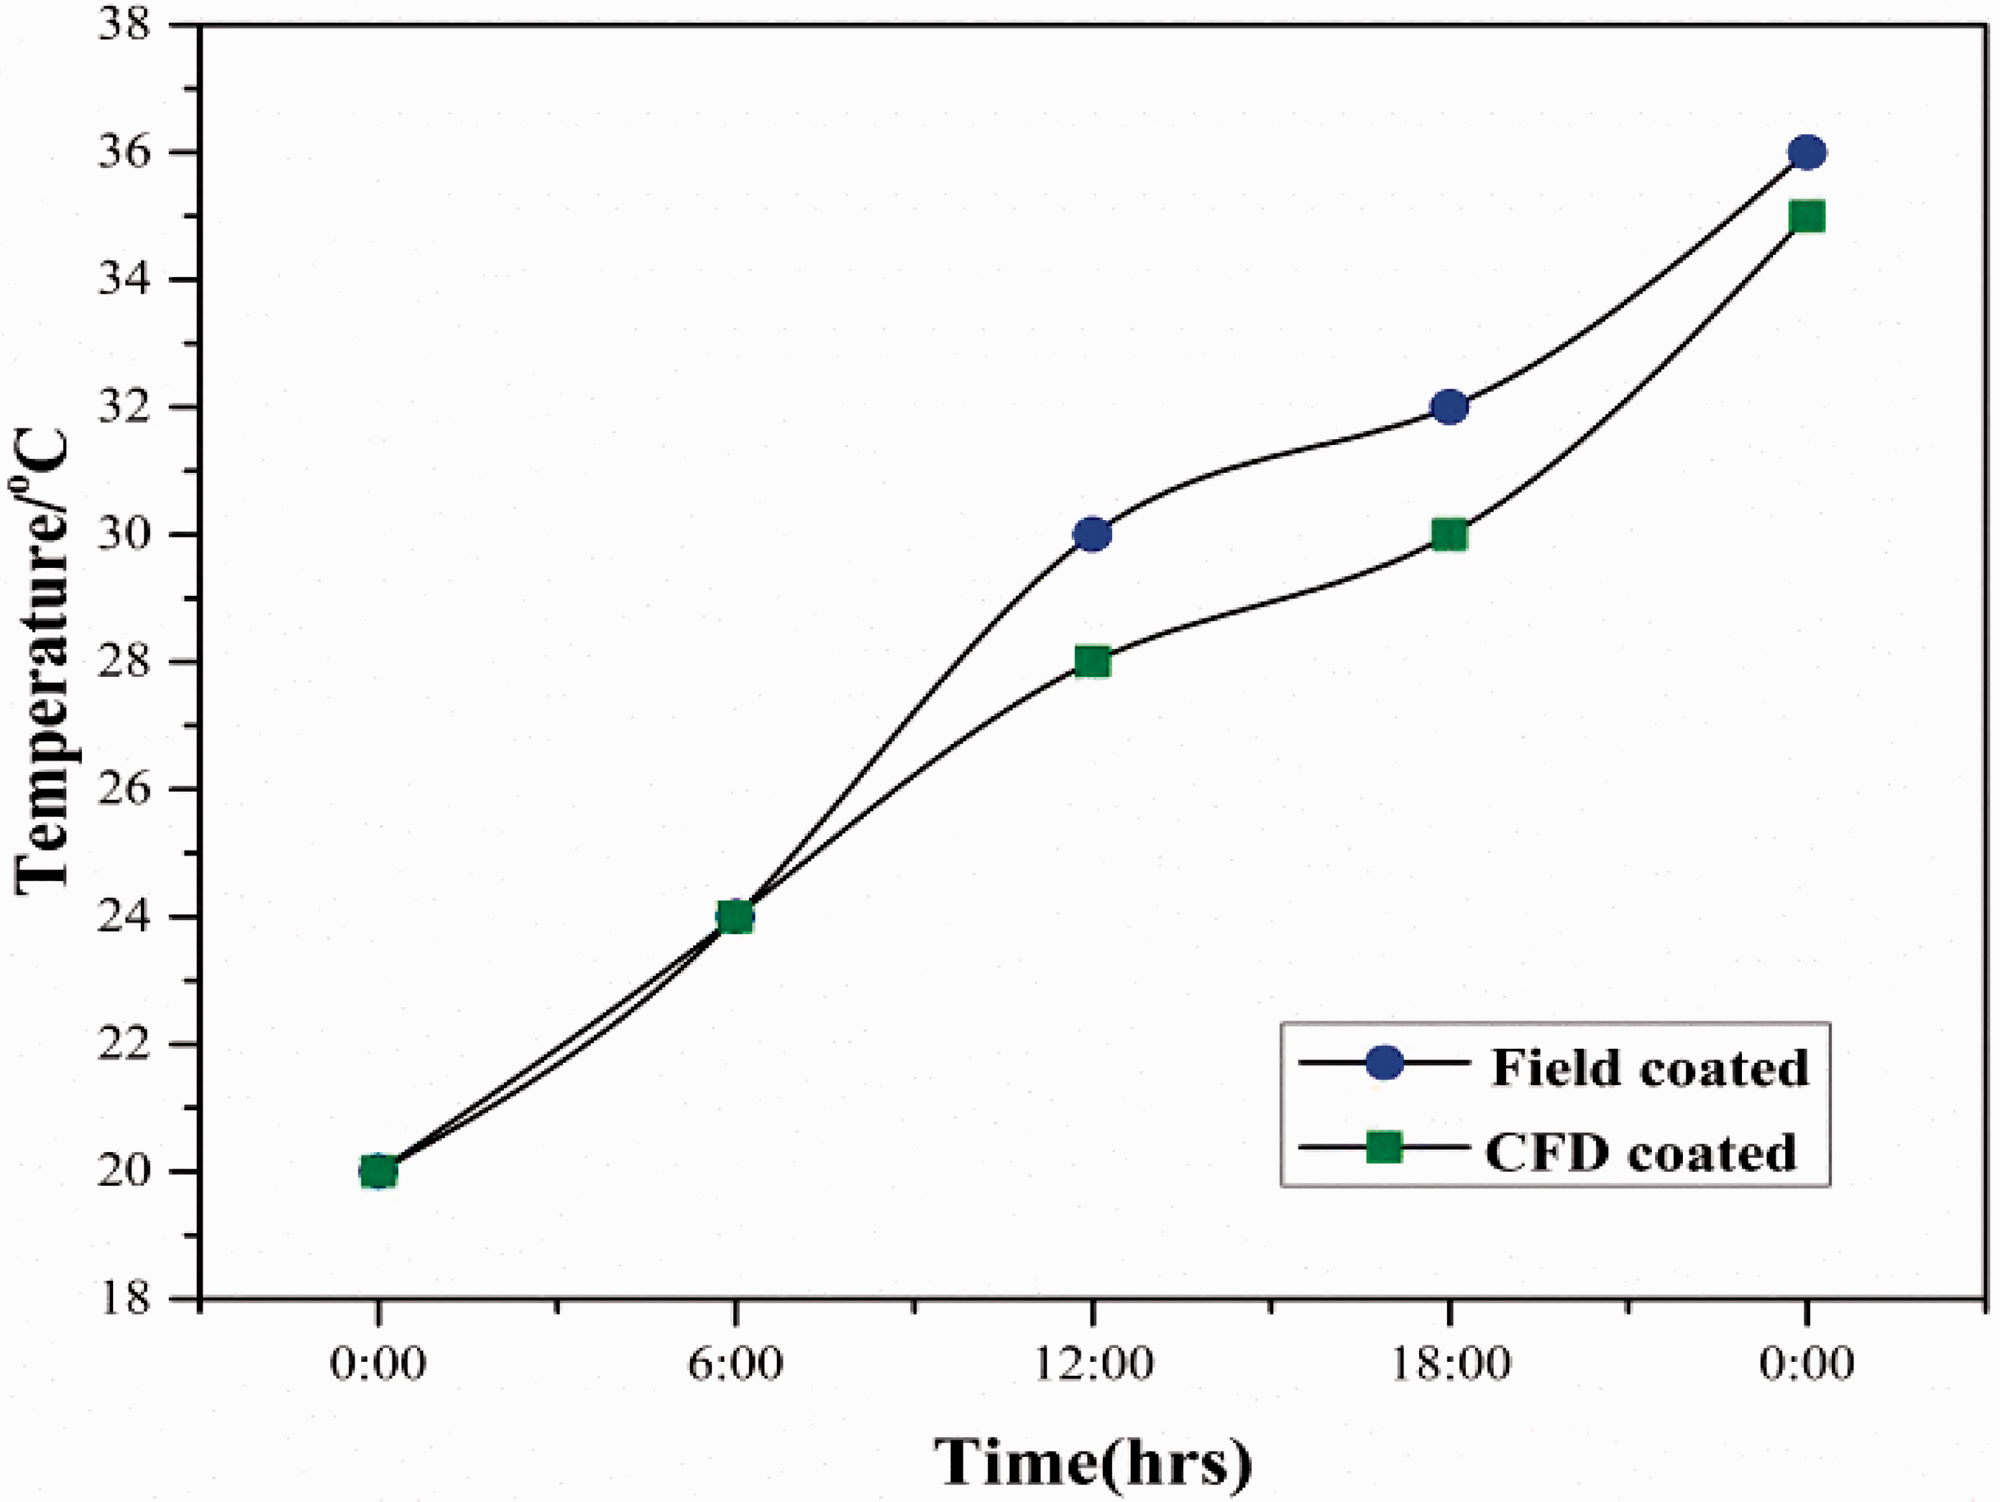
Comparison of simulation and field data for coated roof. CFD: computational fluid dynamics.
For the coated roof, the two curves plotted in Figure 14 are similar although both curves are not smooth. It is seen that the largest gap between the two curves arises at the middle and later stages. This is related to the numerical setting of the roof coating. Alternatively, the numerically deployed roof coating is different from the prototype. Nevertheless, it can be evaluated that the maximum deviation is less than 7%.
Roof performance with solar radiation
The advantages of the coated roof in the reduction of temperature have been proved in previous discussion. Furthermore, the combination of the solar PV system with roof was highly recommended (Chou et al., 2013). A 30% reduction in the total heat gain could be achieved (Chou and Lee, 1988).
Absorption coefficient of external roof surface
The average temperature of the external surface of the coated roof is related to the layers constituting the roof. Therefore, different absorption coefficients can be acquired as the layers are altered. Here, the absorption coefficient of 0.8 was selected with the transition temperature of 338.3 K. The purpose was to look at the correlation between the reflection rate and the absorption coefficient of the roof layers. It was observed experimentally that the peak temperature of the surface layer occurred between the periods from 4 pm to 8 pm. Therefore, the coated roof has a more significant impact on the reflection of the solar radiation. Two types of roofs, green and black roofs, have been tested by Alshayeb and Chang (2016) and it was found that the green roof was associated with lower temperature and more energy reduction.
Performance effect of solar PV
It is seen in Figure 6 that the solar radiation in Ghana is abundant. In this context, the installation of the solar PV system on roof top might offer more benefits to buildings. Meanwhile, some roof area is shaded by the solar PV system components and the temperature input to the roof surface can be further decreased. More importantly, a power source is thereby provided to reduce the energy consumption in the hall. It was reported that the output electricity was dependent on the strategies of utilizing the solar radiation (Bahrami et al., 2017).
Energy output of the hall at Takoradi Technical University
The yearly energy production from grid-connected systems depends on many factors. It depends on the peak power of the arrays as well as the average annual irradiation of the case study area. The inverter efficiency also determines the yearly energy output of the PV system. The annual energy production with the average irradiation of Takoradi, obtained using RETScreen software, is 4.88 kW h/m2/day and the peak power of the modules is 245 kW. The efficiency of the inverter, η, is 98%. Therefore, yearly energy production, Eac, is given by


Load assessment of the hall
An energy audit was introduced in the hall; the load assessment of the hall was performed to find out the total energy consumption rate of the hall. A calculation on the power consumption and other parameters of the hall was made as well. Details of the load assessment are listed in Table 4.
Load assessment for the roof-coated hall.
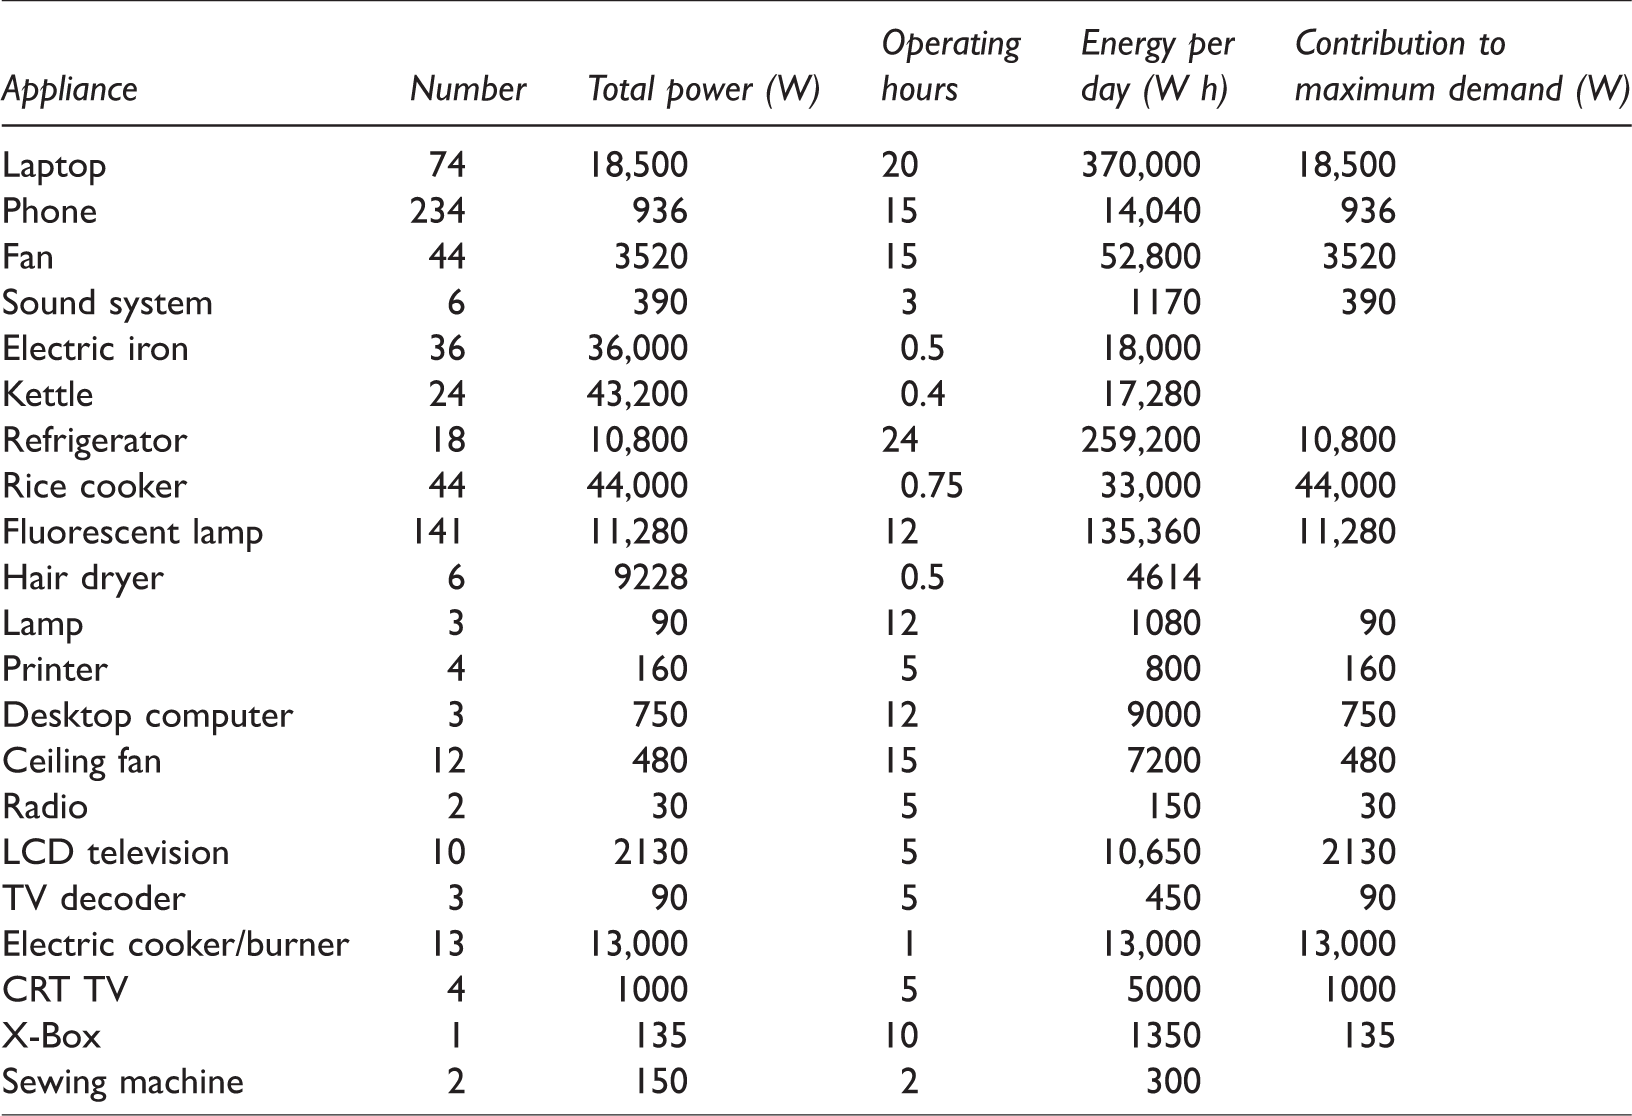
The load assessment yields a peak demand of 107,291 W (107.291 kW) and a daily total energy consumption of 954,444 W h (954.444 kW h/day). There are two semesters for Takoradi Technical University. Each semester consists of four months. The total operating months for the hall is eight months (240 days) in a year. The total energy consumed by the hall in one year is 954.444 kW h × 240 = 229.066 MW h/year. Figure 15 shows the monthly energy production from the solar energy.
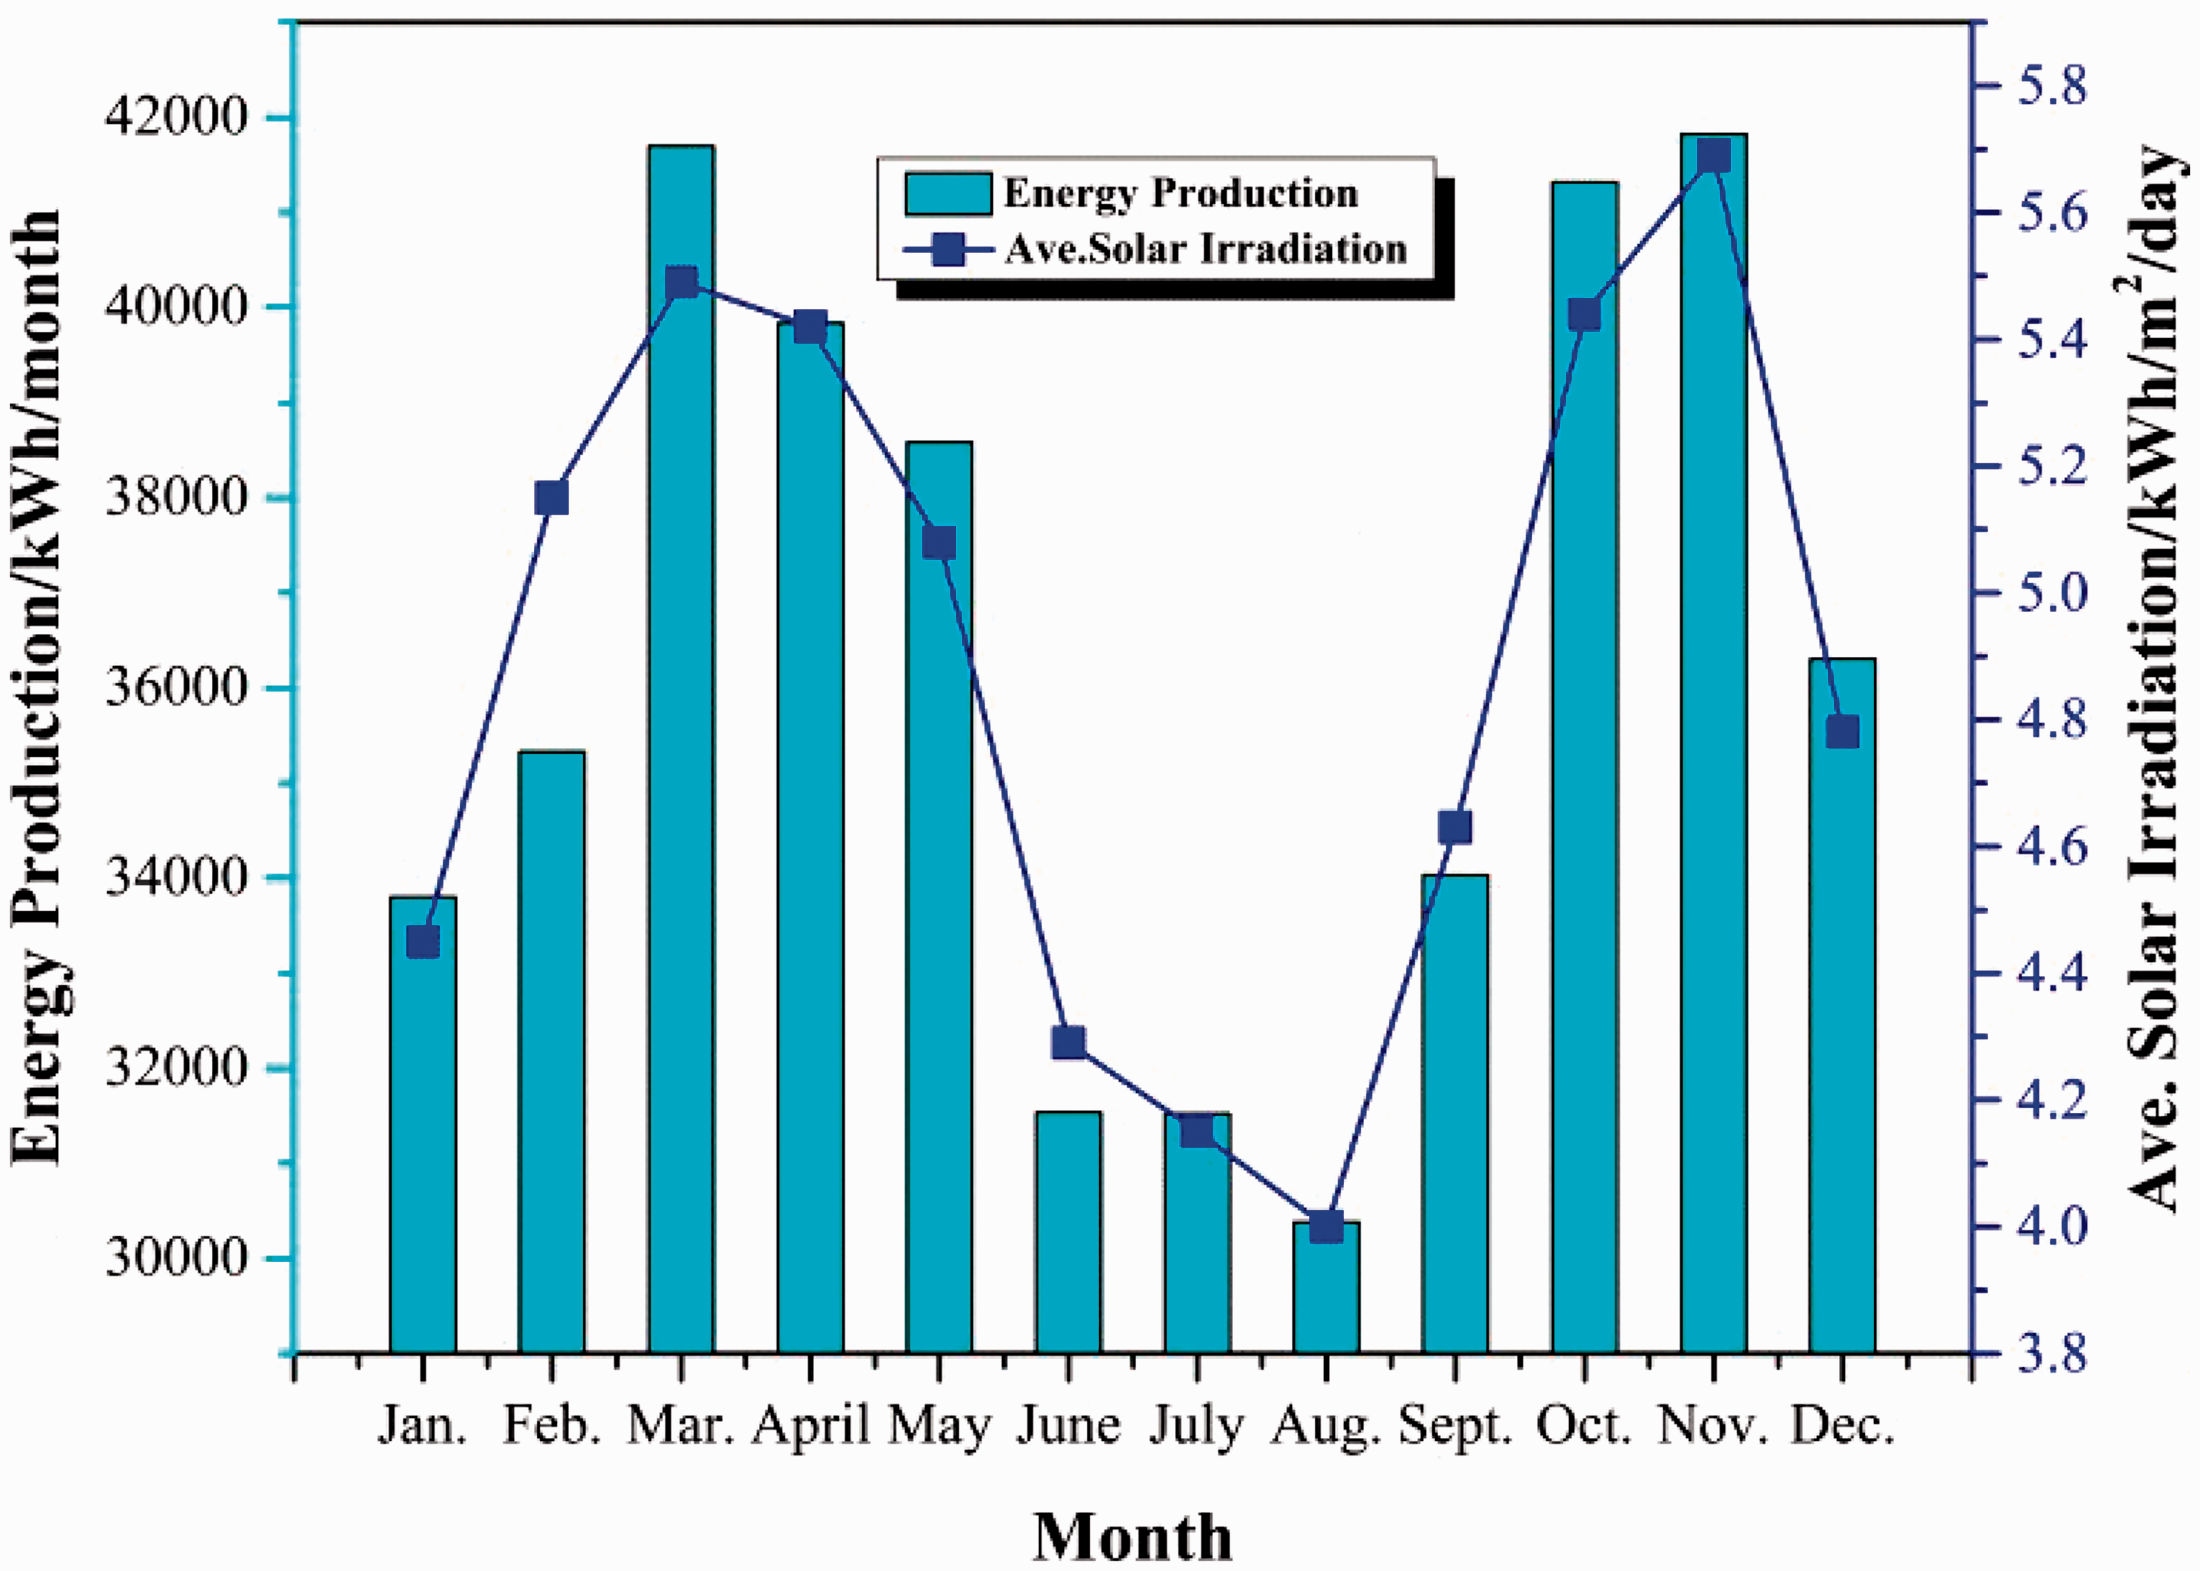
Monthly energy production from the solar energy.
It is seen in Figure 15 that August produces a monthly energy of 30,380 kW h and November 41,821.5 kW h. Such a considerable gap is ascribed to weather changes as well as the difference in the solar irradiance intensity. A comparison between the total energy production and the energy demand of the hall is illustrated in Figure 16. The total estimated energy of the grid-connected system is 427.670 MW h/year and the total energy demand of the hall is 229.066 MW h/year. This means that if the hall consumes power only from the PV system, an excess energy of 198.6 MW h/year can be fed to the grid.
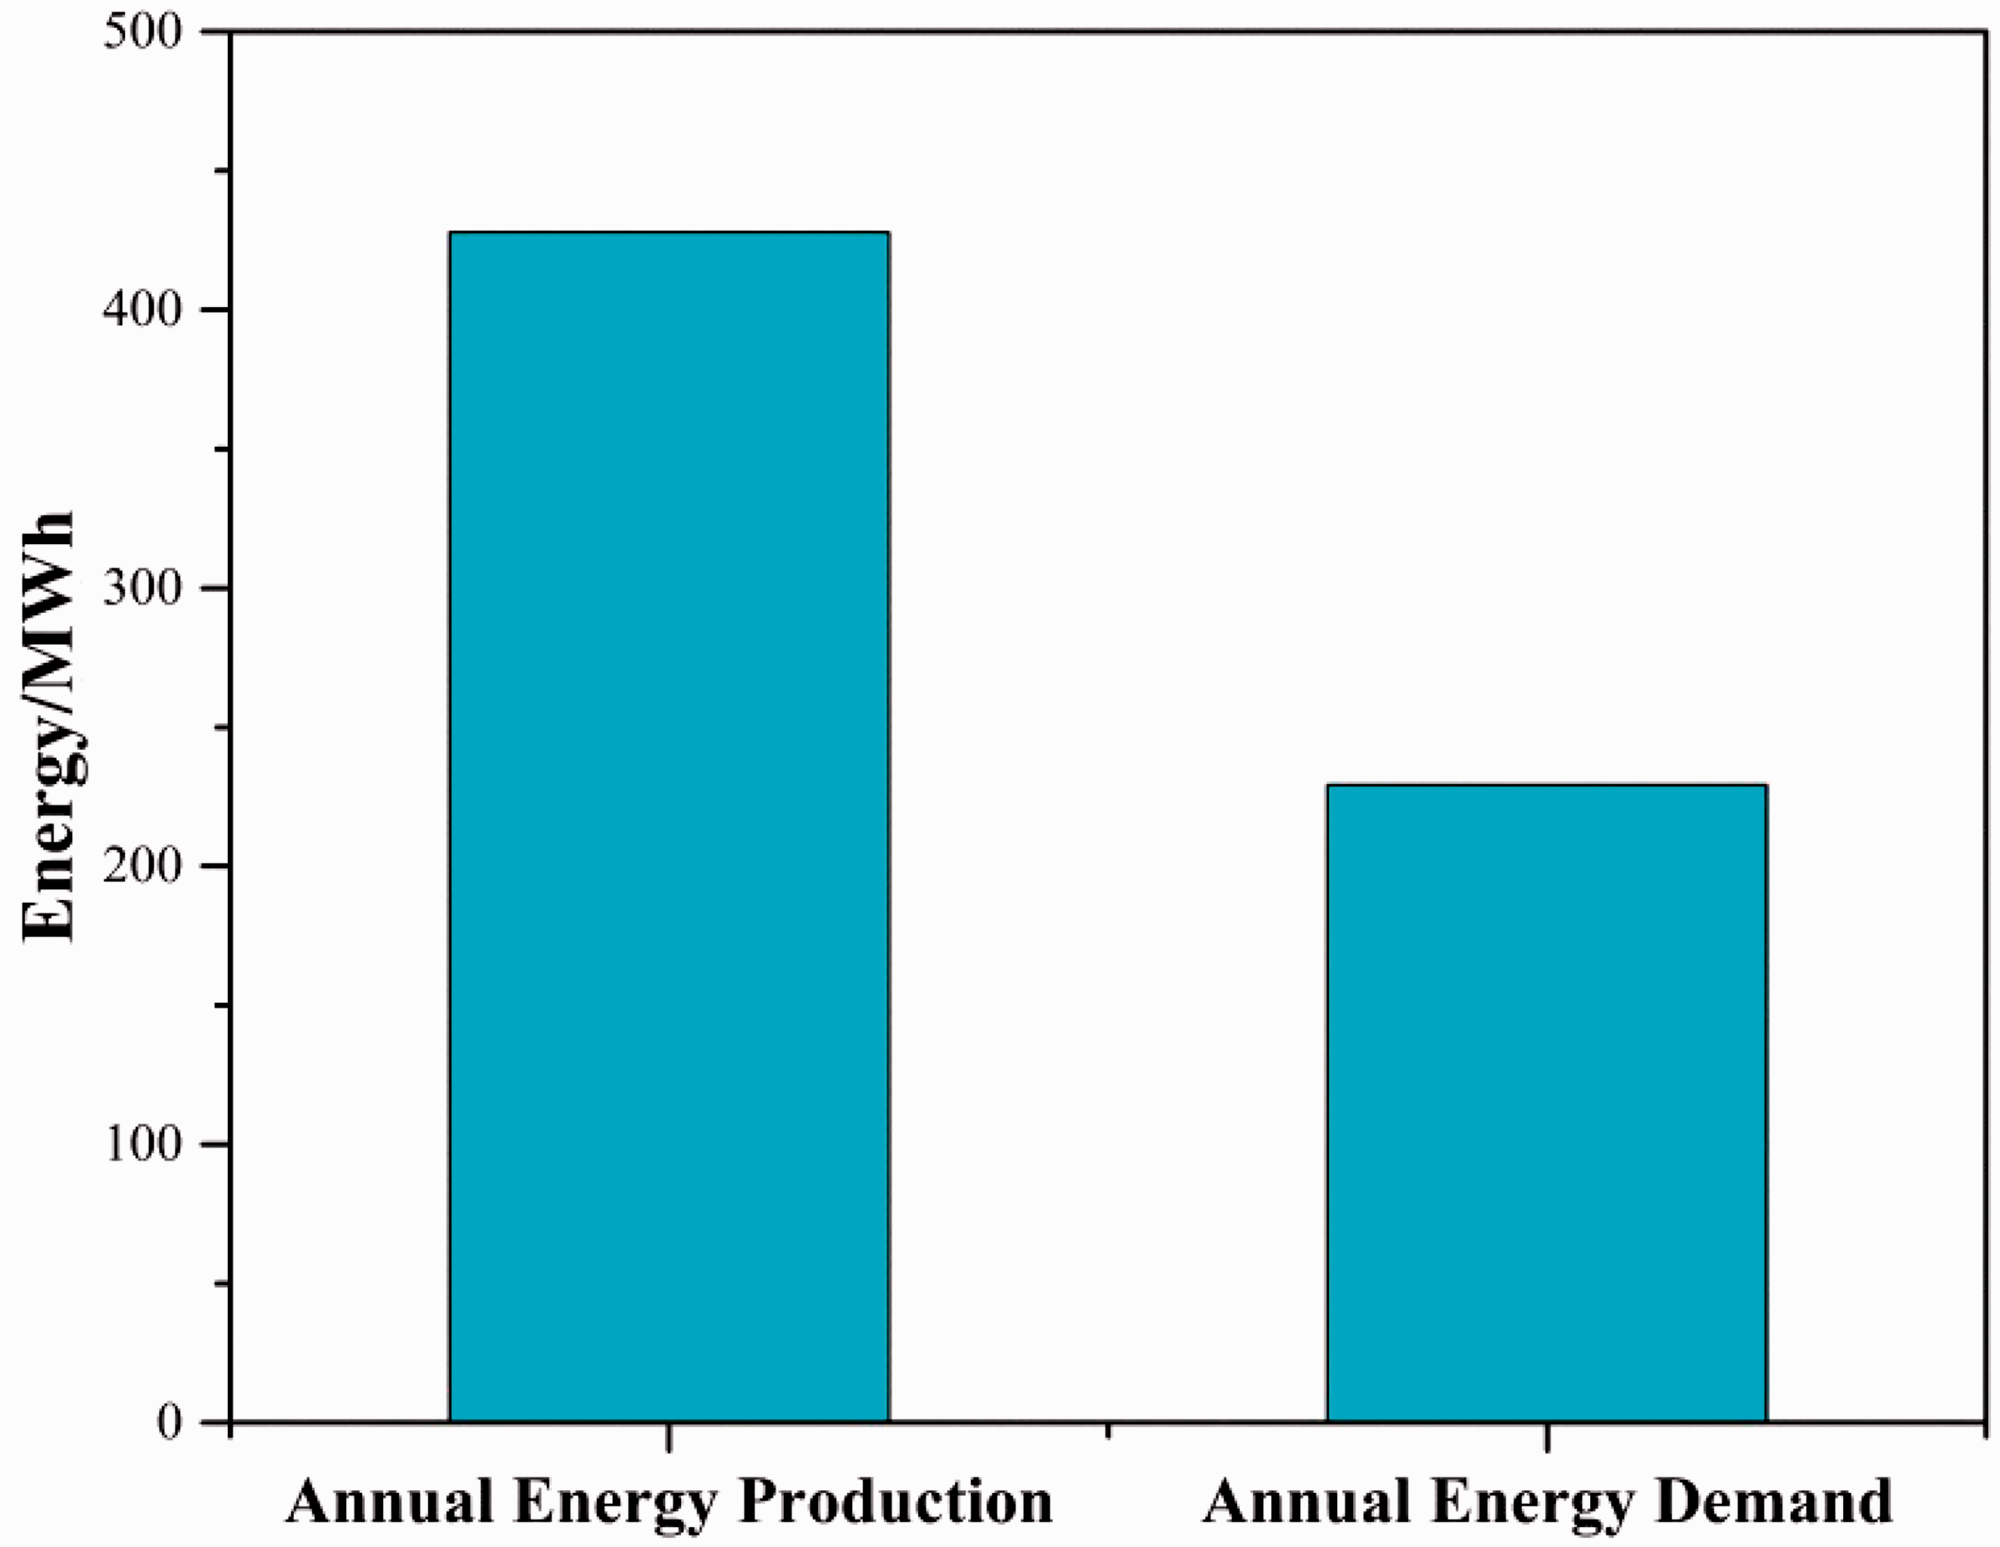
Annual energy budget for the hall at Takoradi Technical University.
Daily energy production and energy demand of the hall are shown in Figure 17. The daily energy production is estimated to be 1.17 MW h and the daily energy demand of the hall is 0.954 MW h. If the hall is to rely solely on the solar PV system, an excess energy of 0.216 MW h can be fed into the grid every day. However, during vacations (normally June, July, August, and December), more energy will be fed to the grid since the hall will not be in operation. The daily peak power of the grid-connected system is 245 kW while the peak demand of the hall is 107.291 kW. The hall normally experiences this peak demand during weekends when there are no lectures. Therefore, in a typical weekend afternoon as the peak demand arises, the grid-connected system can supply power to the utilities, leaving an excess of 137.709 kW that is fed to the grid.
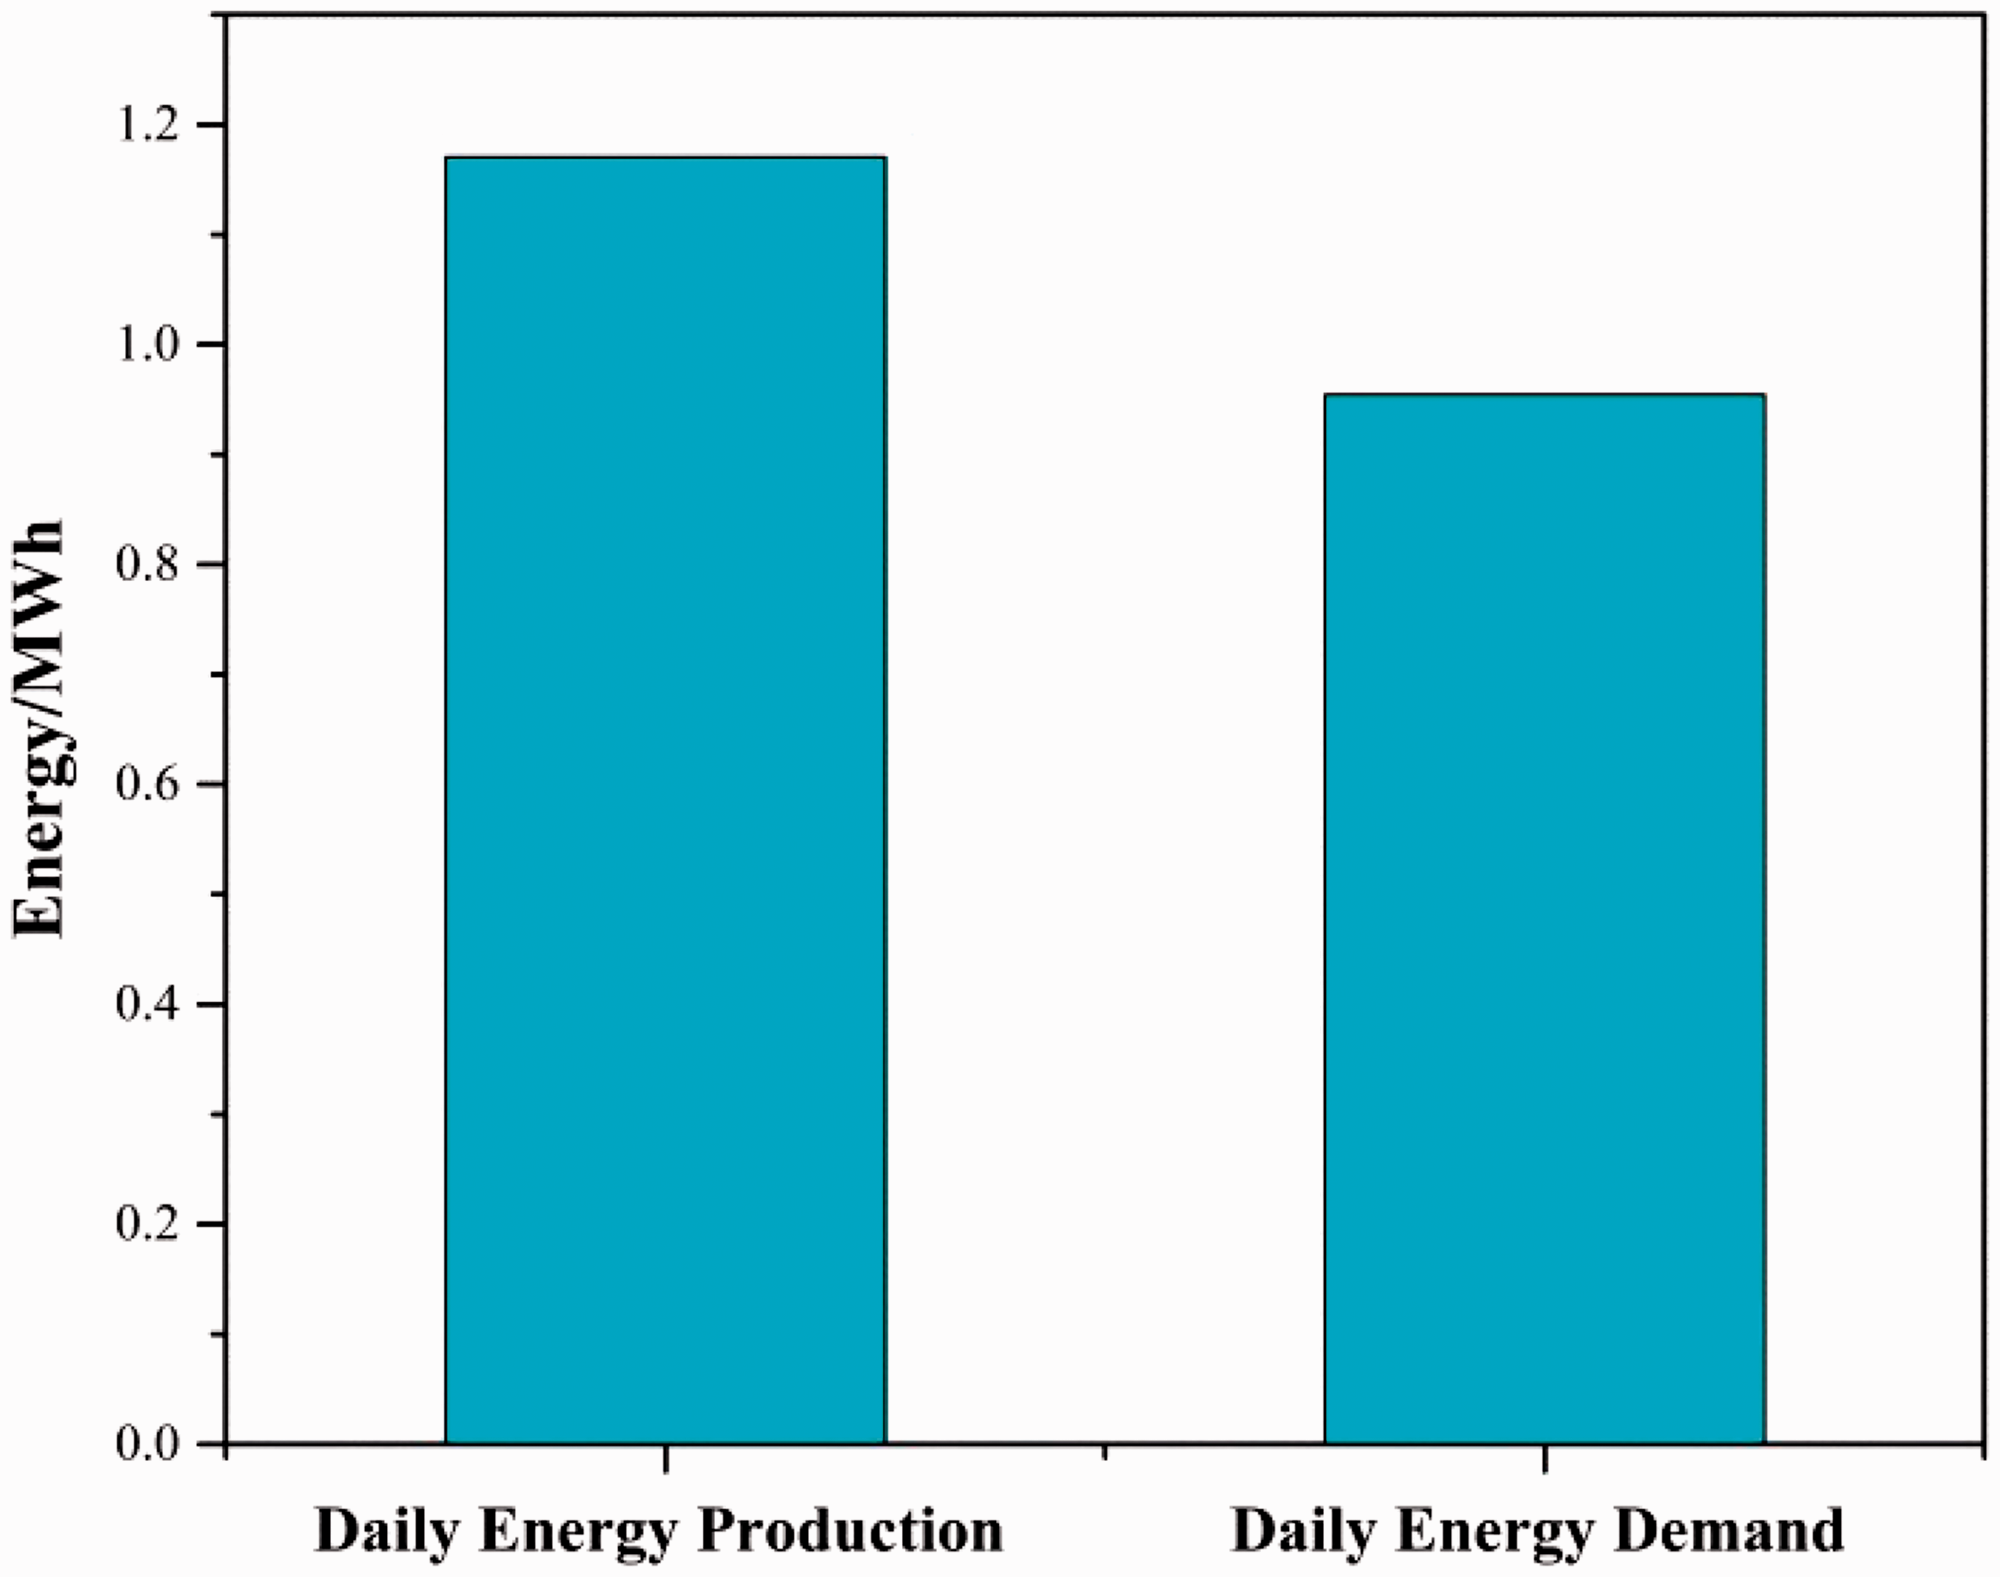
Daily energy production and demand for the hall at Takoradi Technical University.
The performance ratio of the system
The performance ratio of the system is defined as the ratio of the final energy fed to the system to the ideal energy expected


Therefore

The value of the performance ratio is rather high. This means that only 2% of the expected energy is lost mainly due to the inverter.
Effects of external factors
The performance or output of a PV system depends considerably on external factors and environmental condition. As the environmental condition changes, the output varies. Light spectra components, the solar irradiance and the PV temperature are main environmental conditions that affect the solar PV device. Furthermore, ambient temperature, wind speed, and solar radiation impose a nonnegligible effect on the operation performance of the PV modules (Dubey et al., 2013). The current–voltage characteristics of the PV module depend on the insulation and temperature, which is critical for the design of the PV system (Chatterjee et al., 2011). It was proved that the efficiency of solar cell dropped by 0.45% as the PV temperature increased by 1°C (Debra, 2017).
The short circuit current (Isc) is proportional to the solar irradiance, as is seen from equation (16). According to the relationship that short circuit of plant=number of parallel strings × short circuit current of one module


In Figure 18, the measured PV module current is plotted as a function of irradiance. For the irradiance of 1000 W/m2, four short circuit currents, 8.52, 8.42, 8.33, and 8.24 A were selected according to the PV module design principles. The four cases are represented, respectively, by ISC1, ISC2, ISC3, and ISC4 in Figure 18. As irradiation decays, the short circuit current drops linearly, as is common for the four cases. As the irradiance is lowered to 200 W/m2, all the short circuit currents are less than 1.7 A.
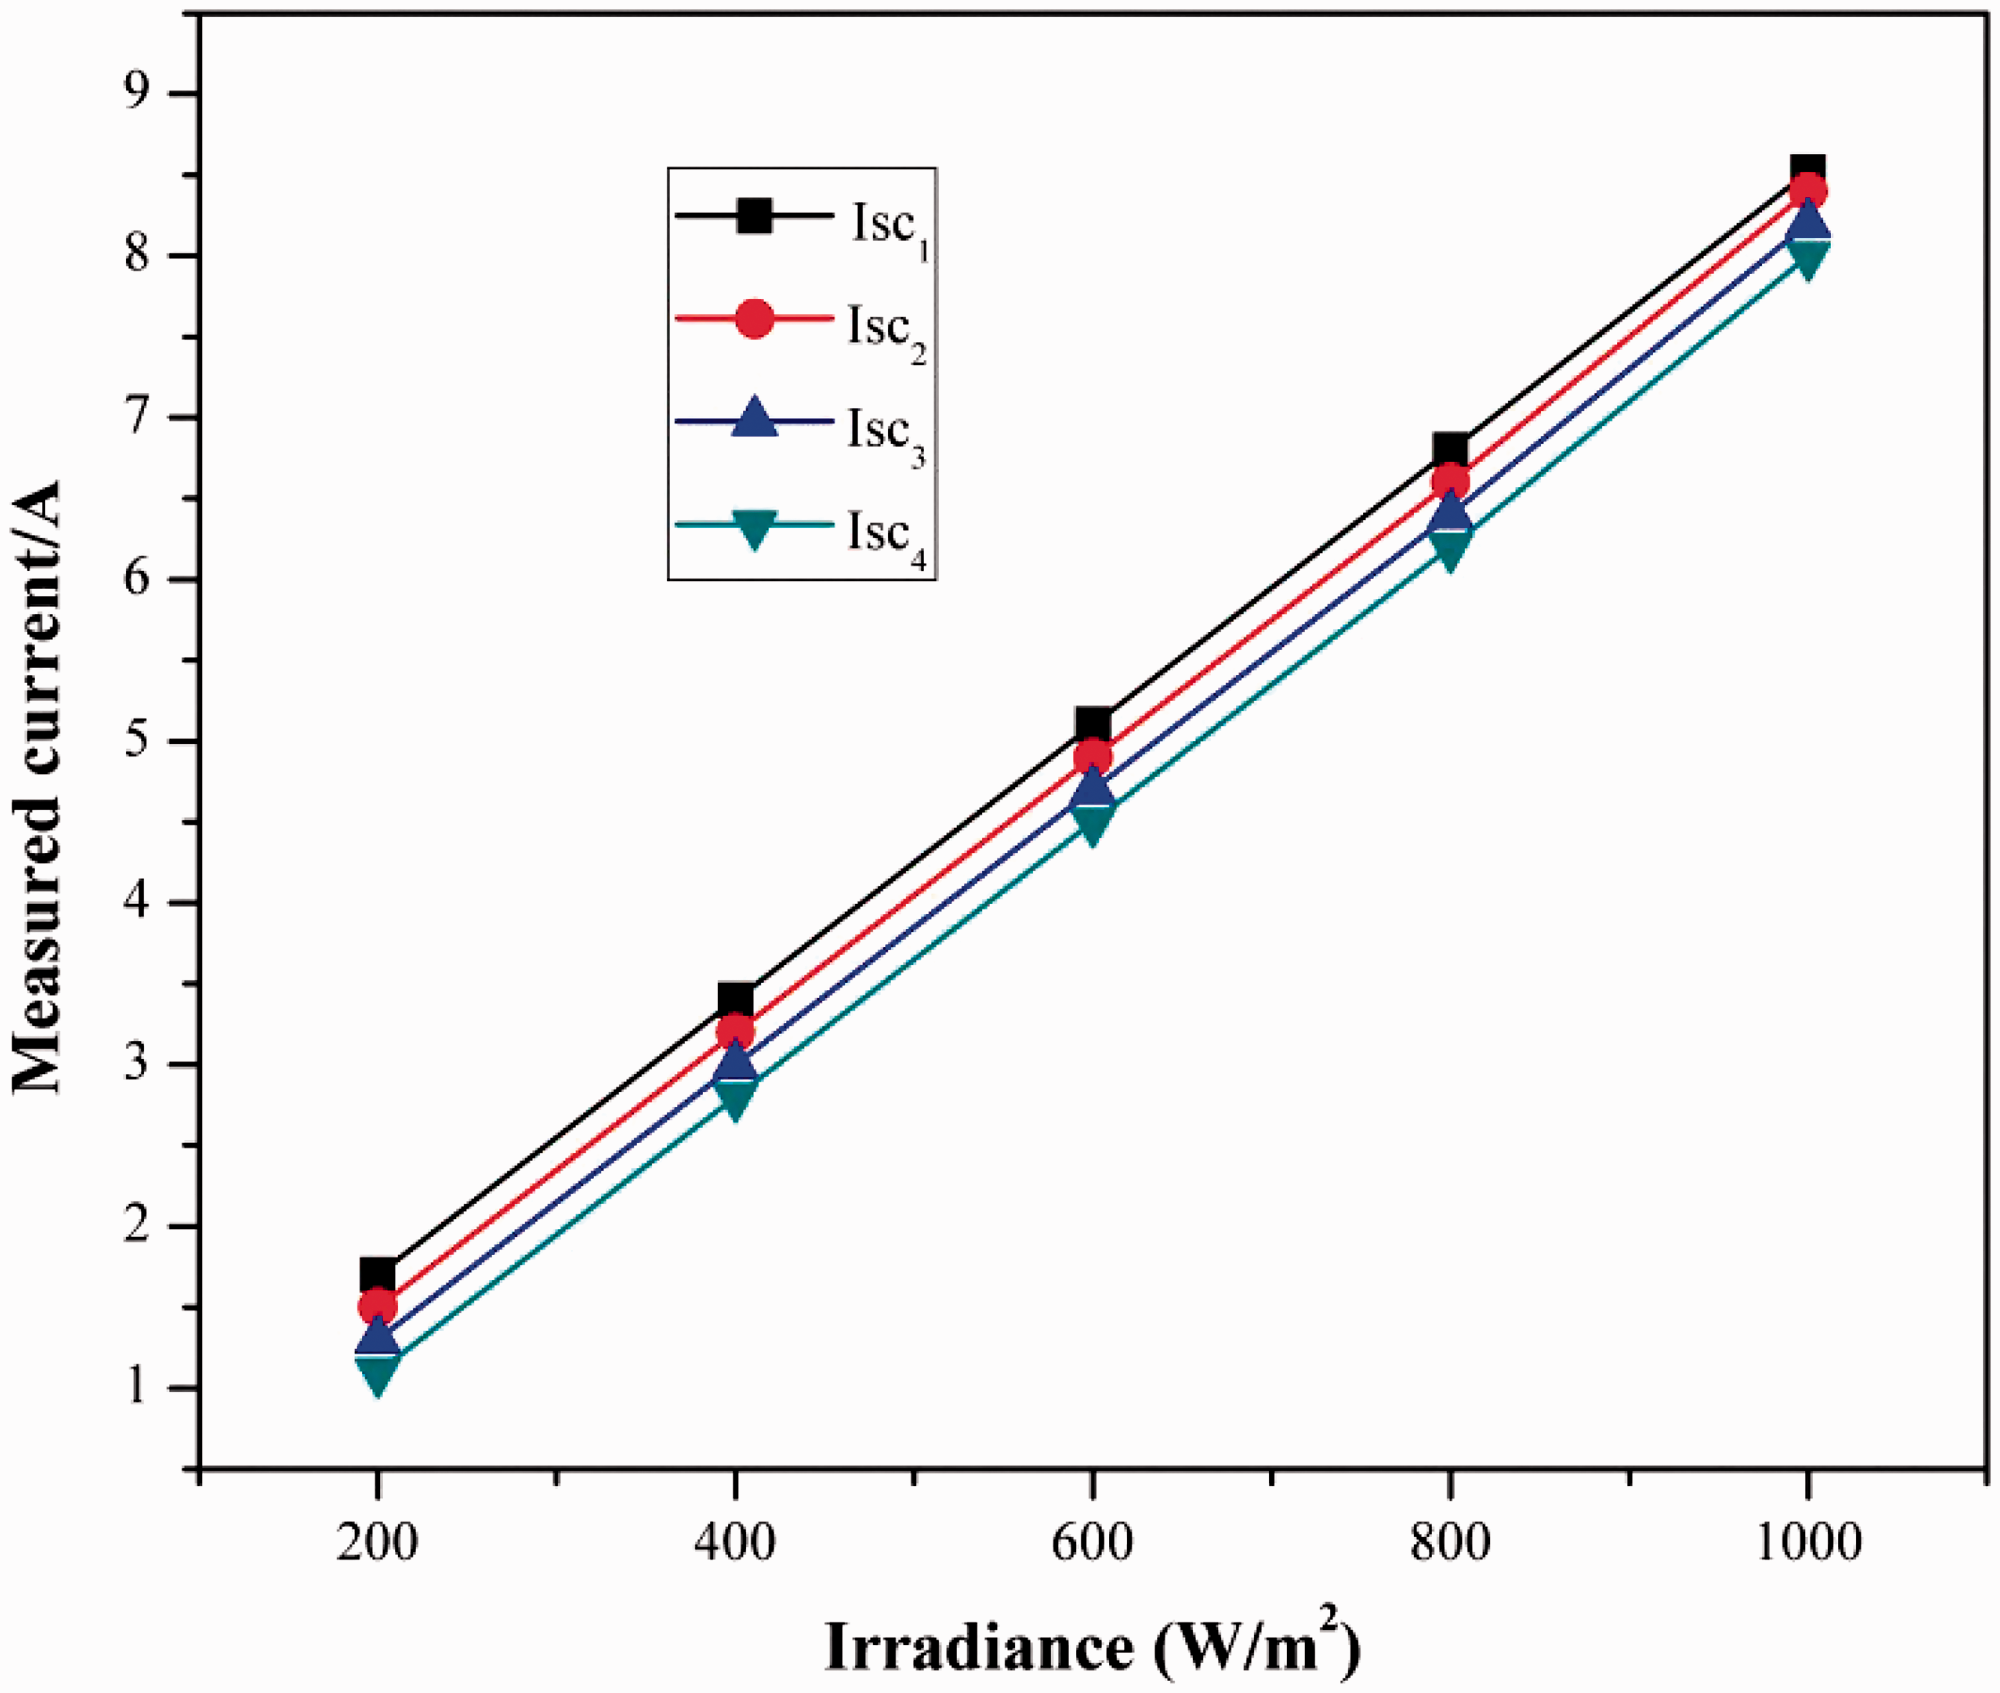
Variations of the measured PV module current with irradiance.
The power output of the solar PV system is related as well to the PV temperature. With the increase in the PV module temperature, the voltage decreases and the current output slightly increases. The change in voltage is proportional to the rise of the PV module temperature. The open-circuit voltage, Voc, depends greatly on the PV module temperature. (Villalva et al., 2009). The relationship between voltage and the PV module temperature is given by

A general expression for the power output of the PV system is given by equation (18). It is witnessed that the power output depends on temperature, irradiance, and other characteristics of the PV module (Villalva et al., 2009)


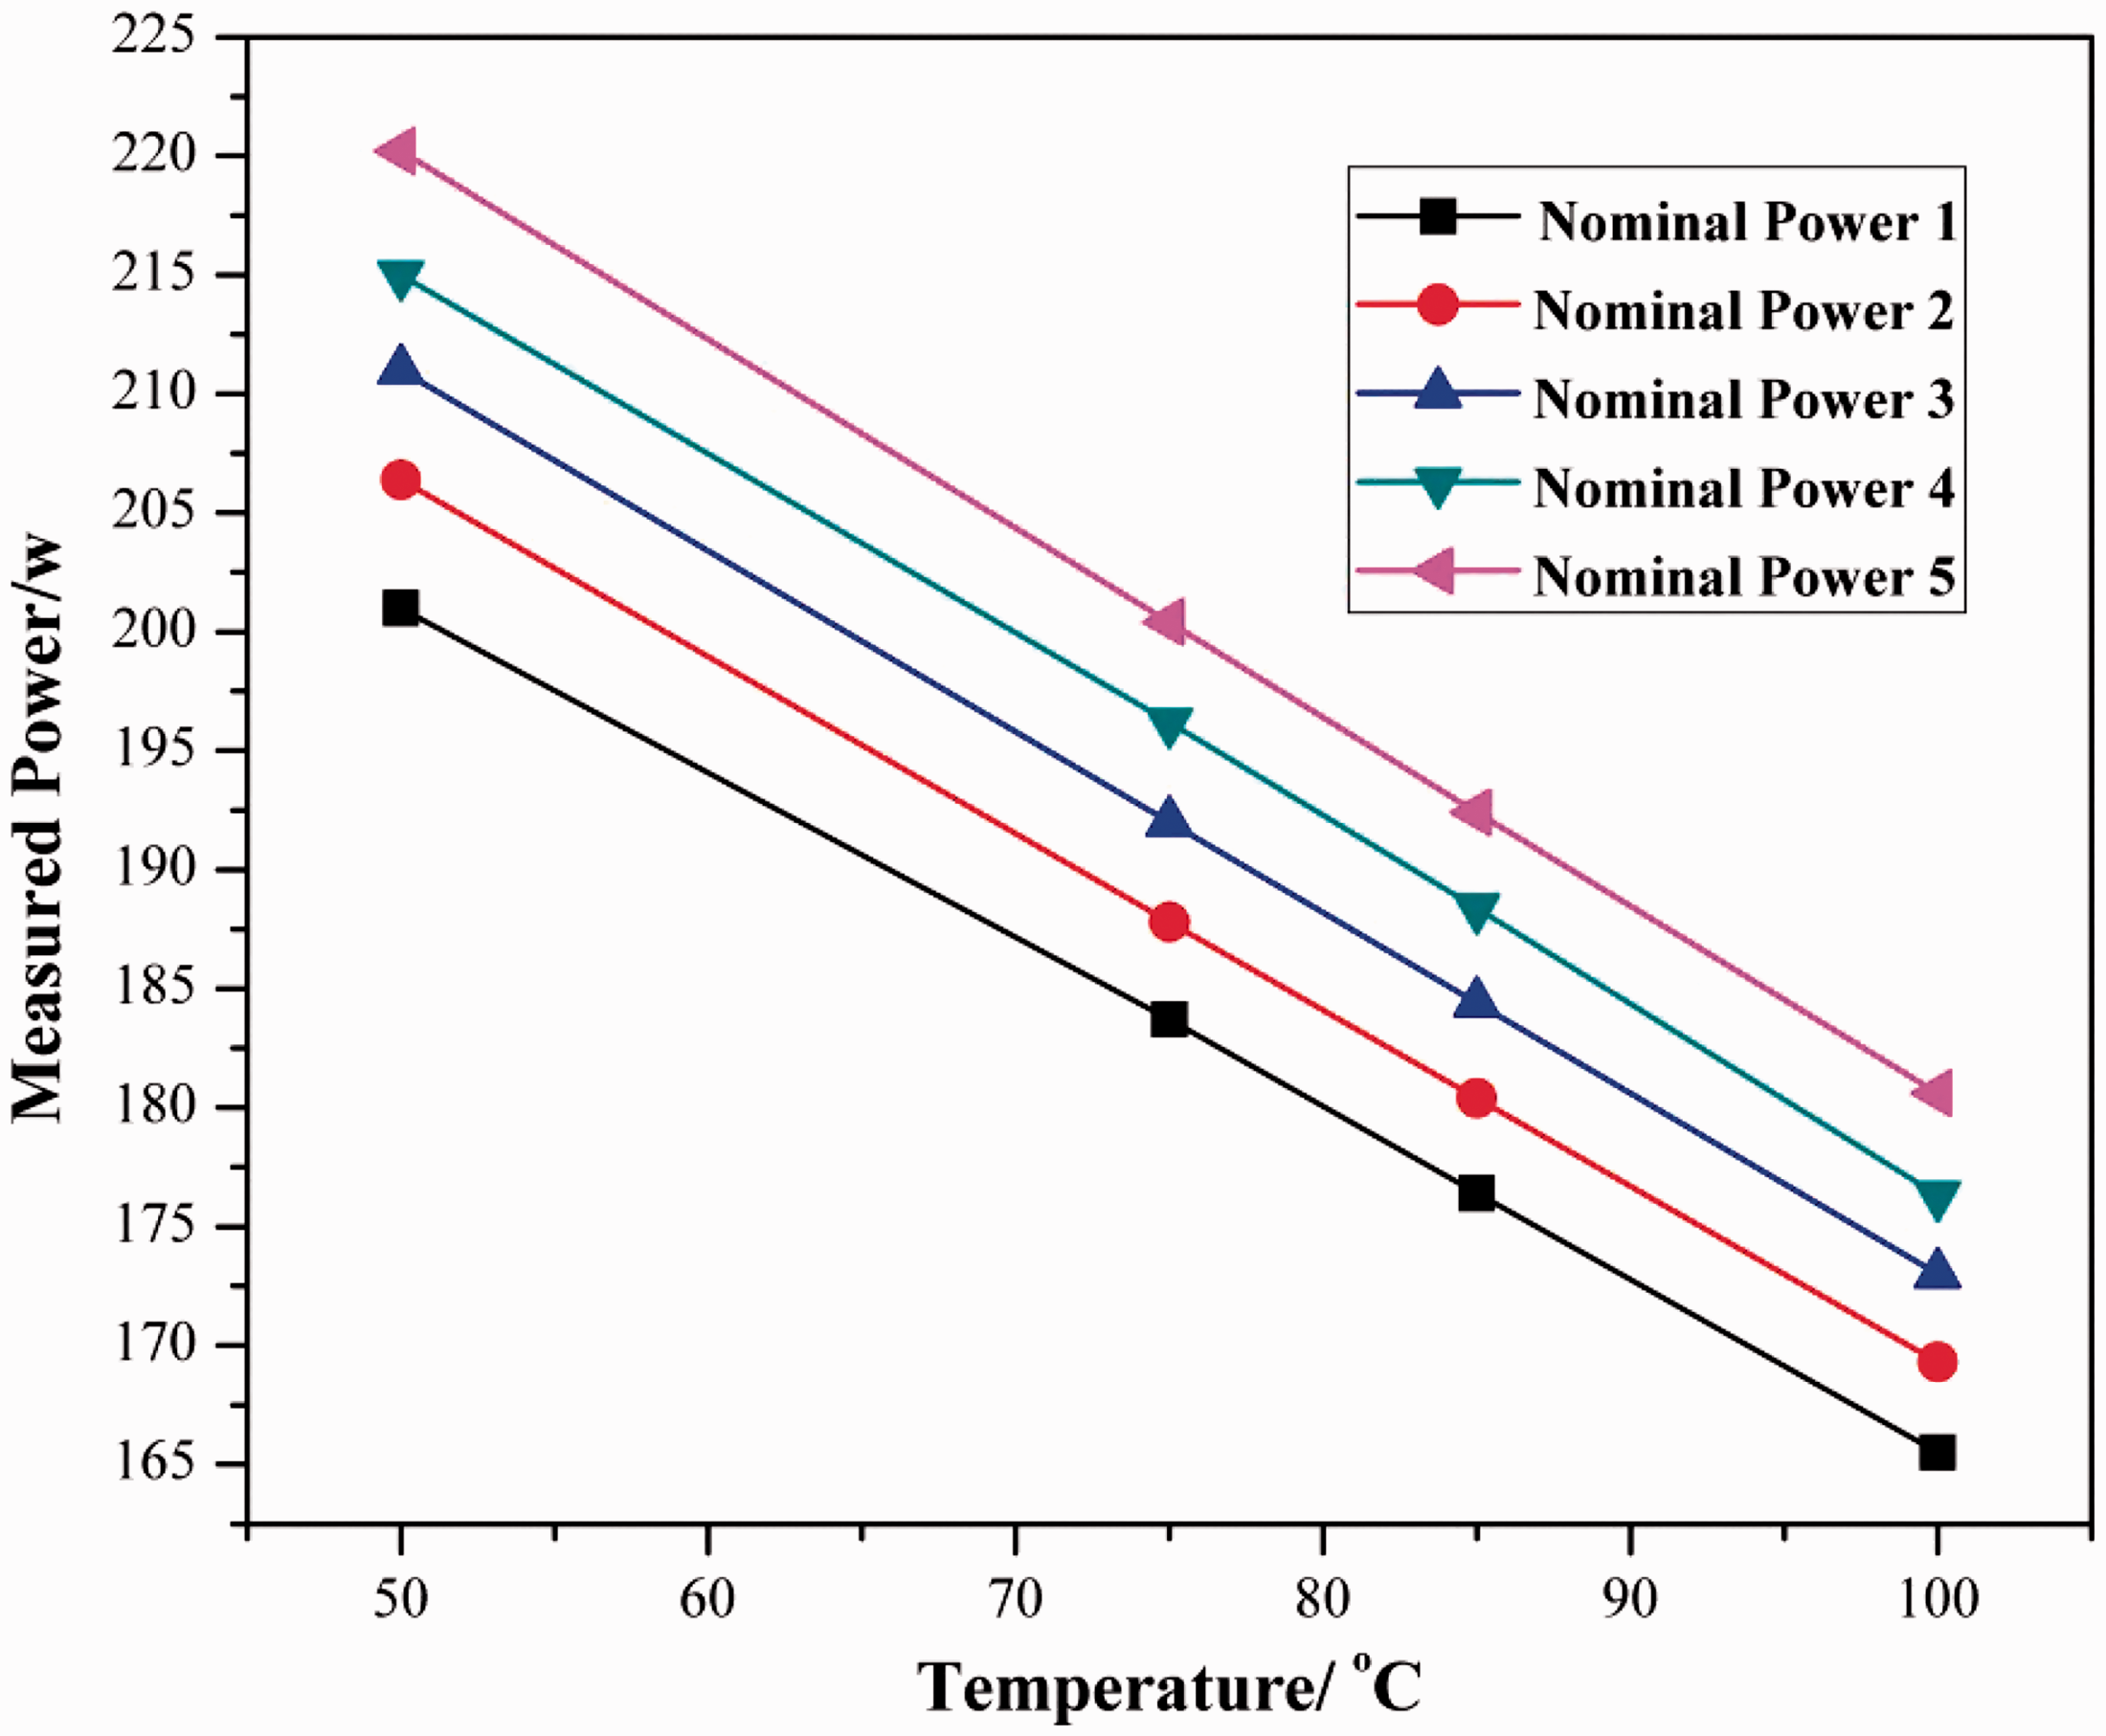
Variation of power output with the PV module temperature.
Conclusions
The emphasis is placed on the combination effects of roof coating and solar PV system and the study is performed based on a hall at Takoradi Technical University of Ghana. A comparison is implemented between numerical results and field data. The advantage of the strategy considered is proved and the effective use of PV modules and the roof coating is proposed. Major conclusions obtained are as follows.
Quantitative simulation results provide proof for higher capability of the coated roof in lowering temperature compared to that of the uncoated roof. Numerical results are in accordance with field data, which manifest temperatures ranging between 20 and 35°C for the uncoated roof while 20–28°C for the coated roof. For the hall considered, the total energy of 427.670 MW h/year can be fed to the grid with the application of the solar energy utilization strategy, even when the hall relies only on the solar energy. For the vacation period, more energy can be fed to the grid with the decline of the energy consumption. The system has a large performance ratio of 0.98. The short circuit current increases linearly with the increase in solar irradiance, which is insensitive to the initial short circuit current. Furthermore, with the rise of the PV module temperature, the power output of the PV system declines with linear tendency.
Footnotes
Declaration of conflicting interests
The author(s) declared no potential conflicts of interest with respect to the research, authorship, and/or publication of this article.
Funding
The author(s) received no financial support for the research, authorship, and/or publication of this article.