
Abstract
Geological prediction models for gas content in marine–terrigenous shale under the effects of reservoir characteristics and in situ geological conditions, were established using methane isothermal adsorption, high temperature/pressure methane isothermal adsorption, total organic carbon, X-ray diffraction, mercury porosimetry, porosity in net confining stress, and field desorption methods. Results indicated that the adsorption capacity of marine–terrigenous shale has a linearly positive correlation with total organic carbon content and maturity. Clay and quartz minerals are the two main components of inorganic minerals in marine–terrigenous shale, with an average content of 54.3% and 36.9%, respectively. Adsorption capacity of marine–terrigenous shale is slightly positive correlated with clay content, while it exponentially decreases with increasing quartz content. The effects of in situ temperature and reservoir pressure on adsorption capacity in marine–terrigenous shale are also significant. The adsorption capacity of marine–terrigenous shale shows a clear decreasing trend as temperature increases, while it increases with increasing reservoir pressure. The porosity of marine–terrigenous shale is characterized by highly stress-sensitive, decreasing exponentially with increasing effective stress, which results in a more complex occurrence of free gas in deep shale reservoirs. In addition, gas saturation for the shale samples was calculated based on the results of field desorption, after which geological prediction models of total gas, adsorbed gas, and free gas were established while considering the coupled effects. Adsorbed gas, free gas, and total gas content all initially increase as burial depth increases, and then eventually decrease. Adsorbed gas content and free gas content have a positive correlation with total organic carbon content and porosity, indicating that the total gas content at different burial depths is mainly controlled by the total organic carbon content and porosity.
Keywords
Introduction
During the past decade, with the advancement of theory and technical degree, shale gas in particular has attracted increasing interest as a self-contained unconventional gas. Development and exploration of shale gas have made significant breakthroughs in China following the rapid development of the shale gas industry in the United States (Chalmers et al., 2018; Curtis, 2002; Loucks et al., 2009; Ross and Bustin, 2018). There are three types organic-rich shale that are formed in the different depositional environments that serve as shale gas reservoirs in China: marine shale, marine–terrigenous shale, and terrigenous shale. China has made breakthrough discoveries of shale gas reserves in these three types of shale gas in several regions, especially in marine shale (Nie and Zhang, 2011; Zou et al., 2010). Marine–terrigenous shale gas is characterized by a rich resource and widely distributed in China (Tang et al., 2016), especially in the marine–terrigenous strata that were deposited during the Carboniferous–Permian. In addition, marine–terrigenous shale gas mainly developed in the coal measure, also known as coal-measure shale gas, and the shale layer, coal seam, and sandstone layer of coal-measure are found in a vertical, multilevel superposition (Hou et al., 2018; Li et al., 2016). The joint exploration and development of coal-measure shale gas, coalbed methane, and tight-sandstone gas (three natural gas) are considered to be an effective way of improving the production of unconventional gas resources contained in coal measure (Hou et al., 2017; Qin et al., 2016). At present, the Ordos Basin and Qinshui Basin in China are gradually establishing demonstration areas of co-exploration for the three natural gas (Hou et al., 2018; Li et al., 2018; Liang et al., 2016; Meng et al., 2016; Qin et al., 2016), so accurate predict gas content in marine–terrigenous shale has great significance for this process.
The gas contained in shale reservoirs usually exists in three states: adsorbed gas, free gas, and dissolved gas, mainly in relation to free gas, adsorbed gas, or slightly dissolved gas (Xue et al., 2015). Free gas is found in pores and fractures, and adsorbed gas is adsorbed on the pore surface of shale reservoirs with an average content of 20–85% (Curtis, 2002; Hao et al., 2013; Hill et al., 2007). Gas content and its state vary widely based on the reservoir characteristics and in situ geological conditions (Tang et al., 2016). The factors that primarily control gas content in shale reservoirs are both intrinsic and exogenous. Intrinsic factors refer to the effects of reservoir characteristics on gas content in shale reservoirs; exogenous factors are the result of geological conditions, such as temperature, reservoir pressure, gas saturation, and stress states on the gas content in shale reservoirs (Li et al., 2016). Much research has been undertaken to determine the factors of influence for gas content in shale reservoirs: geochemical characteristics are the key factors that influence the gas content, and the adsorption capacity of shale reservoirs has a linear positive correlation with total organic carbon (TOC) and maturity (Gasparik et al., 2013; Han et al., 2016; Jarvie et al., 2007; Ross and Bustin, 2009; Weniger et al., 2010), owing to abundant organic material and larger internal surface areas that provide greater storage space for adsorbed gas with high TOC and maturity (Han et al., 2016; Jarvie et al., 2007; Li et al., 2016; Mastalerz et al., 2013). In addition, mineral composition has significant effects on the gas content in shale reservoirs, and quartz has a negative effect on the adsorption capacity (Han et al., 2016). Pores are well developed in clay minerals with higher surface areas, increasing the adsorption capacity of shale reservoirs (Zhang et al., 2014), but they are hydrophilic and in conditions of high water saturation, the surface area of clay minerals may contain water molecules, which limits the adsorption capacity (Ross and Bustin, 2008; Zhang et al., 2014). The adsorption capacities of various kerogen types were found to be in the order of type I < type II < type III (Chalmers and Bustin, 2007; Zhang et al., 2014). The effects of in situ temperature and reservoir pressure on the adsorption capacity were also significant. Adsorption capacity decreasing with increasing temperature, while the opposite effect was the case with reservoir pressure (Han et al., 2016; Li et al., 2016; Rexer et al., 2013). Free gas content is mainly controlled by in situ temperature and reservoir pressure, water saturation, and matrix porosity, and shows positive correlations with reservoir pressure and matrix porosity, while negative correlations are observed with temperature and water saturation (Li et al., 2016). Previous studies on the gas content in shale reservoirs have mainly been focused on adsorbed gas content, and several models have been proposed to quantitatively predict gas content (Gasparik et al., 2013; Jarvie et al., 2007; Ross and Bustin, 2009). There is a considerable amount of free gas content in shale reservoirs, which have a significant impact on the evaluation of shale gas accumulation, so it is very important to accurately evaluate this. At present, the standard gas law and the assumption of a certain matrix porosity is most commonly used to evaluate the free gas content under different reservoir pressure and temperature conditions (Han et al., 2016; Li et al., 2016; Liu et al., 2016). However, matrix porosity shows a significant attenuation with increasing burial depth, resulting in an inaccurate prediction of free gas content in deep shale reservoirs. Several previous studies have revealed the characteristics of marine–terrigenous shale (Liu et al., 2015; Sun et al., 2017; Tang et al., 2016; Yan et al., 2017). Few studies have investigated occurrence regularity of gas content in marine–terrigenous shale based on reservoir characteristics and in-situ geological conditions (Dang et al., 2016; Liu et al., 2016; Tang et al., 2016). The aim of this study is to propose reasonable geological prediction models under the coupled effects for accurate evaluating gas content in marine–terrigenous shale.
Materials and methods
Geological setting and samples
Qinshui Basin is located on the Taihang and Lvliang uplift belts, and was formed after the upper Paleozoic coal-forming period. Qinshui Basin has an North North-East (NNE) monoclinic pattern and a moderate degree of tectonic complexity. The strata are angled toward the northwest at an angle of 5°–10° (Liu et al., 2015). From the bottom to the top, the strata in the Southern Qinshui Basin include Shangmajiagou and Fengfeng formations of the Ordovician, Benxi formation of the Carboniferous, Taiyuan formation of the upper Carboniferous lower Permian, Shanxi, Xiashihezi and Shiqianfeng formations of the Permian, and Liujiagou formation of the Triassic. The Taiyuan and Shanxi formations create favorable shale reservoirs with burial depths ranging between 500 m and 3000 m. A total of 33 samples of marine–terrigenous shale from the Carboniferous–Permian strata were collected from 11 wells, including eight exploration wells and three parameter wells in the Southern Qinshui Basin (Figure 1). In order to obtain the reservoir characteristics of the shale samples, shale samples were performed methane isothermal adsorption, TOC content, vitrinite reflectance (Ro), X-ray diffraction (XRD), mercury porosimetry, high temperature/pressure, and porosity in net confining stress experiments. In addition, another six shale samples from the well ZK were first performed the field desorption experiments, followed by the TOC content, Ro, XRD and mercury porosimetry experiments.
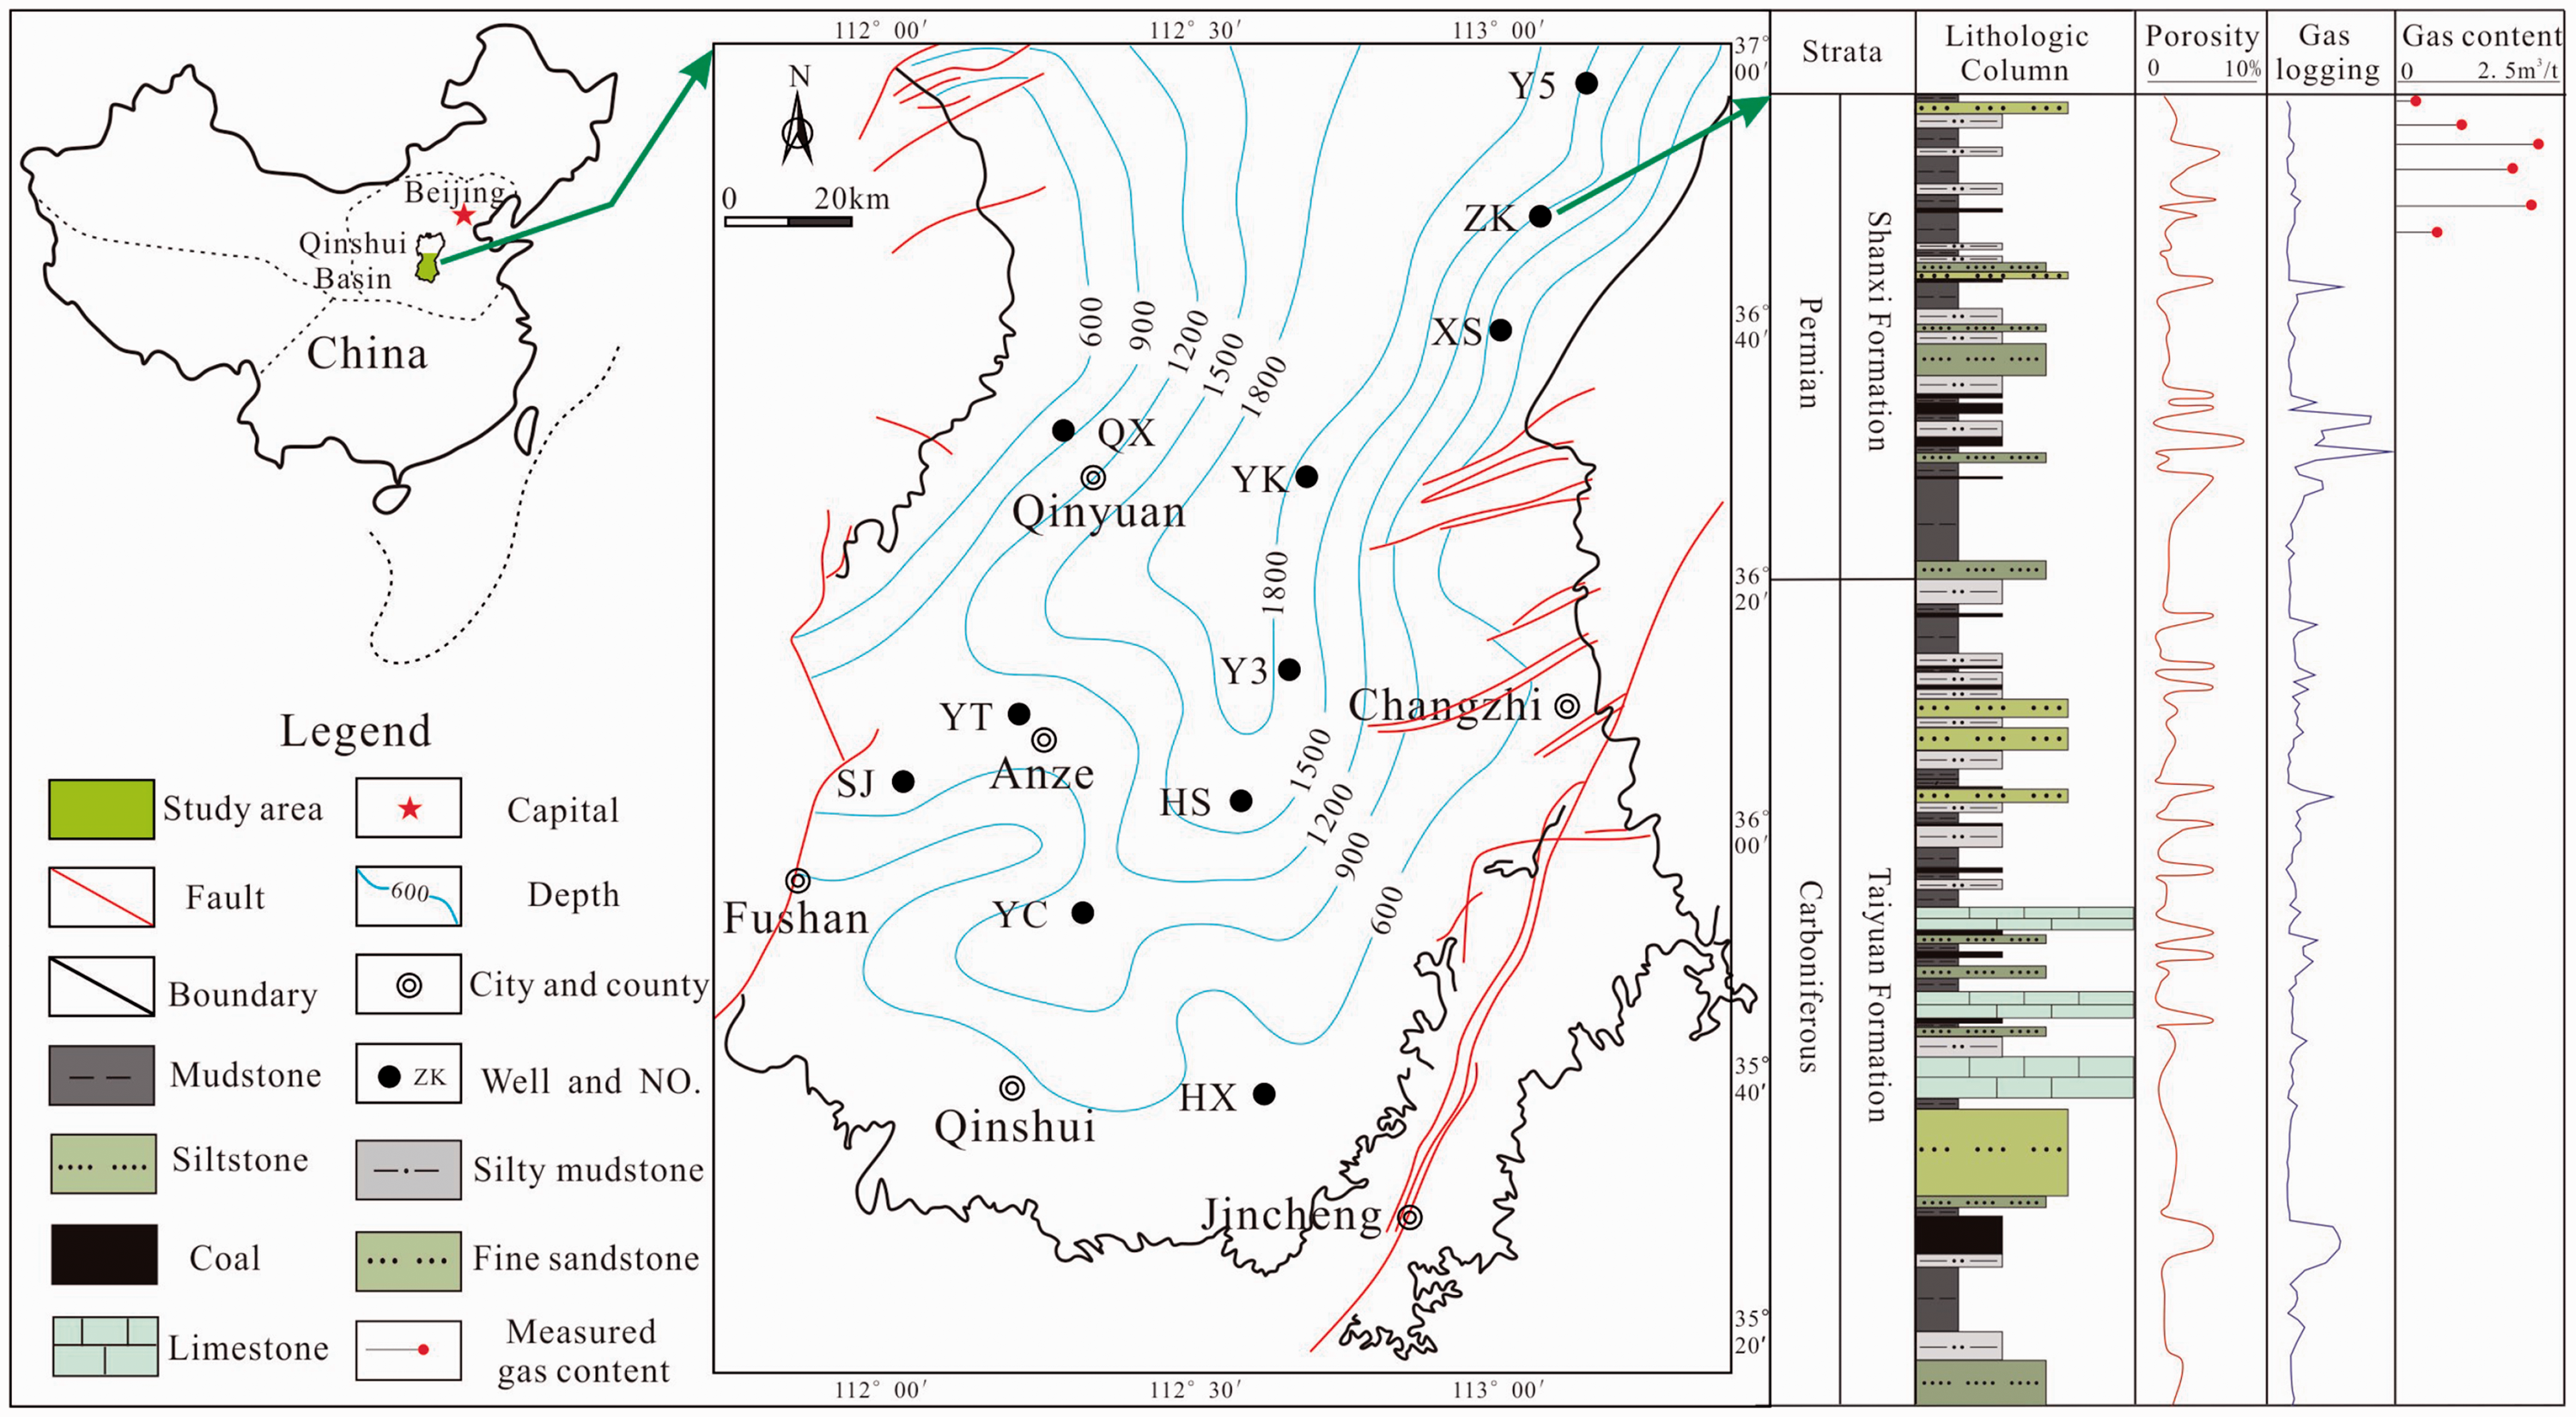
Sampling locations and geological setting of the Southern Qinshui Basin.
Methods
Field desorption
The field desorption experiments were measured using an H-Sorb 2600T shale gas analyzer. First, the samples were cleaned thoroughly and weighed before being placed in the analytical tank. Then, a thermostat water bath was introduced and the temperature was adjusted to be close to the in situ reservoir temperature. The gas volume was recorded every 5 min from the start of desorption phase, and after 2 h it was recorded every 10 min until the gas volume remained basically unchanged. According to the results of the desorbed gas content and residual gas content, the total gas content of each sample was calculated through a nonlinear regression.
Isothermal adsorption experiments
The isothermal adsorption experiments for shale samples were performed at the Key Laboratory of Coalbed Methane Resources and Reservoir Formation Process, Ministry of Education, China University of Mining and Technology. The instrument that was used was an IS-300, which measures the adsorbed gas volume under the different pressure points at a certain temperature. The samples used to measure isothermal adsorption were pressed through 60–80 mesh. Then 100 g samples were weighed and placed beneath saturated salt solutions of K2SO4 to ensure that the relative humidity was maintained between 97% and 98%. The maximum pressure for the experiments was adjusted to be 25 MPa at 30°C. The adsorbed durations at each pressure point were maintained for more than 12 h to ensure that the methane was completely adsorbed into the surface areas of the samples. These measurements followed the Langmuir isotherm model.
The high temperature/pressure methane isothermal adsorption experiments were performed at the Jiangsu Design Institute of Geology for Mineral Resources. The instrument that was utilized was a Core Lab/Temco GAI-100, which measures the adsorbed gas volume under the high temperature/pressure conditions. Before the experiments, samples were pressed through 60–80 mesh. Then 80–100 g samples were weighed for the adsorption experiment. The maximum pressure and temperature for the experiments were set at 25 MPa and 60°C, respectively. Results from the experiments were obtained for four temperature values (30°C, 40°C, 50°C, and 60°C) at the different pressure points. The adsorbed durations at each pressure point would be maintained for more than 12 h to ensure that the methane was completely adsorbed into the surface areas of the samples. These measurements followed the Langmuir isotherm model.
TOC content and XRD experiments
The TOC content of shale samples were analyzed at the Key Laboratory of Coalbed Methane Resources and Reservoir Formation Process, Ministry of Education, China University of Mining and Technology. The instrument that was utilized was a Leco CS-230. Before the experiment, the samples used for the TOC experiment were pressed through 80 mesh. Samples of 1–2 g were weighed and subjected to a specific acid treatment. Then they were dried for 12 h at 78°C.
The XRD experiments were performed at the Experimental Research Center of East China Branch, SINOPEC. A RIGAKU D/Max-3B was used. Before the experiment, samples were pressed through 200 mesh. Particle samples of 10 g were weighed to conduct the experiments. The data were obtained in the 2θ range of 5−80° at steps of 0.002°.
Mercury porosimetry experiments
The mercury porosimetry experiments were performed at the Key Laboratory of Coalbed Methane Resources and Reservoir Formation Process, Ministry of Education, China University of Mining and Technology. The instrument used was an Auto Pore IV 9500, with a maximum applied pressure of 60,000 psi (413 MPa). The instrument can be used to measure pores ranging in size from 3 nm to 100 µm. The samples used for the mercury porosimetry experiment were processed into units of about 1 cm3. Before the experiment, the samples were first dried for 12 h at 70–80°C. During the experiment, the pressure was increased from 0.01 to 413 MPa for the mercury intrusion phase, and then gradually decreased for the mercury ejection phase. The equilibrium times of the low- and high-pressure stages were both 5 s.
Porosity in net confining stress experiments
Porosity in net confining stress experiments were performed at the China University of Petroleum, Beijing. The instrument used was a Coretest AP-608. This instrument can be used to measure matrix porosity >0.1%. The shale samples were first sorted into lithologic columns with a diameter of 2.5 cm and a length of 5.0 cm. The top and bottom of each surface was polished to obtain parallel ends, and then stored in the experimental instrument. The porosity data for the samples were obtained under a constant inlet pressure, with varying confining pressure. Each pressure point was maintained for more than 30 min.
Results
Geochemical characteristics
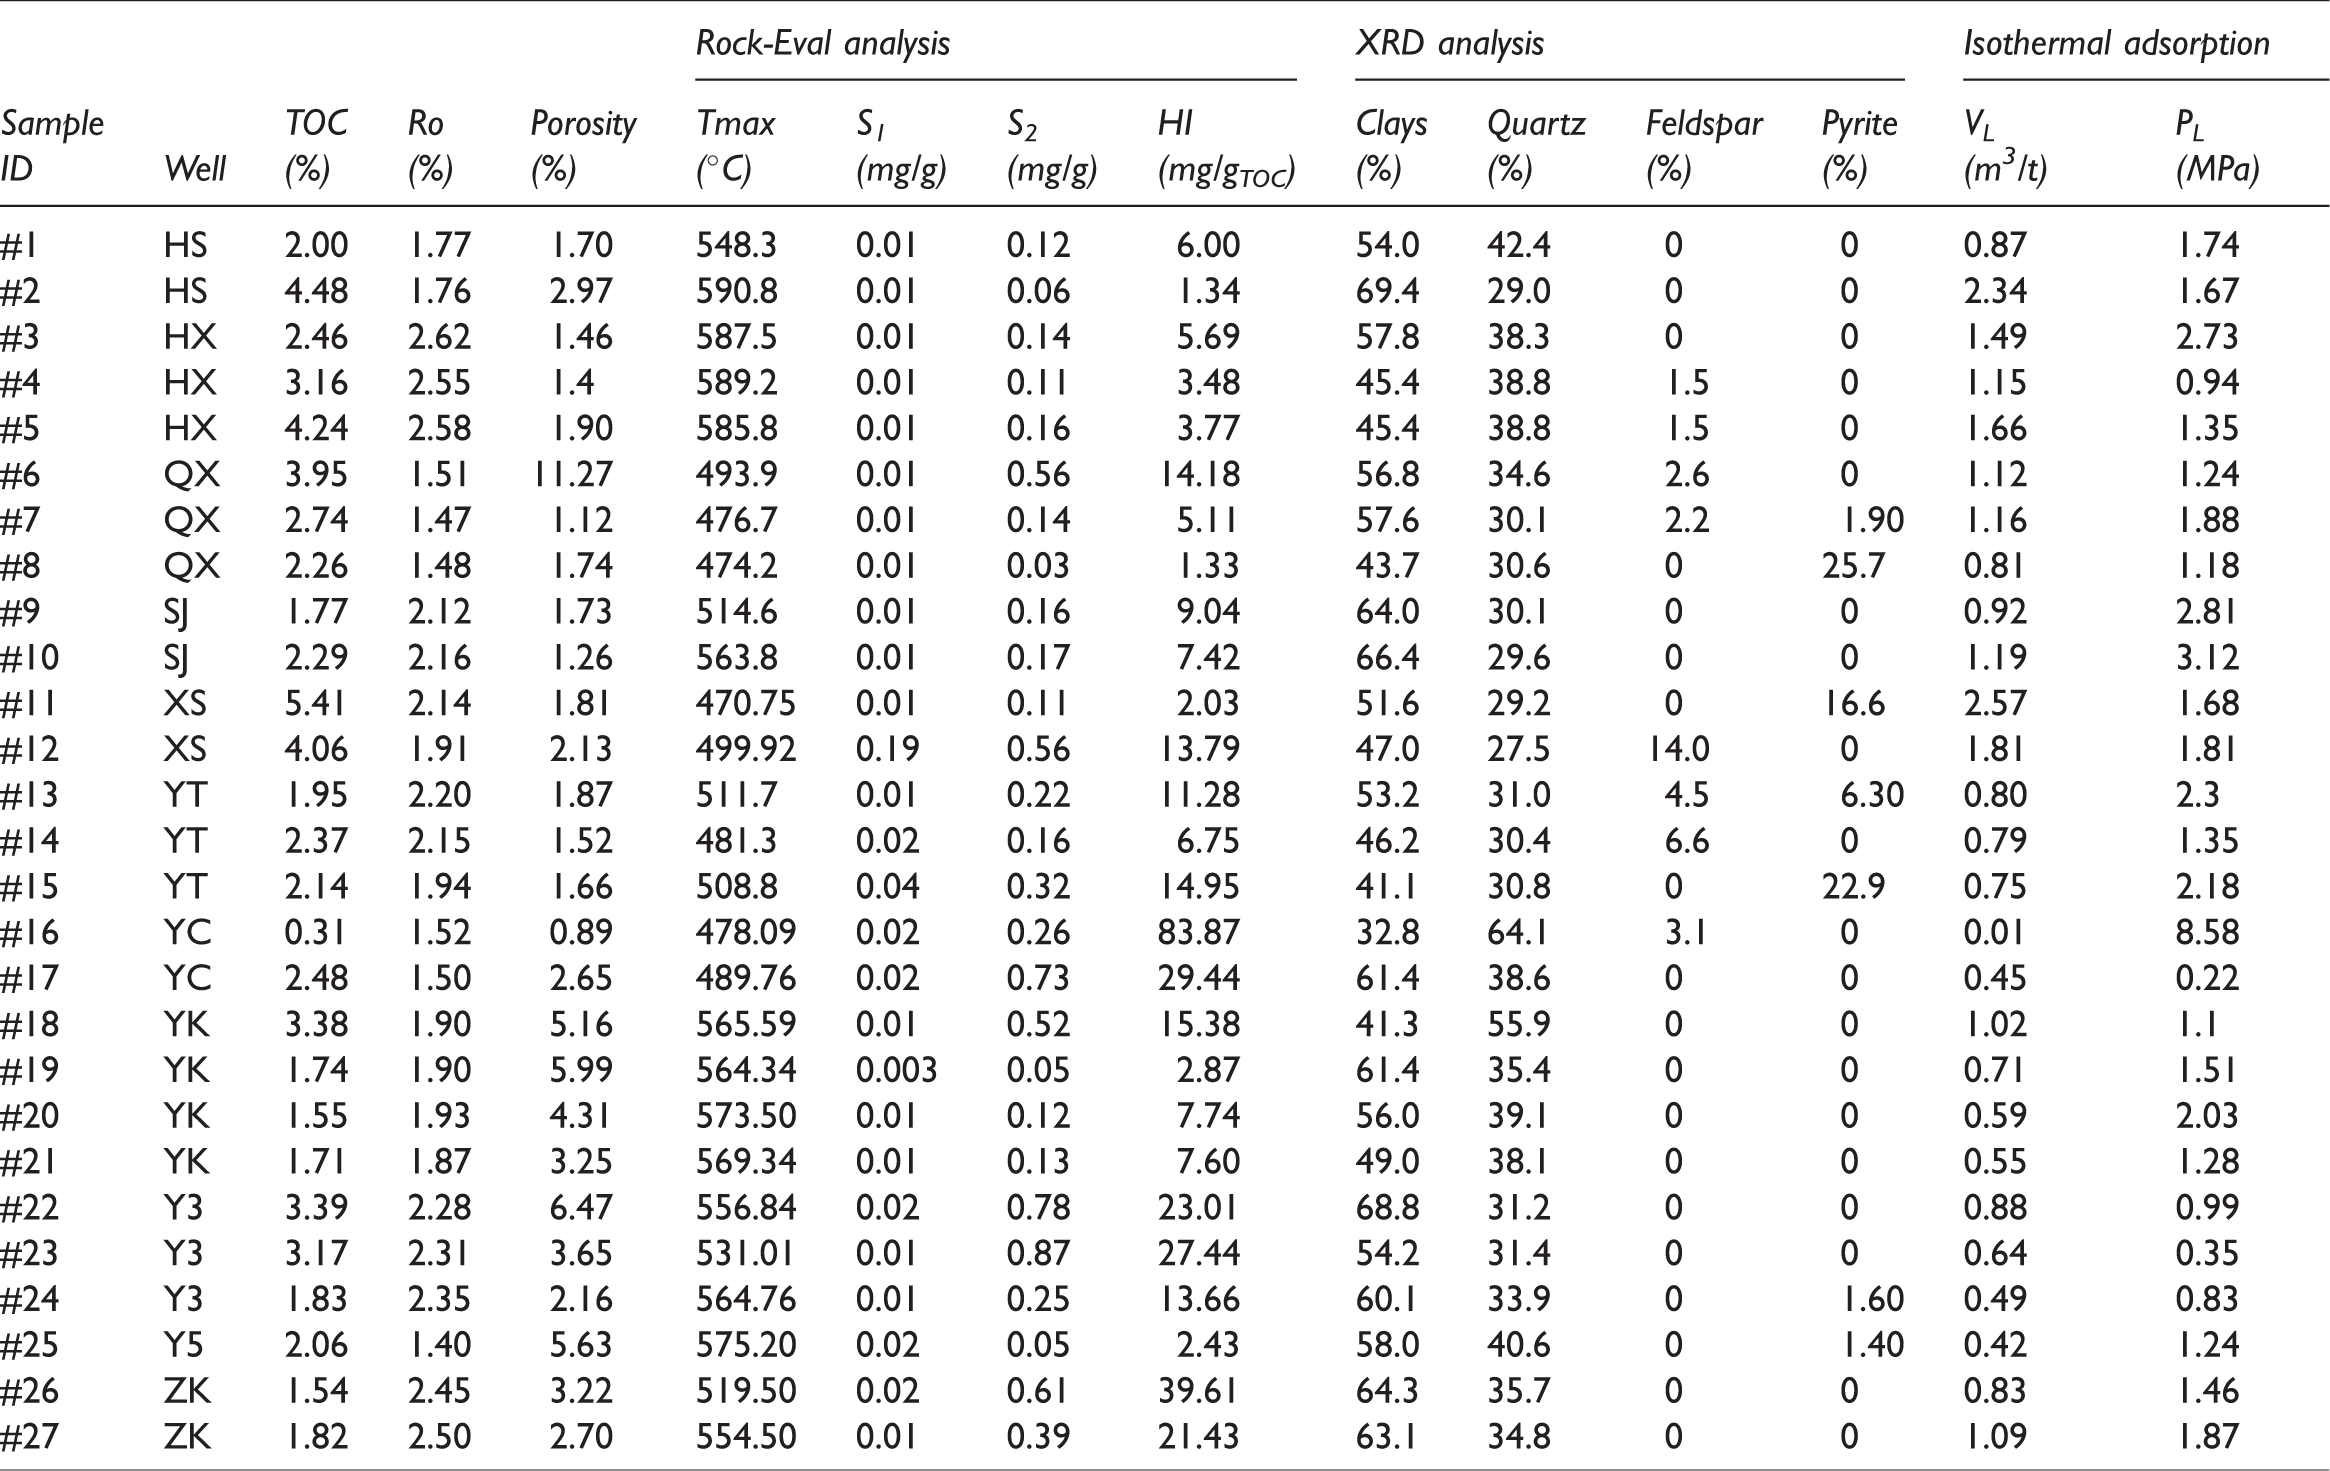
The geochemical characteristics of the shale samples are listed in Tables 1 and 2. The TOC contents range between 0.31% and 6.30%, with an average of 2.55%, and are primarily distributed across the range of 1–4.0%, accounting for 72.72% of the samples (Figure 2). The Rock-Eval results showed that the soluble gaseous hydrocarbon (S1) and pyrolysis hydrocarbon (S2) values range from 0.003 to 0.19 mg/g (with an average value of 0.02 mg/g) and 0.03–0.87 mg/g (with an average value of 0.29 mg/g), respectively. The hydrocarbon generating potential (S1 + S2) accounted for 0.03–0.88 mg/g. The hydrogen index (HI) ranges between 1.34 and 83.87 mg/g TOC, with an average value of 14.10 mg/g TOC. The relationship between HI and Tmax indicates that the organic matter of the shale samples is type III kerogen (Figure 3). The Rock-Eval Tmax values range from 470.75°C to 590.8°C, with an average of 534.80°C. The Ro values range from 1.4% to 2.62% with an average of 2.01%, indicating that the shale samples are mainly of mature and highly mature grade levels.
Properties of samples (sampling locations, total organic carbon (TOC), Ro, porosities, Rock-Eval analysis, X-ray diffraction (XRD) analysis, adsorption capacity).
Measured total gas content and calculated gas saturation of shale samples.
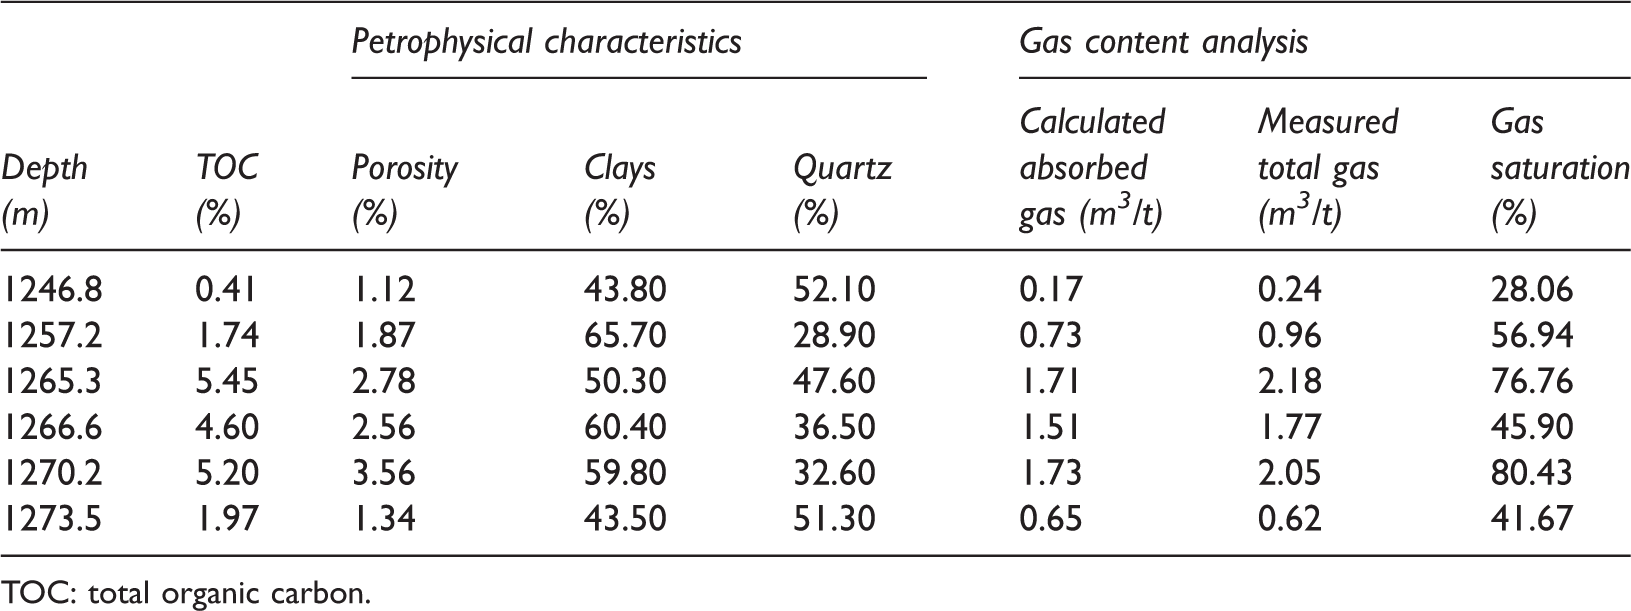
TOC: total organic carbon.
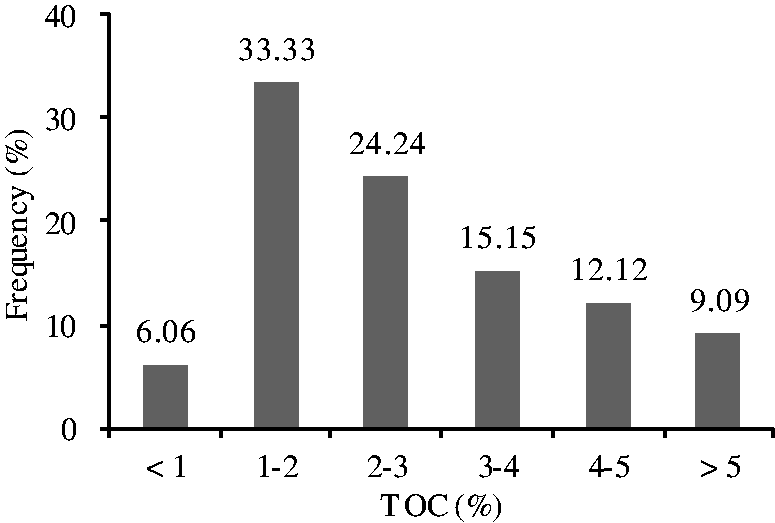
Distribution characteristics of TOC content.
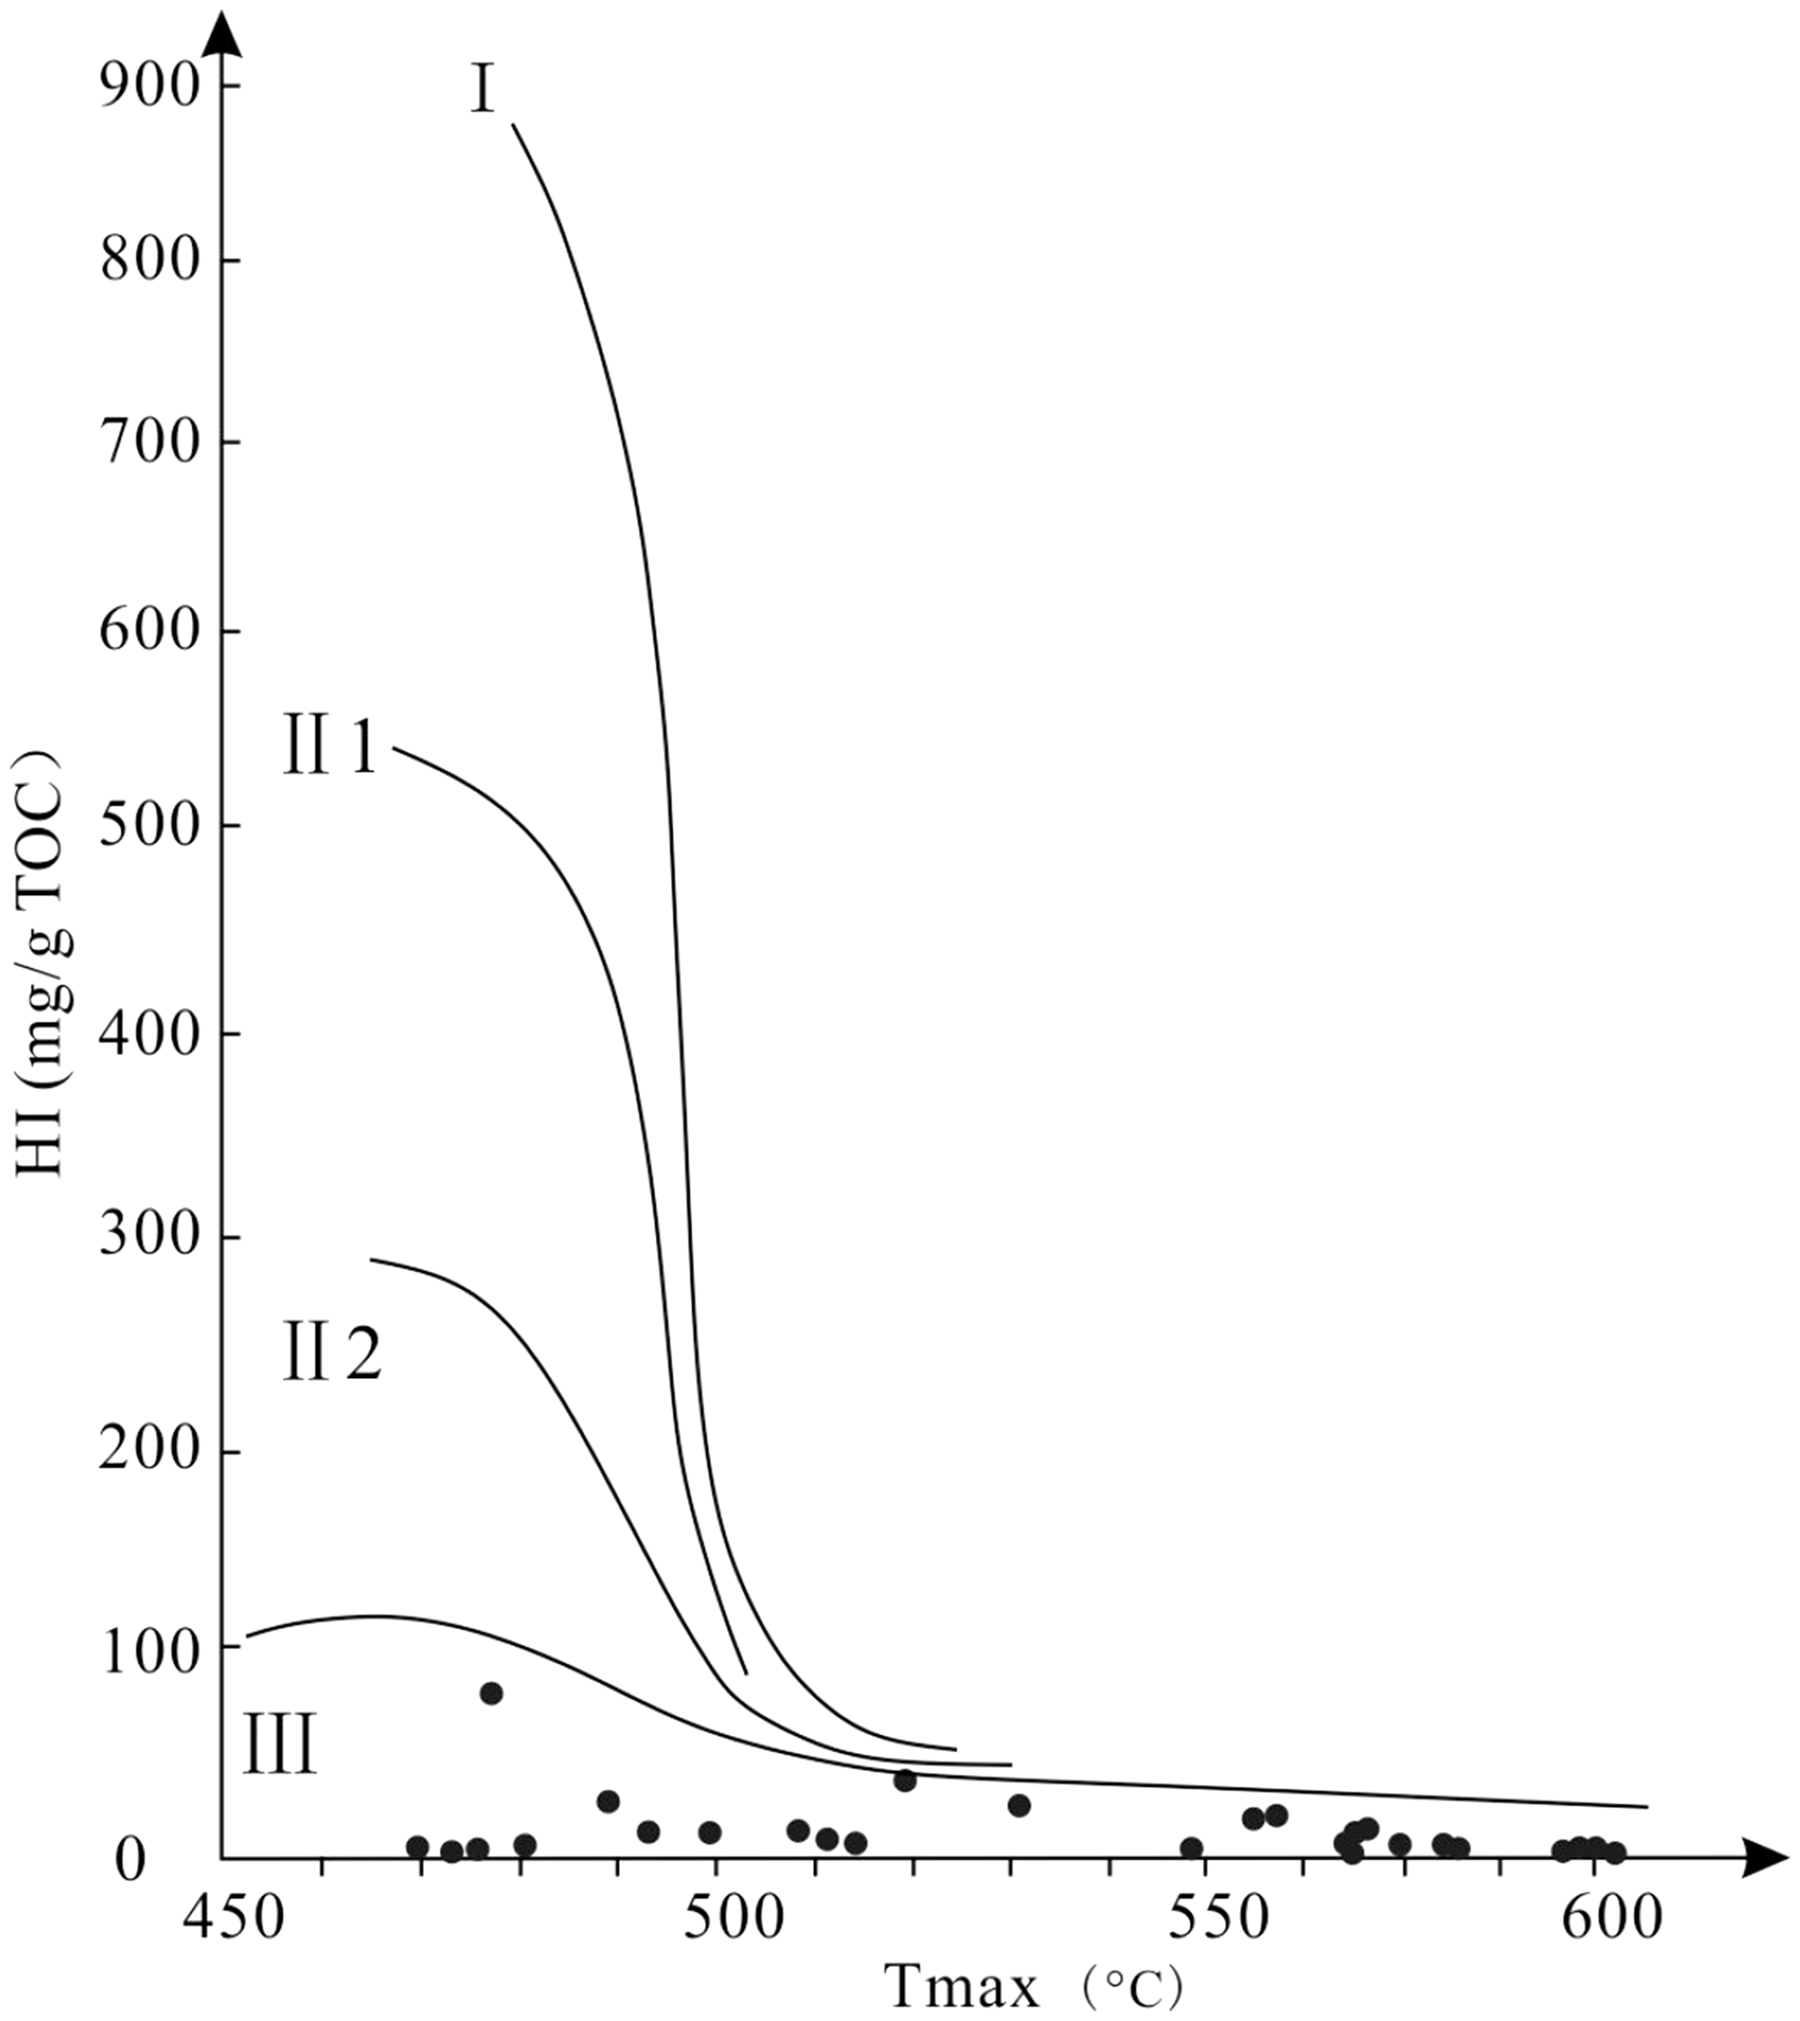
Relationship between HI and Tmax.
Petrophysical characteristics
The petrophysical characteristics of shale samples are shown in Tables 1 and 2. The results of the XRD experiments reveal that the main mineral components in marine–terrigenous shale are clay and quartz minerals, with respective values ranging from 32.8% to 69.4% (average value of 54.3%) and 28.9–64.1% (average value of 36.9%). Small amounts of calcite, feldspar, and pyrite are found in the shale samples. The results of the mercury porosimetry experiments show that the total porosity of the shale samples ranges between 0.89% and 11.27%, with an average value of 2.97%.
Adsorption capacities
The adsorption capacities of shale samples are listed in Table 1. The values of Langmuir volume (VL) which represents the maximum volume at a certain temperature, are between 0.01 and 2.57 m3/t (average value of 1.0 m3/t). In addition, the values of Langmuir pressure (PL) at which the adsorbed volume is half the Langmuir volume, range from 0.22 to 8.58 m3/t (average value of 1.83 MPa). The results of the high temperature/pressure isothermal adsorption experiments exhibit distinct features that can be seen in Figures 4 and 5. The adsorption capacity is significantly reduced as the applied temperature increases (Figure 4). In addition, as the applied temperature increases the Langmuir volume of the shale samples decreases, while the opposite relationship is true with respect to Langmuir pressure (Figure 5).
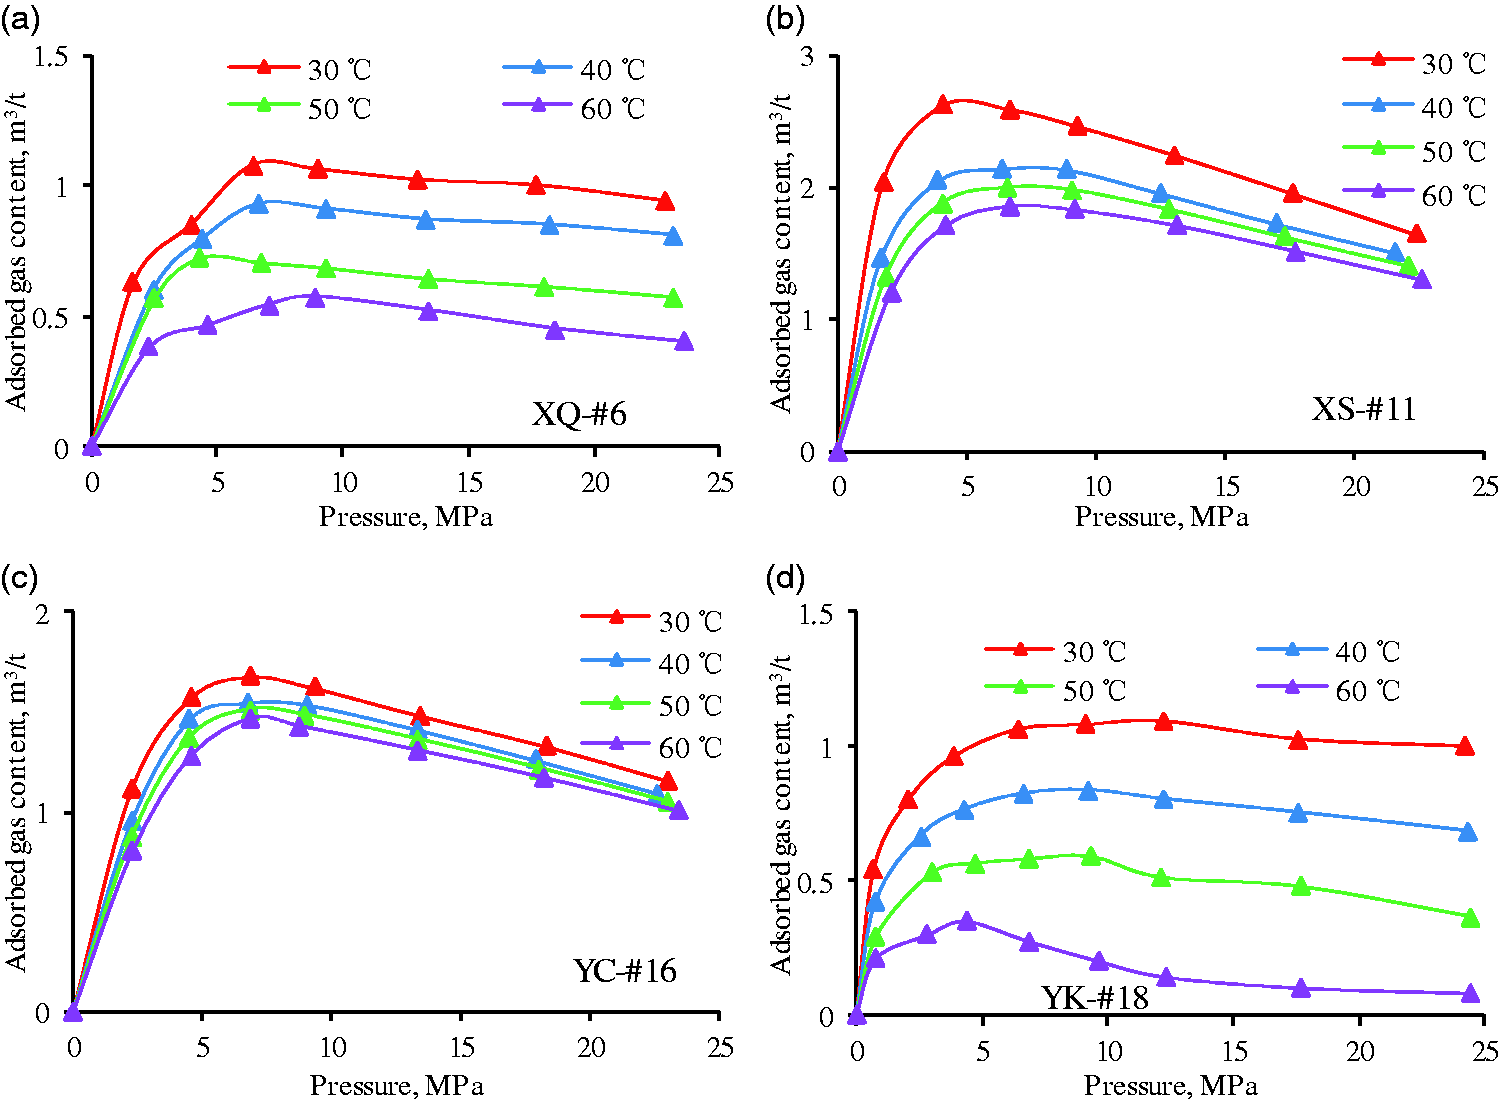
Relationship between temperature, pressure and adsorption capacity. (a) sample #6, well WQ; (b) sample #11, well XS; (c) sample #16, well YC; and (d) sample #18, well YK.
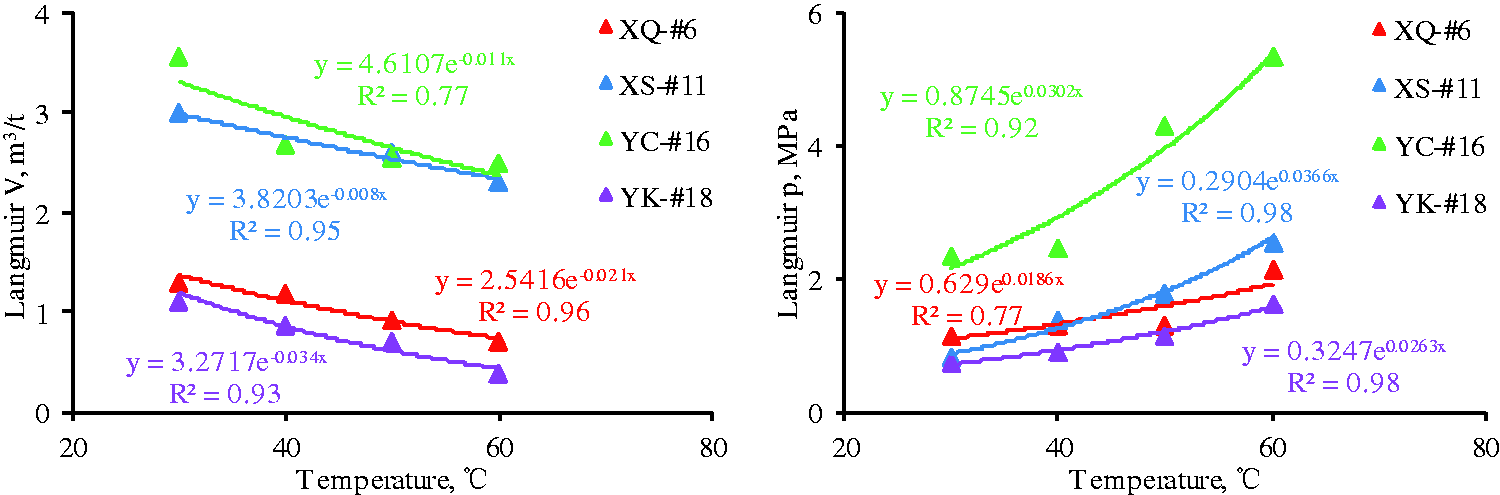
Relationship between Langmuir volume (left), Langmuir pressure (right), and applied temperature.
Stress–sensitivity of porosity
The results of the porosity in net confining experiments reveal some clear features, as shown in Figure 6. As can be observed, the porosity of the shale samples is highly sensitive to stress and exponentially decreasing with increasing effective stress.
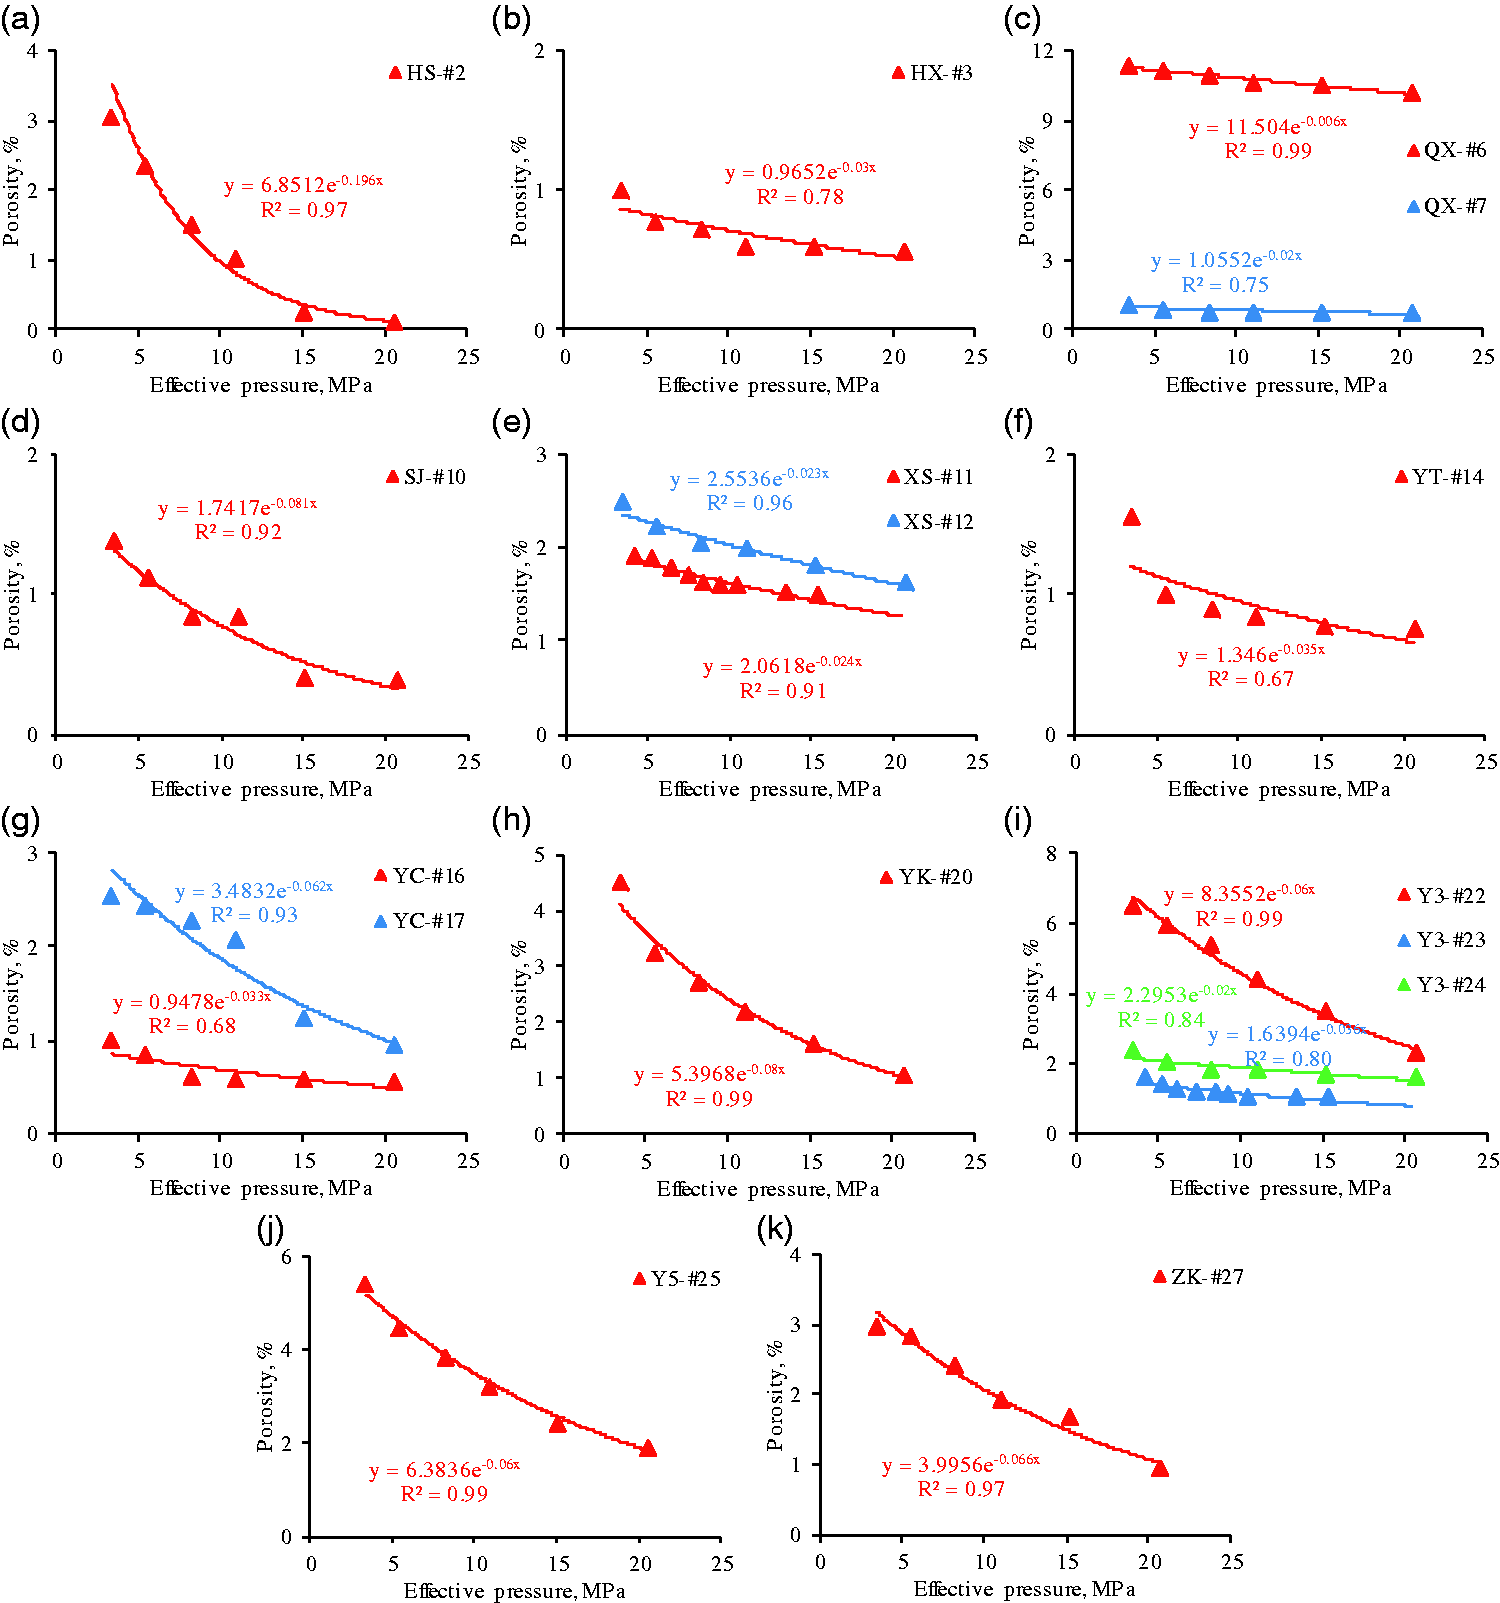
Porosity stress-sensitivity of the shale samples collected from different wells. (a) sample #2, well HS; (b) sample #3, well HX; (c) samples #6 and #7, well QX; (d) sample #10, well SJ; (e) samples #11 and #12, well XS; (f) sample #14, well YT; (g) samples #16 and #17, well YC; (h) sample #20, well YK; (i) samples #22, #23 and #24, well Y3; (j) sample #25, well Y5; and (k) sample #27, well ZK.
Measured total gas content
The measured total gas content was obtained by field desorption (Table 2). The results show that the total gas content accounted for 0.24–2.36 m3/t, with an average value of 1.38 m3/t, and had a positive correlation with TOC and porosity (Figure 7). This is due to the fact that the organic components with well-developed micropores, which provides a larger surface area for gas adsorption. Higher porosity also provides a high effective storage space for free gas.
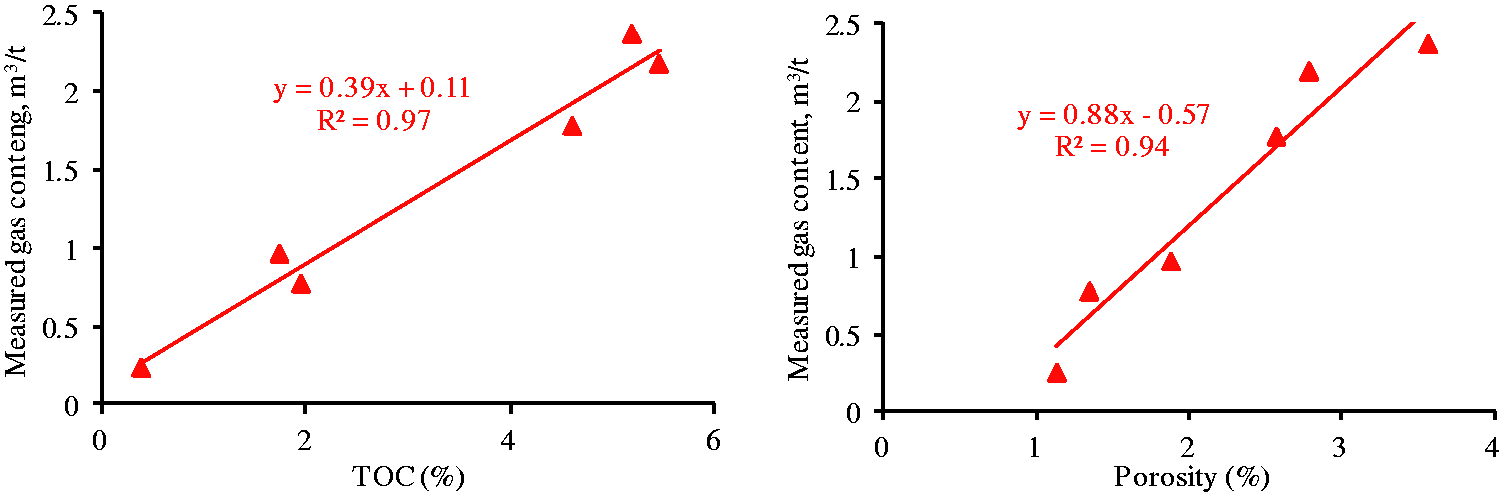
Relationship between the TOC (left), porosity (right), and measured total gas content.
Discussion
Analysis of influencing factors on adsorption capacity
Effects of TOC content and maturity on adsorption capacity
Previous studies have shown that among many geochemical characteristics of shale reservoirs, TOC content and maturity are two key factors that have the greatest impacts on adsorption capacity. Adsorption capacity of shale reservoirs has a positive correlation with TOC content and maturity (Chalmers and Bustin, 2008; Ji et al., 2015; Ross and Bustin, 2007). The effects of TOC content and maturity on adsorption capacity are shown in Figures 8 and 9, respectively. Figure 8 implies that Langmuir volume has a linear positive correlation with TOC content (R2 = 0.70). In order to avoid interference from the effect of TOC content on the adsorption capacity, 11 shale samples with similar TOC content and wide range of Ro were chosen to study the relationship between the adsorption capacity and maturity. The results show that both the Langmuir volume and the Langmuir pressure increase linearly as maturity increases (Figure 9). Further, the relationship between TOC content, Ro, and Langmuir volume, and that between Ro and Langmuir pressure can be given by:

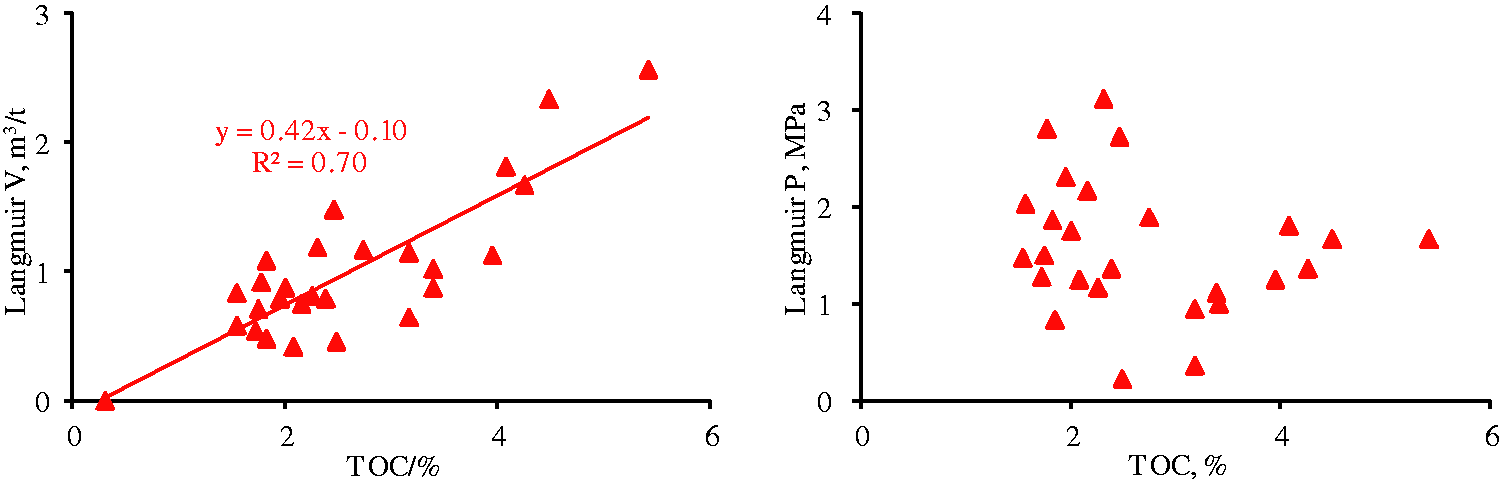
Relationship between Langmuir volume (left), Langmuir pressure (right), and TOC content.
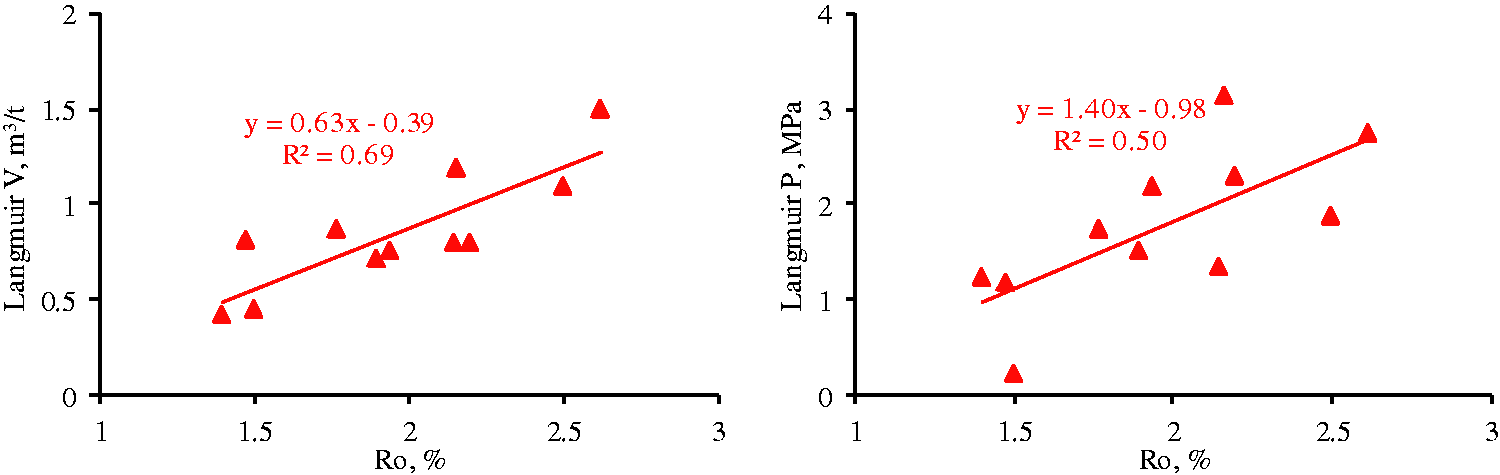
Relationship between Langmuir volume (left), Langmuir pressure (right), and maturity.
Effects of mineral components on adsorption capacity
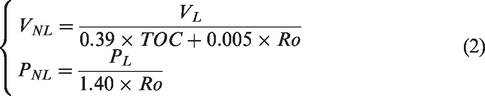
Previous studies have shown that minerals have significant impacts on the adsorption capacity (Han et al., 2016; Ji et al., 2015; Zhang et al., 2014). Clay and quartz minerals are the main mineral components in marine–terrigenous shale, with respective average values of 54.3% and 36.9%. In order to avoid interference from the effect of geochemical characteristics (TOC content and Ro) on the adsorption capacity, the data of Langmuir volume and Langmuir pressure should be normalized with the TOC content and Ro. Based on the study above, normalized Langmuir volume and Langmuir pressure can be obtained as follows:
The effects of the minerals on adsorption capacity in Figures 10 and 11 show that clay content has an insignificant impact on adsorption capacity. Langmuir volume is exponentially decreasing with increase in quartz content, while the reverse is the case between Langmuir volume and clay content. In other words, the effects of mineral components on the adsorption capacity are mainly due to the effects of quartz content and clay content on Langmuir volume.
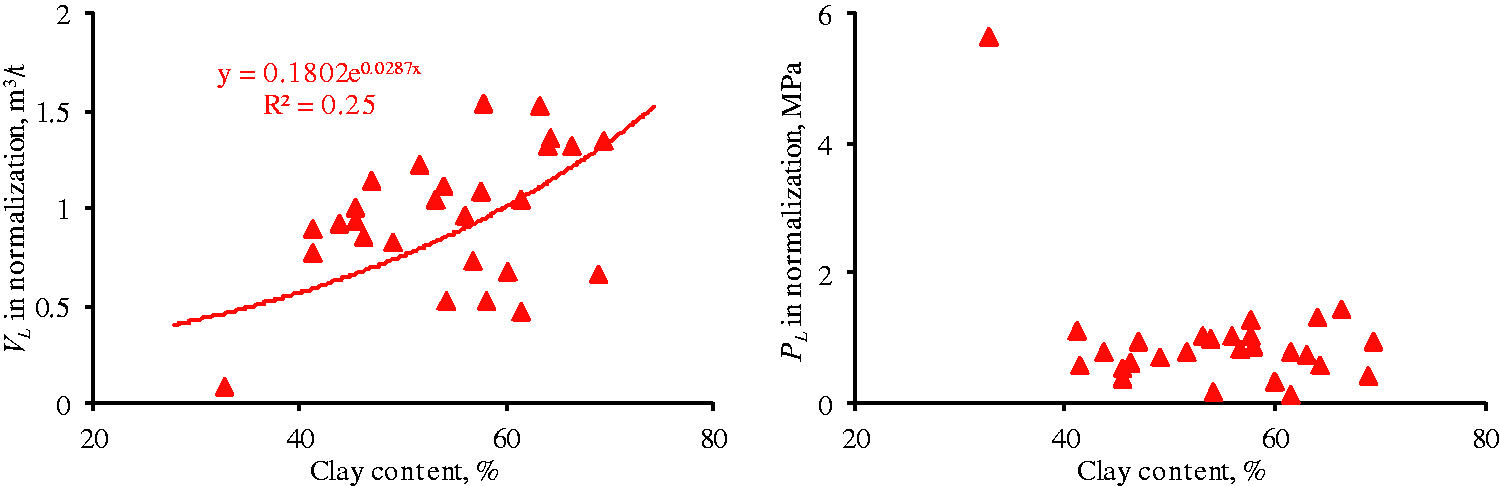
Relationship between VNL (left), PNL (right), and clay content.
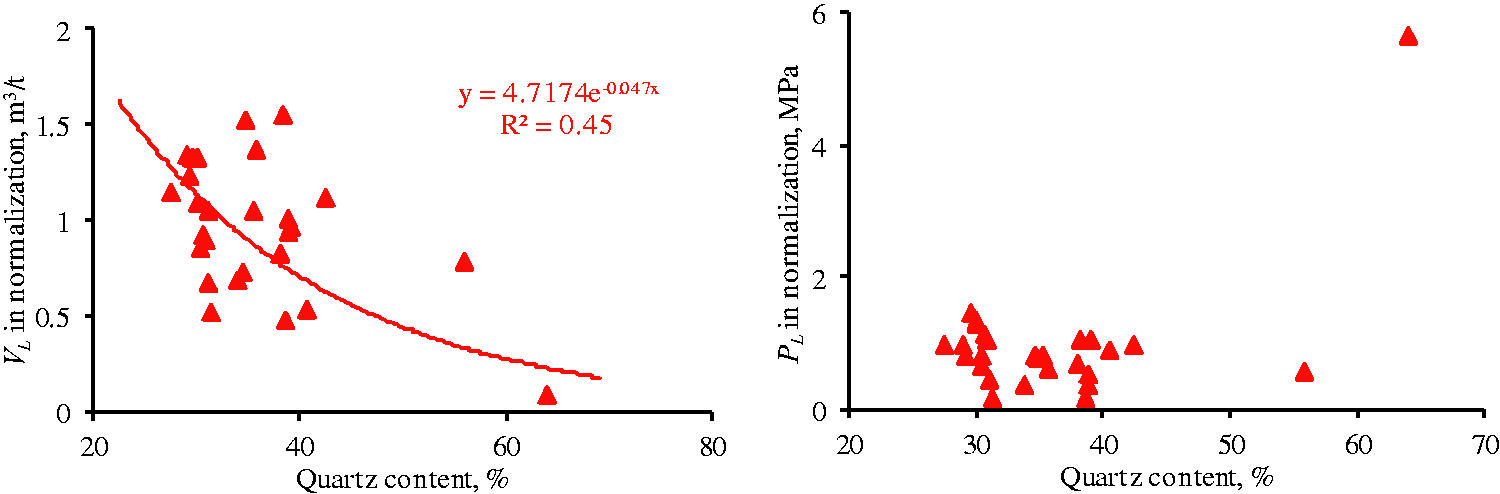
Relationship between VNL (left), PNL (right), and quartz content.
Geological models establishment
Total gas content model
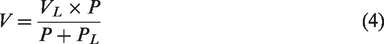
The gas content in marine–terrigenous shale is predominantly by free gas and adsorbed gas, while the dissolved gas content is insignificant (Li et al., 2016). Based on this composition, the total gas content in marine–terrigenous shale is controlled by the free gas and adsorbed gas content. Under geological conditions, the geological model for total gas content in marine–terrigenous shale can be defined as:

Adsorbed gas model
The adsorption capacity of marine–terrigenous shale can be quantitatively evaluated using a Langmuir isotherm model, which is commonly applied to describe the relationship between the adsorbed gas and pressure at a fixed temperature:
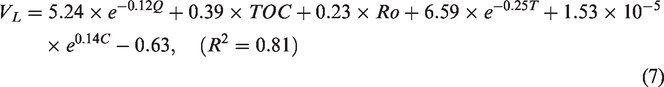
Based on the above research results, the effects of the reservoir characteristics of marine–terrigenous shale and in situ reservoir temperature/pressure on adsorption capacity can be summarized as follows: (1) Langmuir volume has a linear positive correlation with the TOC content, (2) both Langmuir volume and Langmuir pressure have an exponentially positive correlation with maturity, (3) Langmuir volume has an exponentially negative correlation with quartz content and exponentially positive correlation with clay content, respectively, and (4) Langmuir volume has an exponentially negative correlation with temperature, while the opposite is true of the relationship between Langmuir pressure and temperature. Considering the comprehensive effects of these various factors on Langmuir volume and Langmuir pressure, the following models were established:


Based on the experimental data, the following relationships were obtained:

By substituting equations (7) and (8) in equation (4), the adsorbed gas model under the impacts of reservoir characteristics and in situ reservoir temperature/pressure was obtained:

The results derived from this adsorbed gas model have a high degree or correlation with the isothermal adsorption experimental results (R2 = 0.85) (Figure 12), indicating that the adsorbed gas model can accurately predict the adsorbed gas content in marine-terrigenous shale.
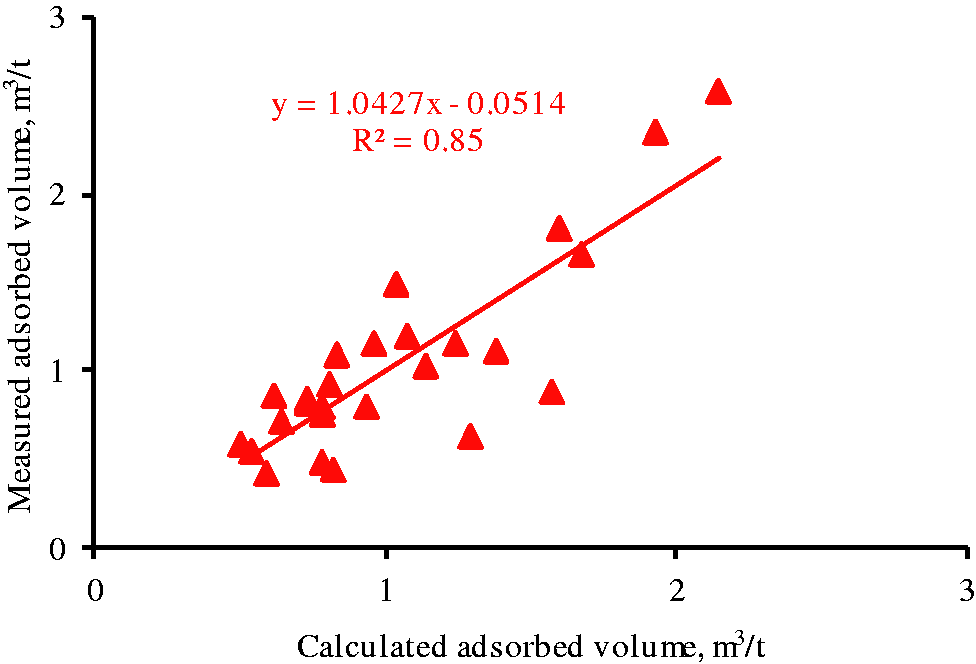
Relationship between measured and calculated adsorbed gas content.
Free gas model
The factors that influence the free gas content include in situ temperature, in situ reservoir pressure, matrix porosity, and gas saturation. The free gas content can be calculated by using the standard gas law, which is described as (Li et al., 2016)

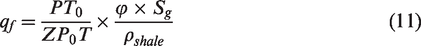

While currently there is not an effective method to directly determine the gas saturation for shale gas reservoirs, the gas saturation can be calculated by combining equation (3) with equation (11)
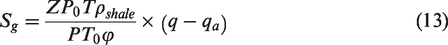
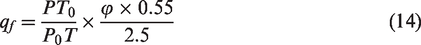
Previous studies have found that reservoir pressure and effective stress increase linearly as burial depth increases in the Southern Qinshui Basin (Meng et al., 2010). Based on this work and the field desorption data, gas saturations for the six shale samples were calculated. The results show that the gas saturations are between 28.06% and 80.43%, with an average value of 55%. The average gas saturation value (55%) was selected to represent the gas saturation of marine-terrigenous shale in the Southern Qinshui Basin, so that equation (11) can be described as
Application of gas content geological models
Combining equations (3) and (9) reveals the changes in adsorbed gas, free gas, and total gas found in marine–terrigenous shale within the well ZK at various burial depths. The results indicate that adsorbed gas content, free gas content, and total gas content initially increase and then decrease as burial depth increases (Figure 13). Higher TOC content and porosity are related to higher adsorbed gas and free gas content at a certain burial depth, which is consistent with previous research (Ross and Bustin, 2007). The adsorbed gas content and free gas content increasing with an increase in TOC content and porosity, indicating that the total gas content at different burial depths is mainly controlled by the TOC content and porosity.
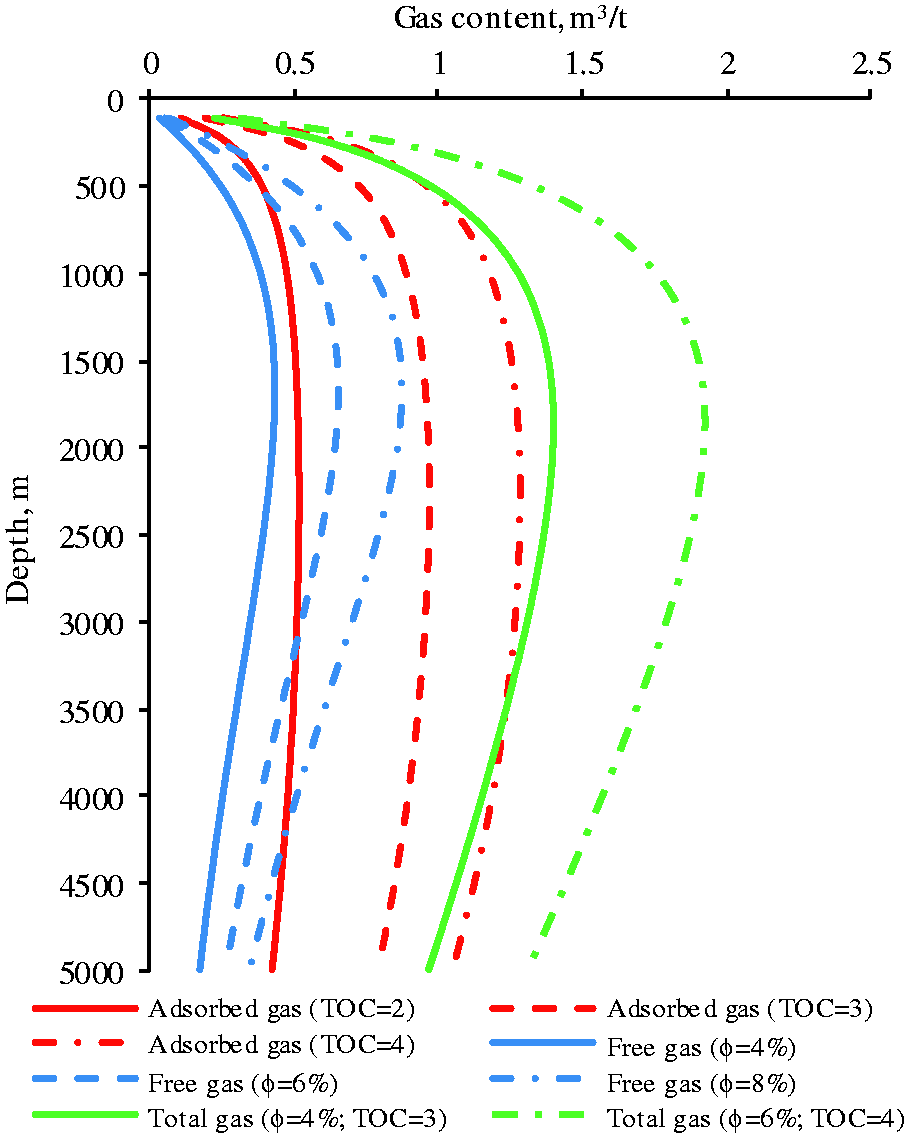
Change in adsorbed gas, free gas, and total gas in marine–terrigenous shale at different burial depths.
Conclusions
In this study, methane isothermal adsorption, TOC content, XRD, mercury porosimetry, porosity in net confining stress, and field desorption methods were used for exploring the effects of reservoir characteristics and geological conditions on the gas content in marine–terrigenous shale. Furthermore, geological prediction models of gas content in marine-terrigenous shale were proposed. Based on the findings of this study, the following conclusions are drawn:
The adsorption capacity of marine-terrigenous shale has a linearly positive relationship with TOC content and maturity. In addition, the Langmuir pressure of shale samples increase in a linearly positive correlation as maturity increases. The adsorption capacity of shale reservoirs is slightly correlated with clay content, while it decreases exponentially with increasing quartz content. Under geological conditions, the adsorption capacity of marine–terrigenous shale decreases with increasing temperature. Both Langmuir volume and Langmuir pressure are clearly controlled by temperature: Langmuir volume exponentially decreases with increasing applied temperature, while the opposite is the true for Langmuir pressure. The porosity of marine–terrigenous shale is highly stress-sensitive, decreasing exponentially with increasing effective stress. The measured total gas content has a linearly positive correlation with TOC content and porosity. The gas saturations range from 28.06% to 80.43%, with an average value of 55%. Adsorbed gas, free gas, and total gas initially increase and then decrease as burial depth increases. The geological prediction models can be applied to accurately predict the gas content in marine–terrigenous shale for other zones and have great significance to resource evaluation and the selection of target areas for marine–terrigenous shale gas production. More detailed work is needed to confirm dominant factors and fit undetermined coefficients.
Footnotes
Declaration of conflicting interests
The author(s) declared no potential conflicts of interest with respect to the research, authorship, and/or publication of this article.
Funding
The author(s) disclosed receipt of the following financial support for the research, authorship, and/or publication of this article: This work was jointly sponsored by the Fundamental Research Funds for the Central Universities of Key Laboratory of Coalbed Methane Resources and Reservoir Formation Process, Ministry of Education (China University of Mining and Technology) (No. 2017CXNL03) and the National Science and Technology Major Project (No. 2017ZX05035004-002).