
Abstract
The Sichuan Basin is one of the richest oil and gas basins in China. The Middle Permian units (the Qixia and Maokou Formations) in the northwest Sichuan Basin have great potential for gas exploration. A new thermal history was reconstructed using the integrated thermal indicators of apatite and zircon (uranium–thorium)/helium ages, zircon fission tracks, and vitrinite reflectance data. The modeled results indicated that the northwest Sichuan Basin experienced gradual cooling, during which the heat flow at Middle Permian time (70–90 mW/m2) decreased to its current level of approximately 50 mW/m2. This study used basin modeling to reconstruct the paleo-pressure, which showed that the Middle Permian in the northwest Sichuan Basin generally developed overpressure. The pressure evolution of the Middle Permian can be divided into three stages: (1) a slight overpressure stage (T2–T3), (2) an intensive overpressure stage (J1–K2), and (3) an overpressure reduction stage (K2–present). Oil cracking and rapid tectonic subsidence are key factors that affect overpressure. The evolution of temperature–pressure has great significance with respect to hydrocarbon accumulation.
Introduction
The Middle Permian is the main stratum of oil and gas exploration in the Sichuan Basin, and exploration began in 1950s (Zhou et al., 2016). The Middle Permian stratum in the northwest Sichuan Basin (NWSB) presents favorable conditions for forming natural gas reservoirs. In 2014, high-yield industrial gas was produced from the Middle Permian dolomite reservoirs in Well ST1 in the NWSB, which was a great breakthrough in natural gas exploration in the Middle Permian system (Shen et al., 2015).
The temperature field and the pressure field are two important physical fields of the sedimentary basin, both of which evolve with the basin. The distribution law of the temperature–pressure field and its evolutionary characteristics have important influence and control on the process of oil and gas generation, migration, and accumulation (Liu et al., 2014; Zuo et al., 2017). In recent years, as an indispensable part of basin analysis and research, the study of the temperature–pressure field has gradually become the frontier and core content of the oil and gas accumulation dynamics research field. It plays an increasingly important role in oil and gas exploration and prospecting. However, the degree of research regarding the temperature–pressure field in the NWSB is still very low, which restricts oil and gas exploration. At present, some studies have been done on the temperature field (He, 2014; He et al., 2017; Zhu et al., 2015), but the pressure field in the NWSB remains unclear. This article contributes to understanding the temperature–pressure field evolution using paleo-thermal indicator methods and basin modeling. This work provides fundamental information for further exploration in the Sichuan Basin.
Geological setting
The Sichuan Basin is a diamond-shaped basin located in southwestern China, covering an area of 230,000 km2. Structurally, the basin is located in the northwest part of the Yangtze platform, is bound by the Longmen Mountain orogenic belt in the northwest, the Micang Mountain fold belt in the north, the Daba Mountain thrust belt in the northwest, the Emeishan-Leshan fold belt in the southwest, and the Hubei–Hunan–Guizhou fold belt in the southeast. The tectonic evolution of the Sichuan Basin after the Sinian period is complicated and includes the differential uplift associated with extension from Sinian to the Late Triassic (Z–T3), folding and thrusting from compression during the Late Triassic to the Eocene (T3–E), and uplift that was associated with folding from the Oligocene to the present (E–Q) (Liu et al., 2014). The formations that were deposited in the Sichuan Basin can be divided into two sedimentary systems (Wang et al., 2002): a lower, marine carbonate sedimentary system (Sinian to Middle Triassic) and an upper, continental clastic sedimentary system (upper Triassic to Eocene).
The NWSB belongs to the Longmen Mountain and Micang Mountain piedmont fold belt in the northern margin of the Yangtze platform. The study area is about 20,000 km2. Since the Indosinian movement, due to the episodic Longmen Mountain compressive deformation and continuous uplift of Micang Mountain, parallel fault structure groups were formed in the NWSB. According to the structural features, the NWSB can be divided into three parts: the Longmen Mountains fold-trust belt, the transitional zone, and the northwest gentle fold belt. The Micang Mountain structural belt is located north of the study area (Figure 1(a) and (b)).
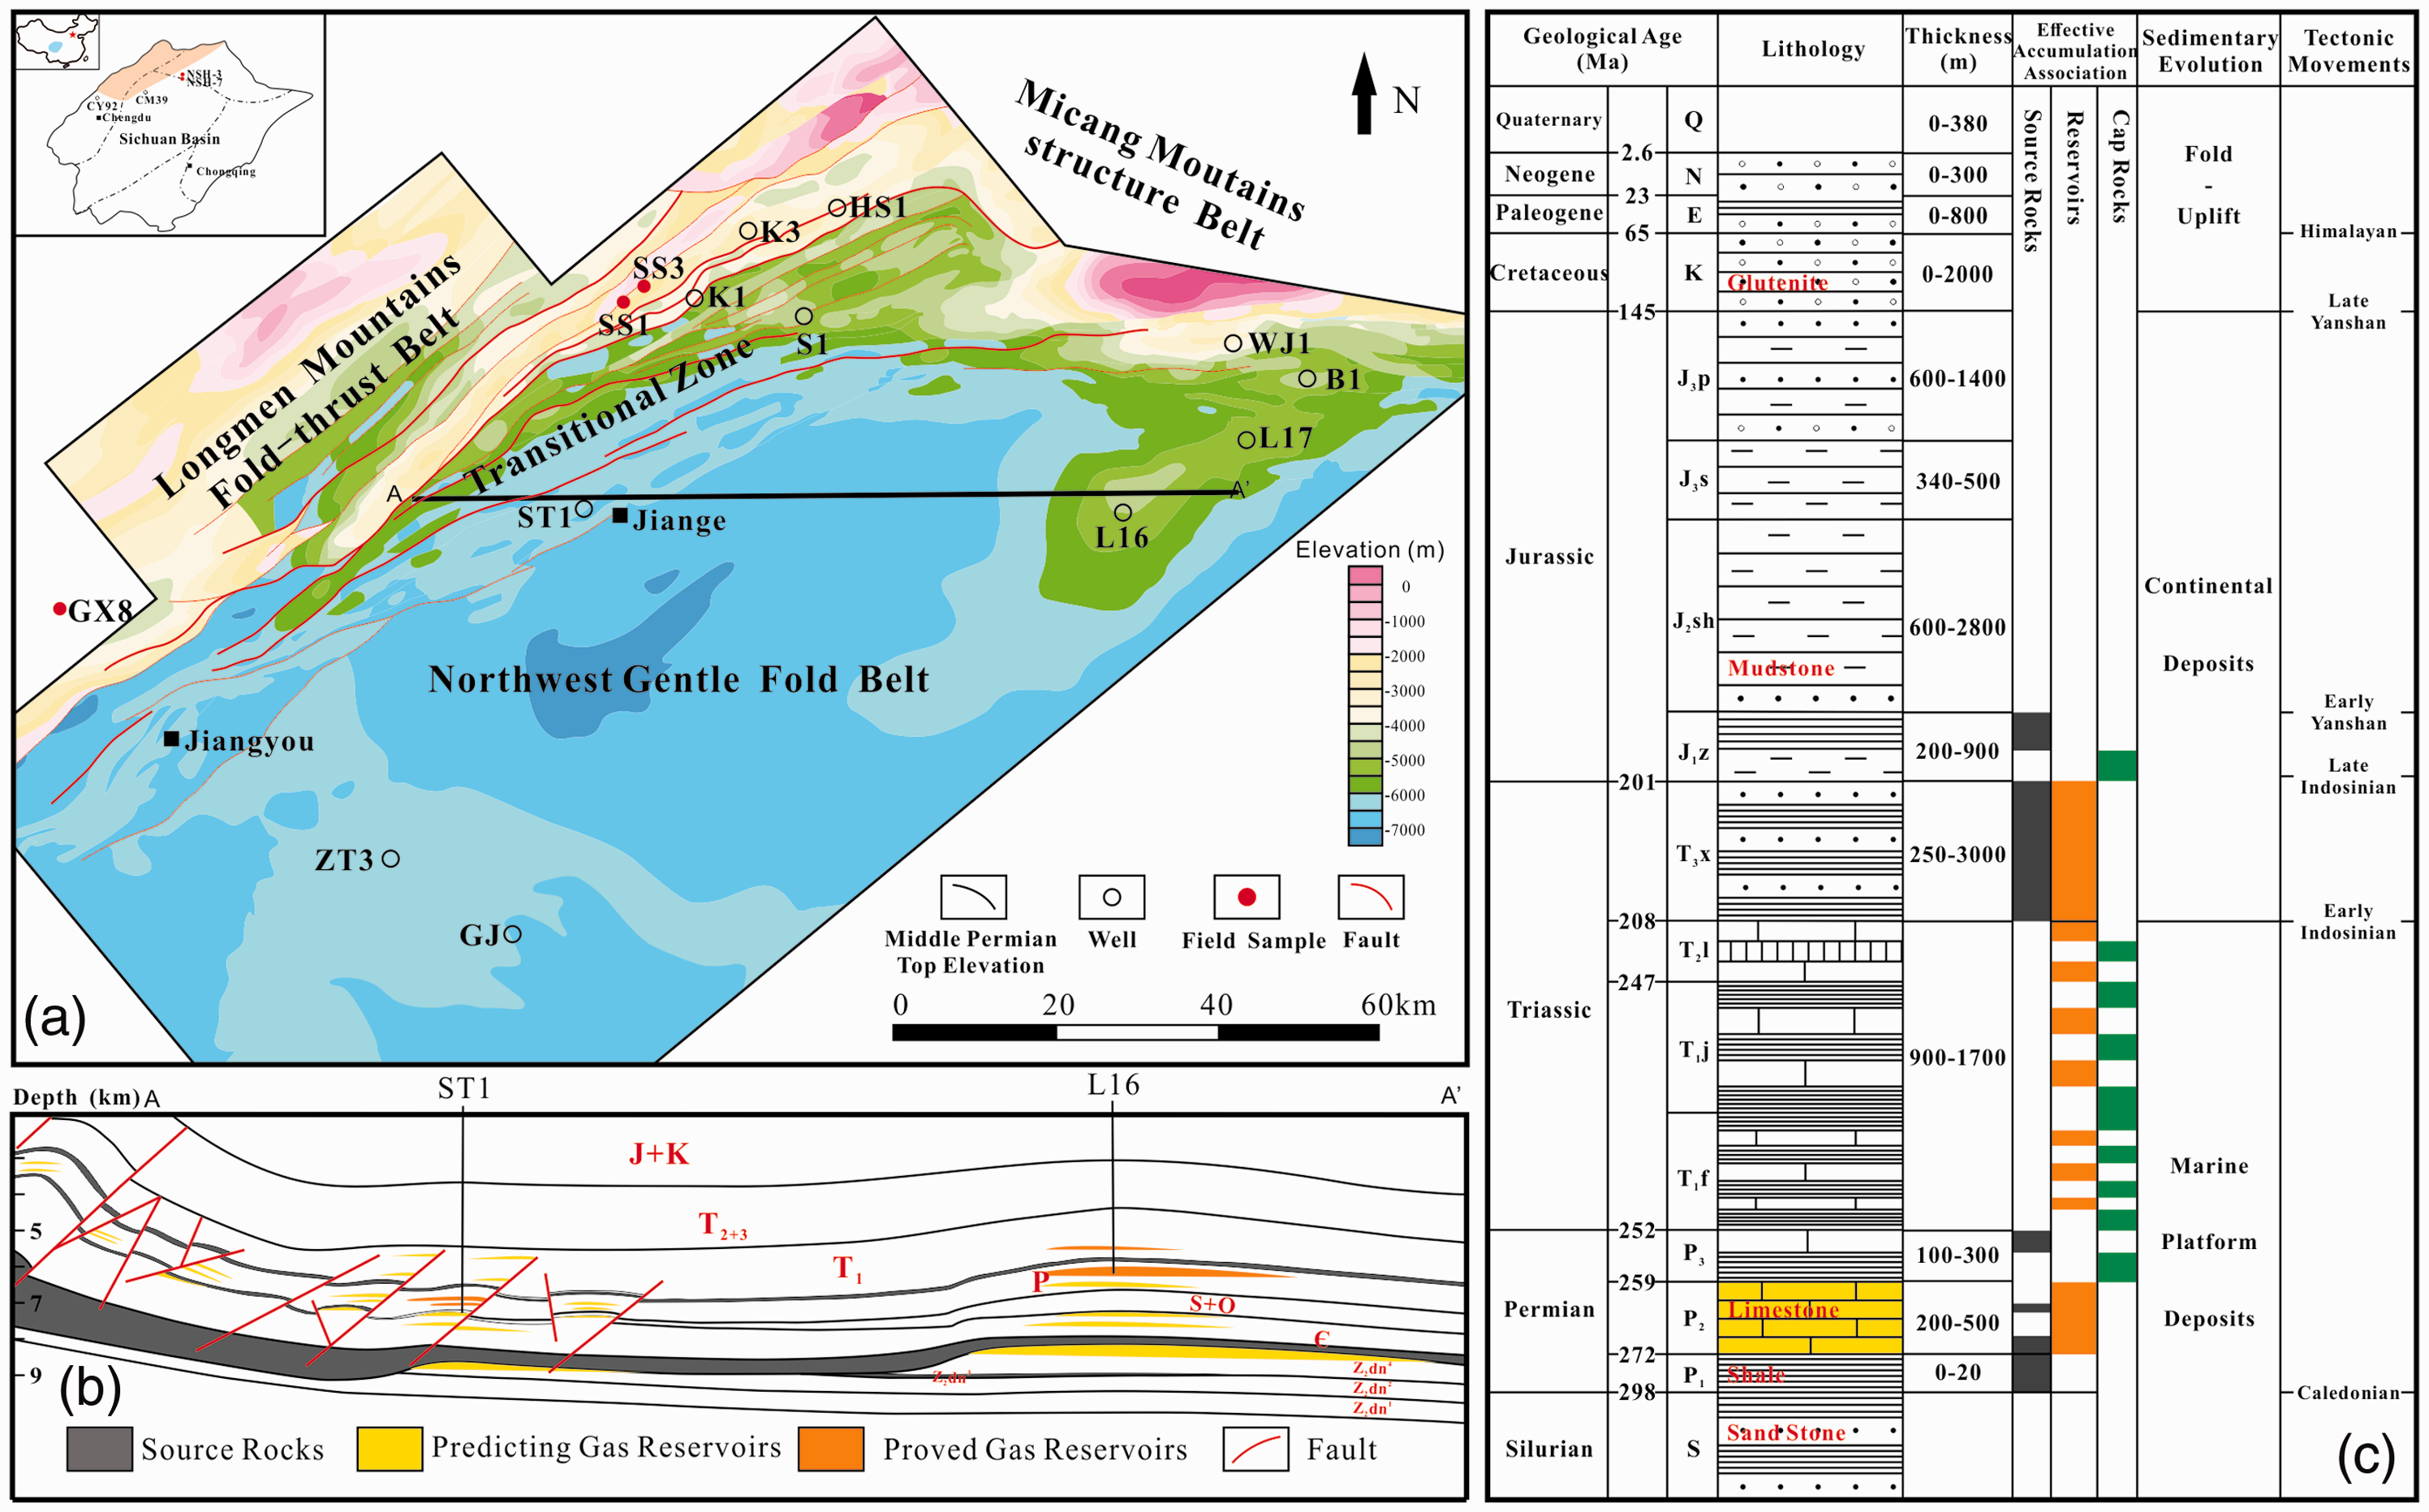
(a) Tectonic map of the top surface of the Middle Permian system in the NWSB, (b) cross-section of the study area, and (c) composite stratigraphic section showing lithology.
In the Western Sichuan Depression, the lower Permian is generally absent in the basin that was affected by the Caledonian movement. Permian strata were deposited during the development of the carbonate platform and include biolithite limestone, shale, and flagstone (Figure 1(c)) (Ma et al., 2007). The Triassic sedimentary succession holds important evidence for changing sedimentary environments: limestones, dolomites, and multiple sets of gypsolytes were deposited in the Lower Triassic; transitional facies were deposited in the Middle Triassic; and the continental mudstone and sandstone were deposited in the Upper Triassic Xujiahe Formation (T3x) (Ma et al., 2007). After the evolution of these environments, the Jurassic and Cretaceous were primarily characterized by deposition of shallow lacustrine and fluvial facies and the deposition of magenta-colored sandstone. However, because they have been influenced by Himalayan tectonism since the Late Cretaceous, overlying strata (younger than Jurassic) have almost been completely eroded (Deng et al., 2009; Liu et al., 2012; Zhu et al., 2009).
Gas in the NWSB has mainly accumulated in the Upper Triassic Xujiahe Formation (T3x), Lower Triassic Jialingjiang Formation (T1j), Middle Permian Maokou Formation (P2m), Middle Permian Qixia Formation (P2x), and Upper Cambrian (Figure 1(c)). The Cambrian, Middle Permian, and the Lower–Middle Triassic are considered to be the most important hydrocarbon source rocks for marine gas reservoir in the NWSB (Xu, 2010). The Middle Permian source rock is over 50 m thick and contains abundant sapropelic organic matter with total organic carbon up to 5% (Li et al., 2012; Zhang et al., 2012). The kerogen types from the carbonate source rocks in the Middle Permian are mainly sapropelic, and the gas generation intensity is between 26 × 108 and 44 × 108 m3/km2 (Yang et al., 2015).
Samples and methods
Reconstruction of the temperature and pressure evolution is of great significance for understanding hydrocarbon accumulation in sedimentary basins. In petroliferous basins, paleo-temperature and paleo-pressure are very difficult to reconstruct. To reconstruct the Middle Permian thermal history, obtaining paleo-thermal indicators that reliably record the Permian thermal information is important. Detrital apatite and zircon grains are abundant in Upper Triassic to Cretaceous strata, but the Permian to Middle Triassic strata are predominantly carbonate, so obtaining apatite and zircon samples from them is challenging. A few marine clastic apatite- and zircon-bearing units from Paleozoic strata were sampled (Table 1 and Figure 1), which may also include the recorded the Permian thermal information about the NWSB.
Details of thermochronology samples.
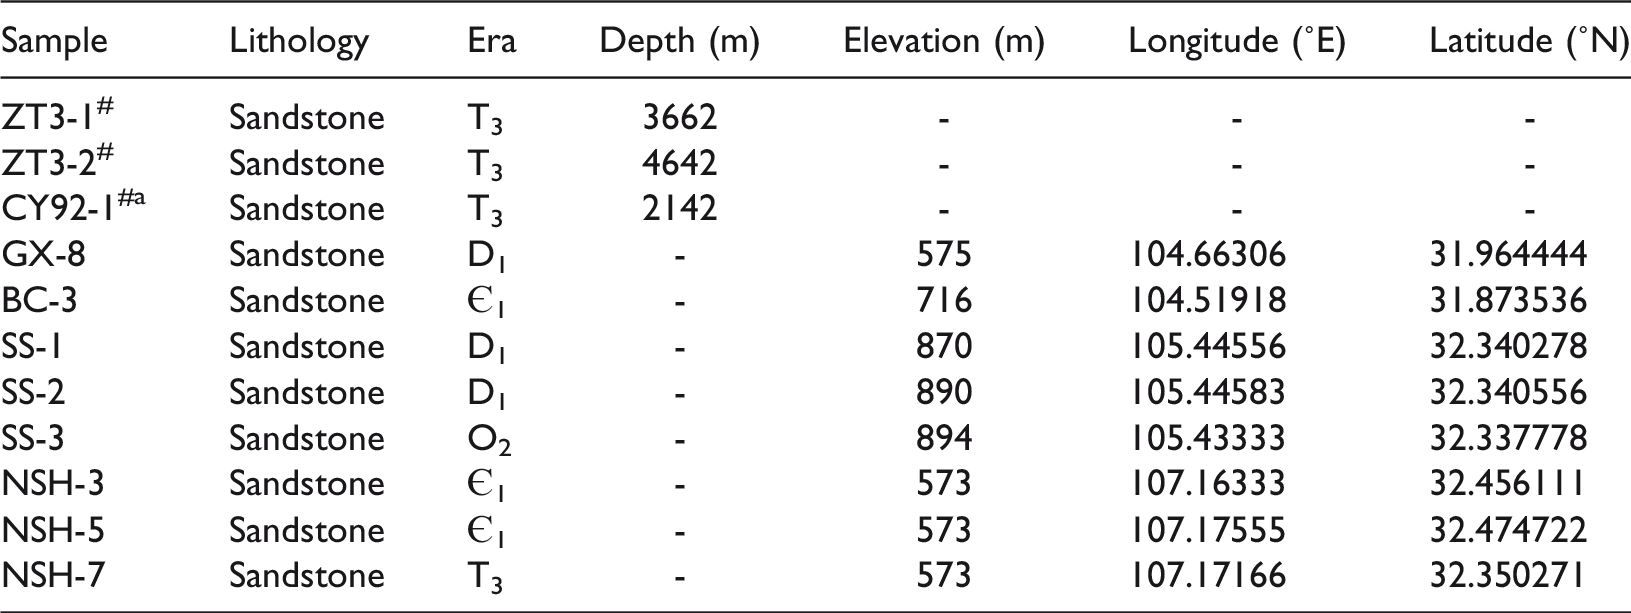
arefer to Zhu et al. (2015). # means samples from wells.
The samples locations are shown in Figure 1(a).
(U–Th)/He analysis was conducted at the School of Earth Sciences, University of Melbourne. The (U–Th)/He analyses for apatite and zircon samples were conducted following the procedures described by Gleadow et al. (2015). The first step in this procedure involved the extraction and measurement of He from a single crystal, followed by measurement of U and Th (and Sm, for apatite) by isotope dilution, Parr bomb dissolution, and high-resolution inductively coupled plasma mass spectrometry. Zircon He ages and apatite He ages were calculated and corrected for α-emission following the approach of Falvey et al. (1996). A total of six zircon and three apatite samples were chosen to obtain (U–Th)/He ages (Table 2). Sample ZT3-2 and CY92-1 are from wells, and the others are outcrop samples. Three replicate analyses per sample were performed for most samples, but several samples had only two replicate analyses because of poor grain recovery.
Measured (U–Th)/He ages of samples.
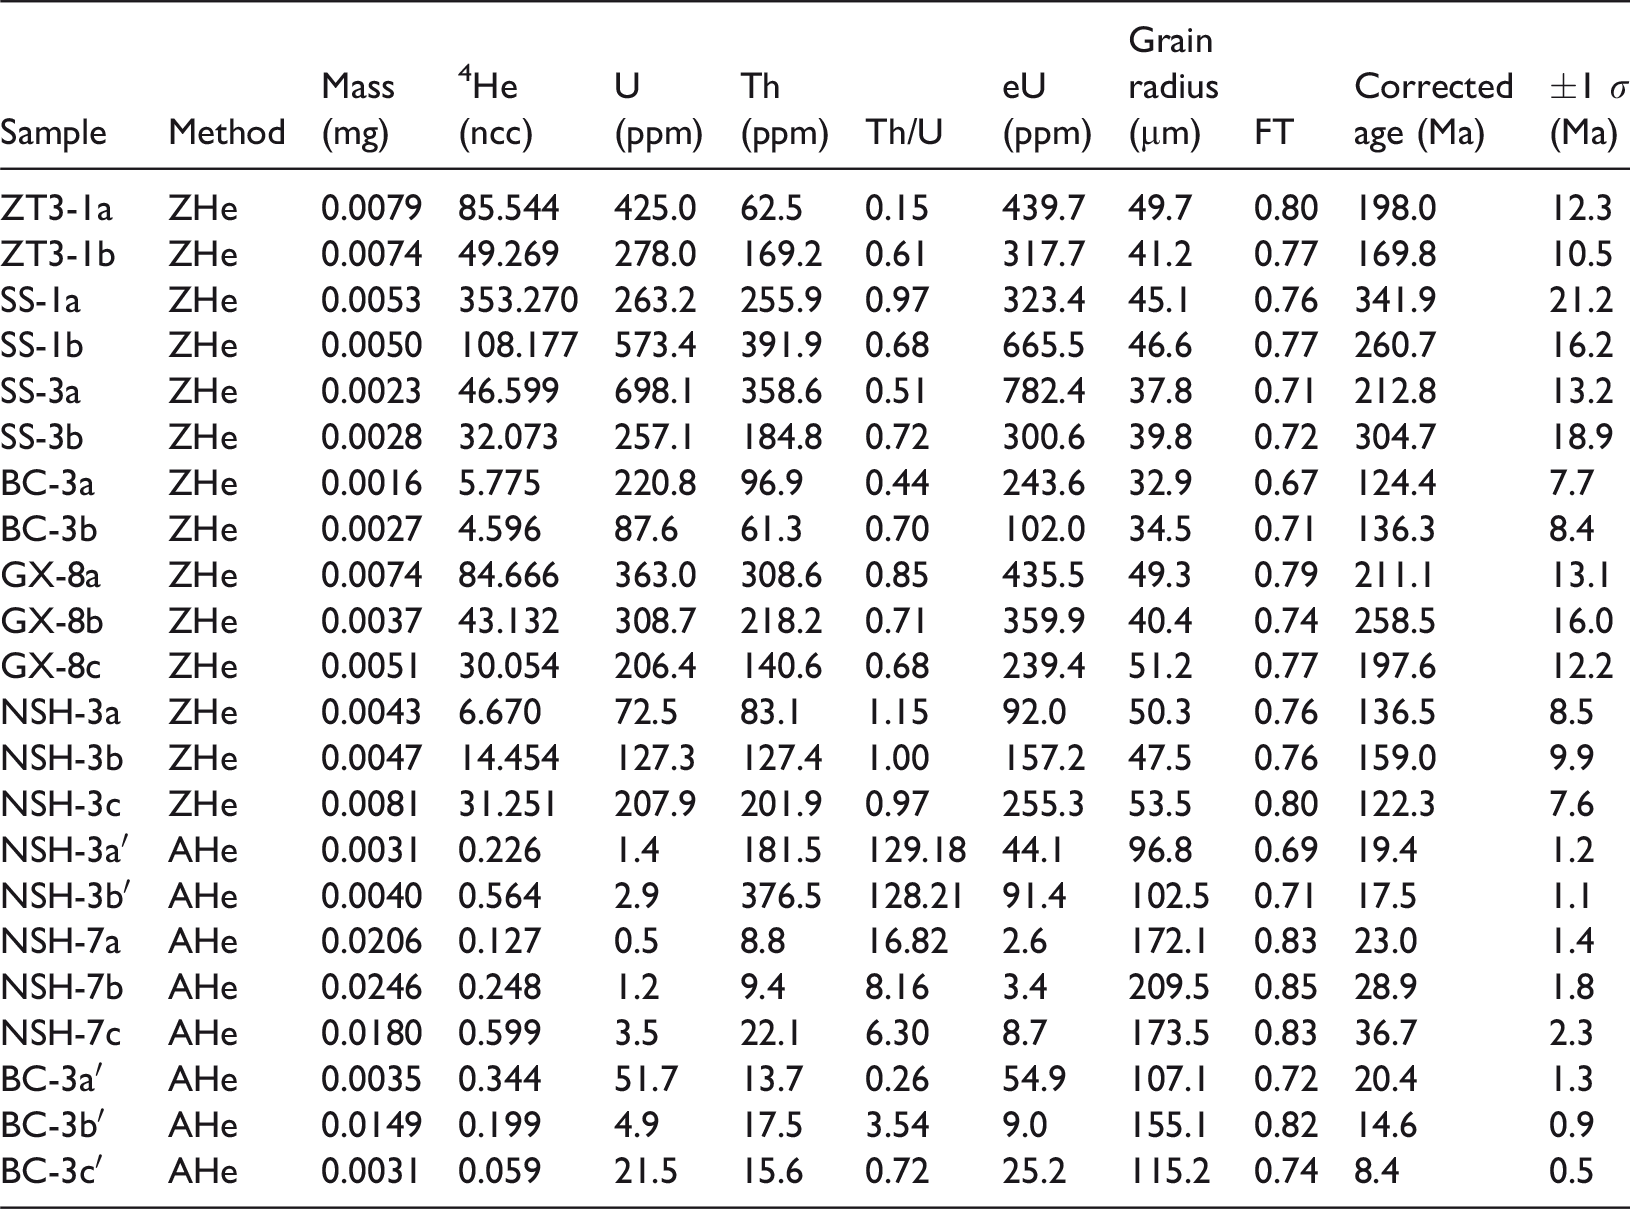
eU: effect uranium concentration, calculated from the contents of U and Th, eU = U + 0.235Th (Reiners et al., 2005); FT: alpha correction factor (Farley et al., 1996).
The Zircon Fission Track (ZFT) age determinations were made using laser-ablation inductively coupled plasma mass spectrometry (LA-ICP-MS). Zircon samples were assembled in FEP Teflon, sanded with sandpaper and polished with diamond paste to expose internal grain surfaces, and the fission tracks were etched in a eutectic melt of NaOH–KOH (1:1) at 225°C for 24–72 h. The LA-ICP-MS was calibrated using Fish Canyon Tuff as an age standard sample. For each sample, the U concentration usually had an acceptable U uniformity. The isotope concentrations were determined with high-resolution ICP-MS coupled with a laser ablation system. The spot size was chosen to cover the maximum area which fission tracks were measured. Fission track ages were calculated using the method presented by Donelick et al. (2005), using a modified zeta calibration approach as presented by Hasebe et al. (2004). The ZFT analyses were conducted at ChronusCamp Research, Brazil. A total of three zircon samples were tested to produce three ZFT ages (Table 3).
Zircon fission track data.
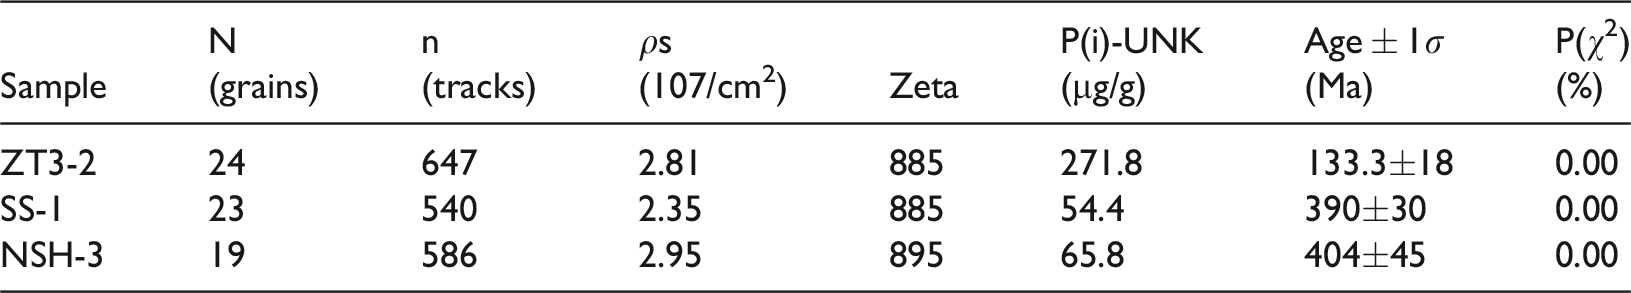
n: number of counted tracks; N: the number of grains analyzed; P(i)-UNK: ratio of 238U/91Zn; P(χ2): chi-square probability; ρs: density of trucks.
The methods for reconstructing the paleo-pressure include the fluid inclusions method, clay mineral method, in situ Raman method, and basin modeling. In this study, 30 fluid inclusion samples were tested. But unfortunately, no suitable fluid inclusion was found. So basin modeling was used to reconstruct the paleo-pressure. When overpressure develops and the pressure deviates from the hydrostatic pressure line, the fundamental reason is because the pore fluid is forced to bear part of the rock skeleton pressure. It is well known that the geologic parameters are interdependent: the porosity evolution depends on depth and pore fluid pressure. The fluid pressure is controlled by the pore volume and the volume of the fluid. The volume of the fluid is related to the density and velocity of the fluid, and the density of the fluid. Therefore, the use of basin models to recover the paleo-pressure is based on the relationships between the geological parameters of the dynamic coupling model to calculate the pressure evolution. In this paper, the software Basinmod (PRA Company) was used to reconstruct the pressure evolution of the Middle Permian in the NWSB, selecting the Fluid Flow as the compaction method, Bmod as the pressure model, Bmod 2D as the porosity reduction model, and the Power Function as the permeability model.
There are many parameters, such as lithological plays, stratigraphic age, erosion data, heat flow history, rock thermal conductivity, etc., that must be considered to complete the simulation. Lithologic and stratigraphic age data were obtained from PetroChina Southwest Oil & Gasfield Company, and the erosion data and heat flow history are mentioned above. The burial histories of the studied wells were reconstructed using the compaction model (Sclater and Christie, 1980).
Geothermal regime in the NWSB
Present thermal regime
Studies of the thermal regime in the Sichuan Basin have been conducted since the 1980s (Han and Wu, 1993; Huang and Wang, 1990; Xu et al., 2011; Zhang et al., 1986). However, due to the limitations of drilling conditions, the thermal regime of the western Sichuan Basin is less studied. In recent years, with the development of oil and gas exploration and the increasing number of boreholes, some deep-strata temperature data were collected. These provide a basis for studying the geothermal regime in the region.
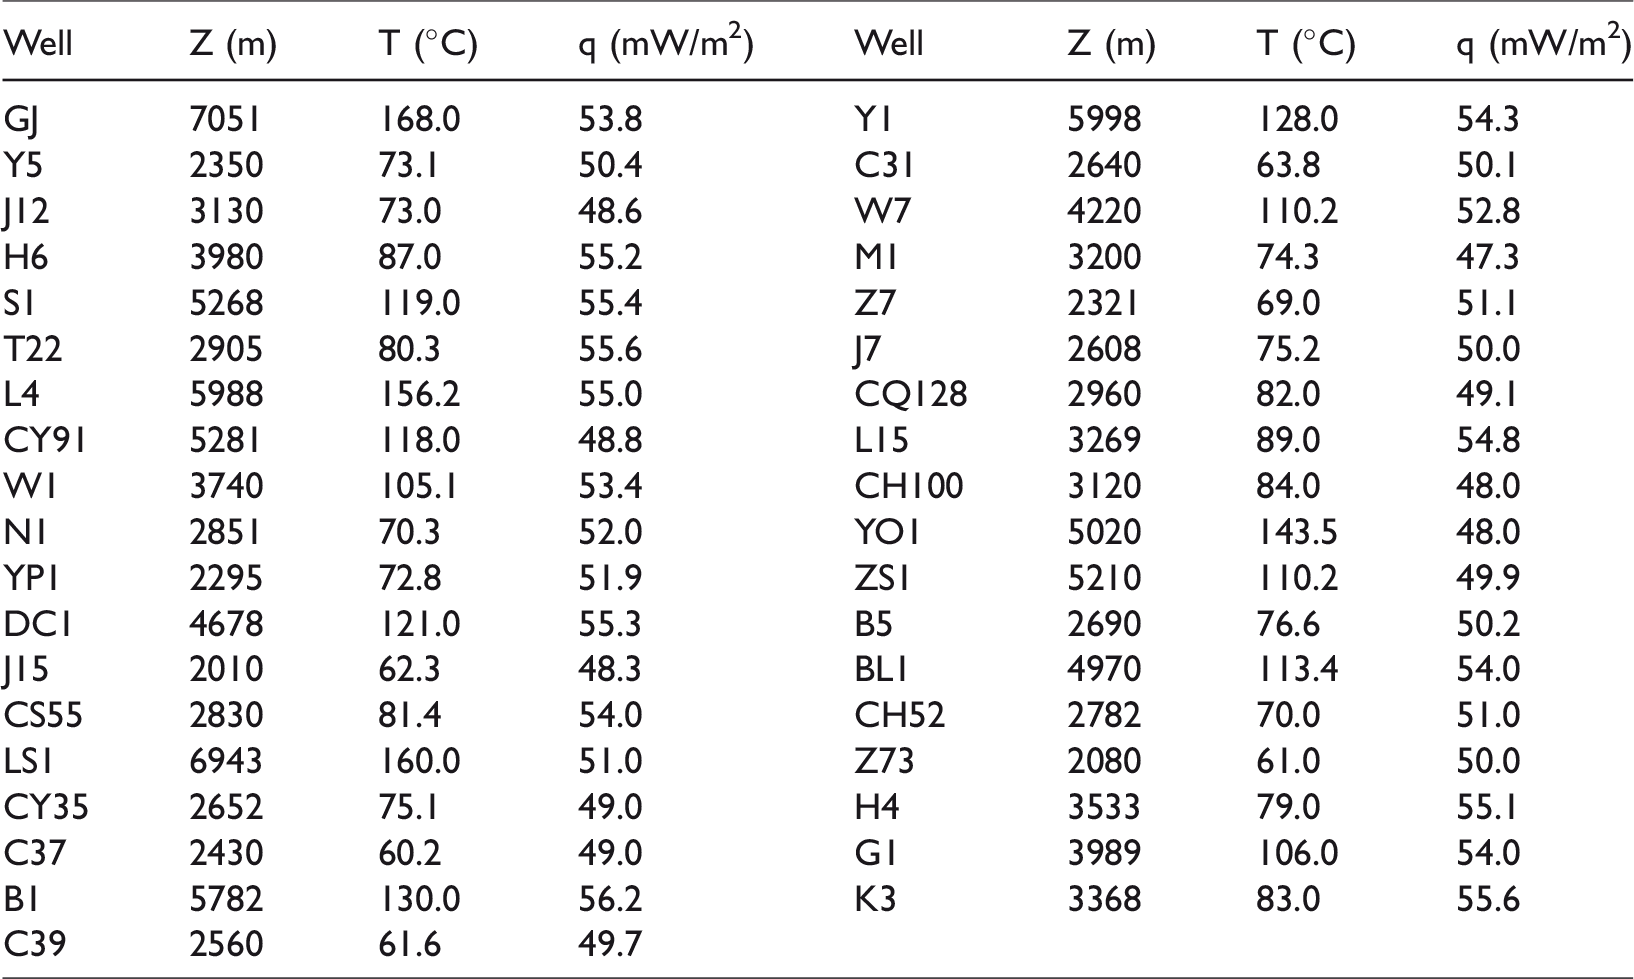
Oil-testing temperature and calculated heat flow.
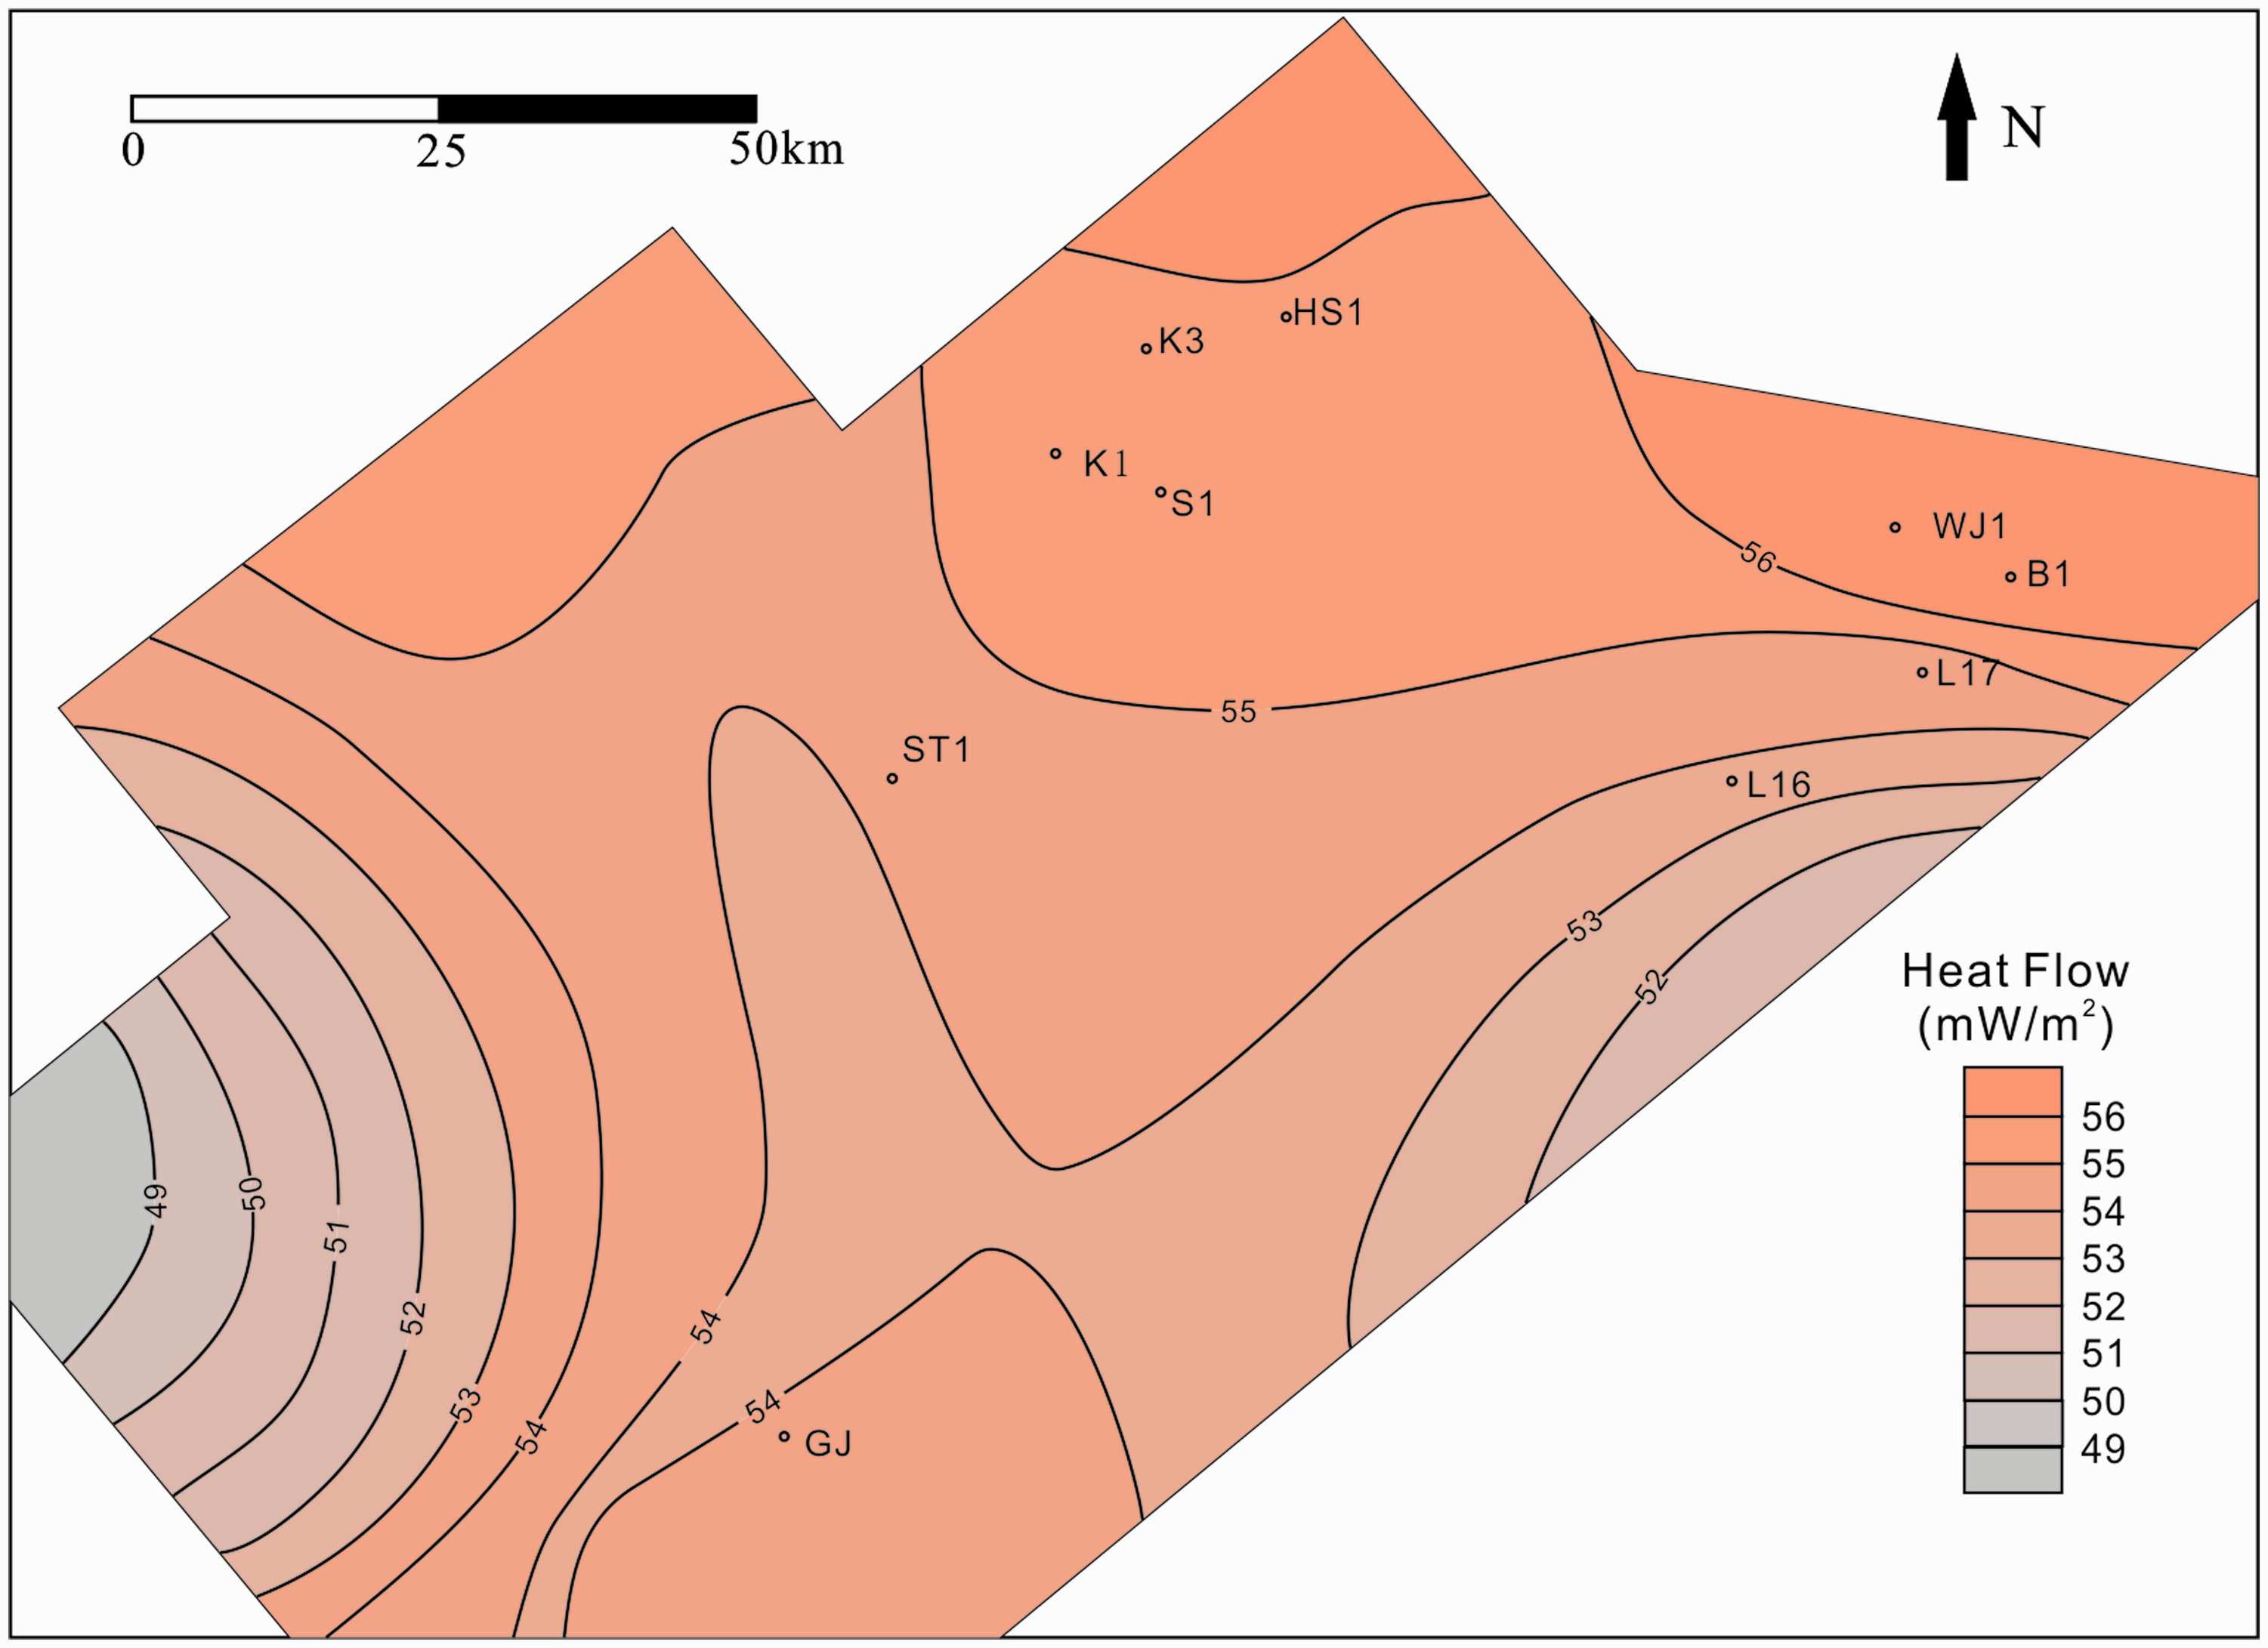
Graph showing the heat flow distribution in the NWSB.
Thermal history reconstruction
This study used the paleo-thermal indicator method to reconstruct the thermal history. The paleo-thermal indicator method has high research accuracy, because thermal modeling results can be directly tested using paleo-thermal indicators. Because different thermal indicators span different temperature ranges, there is potential for the enhanced ability to constrain the thermal histories of basins by integrating interpretations of different thermal indicators. Ro, zircon He (ZHe) ages, ZFT ages, and apatite He (AHe) ages were chosen to reconstruct the thermal history.
Data and interpretations
(U–Th)/He thermochronology of zircon and apatite is an emerging method based on the production of He by the nuclear decay of U and Th in radioactive minerals. Systematic diffusion studies indicate that the apatite He partial retention zone (PRZ) is approximately 40–75°C (Farley, 2000; Wolf et al., 1998), and zircon has a higher He PRZ of approximately 130–190°C (Reiners, 2005; Reiners et al., 2002, 2004). For sample ZT3-1, the ZHe ages of 198.0 ± 12.3 Ma and 169.8 ± 10.5 Ma are slightly younger than the stratigraphic age. This suggests that the maximum paleo-temperature of Triassic strata just entered the PRZ of zircon and the timing of the most recent uplift event was later than Early Jurassic. Four outcrop samples (SS-1, SS-3, BC-3, GX-8) were collected from the Longmen Mountain area. The ZHe ages of the samples gradually decrease as the stratigraphic age increases. The ZHe ages of sample SS-1, SS-3, and GX-8 are younger than the stratigraphic age, which indicates that the maximum paleo-temperature was within the PRZ of zircon and effectively records a Late Triassic cooling event. In contrast, sample BC-3 is significantly younger than the stratigraphic age, which indicates that ZHe ages have been completely reset and records a Cretaceous cooling event. Sample NSH-3 was located in the Micang Mountain area. The ZHe ages, similar to sample BC-3, are significantly younger, which indicates that ZHe ages have been completely reset and records a Cretaceous cooling event. The AHe age between 8.4 ± 0.5 Ma and 36.7 ± 2.3 Ma (Table 2), with its lower closure temperature, is significantly younger than the stratigraphic age and indicates that the apatite has been completely reset. This indicates the rapid uplift of the NWSB in Cenozoic time.
ZFT dating is a well-established low-temperature thermochronology method. The closure temperature is approximately 240 ± 20°C (Bernet, 2009), and the partial annealing zone ranges from 170 to 350°C (Yamada et al., 2007, 1995). The values of P(x2) are zero and their percentage dispersion is greater than 15%, which is typical for overdispersed distributions, showing a mixture of different grain-age components. This means all the ZFTs were not totally reset after deposition. The radiation damage of zircon has an important effect on the annealing temperature. Increasing the radiation damage decreases the total annealing temperature from 330 to 190°C (Bernet and Garver, 2005; Fellin et al., 2006; Garver et al., 2005; Marsellos and Garver, 2010). At present, the uranium content can be taken as a first approximation for the degree of radiation damage. The ZFT single-grain ages from all samples are strongly and inversely correlated with the U concentration (Figure 3). This suggests that the differences in single-grain ZFT ages were affected by differential annealing caused by differences in radiation damage, which resulted in a large difference in single-grain ZFT ages of the same sample. The ZFT central age cannot be analyzed directly because single-grain ZFT ages are too dispersed. To obtain the thermal history information contained in ZFT ages, we used the Raidaplotter software (Vermeesch, 2009) to group the single-grain ages of samples of different ages (Figure 4). For sample ZT3-2, the ZFT age could be separated to two age groups. The younger population (89.5 ± 4.5 Ma) effectively records a Late Cretaceous cooling event. Some zircon grains reflect an apparent older population that may also have been partially annealed and originally had an older provenance age, and thus, their ages reflect mixed ages. For samples NSH-3 and SS-1, their ages could also be separated to two age groups. Younger populations of 220 ± 20 Ma and 212 ± 40 Ma both record a Late Triassic cooling event.
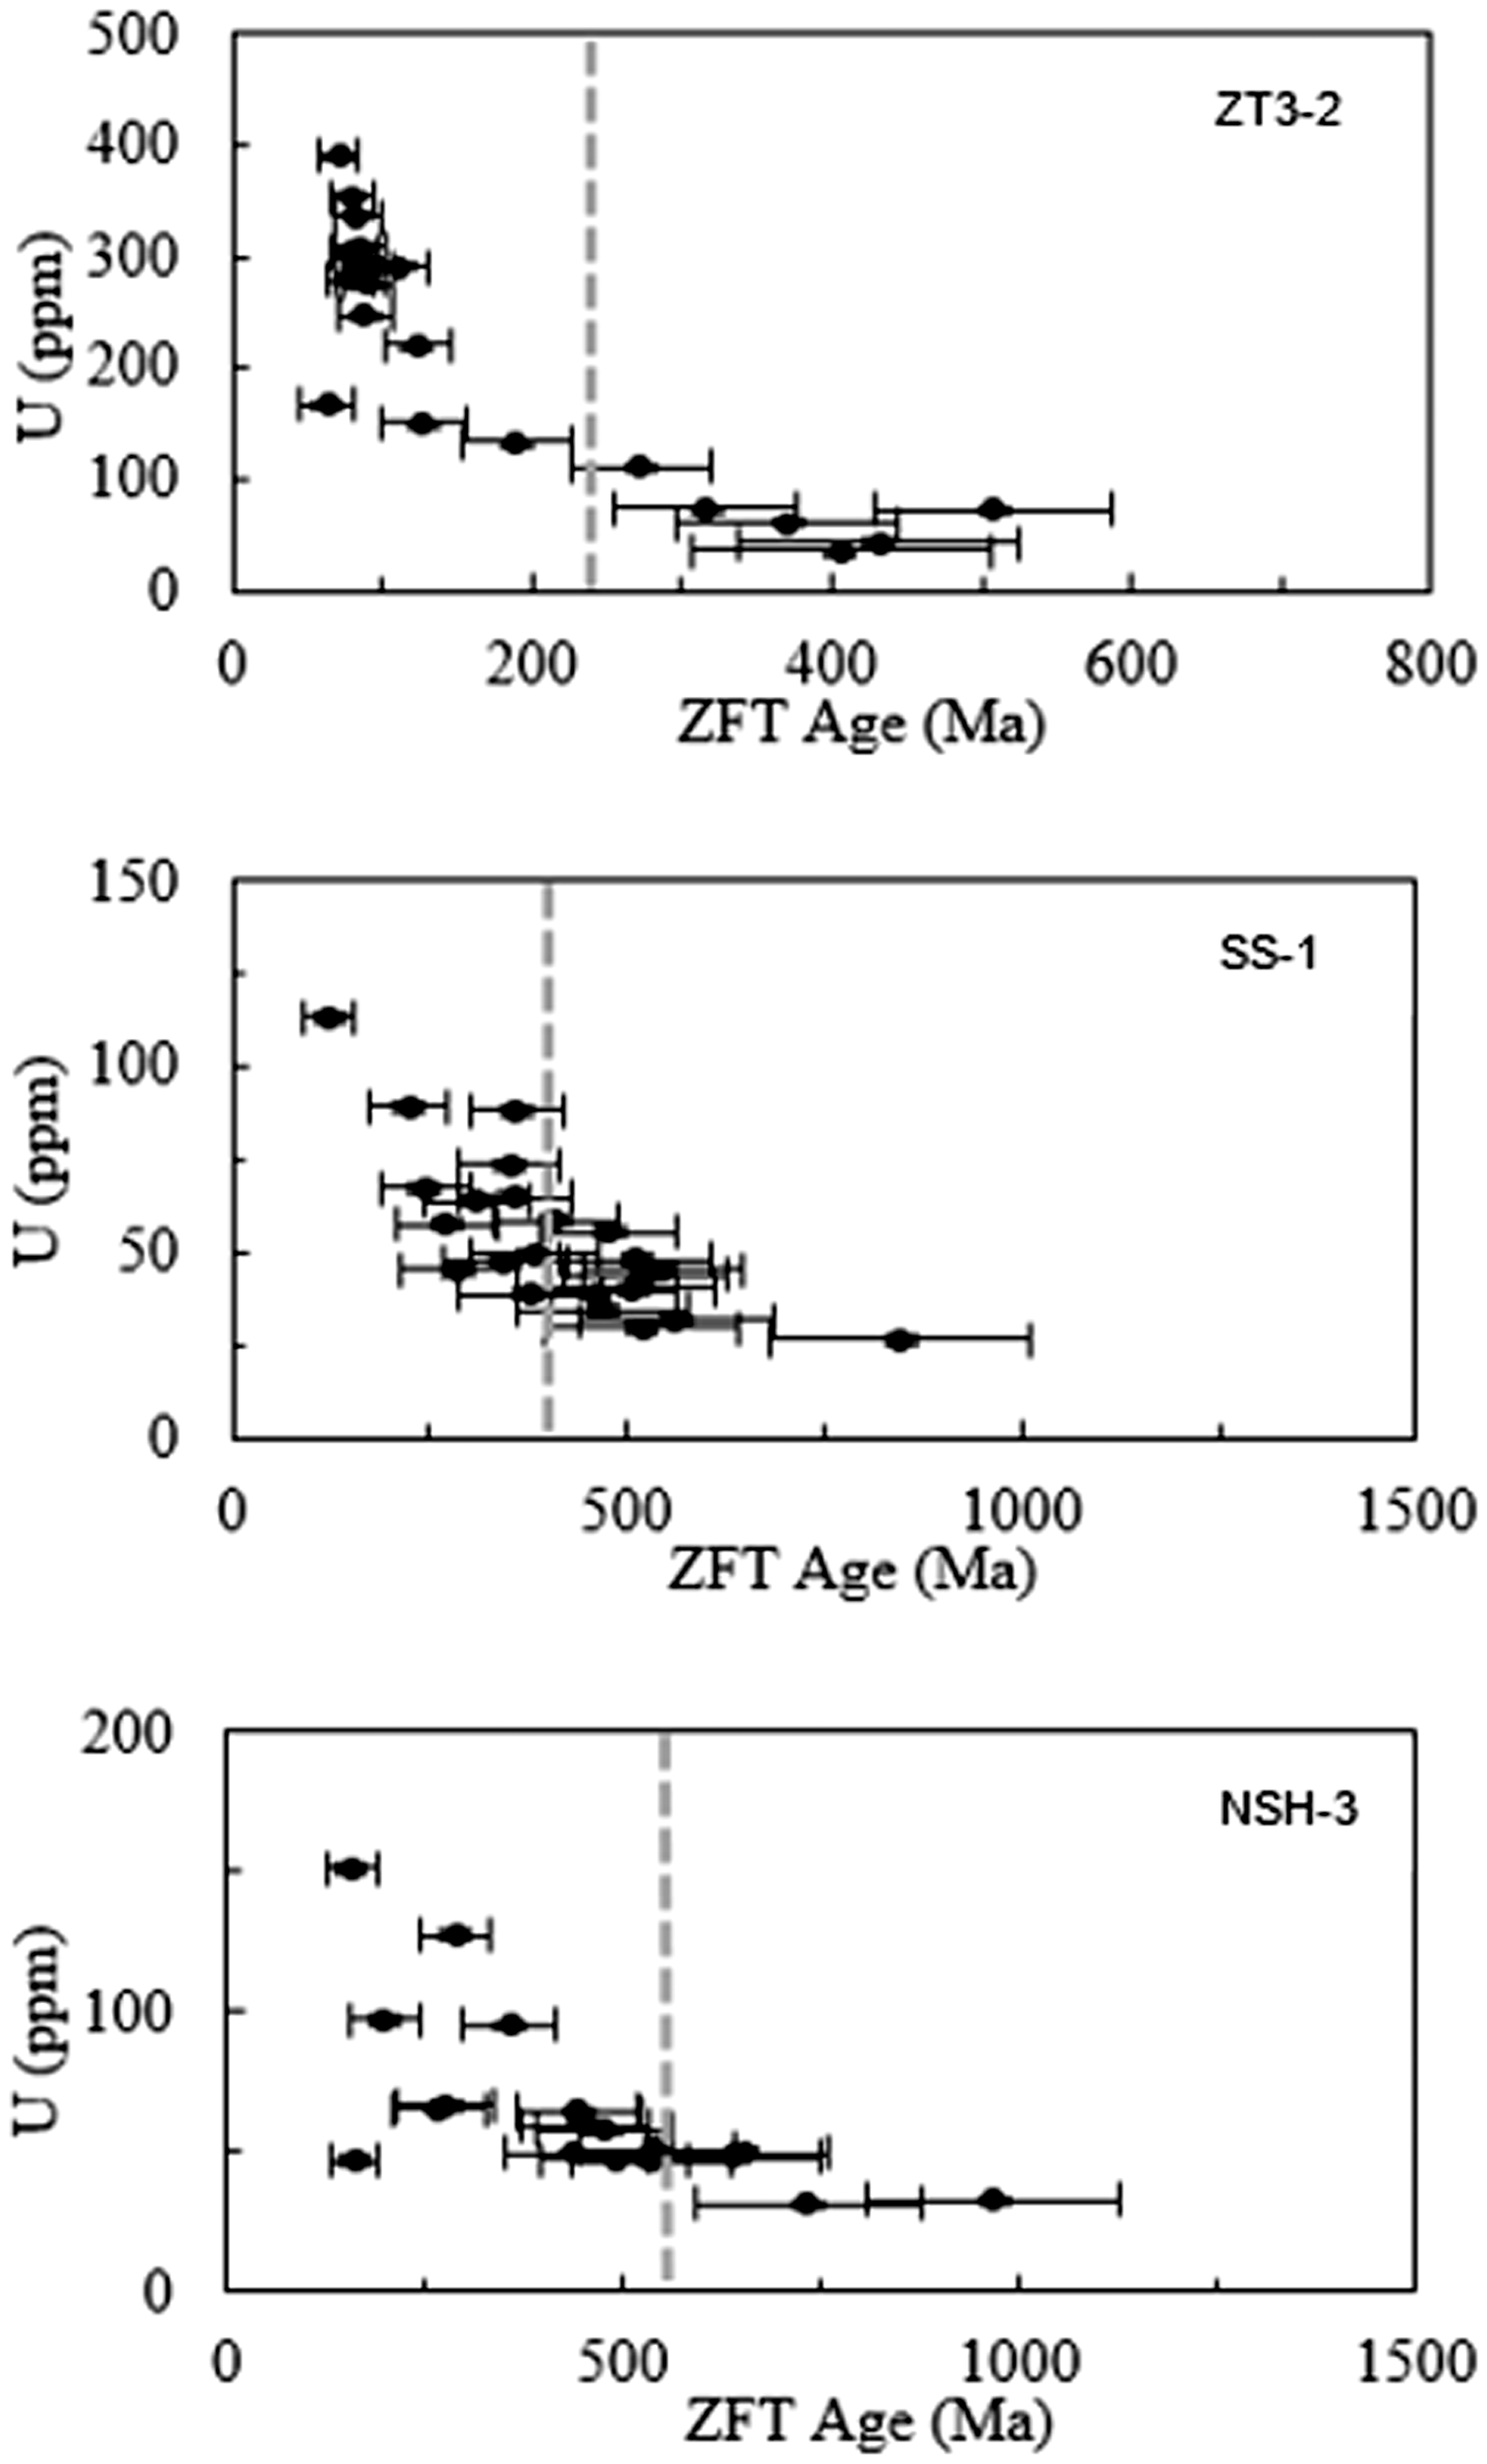
Graph showing the single-grain ZFT ages versus uranium content. The dashed lines indicate the interpreted depositional ages of the samples.
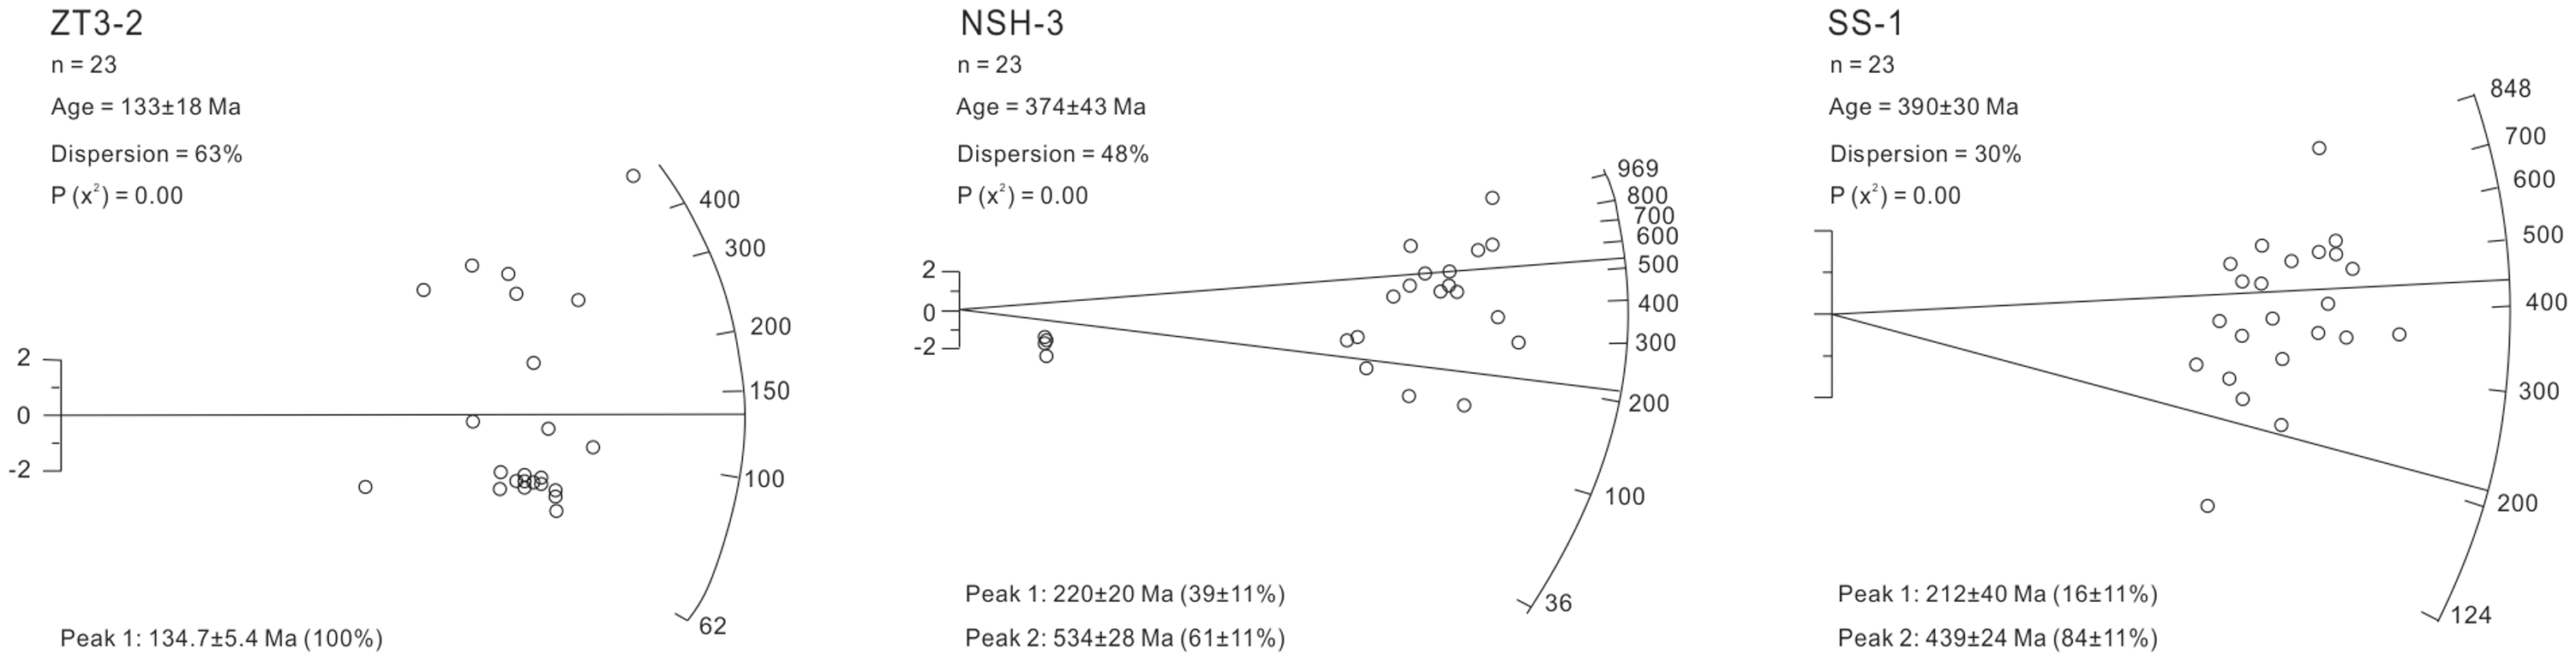
Radial plots with age peaks of zircon samples (calculated using RadialPlotter; Vermeesch, 2009).
2. Thermal history inversion
The temperature histories of samples ZT3-1, SS-3, GX8, NSH-3 were modeled using the HeFTy software (version 1.9.1) by Ketcham (2005) to better understand the thermal history of the NWSB. In our modeling, 5000–10,000 thermal paths were developed using the Monte Carlo inverse modeling method, in which the best-fit time–Temperature (t–T) path model indicates the thermal history of the sample. A t–T path was regarded as the effective thermal history of a sample when the difference between the calculated and measured thermal indicator values was at a minimum. The timing of tectonic thermal events and temperature paths, and possibly the burial history of the sample, can be constrained from (U–Th)/He ages and ZFT ages. To model the He ages, we used the apatite model of Farley (2000) and the zircon model of Reiners et al. (2004). The present surface and paleo-surface temperature in our modeling were set to 20°C over the geological time. The present-day temperature of sample ZT3-1 that was used in the model was calculated based on the surface temperature, the present-day geothermal gradient as mentioned above, and the burial depth of the sample (Table 1). Sedimentation, uplift, and/or erosion would have produced changes in the paleo-temperature of the strata. For sample NSH-3, the AHe and ZHe data are integrated for the thermal simulation. Only the ZHe data were used for the thermal modeling of samples SS-3, GX-8, and ZT3-1.
The thermal modeling results of samples SS-3 and GX-8 show that the Longmen Mountain area was characterized by long-term deposition from the Permian to the Triassic, during which the burial temperature of these two samples gradually increased (Figure 5). Then, this area experienced cooling beginning at 210 Ma (Late Triassic). Sample ZT3-1, in the NWSB low-flat fold zone, reached maximum temperature in the Late Cretaceous, then experienced rapid cooling in which the temperature decreased by approximately 40°C (Figure 5). The t–T path evolution of sample NSH-3 indicates heating to 160–170°C during the Late Jurassic to Early Cretaceous, and subsequent cooling (Figure 5).
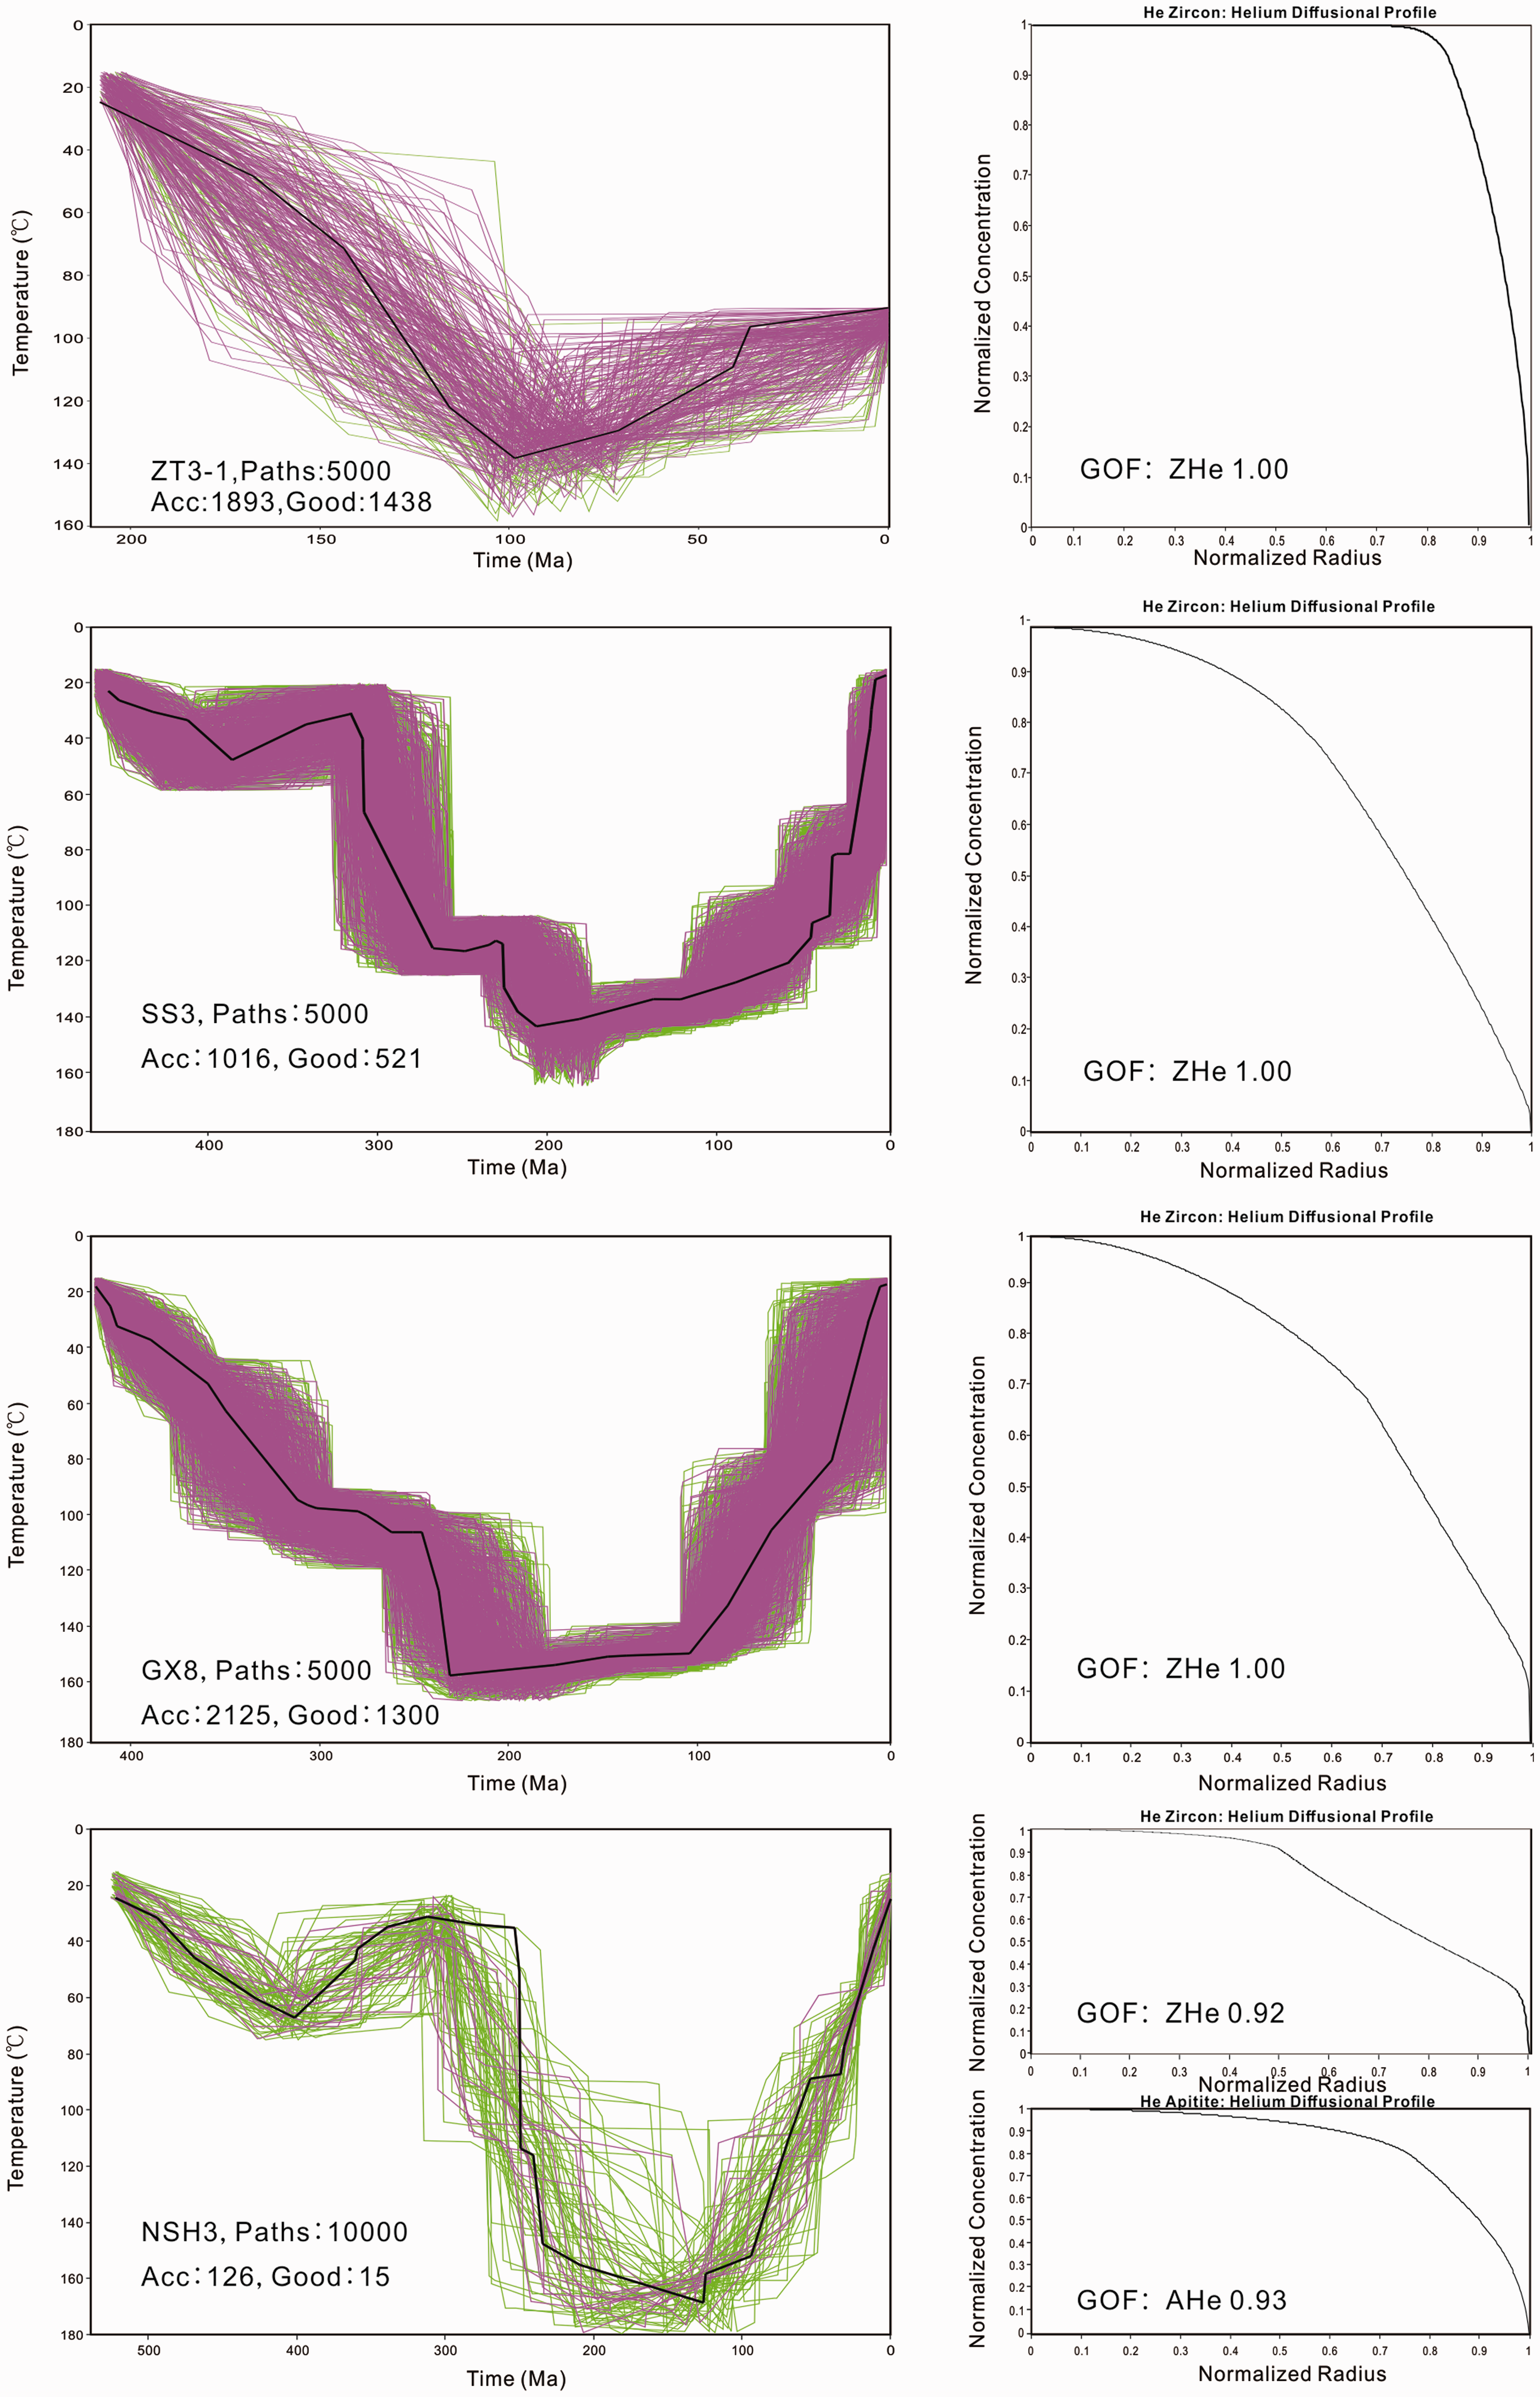
Graph showing the time–temperature evolution histories of the samples. Green line: acceptable fit (GOF > 0.05); magenta lines: good fit (GOF > 0.5). ACC: acceptable; GOF: goodness of fit.
3. Heat flow evolution
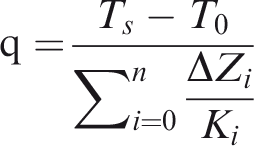
It is well known that Ro data can be used as a constraint to simulate the paleo-heat flow history (Li et al., 2015). Constrained by the inversion results, the heat flow evolution was assessed using the BasinMod 1D software in this study based on the Easy%Ro model (Sweeney and Burnham, 1990). We first rebuilt the sedimentary burial history using the compaction and porosity exponential reducing factors of Sclater and Christie (1980). Thickness, top depth, and average lithologies of units in wells were obtained from well completion reports, which were provided by the PetroChina Southwest Oil and Gas Field. Second, the measured Ro data and the present heat flow values were input as the constraints. Third, assuming a heat flow evolution path, if the modeled Ro values are consistent with the measured Ro data, the heat flow path is considered to be the real heat flow evolution path. Alternatively, we repeatedly modified the heat flow path using forward modeling to compare the modeled Ro paths to the measured Ro data. In this study, six wells were used to study heat flow (Figure 6). The heat flow rapidly decreased from the Late Permian to the Late Triassic, with a maximum value of approximately 70–90 mW/m2. Due to thermal subsidence during the Cenozoic, the heat flow gradually decreased to its present value of 47–55 mW/m2.
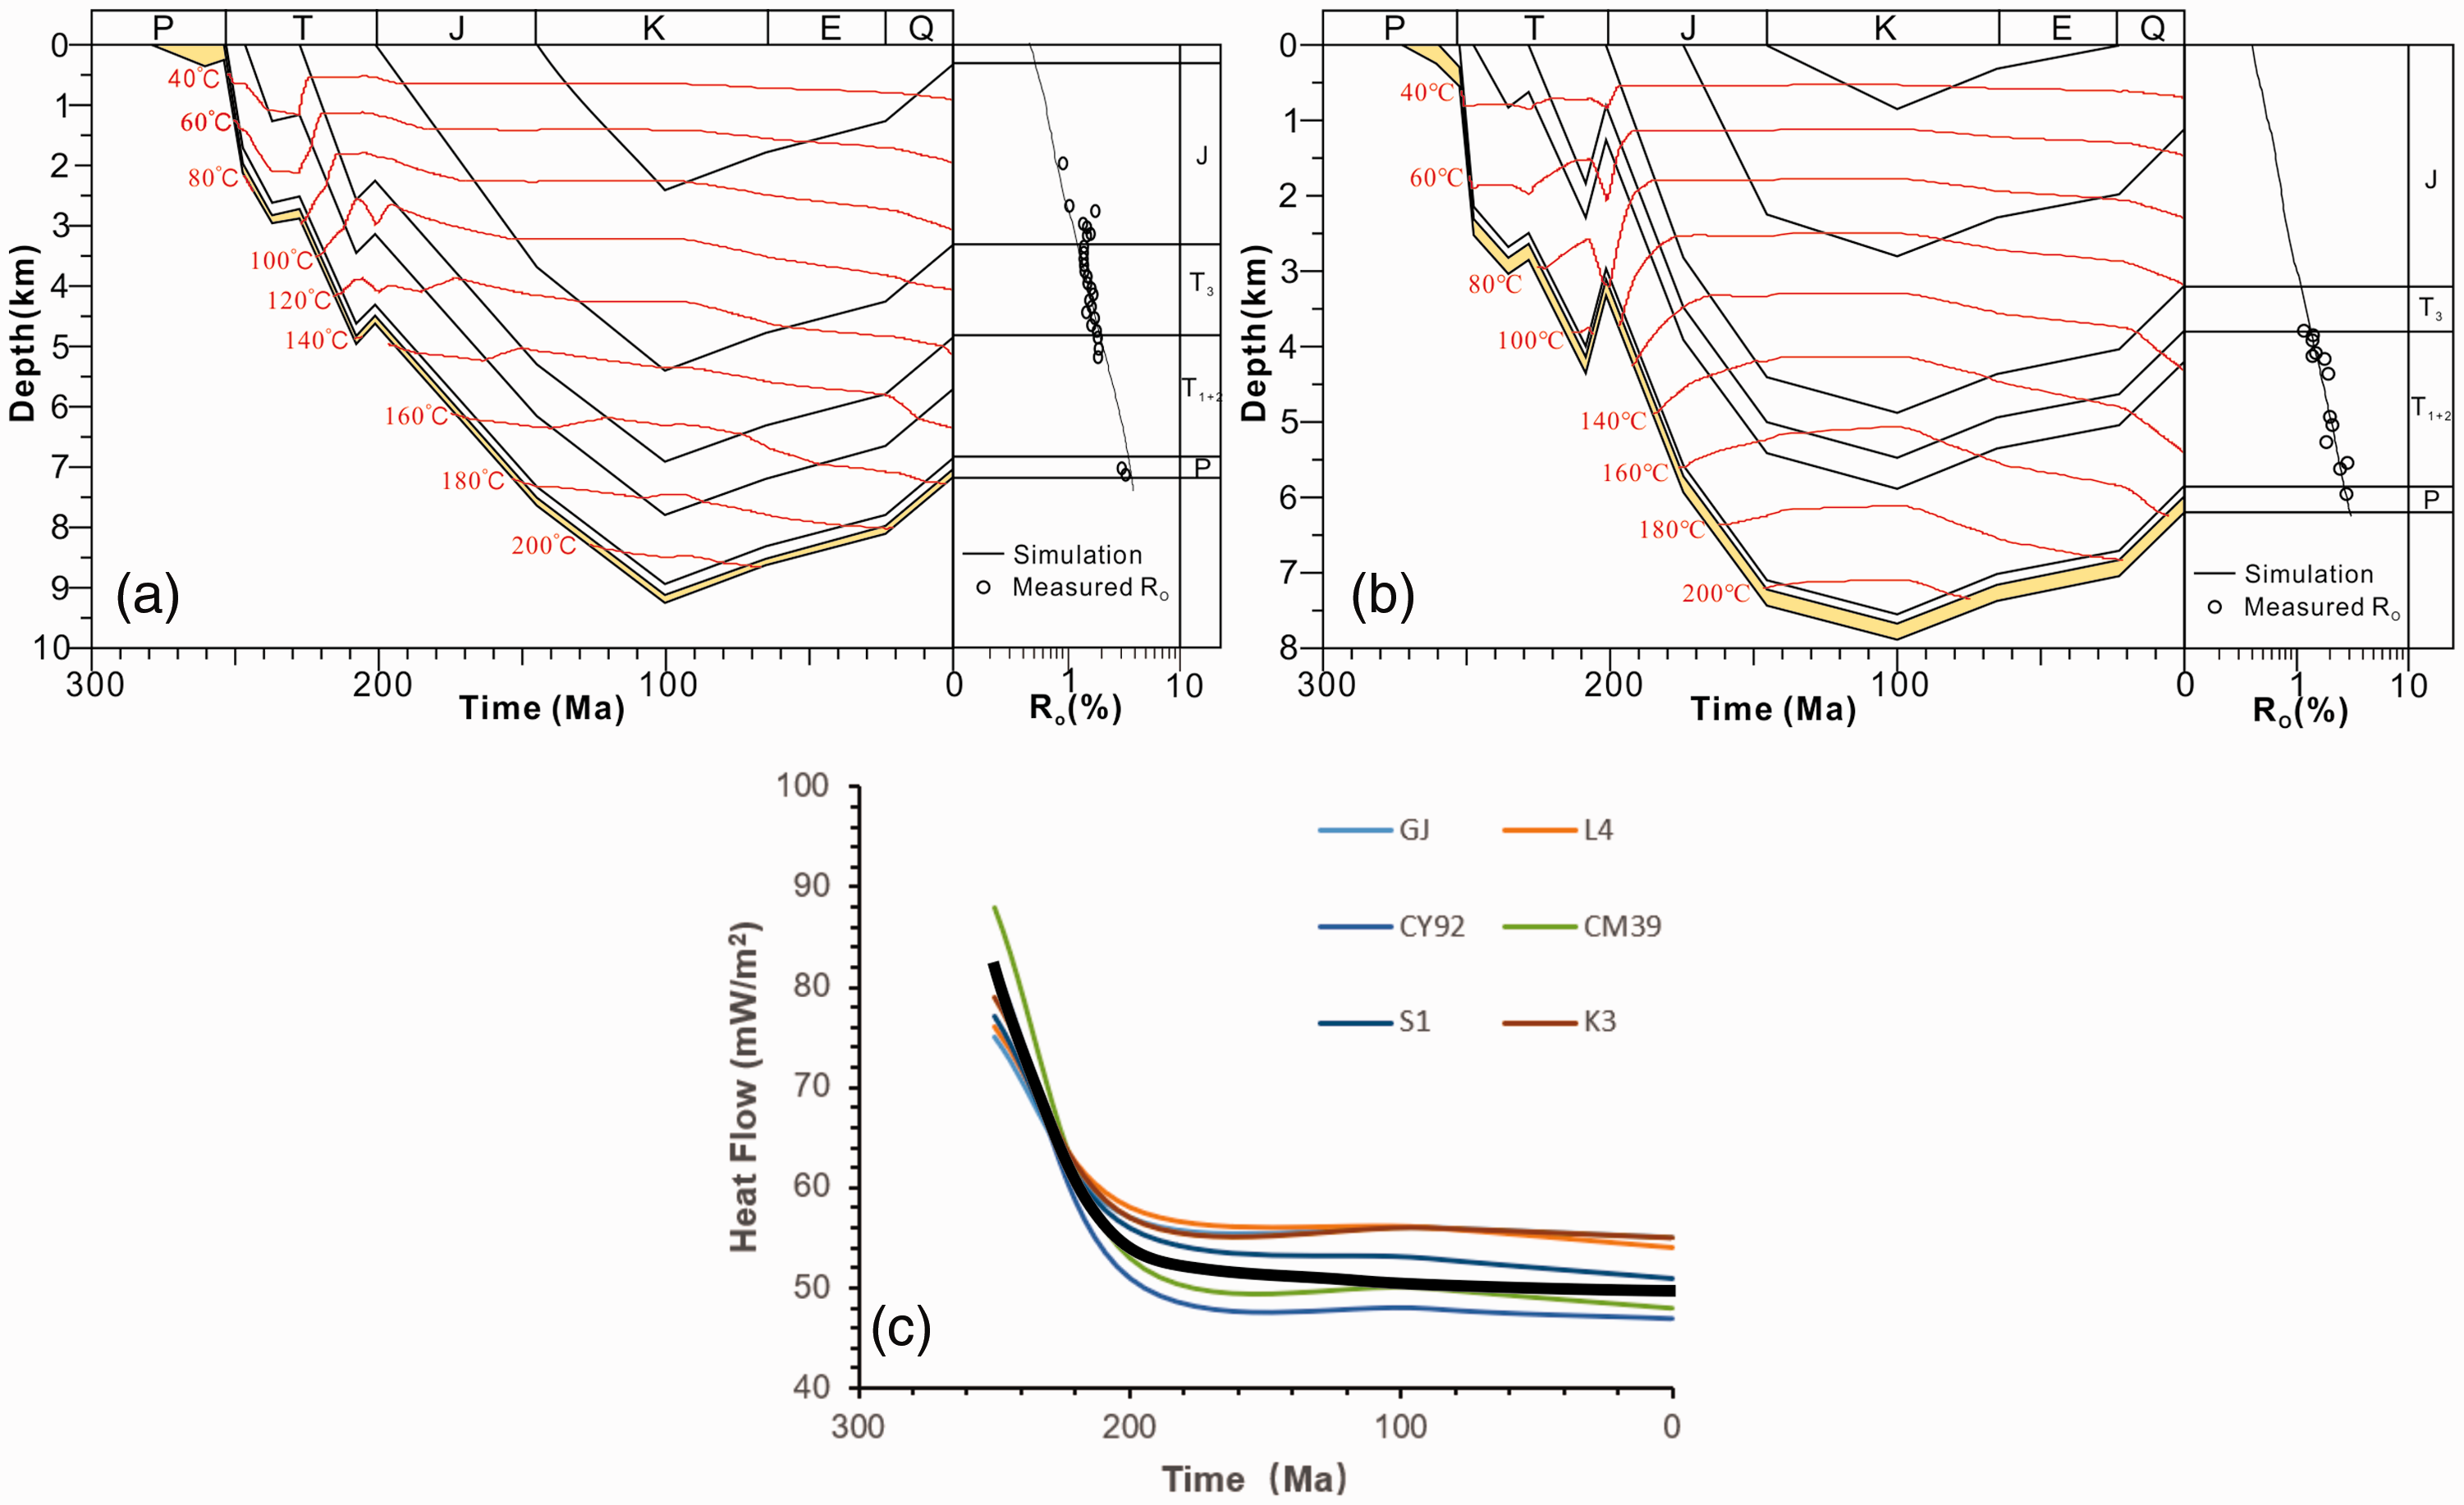
(a) Burial and temperature history for Well GJ and results for the correlation of measured and simulated Ro data, indicated with the black line. (b) Burial and temperature history for Well L4 and results for the correlation of measured and simulated Ro data, indicated with the black line. (c) The heat flow evolution histories of the NWSB. The thick black line is the average of the modeled paths of the chosen wells.
Pressure evolution characteristics
Pressure system
The modern pore pressure can be evaluated through two distinct approaches, including direct measurement and indirect calculation. The measured pressure, such as from wireline repeat formation testers and drill-stem tests (DSTs), can be used to determine the pore pressure in permeable lithologies. However, pore pressure in fine-grained lithologies (e.g. thick shales) can be derived only through indirect indicators such as sonic logs, weight and viscosity of the drilling mud, salinity of the formation water, etc. In this study, the pressure coefficient (r, the ratio of the pore pressure to the hydrostatic pressure at the same depth) was used to describe the presence and magnitude of abnormal pressure and the overpressure, which is defined as r > 1.10.
Measured DSTs pressure data of NWSB.
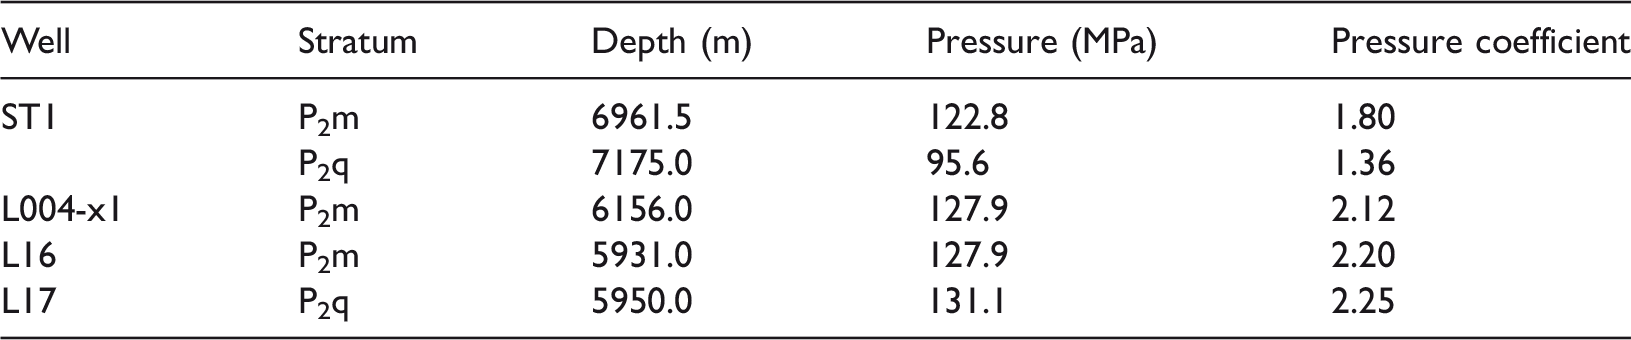
DST: drill-stem test; NWSB: northwest Sichuan Basin.
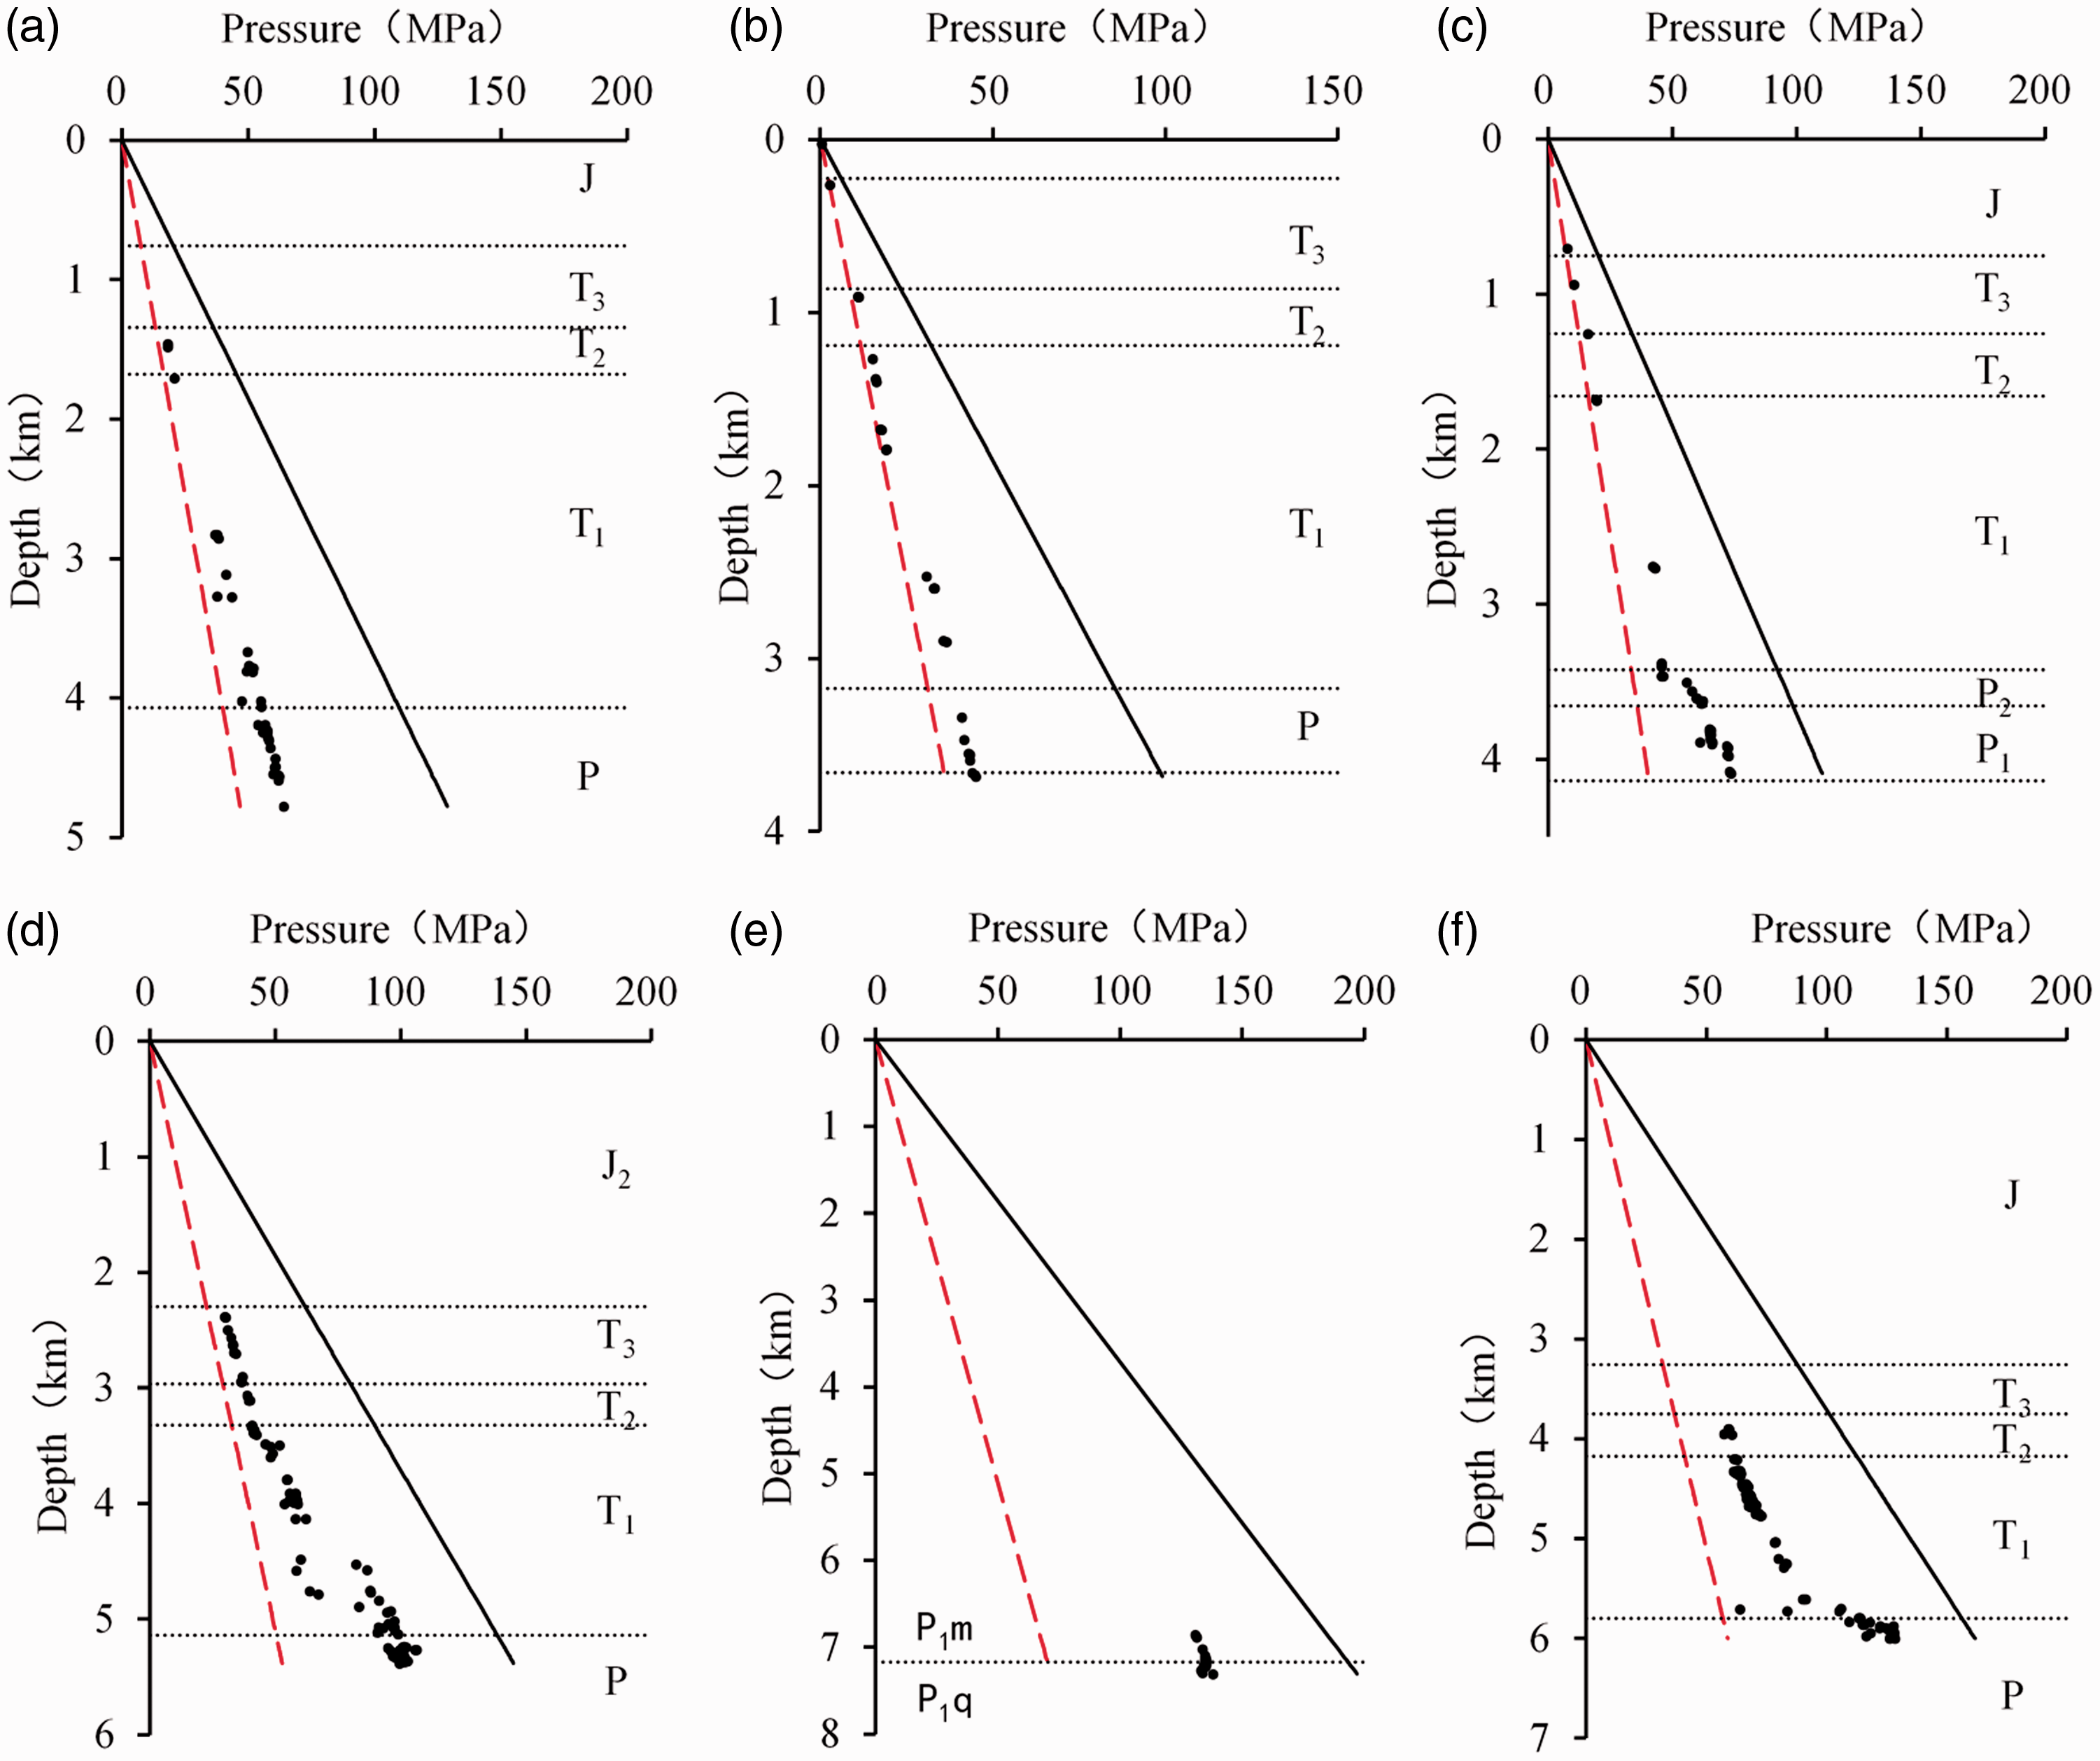
Graph showing the mud weights in six wells. Red dotted lines are hydrostatic pressure, black lines are lithostatic pressure. (a) Well K1, (b) Well K3, (c) Well WJ1, (d) Well S1, (e) Well ST1, and (f) Well B1.
According to the DSTs and mud weight data, the Middle Permian is slightly overpressured in the piedmont belt (e.g. the Kuangshanliang area); is extensively overpressured in the Wujiaba, Shejianhe, Shuangyushi areas; and shows ultra-high overpressure in the Jiulongshan and Zhangjiabian areas (Figure 8).
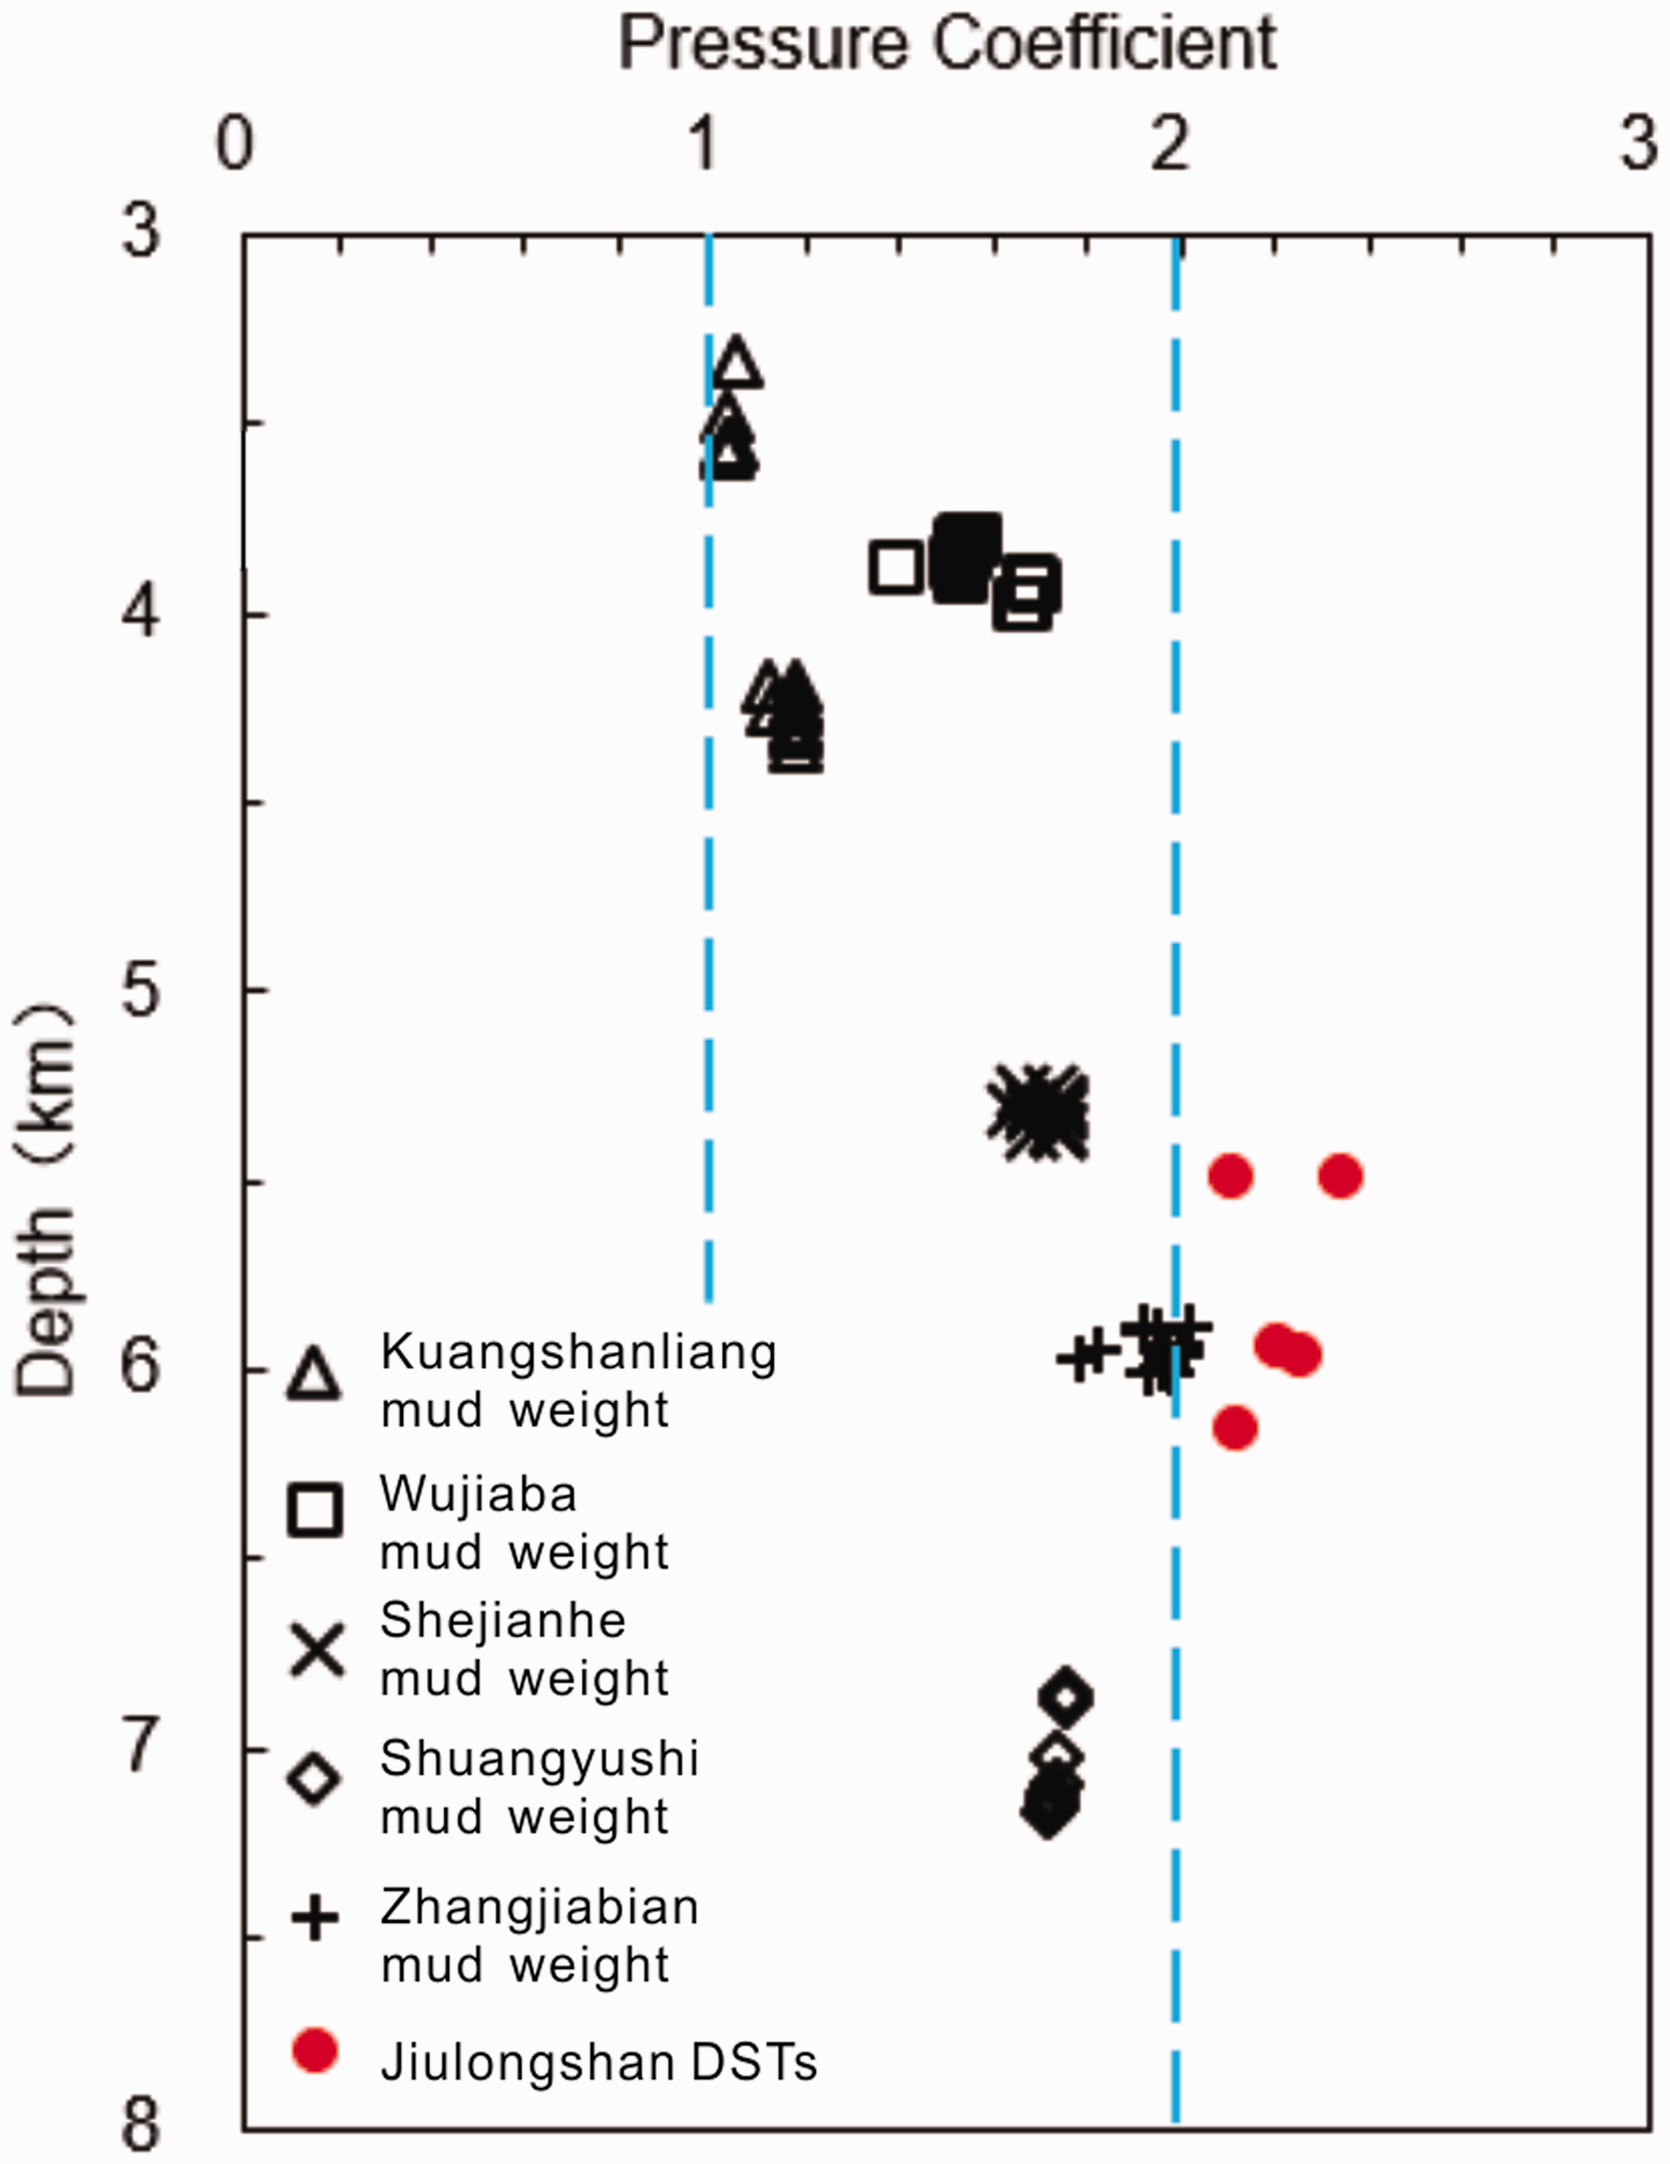
Graph showing the pressure coefficient distribution of P2m in the NWSB.
Pressure evolution modeling
Well GJ is located in the west part of the Laoguanmiao tectonic zone, which has been subjected to three episodes of tectonic uplift during the Early Triassic, Middle Triassic, and Late Cretaceous. Figure 9(a) shows the pressure evolution of P2m. The overpressure began in the Middle–Late Triassic, but soon decreased to normal pressure. From the Jurassic, the overpressure increased rapidly, reaching a maximum during the Late Cretaceous. The pressure coefficient is approximately 1.7–1.8. With the rapid uplift that began in the Late Cretaceous, the pressure in the P2m decreased rapidly, but some pressure remained.
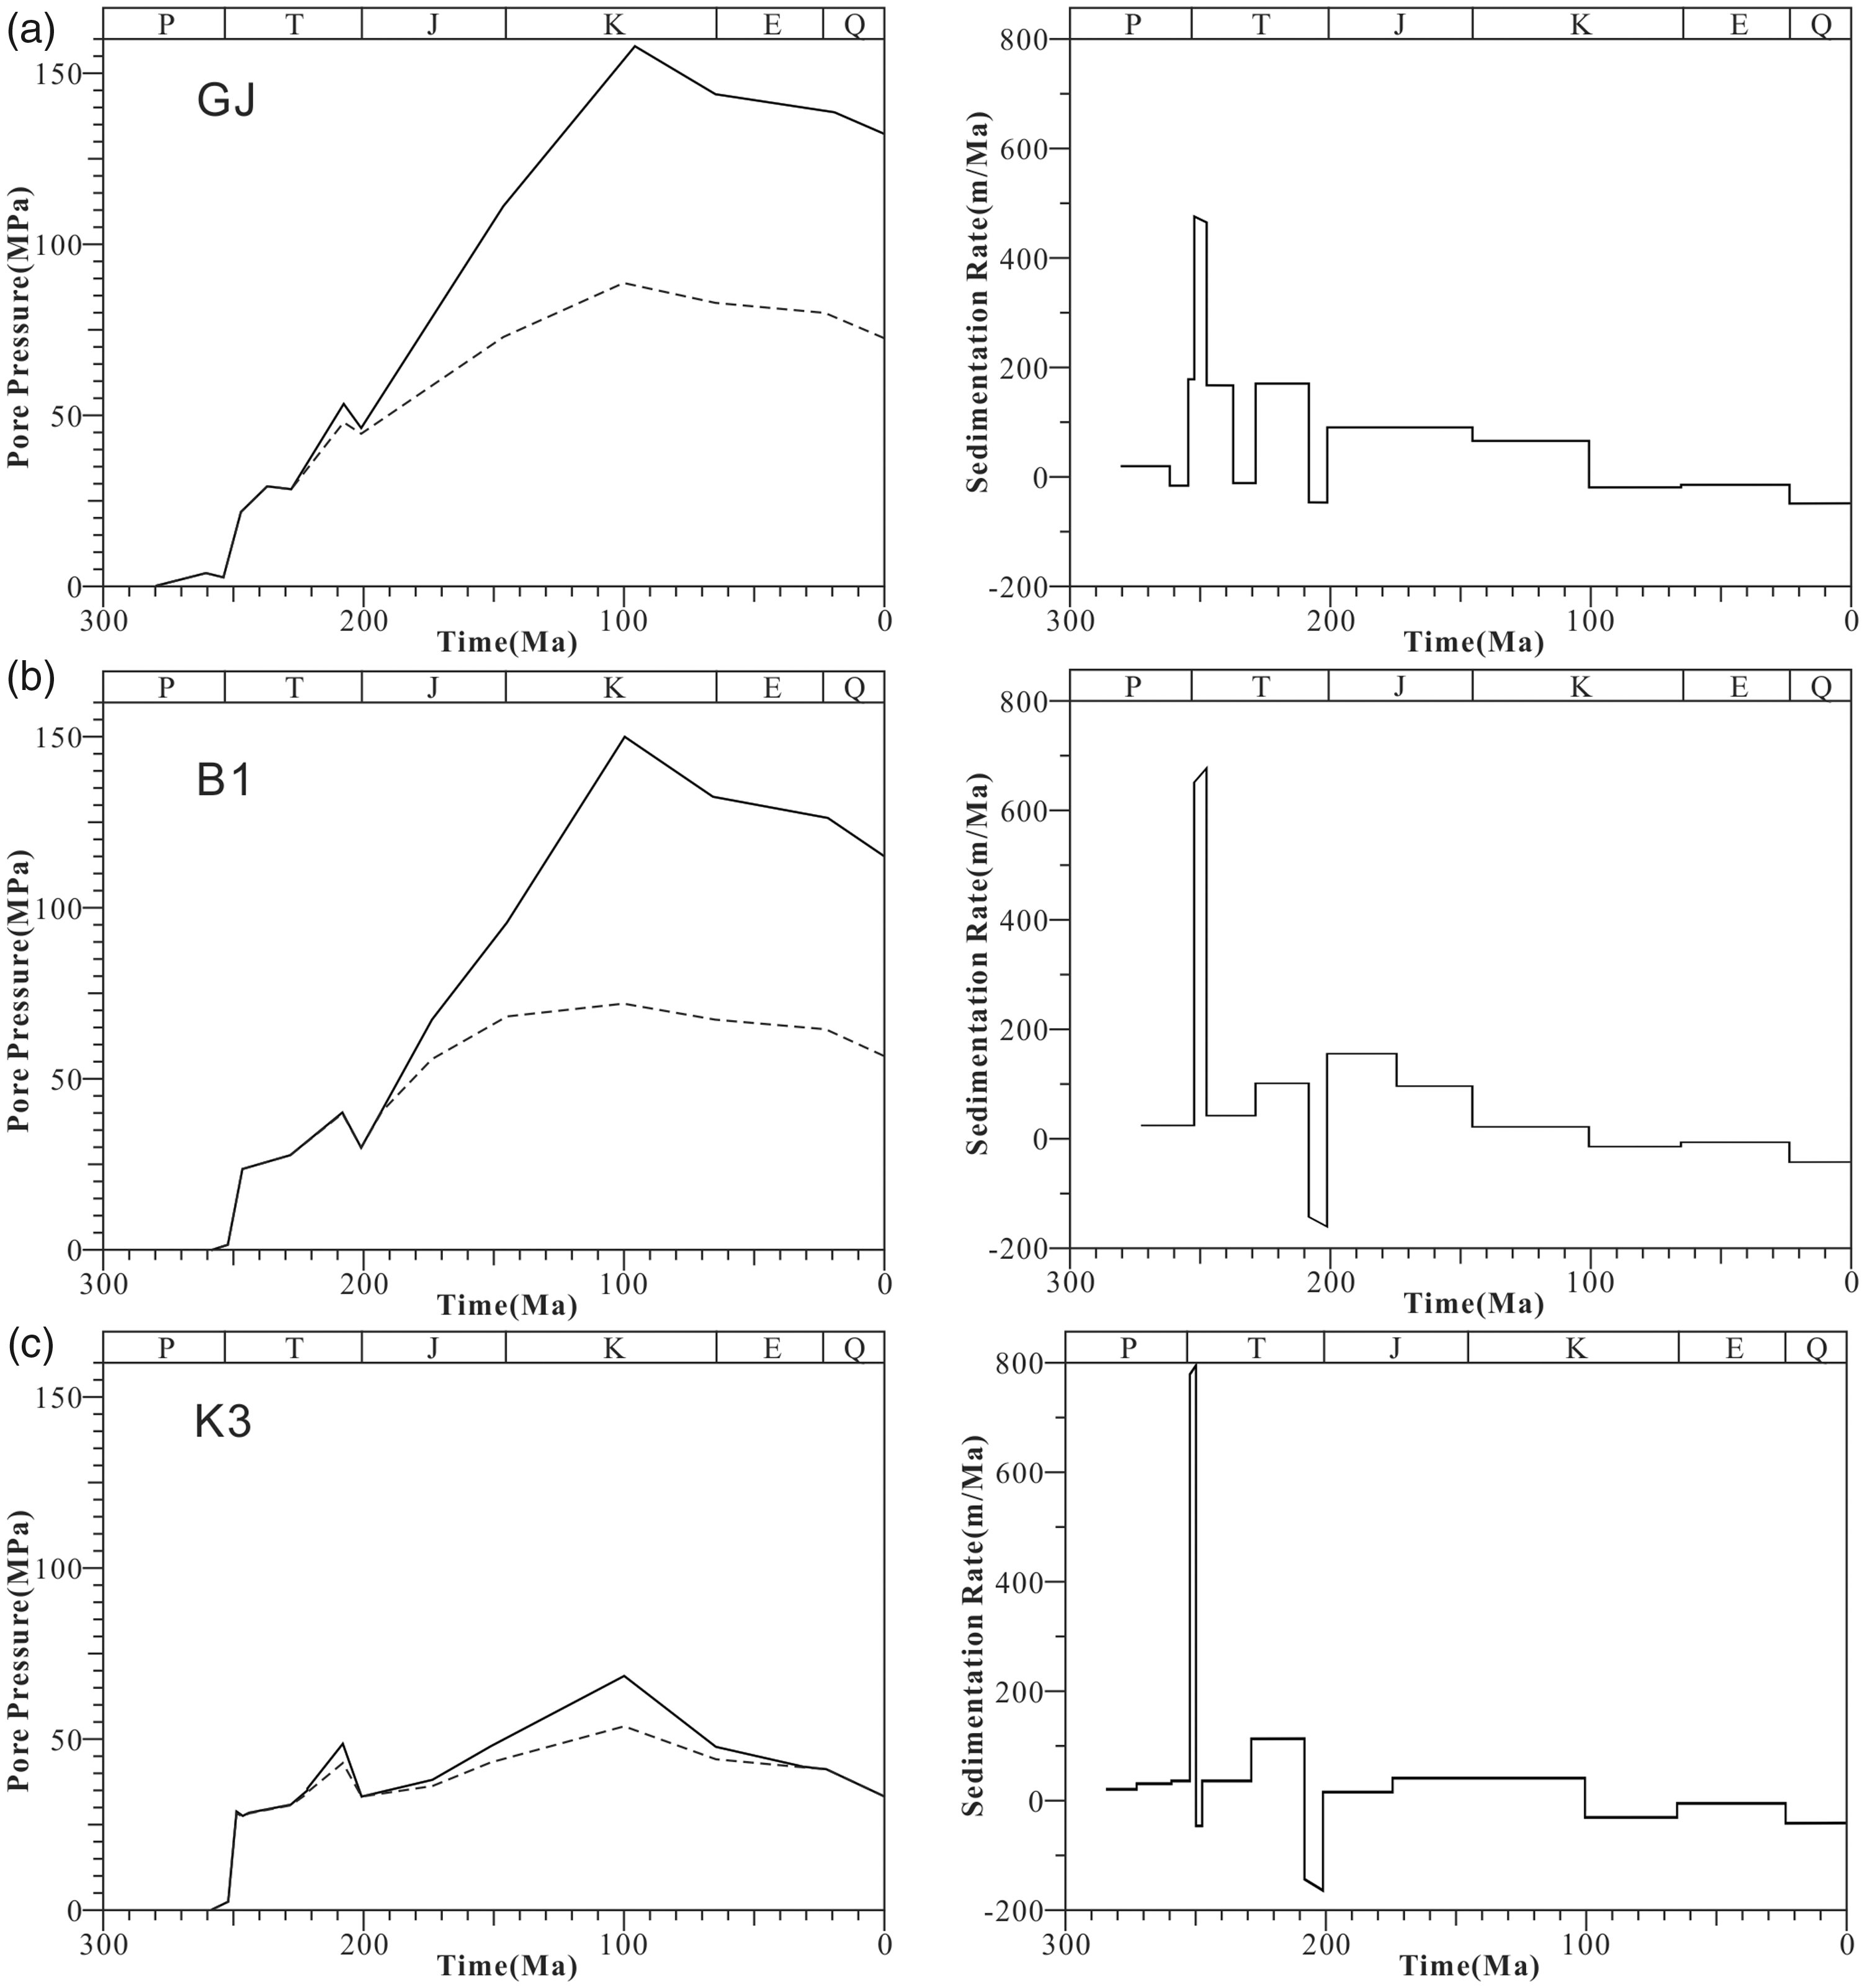
Graph showing the pressure evolution (left) and sedimentation rate (right) of P2m of typical wells. Dotted lines are hydrostatic pressure. (a) GJ Well, (b) B1 Well, and (c) K3 Well.
Well B1 is located in the central part of the Zhangjiabian tectonic zone, which has been subjected to two episodes of tectonic uplift during the Middle Triassic and the Late Cretaceous. Figure 9(b) shows the pressure evolution of P2m. The overpressure began in the Jurassic and reached a maximum during the Late Cretaceous. However, the degree of overpressure is lower. With the uplift that began in the Late Cretaceous, the pressure in the P2m was reduced, but overpressure remains.
Well K3 is located in the central part of the Kuangshanliang tectonic zone. The pressure evolution (Figure 9(c)) shows that, similar to Well GJ, the overpressure of P2m began in the Middle–Late Triassic, but quickly dissipated. From the Jurassic, the overpressure increased, reaching the weak overpressure during the Late Cretaceous. With the uplift that began in the Late Cretaceous, the pressure in P2m was reduced to normal.
Furthermore, the P2m pressure evolution in the other three wells was modeled using the above methods. The other wells show similar modeling results. Overall, the pressure evolution of the Middle Permian can be divided into three stages (Figure 10): (1) a short overpressure stage from the Middle Triassic to the end of the Triassic, during which excess pressure was approximately 10 MPa; (2) an overpressure stage from the Early Jurassic to the Late Cretaceous, with maximum excess pressure of approximately 50–70 MPa in the fold zone and approximately 10–20 MPa in the fault zone; and (3) an overpressure reduction stage from the Late Cretaceous onward, during which overpressure disappeared in the fault zone but remained in the fold zone.
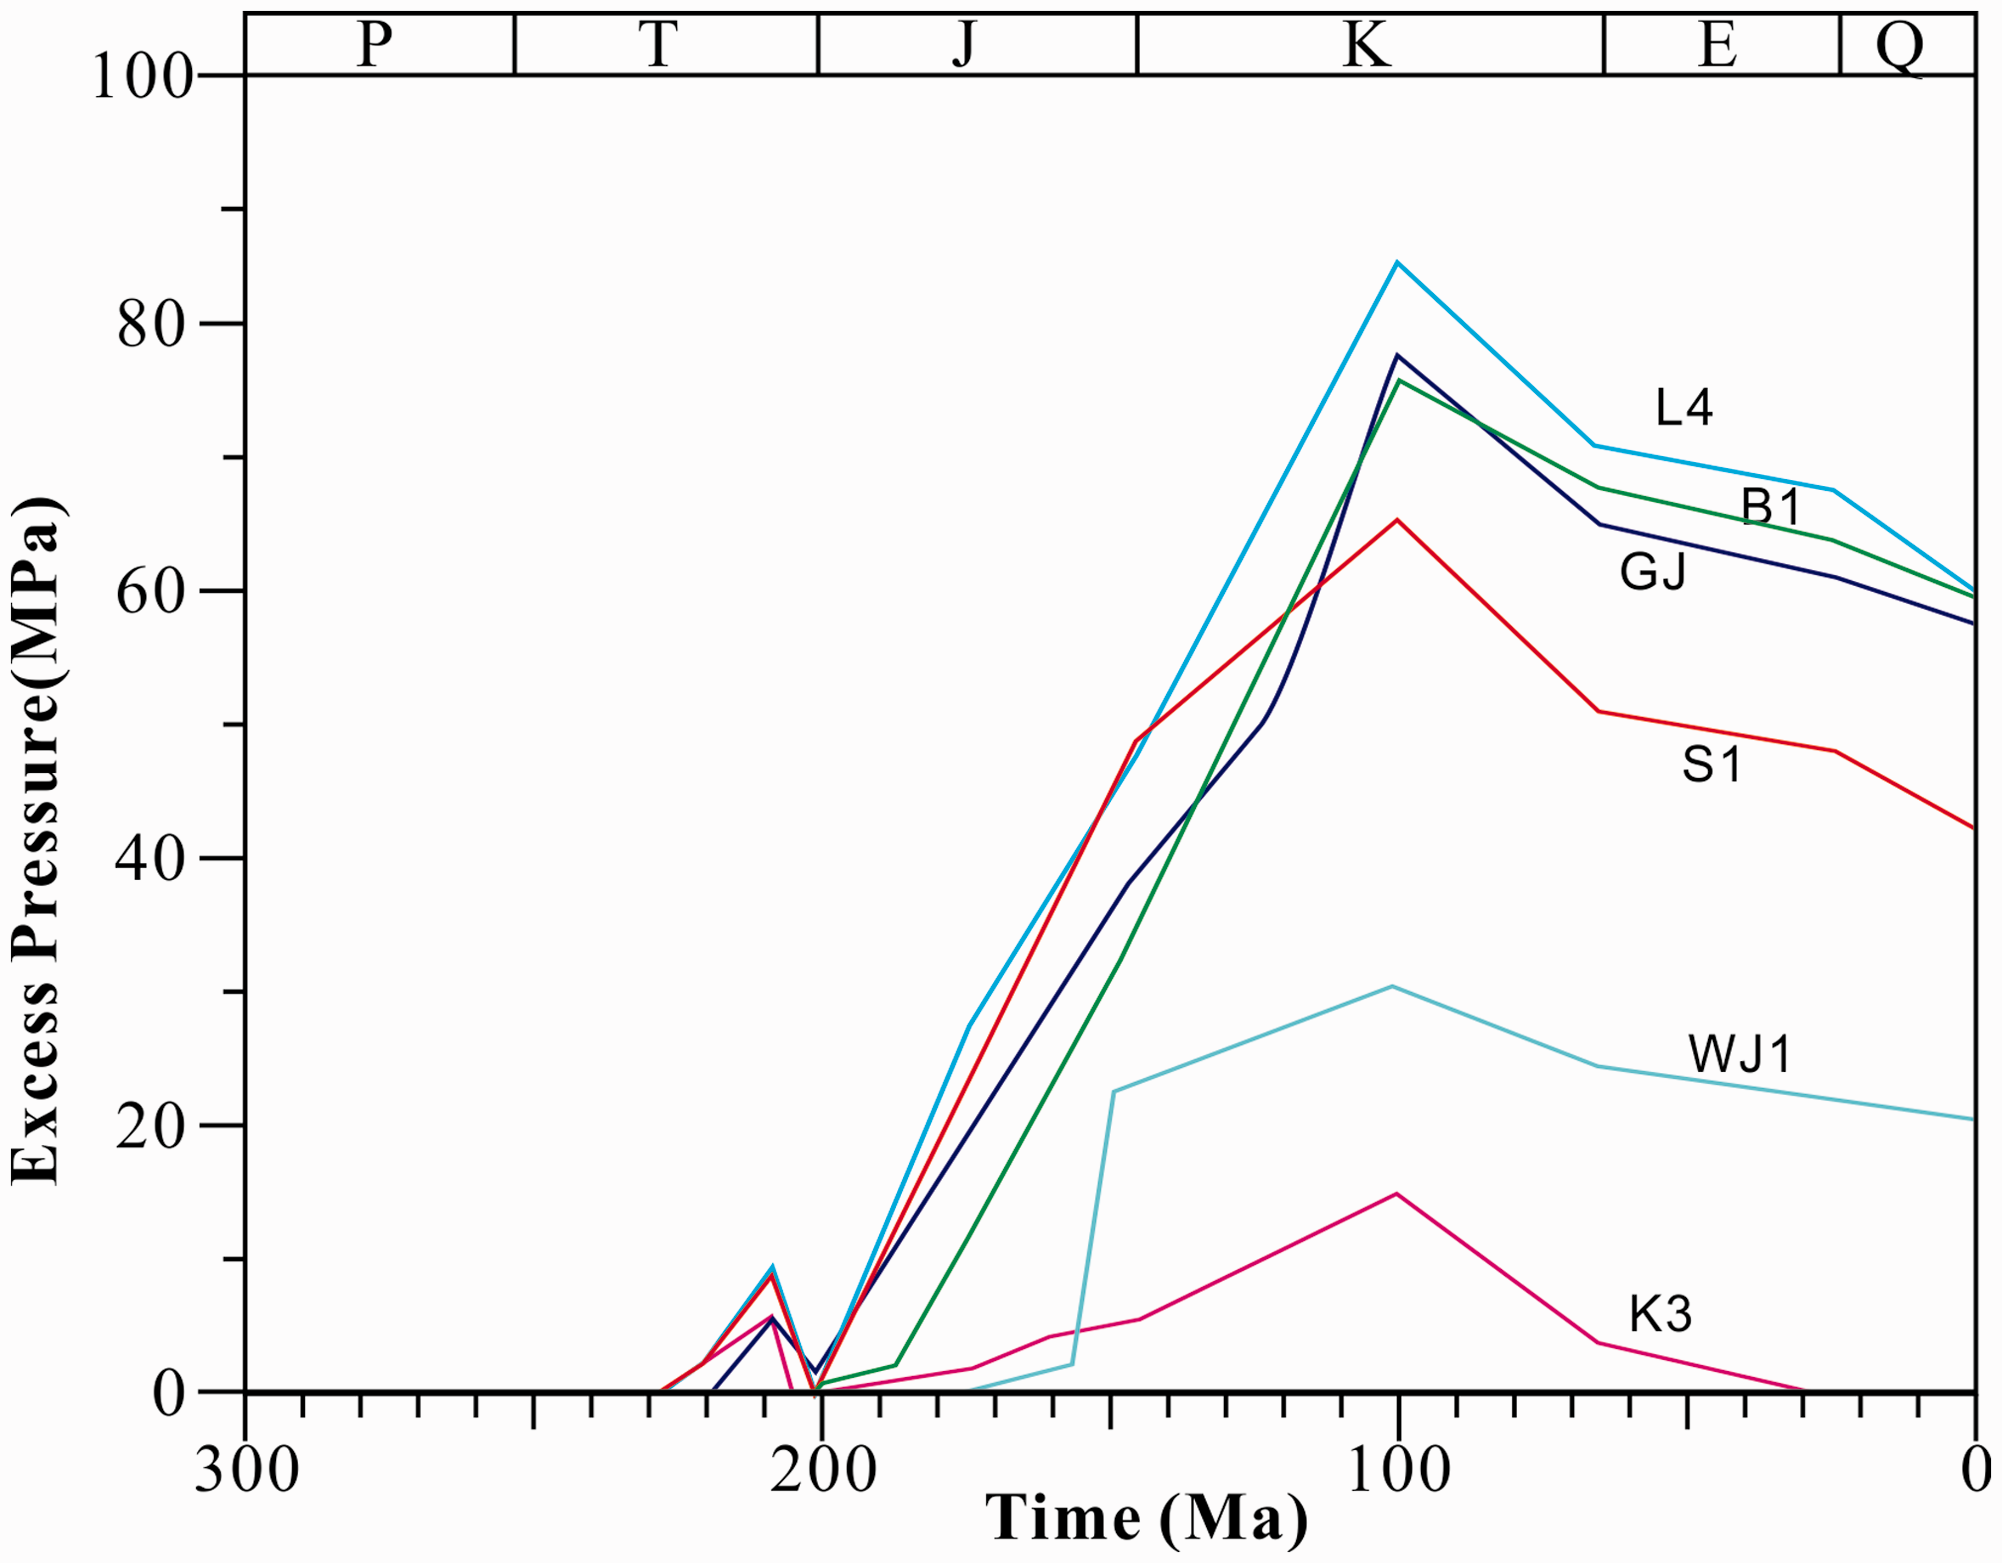
Graph showing the excess pressure evolution of P2m in the NWSB.
Discussion
Main controlling factors of the thermal evolution
Generally, thermal evolution is controlled by the tectonic setting. The Sichuan Basin was a stable cratonic basin during the Sinian–Paleozoic (Guo et al., 1996), during which the thermal regime was stable and the tectonic and magmatic activities were weak. This prompts the question: what caused the high thermal state in the Middle–Late Permian? There are two possible reasons: (1) The Emeishan Large Igneous Province (ELIP) was erupted during the Middle–Late Permian, which has been attributed to the effects of a mantle plume that produced complex related magmatic activity (He et al., 2006; Xu et al., 2004). The thermal effects of the ELIP may have resulted in high heat flow in the Middle–Late Permian. In addition, according to the thermal history recovery results, the heat flow peak was higher in the south, which was closer to the Emeishan mantle plume. This seems to support the thermal effect of the ELIP. (2) The crust thinned due to the Indosinian Movement in the Middle–Late Permian, such that the energy was more easily released to the surface from the deep crust. Such an event could also cause the high thermal state in the Middle–Late Permian. Under the combined influence of the two events, there was high heat flow in the NWSB. As the magmatic activity and deep thermal activity gradually stabilized during the Early Triassic, the most significant factors that influenced the geothermal state were the structural and sedimentary conditions of the evolving Mesozoic foreland basin. As such, the heat flow gradually decreased and the main factor that affected the formation temperature was burial depth.
Mechanism of overpressure
There are many mechanisms that control overpressure, which include but are not limited to compaction disequilibrium, hydrothermal pressurization, hydrocarbon generation, liquid hydrocarbon cracking, montmorillonite dehydration, structural extrusion, etc. Oil cracking is a major event in oil and gas accumulation in the Sichuan Basin. Previous studies have found a large amount of bitumen remaining in the Middle Permian Formation (Huang et al., 2011; Xu, 2010; Zhang et al., 2011). This indicates that the oil cracking gas is an important source of the Middle Permian natural gas reservoir. According to the principle of balance, the volume will expand when the material converts from high density to low density. If the volume remains, the pressure will increase. Experiments involving oil cracking showed that a unit volume of oil could crack a 534.3 volume of gas at standard temperature and pressure (Barker and Goldstein, 1990; Ma et al., 2007). Former studies have shown that oil cracking is mainly controlled by temperature. When the formation temperature is less than 160°C, the amount of oil cracking is very small; when the formation temperature reaches 200°C, oil cracking occurs. The temperature evolution paths of P2m also have been modeled (Figure 11). Based on the modeled temperature, Middle Permian oil cracking started in the Early Jurassic and ended in the Cretaceous. Combined with the pressure evolution, the timing of rapidly increasing pore pressure coincides with the Late Triassic oil cracking period. In summary, oil cracking is one of the main mechanisms of overpressure in the Sichuan Basin.
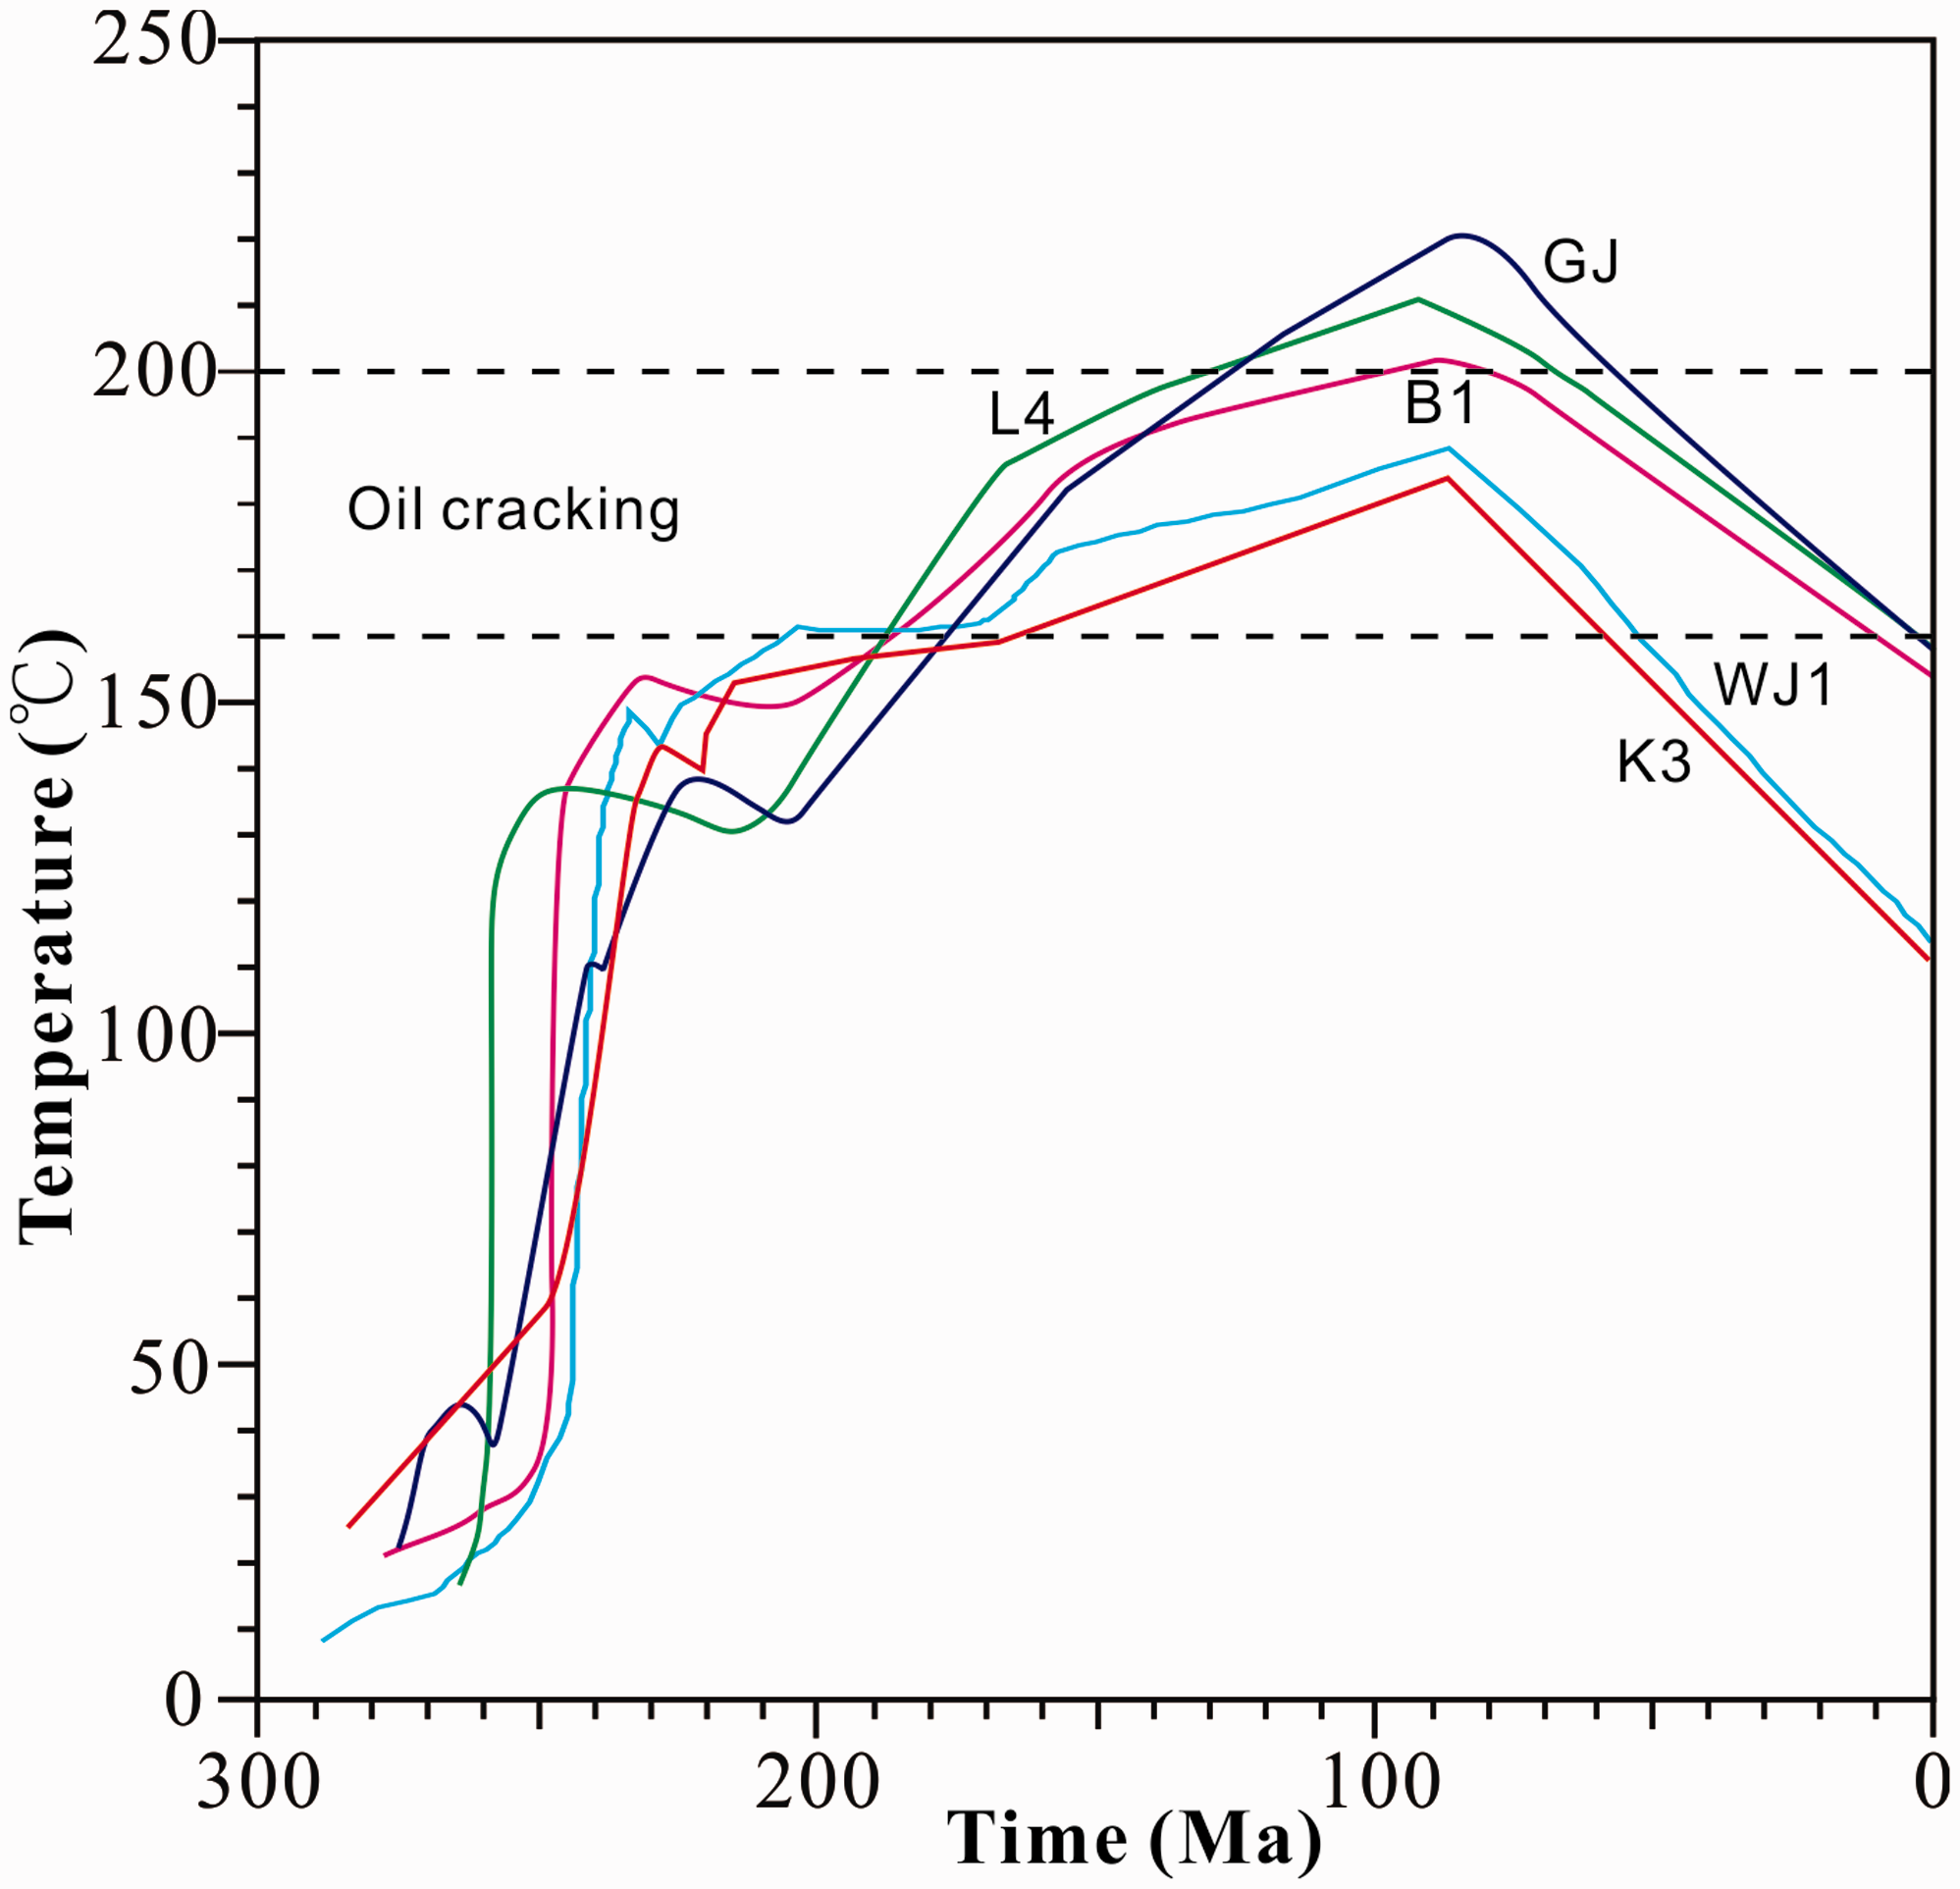
Graph showing the temperature history of the chosen wells in the NWSB.
Burial history analysis shows two rapid tectonic subsidence events (Figure 9). The first event was from the Middle Permian to the Early Triassic, during which the sedimentation rate exceeded 400 m/Ma. The second event was from the Late Triassic to the Late Cretaceous, during which the sedimentation rate was approximately 100 m/Ma. The thick deposition and rapid subsidence caused the vertical load on the Middle Permian to increase rapidly. Because the pore fluid discharge rate is slow due to low porosity, the fluid bears the pressure of part of the rock skeleton, which leads to overpressure. At the same time, rapid tectonic subsidence caused the formation temperature to increase quickly. The thermal expansion effect on the fluid further intensifies the overpressure.
From the Late Cretaceous, the NWSB began to be uplifted, which would indirectly cause the fluid pressure to decrease because of the decreasing formation temperature. According to the gas state equation, the pressure decreases by approximately 2.3% for every 10°C decrease in temperature in a closed vessel (Liu et al., 2014). In addition, during structural uplift, the fluid pressure may have decreased due to trap space enlargement and pore volume resilience.
In addition, the sealing situation of a hydrocarbon system is also an important factor that affects overpressure. The porosity of the Middle Permian is very low (Xu, 2010; Yang et al., 2015), and the Upper Permian carbonate formation further improved the sealing capacity. This favors the preservation of overpressure.
In summary, the two stages of overpressure were controlled by different factors. The first short phase of overpressure was mainly controlled by rapid tectonic subsidence, and the degree of overpressure was relatively weak. The second overpressure stage was mainly controlled by oil cracking and rapid tectonic subsidence.
Relationship between the temperature–pressure field evolution and gas accumulation
The thermal history controls the maturity of source rock. The Middle Permian experienced very high temperatures in the Mesozoic, and the source rock is now in the dry gas stage. The oil and gas reservoirs are mainly dry gas. At the same time, the thermal evolution also controls the time at which the source and liquid hydrocarbons in the reservoirs began to crack. This time was roughly in the Late Triassic.
Pressure is a key factor in oil cracking. Considering the relationship between oil cracking and overpressure, a few scholars have suggested that overpressure can promote oil cracking (Braun and Burnham, 1990). However, most scholars argue that overpressure inhibits oil cracking (Jackson et al., 1995). Chen et al. (2013) demonstrated through simulation experiments that an increase in pressure can inhibit oil cracking. Overpressure increases the cracking threshold temperature and postpones the cracking time. Therefore, the Middle Permian overpressure in the NWSB may delay the cracking time, resulting in a later formation time of the gas field, which is conducive to the preservation of the gas field.
Generally speaking, the sealing conditions for natural gas are better in deep strata. The present geothermal gradient in the NWSB is relatively low, and the depths of the oil-producing windows and gas-bearing layers are correspondingly deep, which provide the suitable preservation condition of the giant gas field. In the NWSB, oil cracking is one of the main factors of overpressure, the existence of overpressure itself represents the accumulation of hydrocarbon fluids and good preservation condition, and the potential for oil and gas exploration is even greater.
In addition, the temperature–pressure field also affects reservoir evolution. High temperature and high pressure should enhance the carbonate dissolution (She et al., 2016), which is important for improving the physical properties of the Middle Permian reservoir. Hydrothermal activity is also a key factor in carbonate diagenesis. The ELIP and crustal thinning in the Middle Permian led to high heat flow, which created favorable conditions for the hydrothermal effect. The effect of the temperature–pressure field on reservoir diagenesis needs further study.
Conclusions
(1) The thermal evolution history of the NWSB was reconstructed by integrating multiple thermal indicators: He ages, ZFT ages, and RO data. The modeled results show that this area experienced gradual cooling, during which the Middle Permian heat flow (70–90 mW/m2) decreased to present values of approximately 50 mW/m2. The high thermal state may have been caused by the ELIP and crustal thinning.
(2) The Middle Permian in the NWSB generally developed overpressure. The pressure evolution of Middle Permian can be divided into three stages: (1) a slight overpressure stage (T2–T3), (2) an intensive overpressure stage (J1–K2), and (3) an overpressure reduction stage (K2–present). Oil cracking and rapid tectonic subsidence are key factors that affect overpressure.
Footnotes
Acknowledgements
We gratefully acknowledge the PetroChina Southwest Oil and Gasfield Company and PetroChina Hangzhou Institute of Geology for providing geological information and test samples for this study. We thank Platte River Associates, Inc., and Richard A. Ketcham, for the provision of software for this study.
Declaration of conflicting interests
The author(s) declared no potential conflicts of interest with respect to the research, authorship, and/or publication of this article.
Funding
The author(s) disclosed receipt of the following financial support for the research, authorship, and/or publication of this article: The work was funded by the National Natural Science Foundation of China (41690133), the National Science and Technology Major Project (2016ZX05007-003), and the Training foundation for the Science and Technology New Star and Leading Talent of Beijing (Z171100001117163).