
Abstract
Buckley–Leverett theory and Welge equation is one of the most widely used methods for predicting fluid transport in porous media. However, the average water saturation in Welge equation is a function of both water saturation and water cut, which is inconvenient to be used. While the linear relationship (the slope is 2/3) of the average water saturation and outlet water saturation proposed by Зфрос provides a simple method the oil–water viscosity ratio greatly limits the application. In this paper, based on the analytical relative permeability model and Welge equation, a new average water saturation equation with a variable (the outlet water saturation) was derived and applied in some cases under different relative permeability parameters and oil–water viscosity. Moreover, a simplified equation was proposed through certain data regression. Thus, the coefficient calculation method of the linear function was introduced based on the actual production data. Results showed a nonlinear relationship between the average water saturation and outlet water saturation, which is mainly related to water and oil relative permeability, and oil–water viscosity ratio. For the outlet water saturation higher than frontal saturation, the equation can be simplified to a linear function, which is the derivation of Зфрос equation. However, it is a function of both relative permeability and oil–water viscosity ratio instead of a constant slope of 2/3. In view of the fact that oil–water viscosity is mostly bigger than 10 in most reservoirs, the new model is an important supplement to Buckley–Leverett theory and Welge equation.
Keywords
Introduction
Buckley and Leverett (1942) proposed the famous Buckley–Leverett theory which is the theoretical basis of two-phase flow theory. On this basis, the average water saturation calculation method was proposed (Welge, 1949, 1952). Then many scholars developed and generalized this basic theory. However, the average water saturation expression in Welge equation which contains both water cut and the derivative of water cut on the saturation brings lots of inconvenience for the practical application. Dake (2001), Tarek (2009), and William (2010) calculated the average water saturation based on the tangent of the fractional flow curve at each selected water saturation. The drawback of this method is very time consuming. However, so far, there was no alternative method which can avoid this problem.
In fact, Chen (1985) and Gao et al. (2000) cited a function of water cut with the oil–water viscosity ratio ranging from 1 to 10 based on experimental data analysis. A linear relationship between the average water saturation and outlet water saturation was derived (the slope is 2/3). On this basis, several typical waterflooding curves were proposed, which was widely used in reservoir engineering. In recent years, Liu and Liu (2015) and Zhou and Wang (2016) proposed several effective methods to predict waterflooding performance based on Welge equation. However, the relationship between average water saturation and outlet water saturation was still not fully described. In addition, oil–water viscosity ratio is always another limitation. Thus, it is vital to study the relationship between the average water saturation and outlet water saturation.
In this study, a new average water saturation equation with a variable (the outlet water saturation) was derived. Besides, a simplified equation was proposed through certain data regression and the coefficient calculation method of the linear function was introduced based on the actual production data. In view of the fact that oil–water viscosity is mostly bigger than 10 in actual waterflooding projects, the new model is an important supplement to Buckley–Leverett theory and Welge equation.
Theoretical basis: The mathematical derivation of a new equation
Oil–water relative permeability curves can be expressed by a variety of forms. The analytical expression was the most widely used


Without considering the influence of gravity and capillary pressure, the fractional flow equation under surface condition can be converted into the following expression
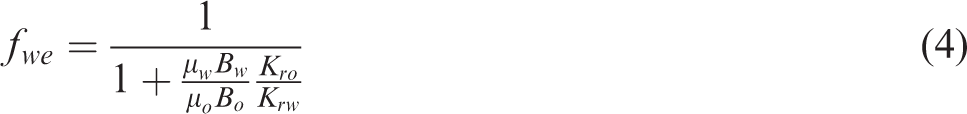
By substituting equations (1) and (2) into equation (4), the fractional flow equation can be expressed as follows

Equation (5) shows the relationship between the water cut and the outlet water saturation.
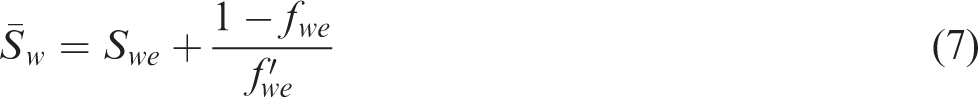
Based on Buckley–Leverett equation, the average water saturation function which is related to the outlet water saturation, water cut, and
According to the experimental results of Зфрос’s equation, the water cut is a function of outlet water saturation when water viscosity ratio is between 1 and 10, as is shown in equation (8)

So

Equation (9) is a function between outlet water saturation and average water saturation, but there is a premise that the water viscosity ratio is between 1 and 10. In this paper, a new equation was derived. Then the derivative of equation (5) is
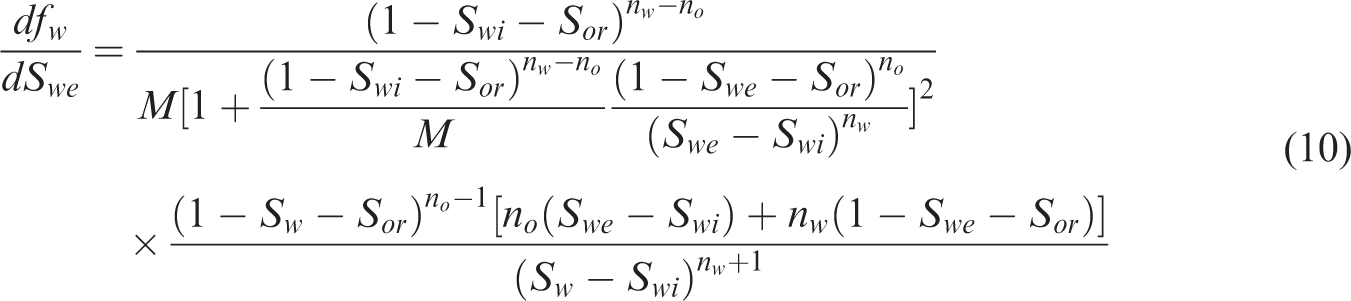
Substituting equations (5) and (10) into equation (7), we obtain
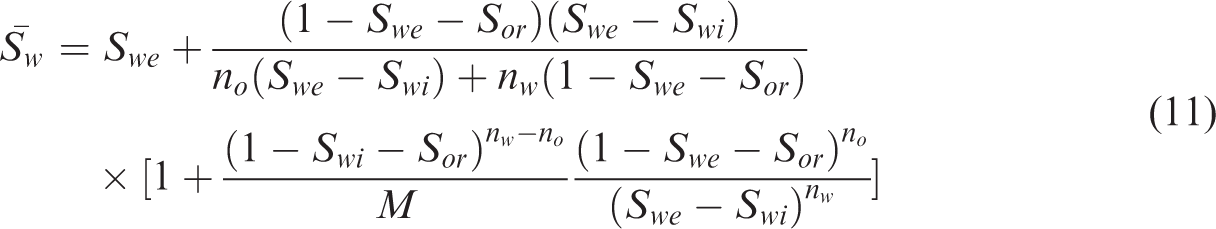
Equation (11) is the theoretical expression of average water saturation and outlet water saturation. Comparatively, there are significant differences between the new equation and the approximate formula derived by Зфрос (equation (9)) in view of the oil and water phase indexes which is typically between 2 and 4. Three different cases (
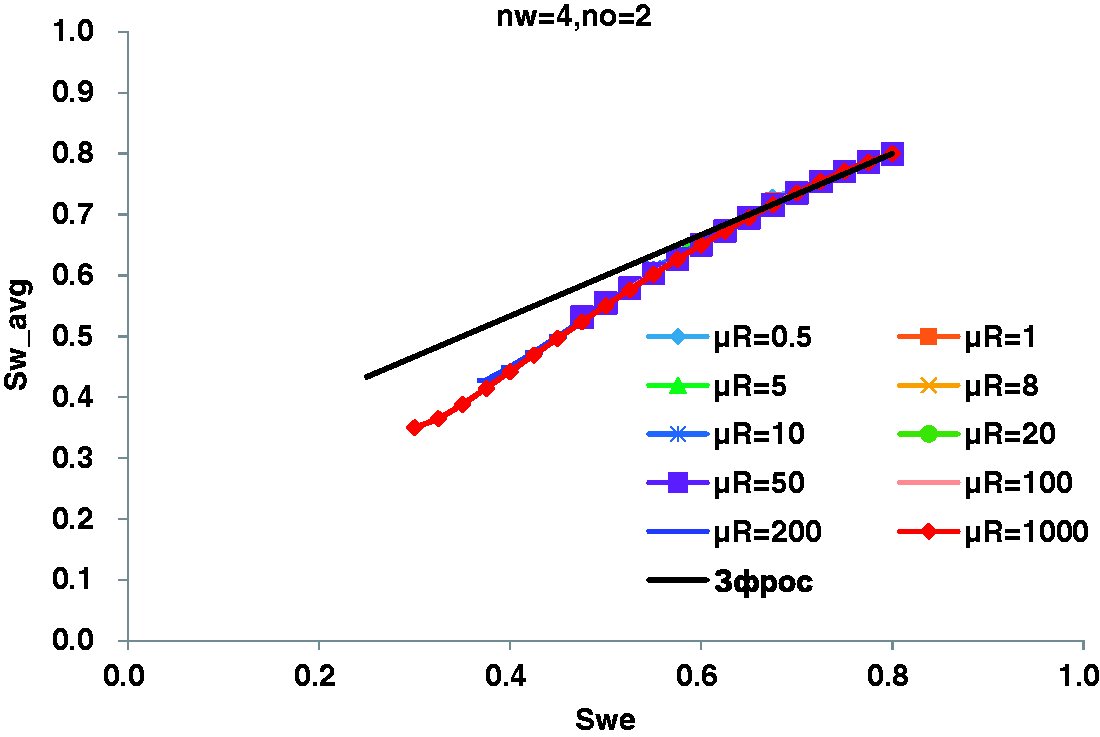
The relationship of Swe and Sw_avg, when nw = 4, no = 2.
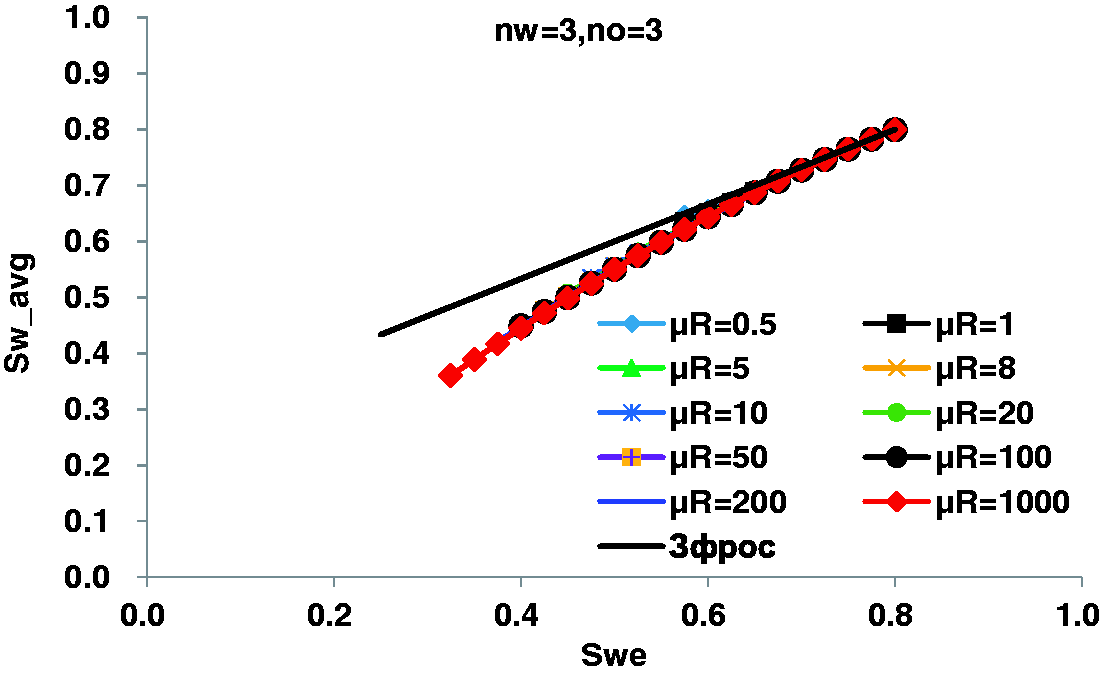
The relationship of Swe and Sw_avg, when nw = 3, no = 3.
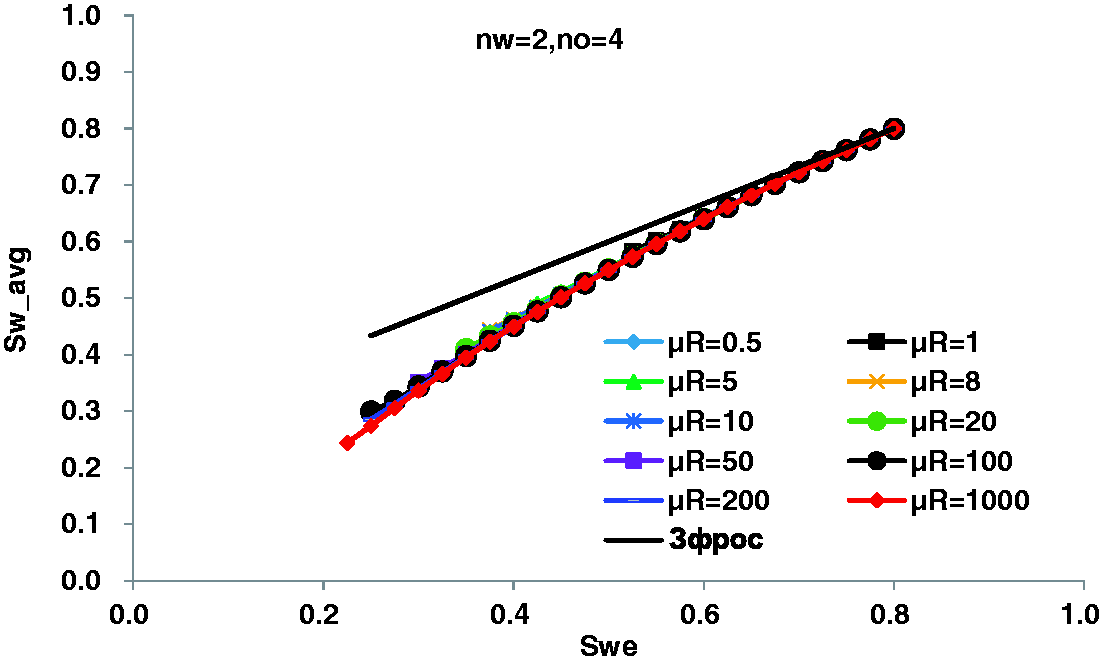
The relationship of Swe and Sw_avg, when nw = 2, no = 4.
With the increase of viscosity ratio, especially for the ratios higher than 10, the difference of the new equation and Зфрос waterflooding theory increases.
Comparatively, for the new equation, the error decreases with the oil–water viscosity ratio decreases. There exists a certain value over which we can achieve the similar results for the new equation and Зфрос waterflooding theory.
Results and discussion
A new improved equation
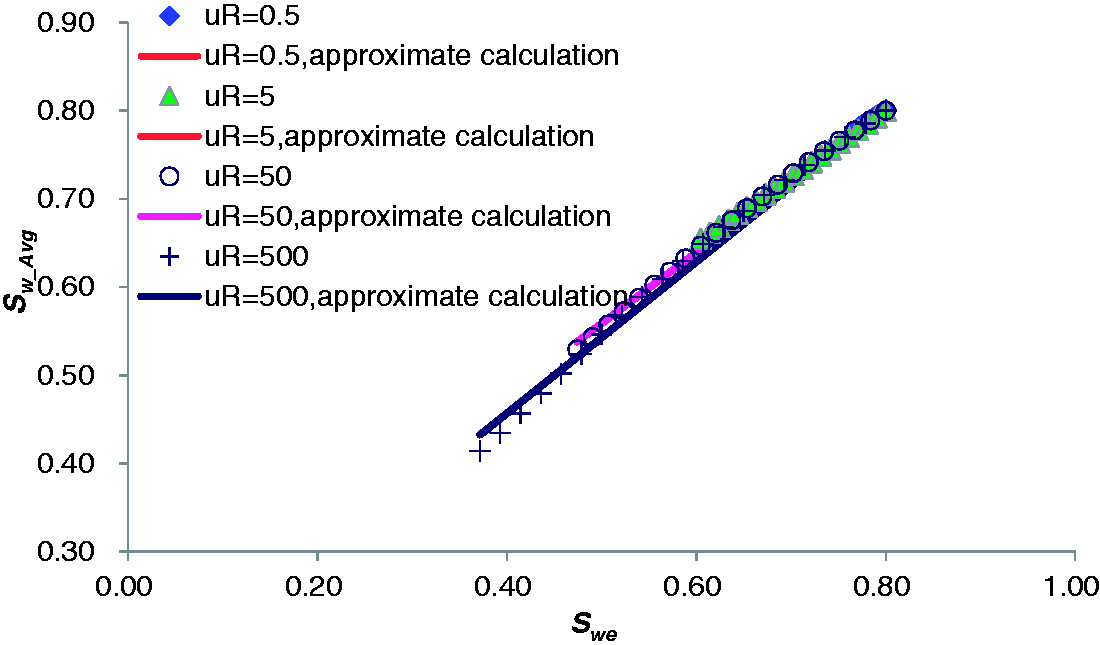
Reservoir engineering methods are mostly established based on the linear relationship between Sw_avg and Swe; thus, the accuracy of the methods actually depends on the description of the relationship of these two parameters. Obviously, as Figure 4 shows, there is a linear relationship with high accuracy between Sw_avg and Swe. Furthermore, the linear function was described as follows

Different value of parameter ω under different oil–water viscosity conditions.
While

Substituting equation (13) into equation (12), we get

Equation (14) is the new linear relationship between Sw_avg and Swe.
The coefficient calculation method of the new equation
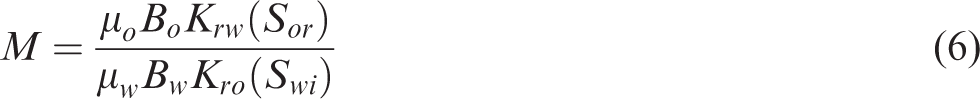
Equation (12) indicates the linear functional relationship between Sw_avg and Swe; however, the parameter ω was still an unknown parameter. There are two methods to obtain the ω. One method is determined through the matching of experimental data. The other one is calculated by a proposed equation. The average water saturation can be calculated by analyzing the relative permeability and oil–water viscosity ratio for water front arriving at the exit end, as shown in equation (13)

Similarly, according to equation (13), we obtain

So the parameter ω can be calculated as follows

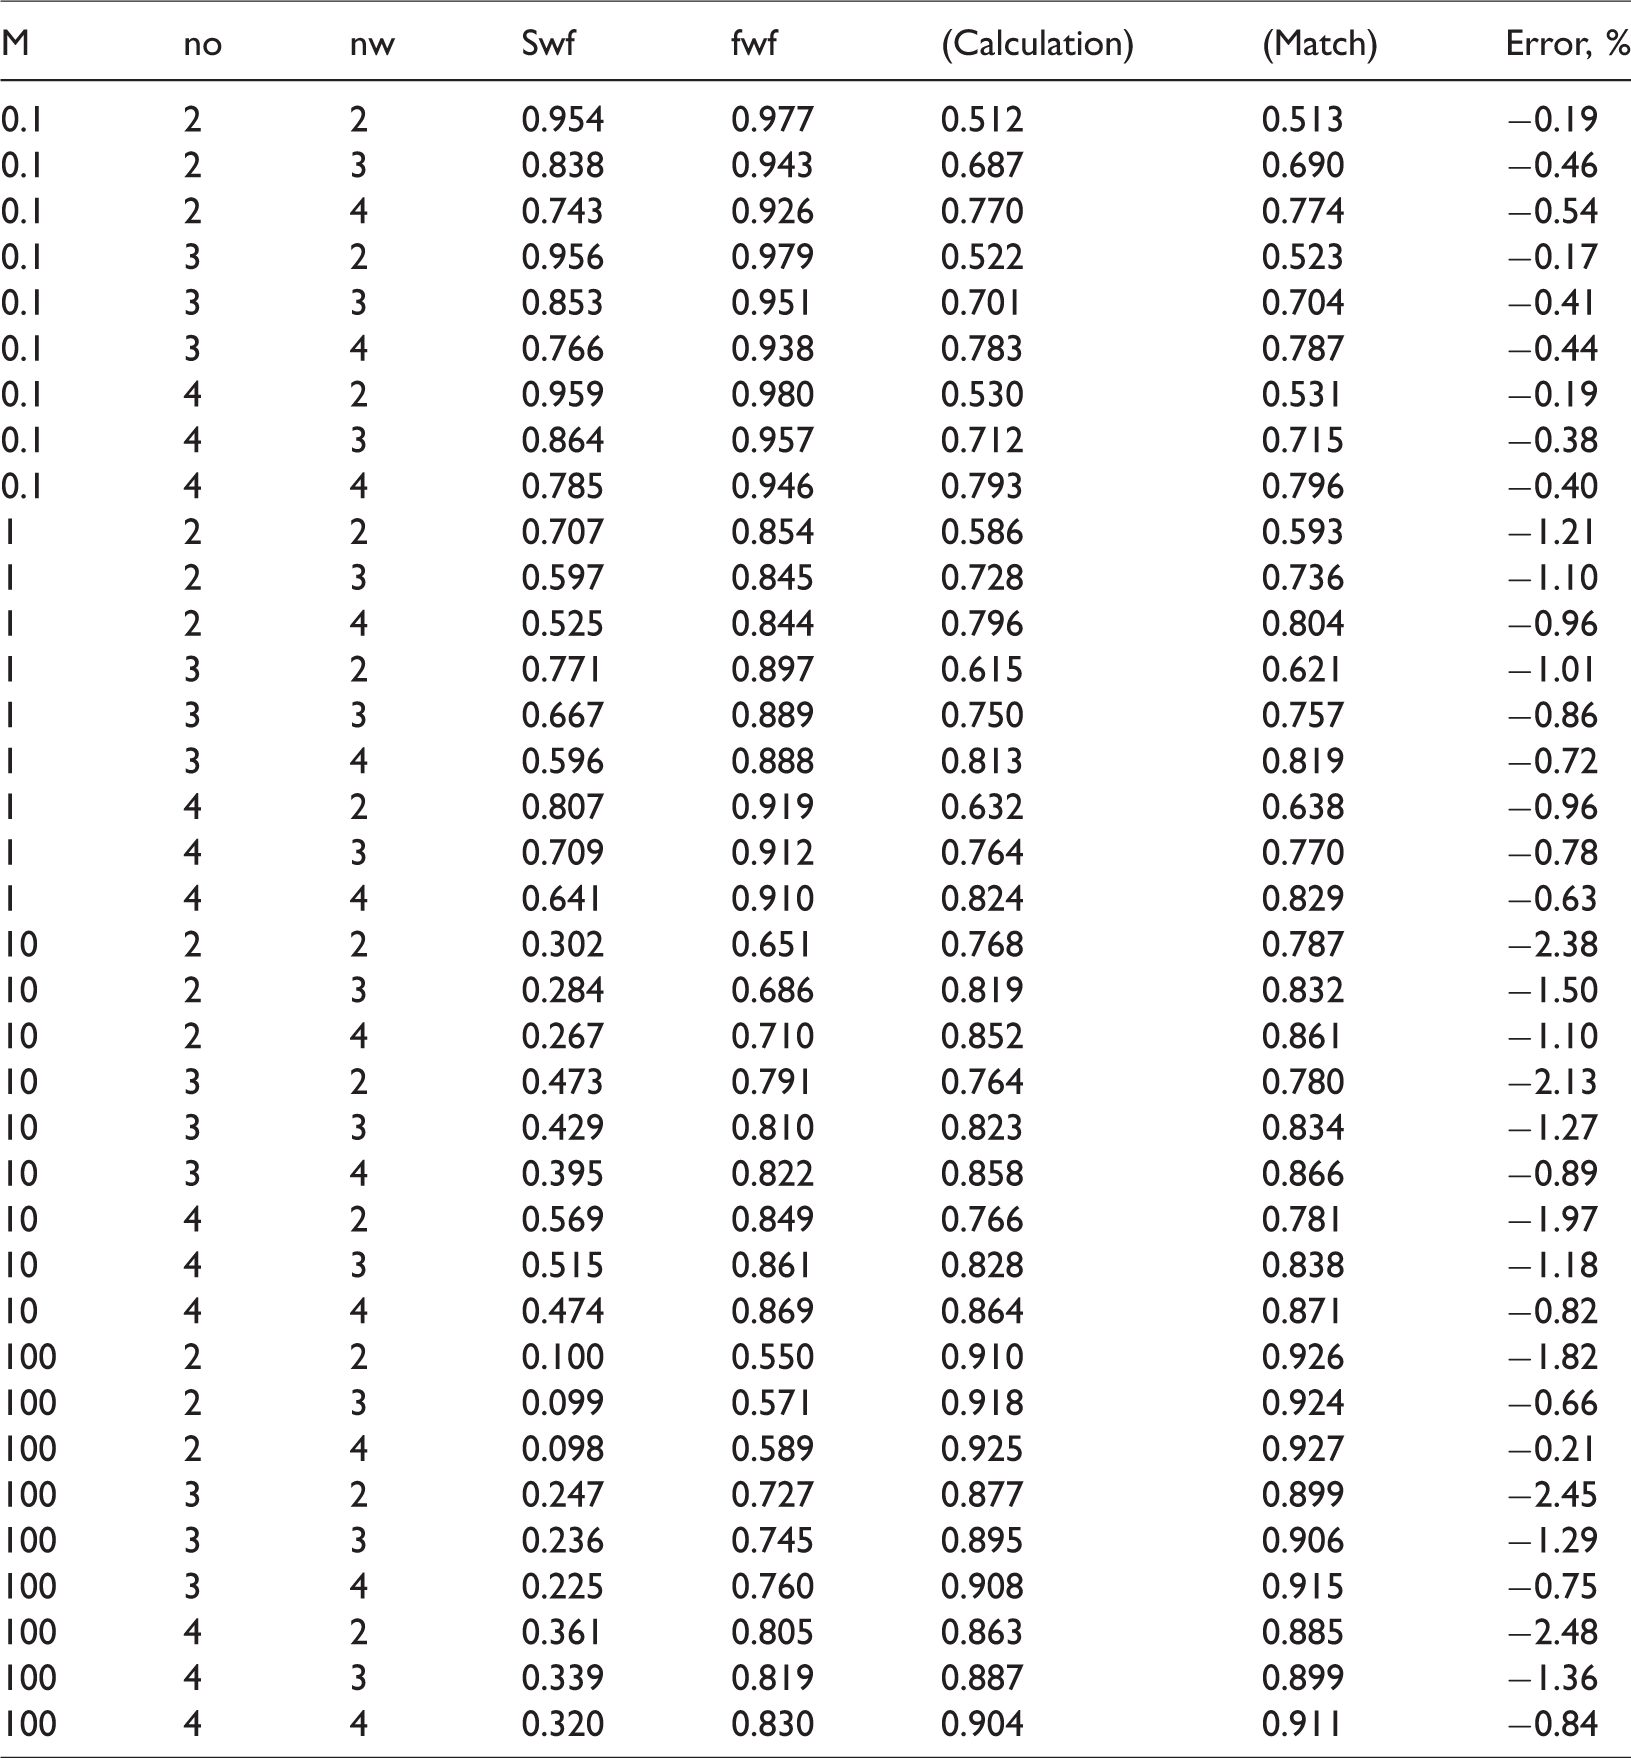
Accordingly, both Sw_avg and the parameter ω can be obtained through the matching method through equations (11) and (14). Also, parameter ω can be calculated through equation (17). Table 1 compares the results of both calculation method and fitting method.
The comparison of calculation method and fitting method.
Experimental analysis
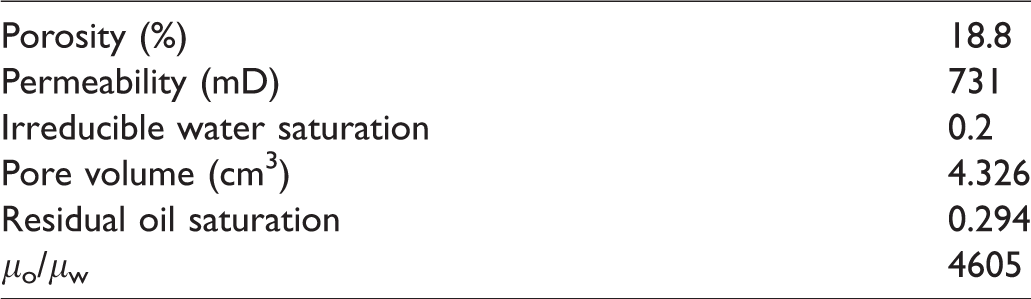
Equation (11) is the theoretical expression of average water saturation and outlet water saturation. Equation (14) is the new simplified equation that shows a linear relationship when the outlet water saturation is higher than the front saturation during waterflooding. Actual experiment data were analyzed to verify the above equation. Generally, with the increase of viscosity ratio, especially for the ratios higher than 10, the difference of the new equation and Зфрос waterflooding theory increases. Heavy oil was chosen and the fundamental data were shown in Table 2. The relative permeability data were recorded in Table 3. The experimental setup and experimental procedure are standard for unsteady state relative permeability test. The constant injecting rate is keeping in 0.3 ml/min and the temperature is keeping in 64°C, which is equal to the actual reservoir temperature.
Fundamental data of relative permeability experiment.
Relative permeability experimental data.
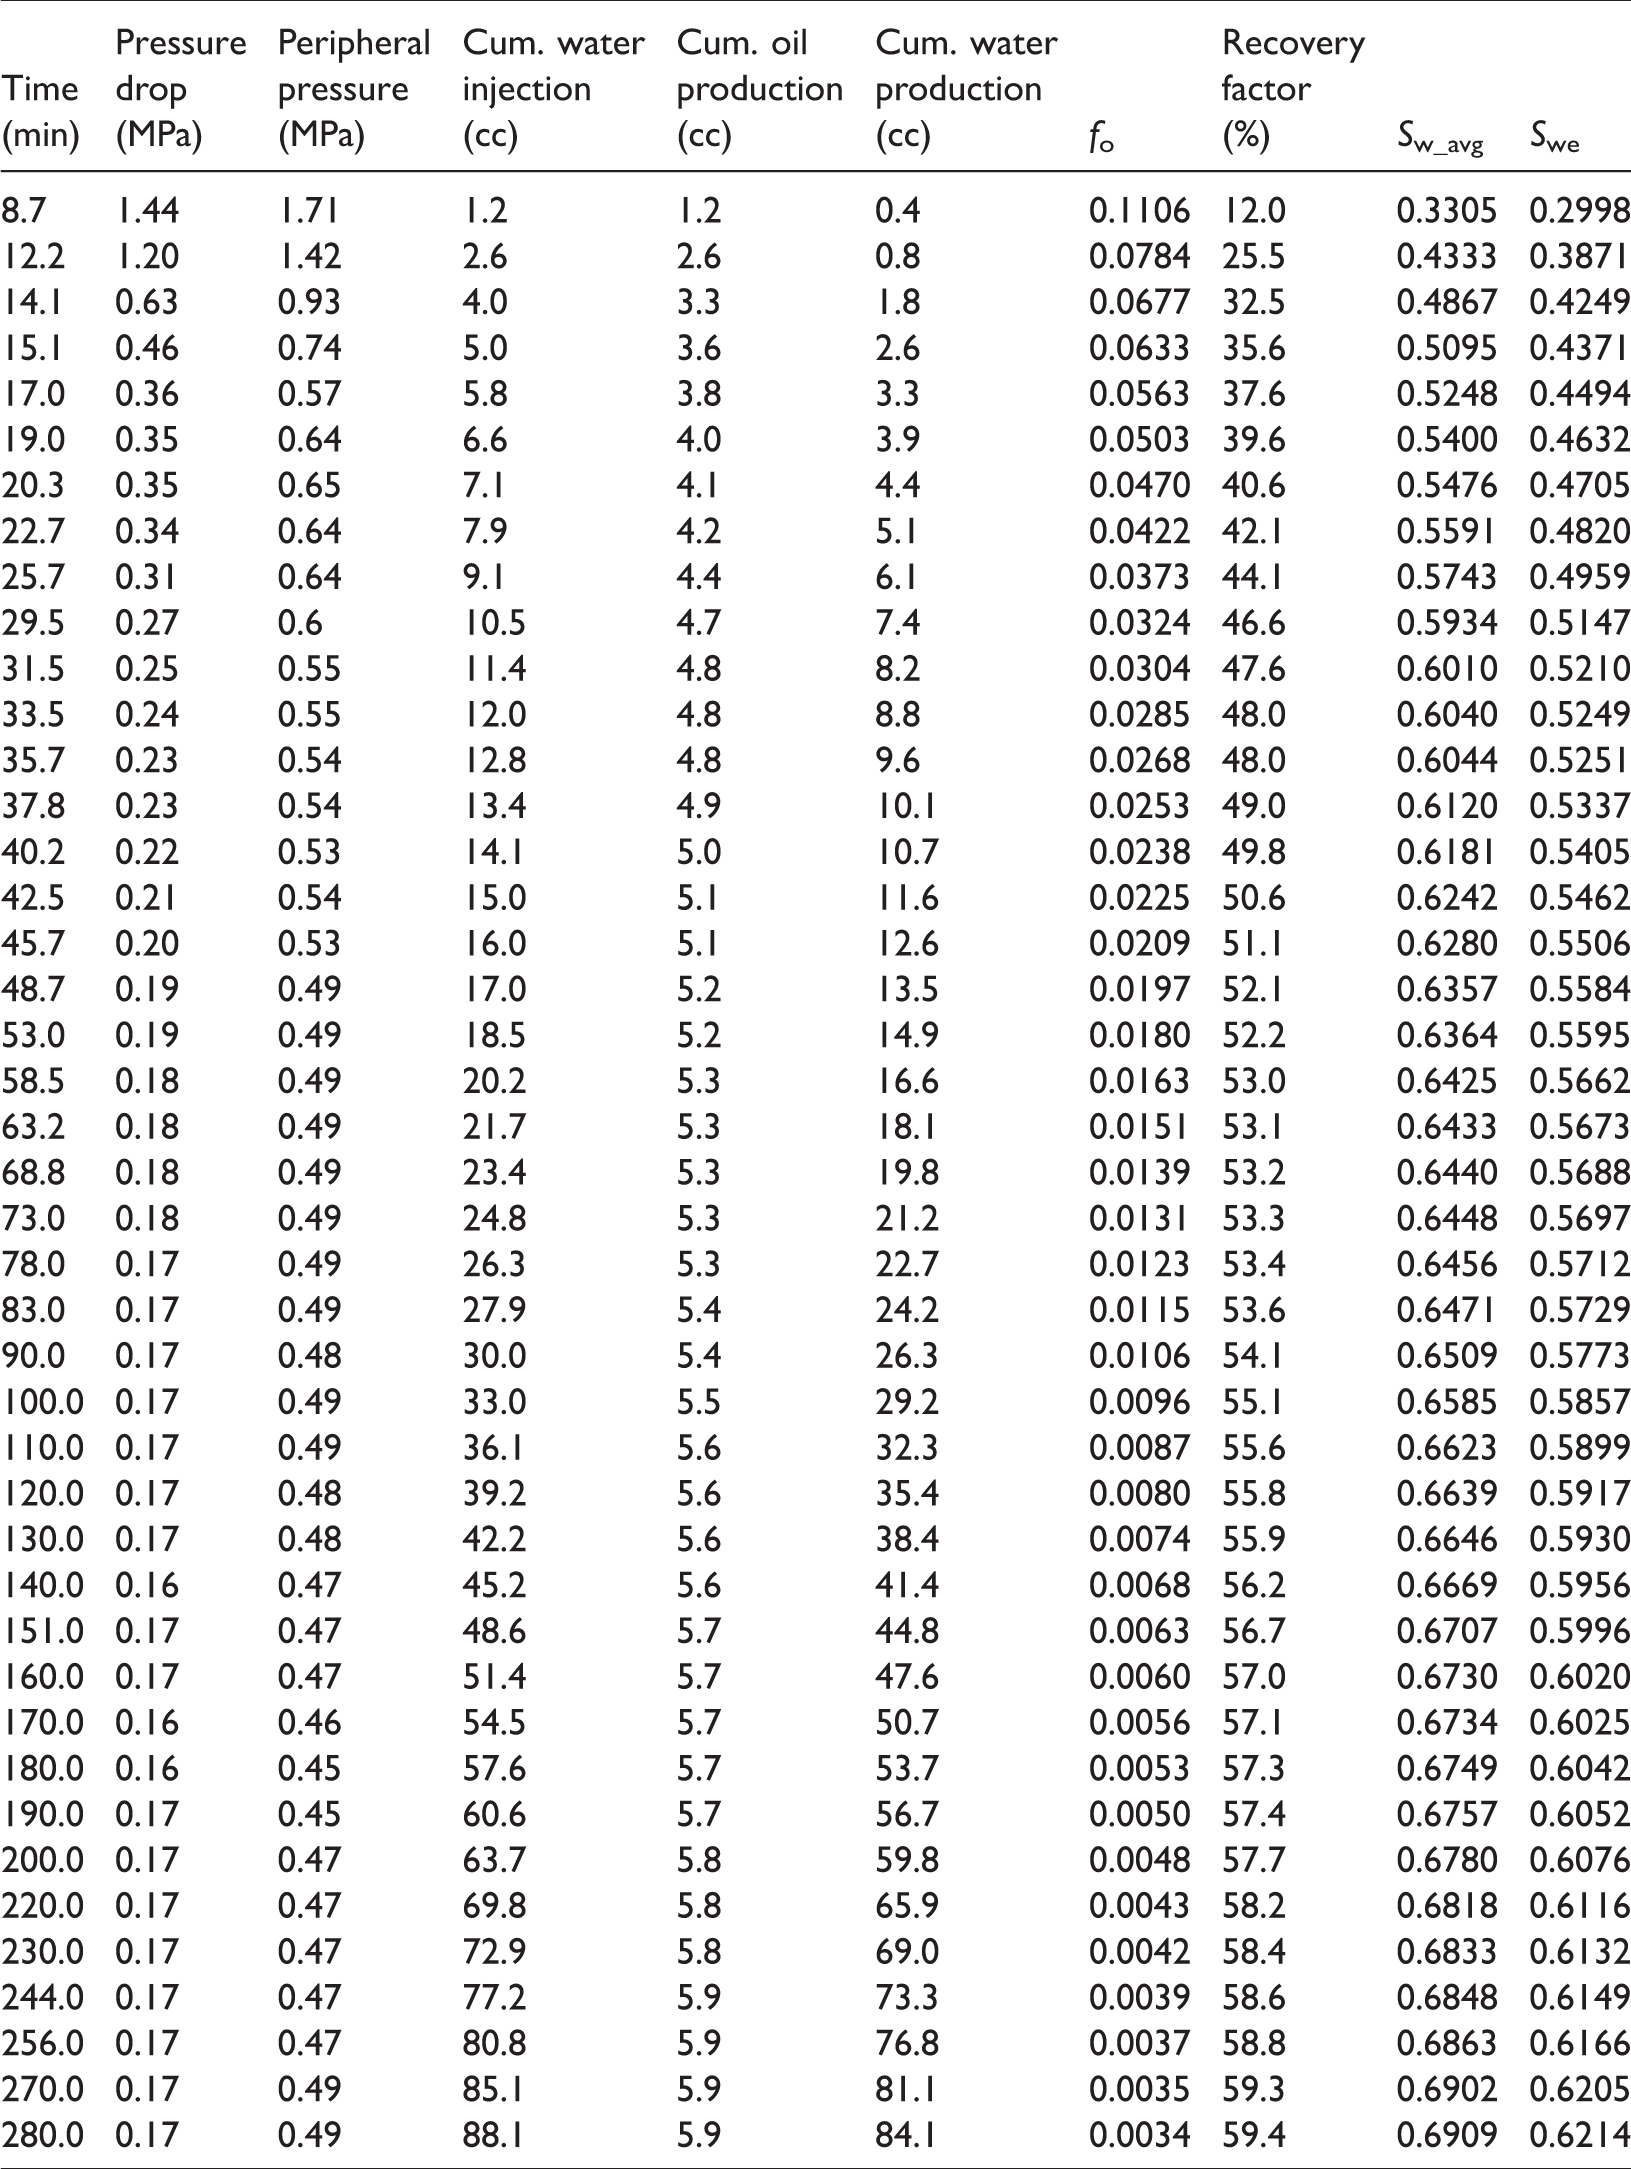
From Table 3 and Figure 5, we could find that the linear relationship is obvious, but the slope is not 2/3 which is 0.9411 (except the lowest four points). Based on equation (15), ω could be calculated and the value is 0.9417, very close to 0.9411, which could be used to prove the accuracy of equation (15).
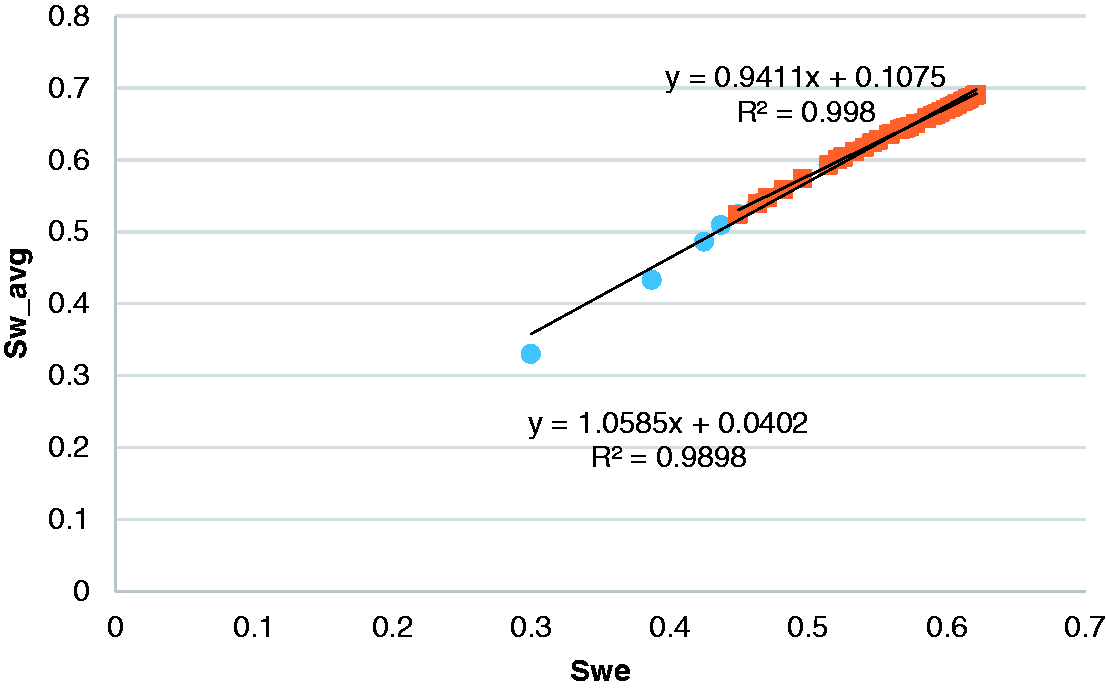
The relationship between average water saturation and exit water saturation.
Conclusions
This paper presented a new equation which considers the relationship between the average water saturation and outlet water saturation. It is related to irreducible water saturation, residual oil saturation, water and oil relative permeability phase index, and oil–water viscosity ratio. The new equation can be simplified to a linear relationship when the outlet water saturation is higher than the front saturation during waterflooding. However, the slope is a function of relative permeability instead of the constant 2/3 as Зфрос equation shows. The new model and calculation method is the further expression of Welge equation, which fully considers the most case of oil–water viscosity bigger than 10 in waterflooding. It broadens the application scope and is an important supplement to the Buckley–Leverett theory.
Footnotes
Declaration of conflicting interests
The author(s) declared no potential conflicts of interest with respect to the research, authorship, and/or publication of this article.
Funding
The author(s) disclosed receipt of the following financial support for the research, authorship, and/or publication of this article: This study was supported by National Science and Technology Major Project (Grant 2011ZX05030-005).