
Abstract
Hydrous and anhydrous isothermal experiments on n-pentane and n-octadecane were conducted at 300–375℃ for durations up to 1094 h to evaluate the cracking and hydrolysis of hydrocarbons, using fused silica capillary capsules as micro-reactors. The chemical compositions of the gaseous products during cracking of n-octadecane at 350 and 375℃ were methane, ethane, propane, and n-butane. The aqueous product in the hydrolysis of n-pentane and n-octadecane at 300–375℃ was alcohol. Alkenes and hydrogen were not detected throughout all the isothermal experiments. Results showed that the gaseous yields were characterized by higher contents of wet gas than those in natural gas accumulations. Mechanisms regulating the enrichment of methane in reservoirs should be further studied. The hydrolysis and oxidation of hydrocarbon were relatively limited in the absence of iron-bearing mineral buffers, suggesting that hydrocarbons might be more stable in iron-poor reservoirs (e.g. carbonate and quartz arenite) than in iron-bearing-mineral-rich ones (e.g. mudstone and arkose) under deep burial conditions. The absence of hydrogen was ascribed to its high diffusion rate in fused silica than in gold tube; any hydrogen produced in the reaction tends to diffuse out of the fused silica capsule with no or limited hydrogen accumulation, similar to those in geological environment. The diffusion of hydrogen should be considered during calculating the volume and pressure changes in the thermal cracking of oil to gas in reservoirs, because the loss of hydrogen would result in a decrease in the conversion rate of oil to gas.
Introduction
Knowledge on the stability of petroleum in deep sedimentary basins is important for petroleum exploration. Previous studies showed that the conversion of liquid hydrocarbon to gas and pyrobitumen occurred between 150 and 200℃ (e.g. Hayes, 1991; Mango, 1991; Price et al., 1981). The cracking of petroleum appears to be a potential source for natural gas accumulations in sedimentary basins. In northwestern China Tarim and southwestern China Sichuan basins, thermal cracking of oil was proven and oil cracking has been a source of gas that is currently produced or has been exploited for many years (Chen et al., 2002; Hao et al., 2008; Hou et al., 2004; Li et al., 2015; Zheng et al., 2015). To investigate the origin of oil-cracking gases and the corresponding geochemical identification criteria, many experiments were conducted, particularly those related to the study of the products and the kinetics of the cracking of petroleum and long-chain alkanes (e.g. Chen et al., 2014, 2016; Feng et al., 2002; Guo et al., 2011; He et al., 2013; Jiang et al., 2009; Liu et al., 2016; Ma, 2016; Shuai et al., 2012; Teinturier et al., 2003; Tian et al., 2006; Uguna et al., 2016; Wang et al., 2015; Xiong et al., 2016; Zhang et al., 2009; Zhao et al., 2008). However, the mechanism and kinetics of petroleum cracking are still not well constrained (Guo et al., 2008). For example, the gaseous products usually contain a certain amount of alkenes, which are not expected in natural gases (e.g. Feng et al., 2002; Jiang et al., 2009; Jiao et al., 2011; Zhang et al., 2009).
Water is ubiquitous in the crust and plays important roles during the cracking of petroleum (e.g. Seewald, 2003; Shuai et al., 2012). Water can serve as a solvent and catalyst that facilitates reaction pathways not available in an oil or gas phase only (Seewald, 2003). Although water was suggested to be an exogenous source of hydrogen and oxygen for the formation of hydrocarbons and oxygenated alteration products (Lewan, 1997; Seewald, 2001, 2003; Seewald et al., 1998), the effect of water on the chemistry of hydrocarbons is still a matter of debate. For example, Shuai et al. (2012) suggested that the presence of formation water can promote the cracking of crude oil at 350℃; the cracking yield of alkane gases increased 1.8–3.0 times compared to anhydrous pyrolysis experiment. On the contrary, recent thermal cracking experiments by Uguna et al. (2016) demonstrated that the presence of water can retard the cracking of oil and n-hexadecane to lower molecular weight hydrocarbons, especially at pressures up to 90 MPa. In addition, Seewald (2001) examined the aqueous geochemistry of low molecular weight hydrocarbons at 300–350℃ and 35 MPa in the presence of iron-bearing minerals. His results showed that the decomposition of dissolved n-alkanes in water proceeds through a series of oxidation and hydration reactions that sequentially produce alkenes, alcohols, ketones, and organic acids as reaction intermediates; organic acids subsequently undergo decarboxylation and/or oxidation reactions to form CO2 and shorter chain saturated hydrocarbons. However, only minor alcohols were observed in the isothermal experiments on the cracking and hydrolysis of propane even at temperatures up to 400℃ (Xu and Chou, 2017).
To describe the process and reaction pathway of the cracking and hydrolysis of hydrocarbons, we carried out a series of anhydrous and hydrous isothermal experiments on n-pentane and n-octadecane in fused silica capillary capsules (FSCCs) (Chou et al., 2008) at temperatures between 300 and 375℃ for durations up to 1094 h. The reaction products in the vapor and aqueous phases were identified using Raman spectroscopy. The fractions of gas products were estimated by calculating the Raman peak area fraction (PAF) of each component. Then, we discussed the relevant significance on the preservation and evolution of petroleum under deep burial conditions.
Experimental section
Preparation of FSCC
Fused silica capillary tube (300 µm OD, 50 µm ID; Polymicro Technologies, LLC) was used to construct FSCCs containing n-octadecane (≥99% purity, Sigma-Aldrich), n-pentane (≥99% purity, Sigma-Aldrich) + water (deionized, >18 kΩ), and n-octadecane + water. The procedures for preparing an FSCC containing organic and/or inorganic materials were presented in Chou et al. (2008). The n-pentane was loaded into the fused silica capillary tube using a condensation method because of its high volatility at room temperature. One end of about ∼5 cm long fused silica capillary tube was sealed using an oxyhydrogen flame. Water was loaded into the tube and centrifuged to the sealed end. The open end of the tube was connected to a pressure line (Figure 1(a)). The n-pentane vapor was circulated twice and removed by vacuum in the line. Then, the sealed end of the tube was placed in a ceramic crucible containing liquid nitrogen or ice water to condense n-pentane. Finally, the system was vacuumed and the open end of the silica tube was sealed using the oxyhydrogen flame (Figure 1(a)). To prepare an FSCC containing n-octadecane, solid n-octadecane was loaded into a one-end-sealed silica tube and the tube was then connected to the pressure line. Similarly, the system was vacuumed and the open end of the tube was sealed. For the n-octadecane–water system, n-octadecane was loaded first and then water was loaded into the tube that was subsequently centrifuged to move the content to the sealed end. The open end of the tube was connected to the line, vacuumed and sealed to create the FSCC. A prepared FSCC is about 2 cm long. The photo inset in Figure 1(a) showed a part of FSCC containing n-octadecane and water at elevated temperatures.
(a) A schematic diagram showing the sample loading system. Bottom right is a picture of a part of prepared FSCC containing n-octadecane and water at elevated temperatures. (b) A sketch illustrating the sample heating system. FSCC: fused silica capillary capsule.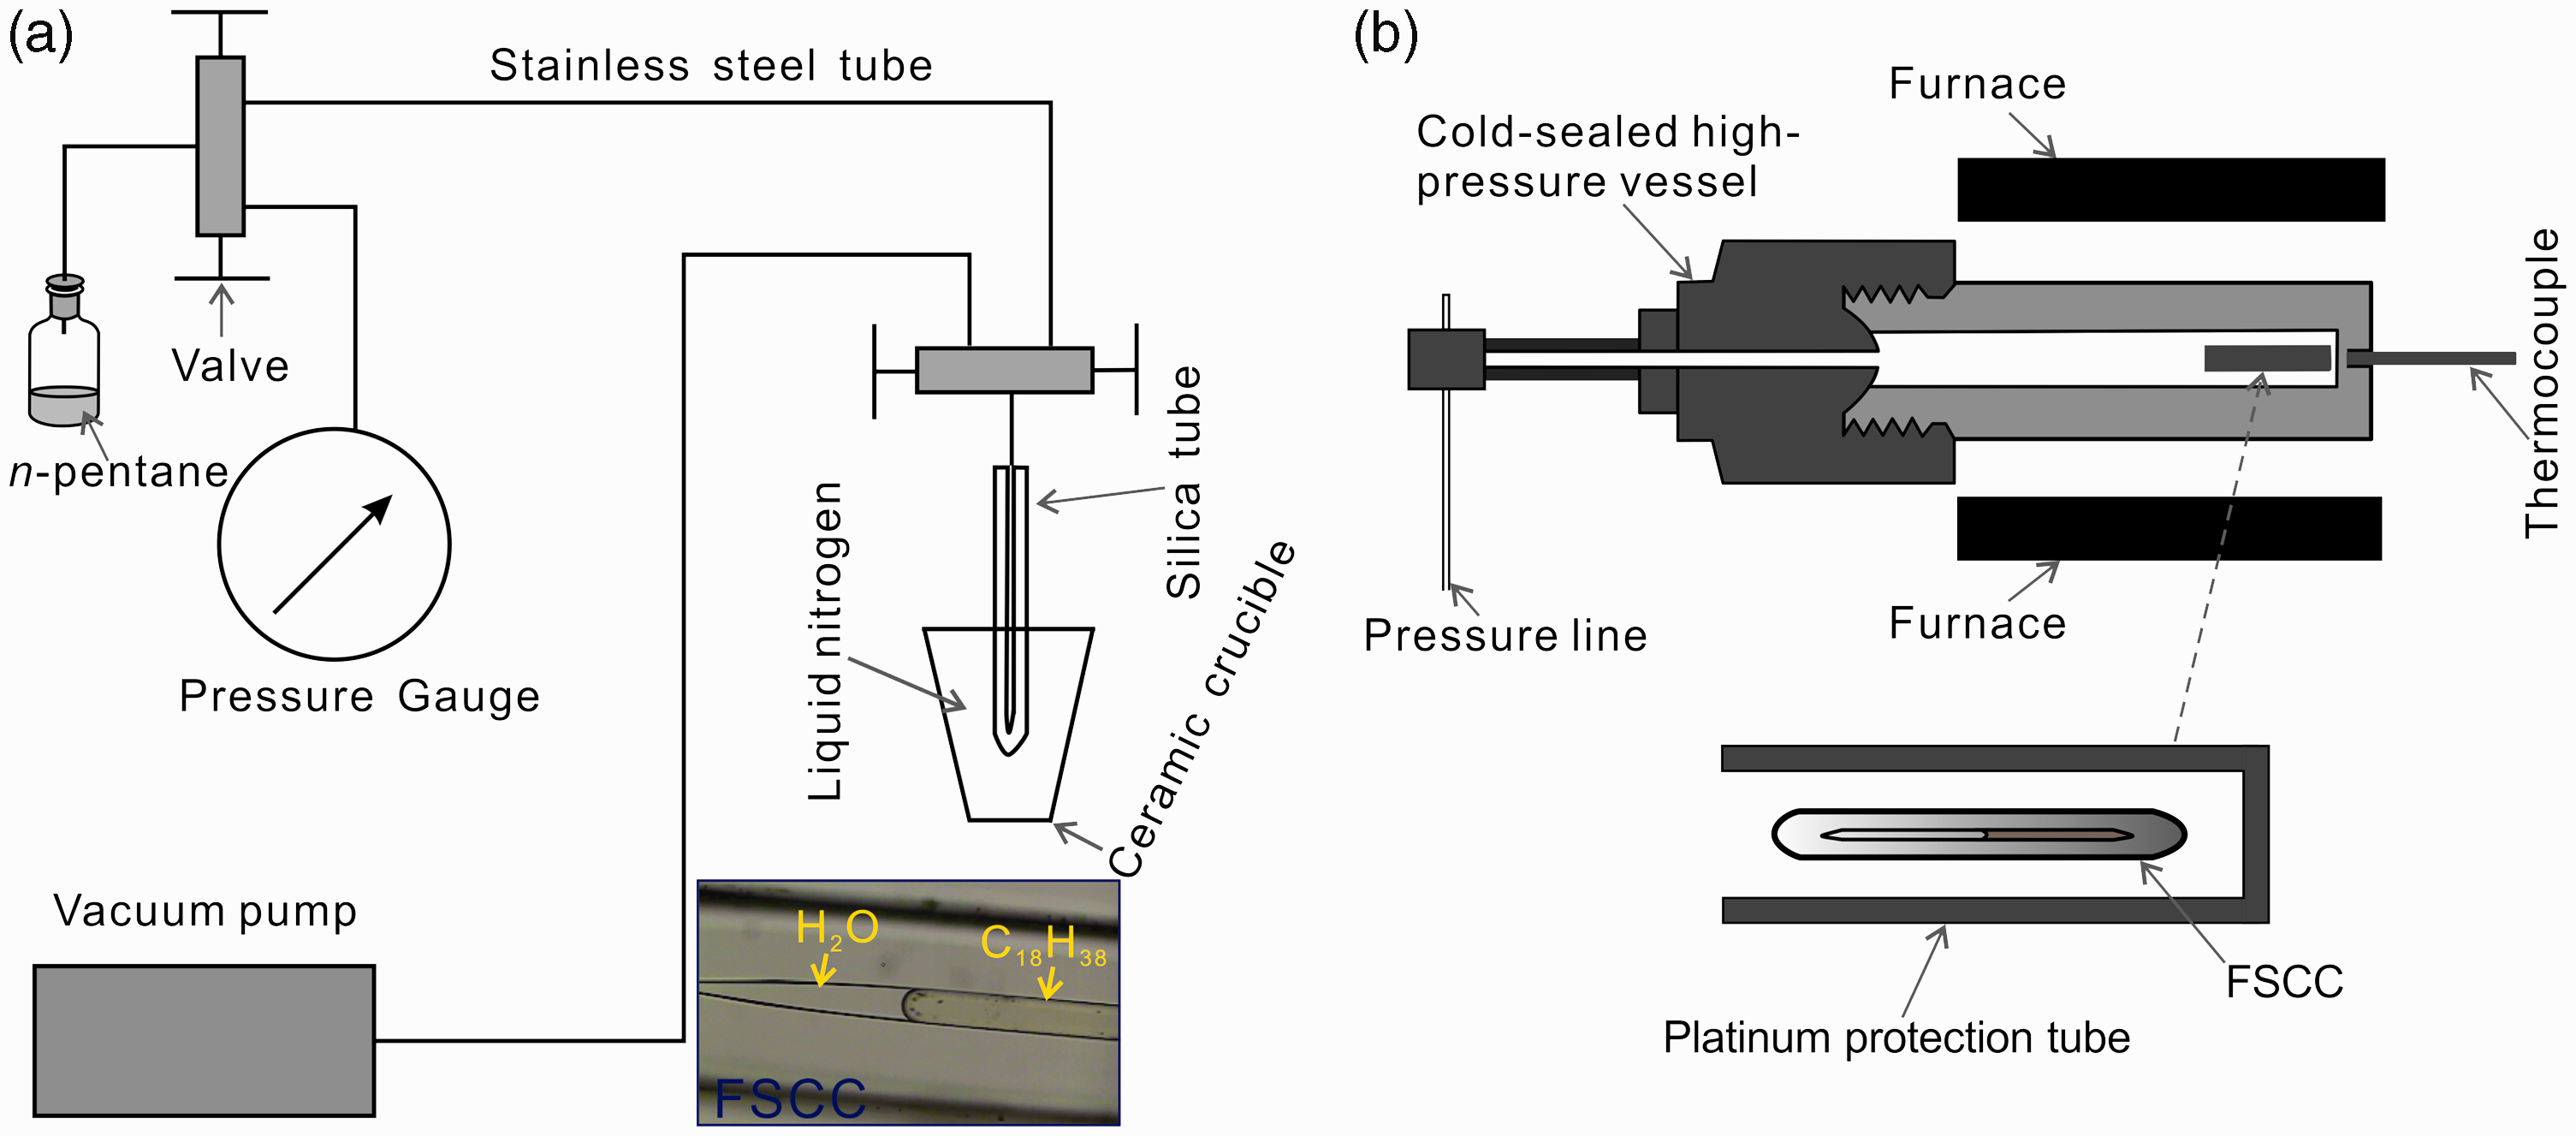
Sample heating
To protect the fragile FSCCs, they were loaded into one-end-open platinum tubes, which were thicker and longer than the FSCCs. Then, the platinum tubes together with the FSCCs were loaded into cold-sealed high-pressure vessels (Figure 1(b)). Before heating in horizontal furnaces, the vessels were pressurized to 200 MPa using Ar as pressure medium with a high-pressure pump. The sample temperatures were measured using K-type thermocouples (accurate to ± 3℃). For the n-pentane and n-pentane–water system, the FSCCs were heated at 300℃ for 12–125 h. The cold-sealed high-pressure vessel was removed from the furnace at the end of each heating. The vessel and FSCCs were cooled to room temperature through natural cooling. Then, the vapor and aqueous phases of the FSCCs were analyzed using Raman spectrometer at room temperature.
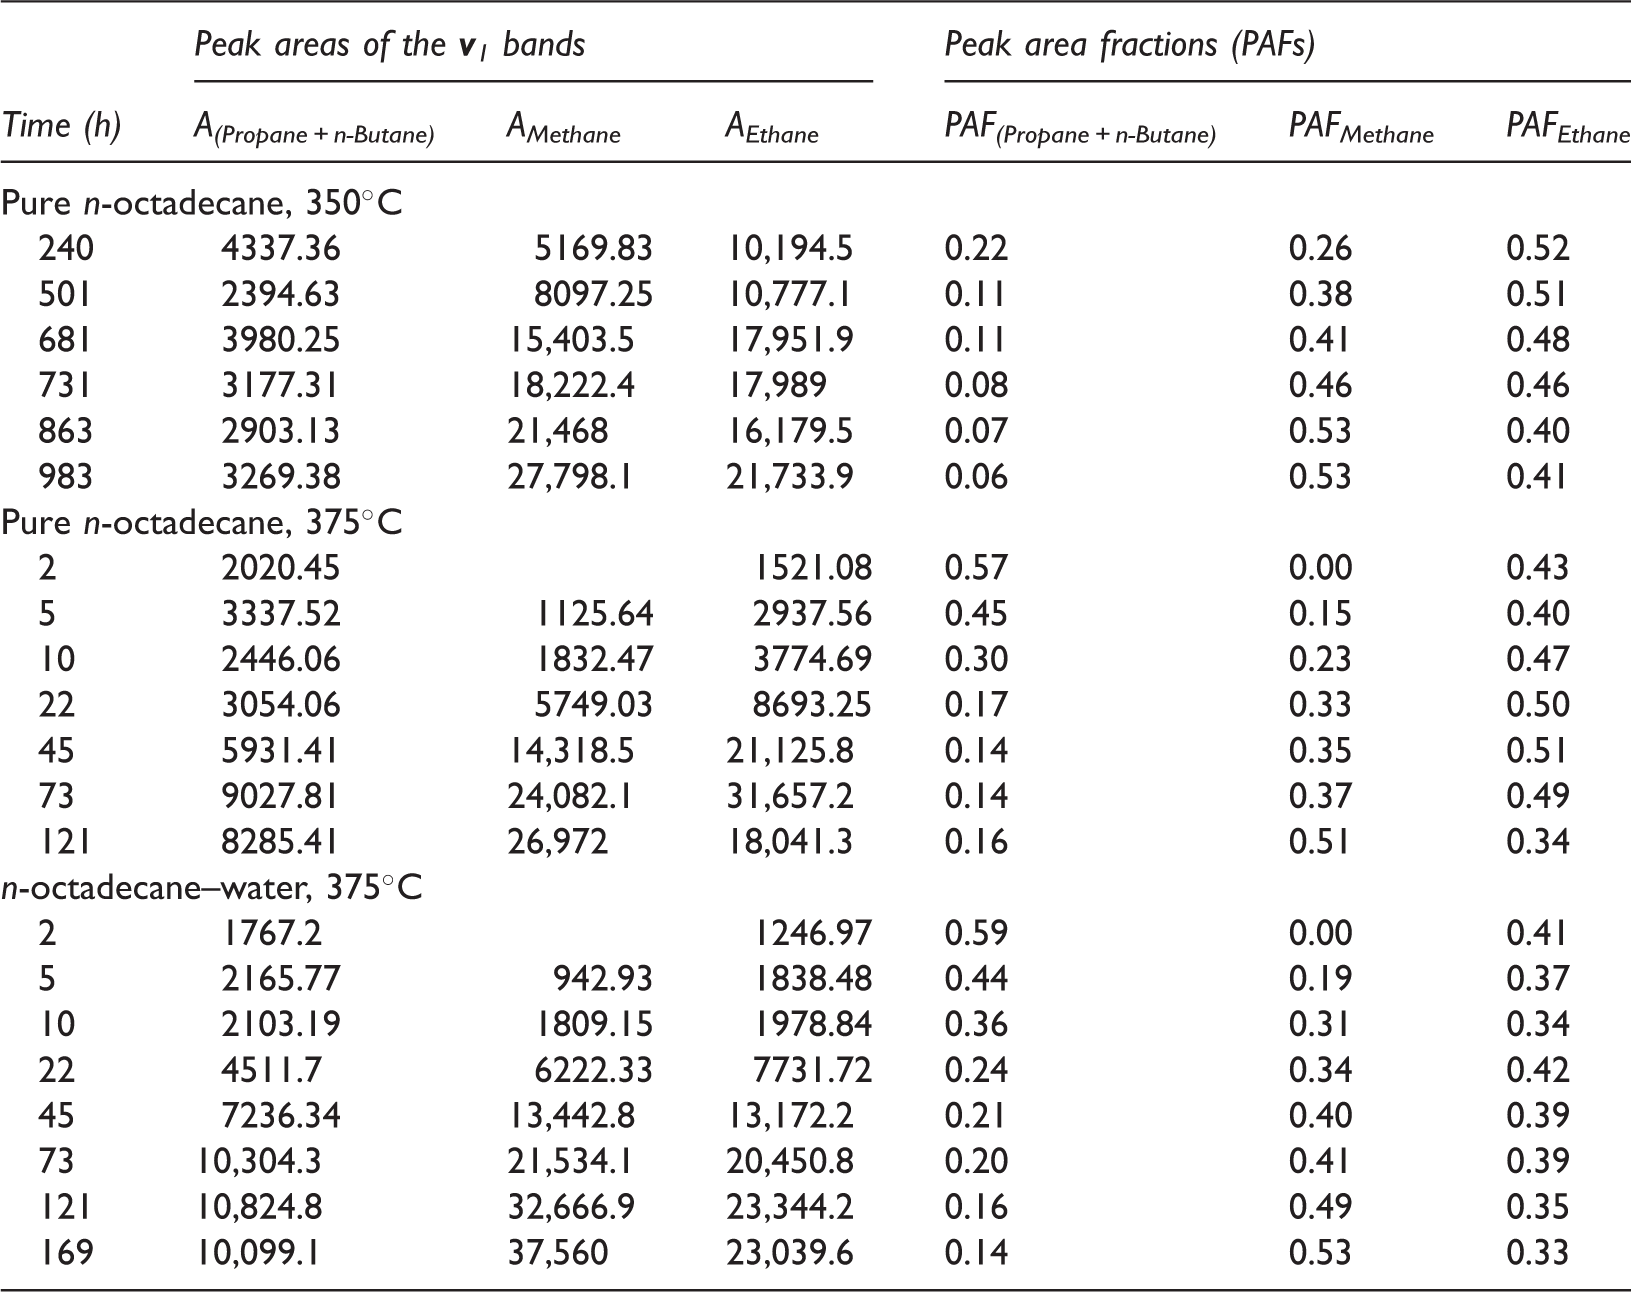
Variations in the Raman peak areas and corresponding peak area fractions of the v1 bands of methane, ethane, and propane + n-butane with experimental duration in n-octadecane and n-octadecane–water systems.
Collection and processing of Raman spectra
The vapor, aqueous, and solid (if present) phases in the FSCCs were analyzed at 21–22℃ using a Raman spectrometer before and after heating. The Raman spectrometer used in this study is JY/Horiba LabRam HR800 with 532.06 nm (frequency doubled Nd:YAG) laser excitation. A 40× Olympus long-working distance objective with 0.25 numerical aperture and 600 grooves/mm grating were applied. The spectral resolution is ∼2 cm−1. The laser rated at ∼18 mW was focused on the central level of the horizontal FSCC during spectral measurements. The spectra were collected between 50 and 4000 cm−1 and acquired for 60–240 s with 2–3 accumulations per spectrum. The collected spectra were processed using the Labspec 5.58.25 software.
Experimental results
C5H12–H2O system
As shown in Figure 2, the C–H stretching vibration mode in the vapor phase did not show obvious changes after heating at 300℃ for 125 h, whereas a shoulder (∼2936 cm−1) on the left side of the O–H stretching mode of water was observed in the aqueous phase. The spectra of methyl, ethyl, and isopropyl alcohols were also presented in Figure 2 for comparison. These spectra indicated ethanol as the major product in the aqueous phase (Xu and Chou, 2017). For the pure n-pentane system, no cracking product was identified in the vapor phase after heating at 300℃ for 64 h.
Raman spectra of the vapor and aqueous phases of an FSCC containing n-pentane and water before and after heating. The spectra of methyl, ethyl, and isopropyl alcohol solutions were also presented for reference. The inset figure shows the C–H stretching vibration region of the vapor phase before and after heating at 300℃ for 125 h (see the text for detail). Gray stars in the inset figure show the peaks of n-pentane. The peak at 2992.52 cm−1 is a calibration line from a He–Ne laser (632.817 nm) relative to the Nd-YAG line at 532.06 nm.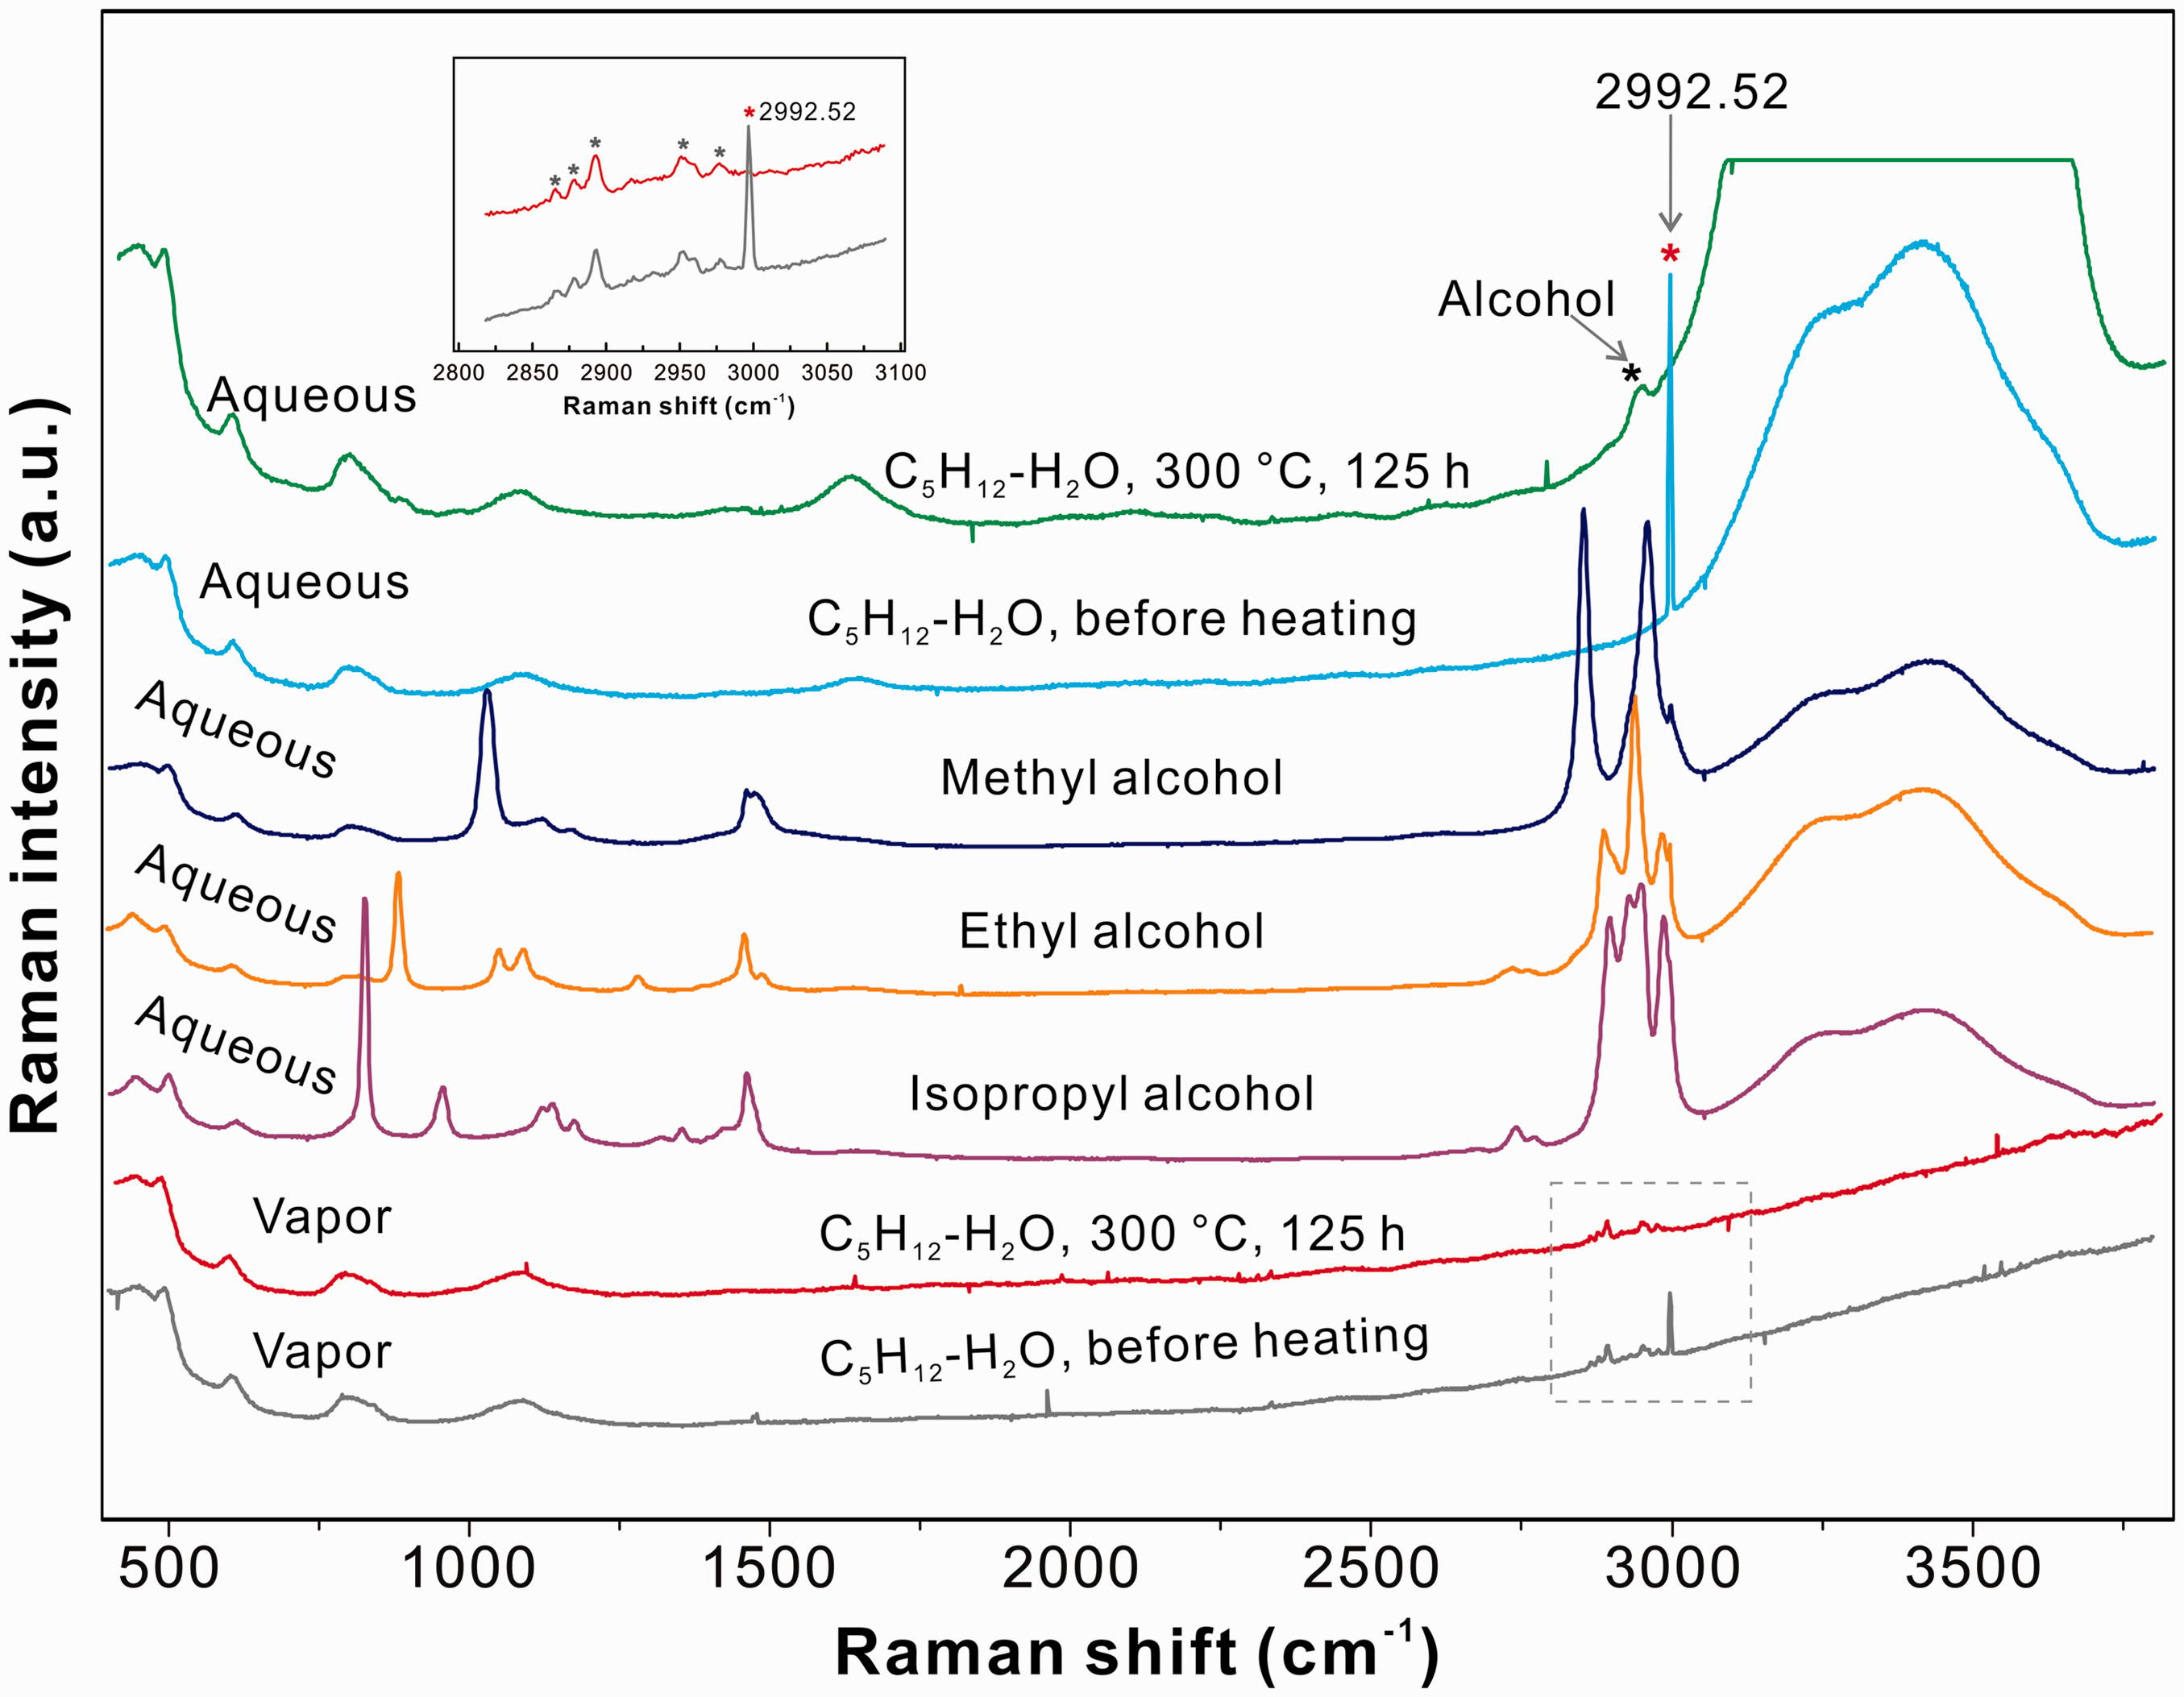
C18H38 and C18H38–H2O systems
For the pure n-octadecane system, five peaks were observed in the C–H stretching region after heating at 375℃ for 73 h: four well-defined peaks at ∼2888, 2901, 2918, and 2956 cm−1, and one shoulder at ∼2884 cm−1 (Figure 3). The prominent peak at ∼2918 cm−1 was assigned to the v1 symmetric C–H stretching mode of methane (red star in Figure 3; Burke, 2001; Chou et al., 1990; Frezzotti et al., 2012; Larsen et al., 1992; Magnotti et al., 2015). The 2956 cm−1 peak was ascribed to the v1 symmetric CH3 stretching vibration of ethane, while the peak at ∼2901 cm−1 was from a complex Fermi resonance in the C–H stretching region of ethane (green star in Figure 3; Burke, 2001; Frezzotti et al., 2012; Magnotti et al., 2015). The peak at ∼2888 cm−1 arose from the symmetric stretching vibration of propane (blue star in Figure 3; Burke, 2001; Frezzotti et al., 2012; Magnotti et al., 2015). The weak shoulder at ∼2884 cm−1 represented the C–H stretching vibration of n-butane (gray star in Figure 3; Pele et al., 2011). Another two peaks at ∼869 cm−1 (blue star) and 993 cm−1 (green star) were also observed in the low wavenumber region (Figure 3), which were assigned to the C–C stretching vibrations of propane and ethane, respectively (Flurry, 1975; Magnotti et al., 2015). These spectra indicated that n-octadecane was cracked to form methane, ethane, propane, and n-butane at elevated temperatures.
Raman spectra of the vapor and aqueous phases of FSCCs containing n-octadecane and n-octadecane + water before and after heating. The spectrum of solid n-octadecane before heating was also shown. Inset figure shows the C–H stretching vibration region of the vapor phase of an FSCC containing n-octadecane after heating at 375℃ for 73 h (see the text for detail).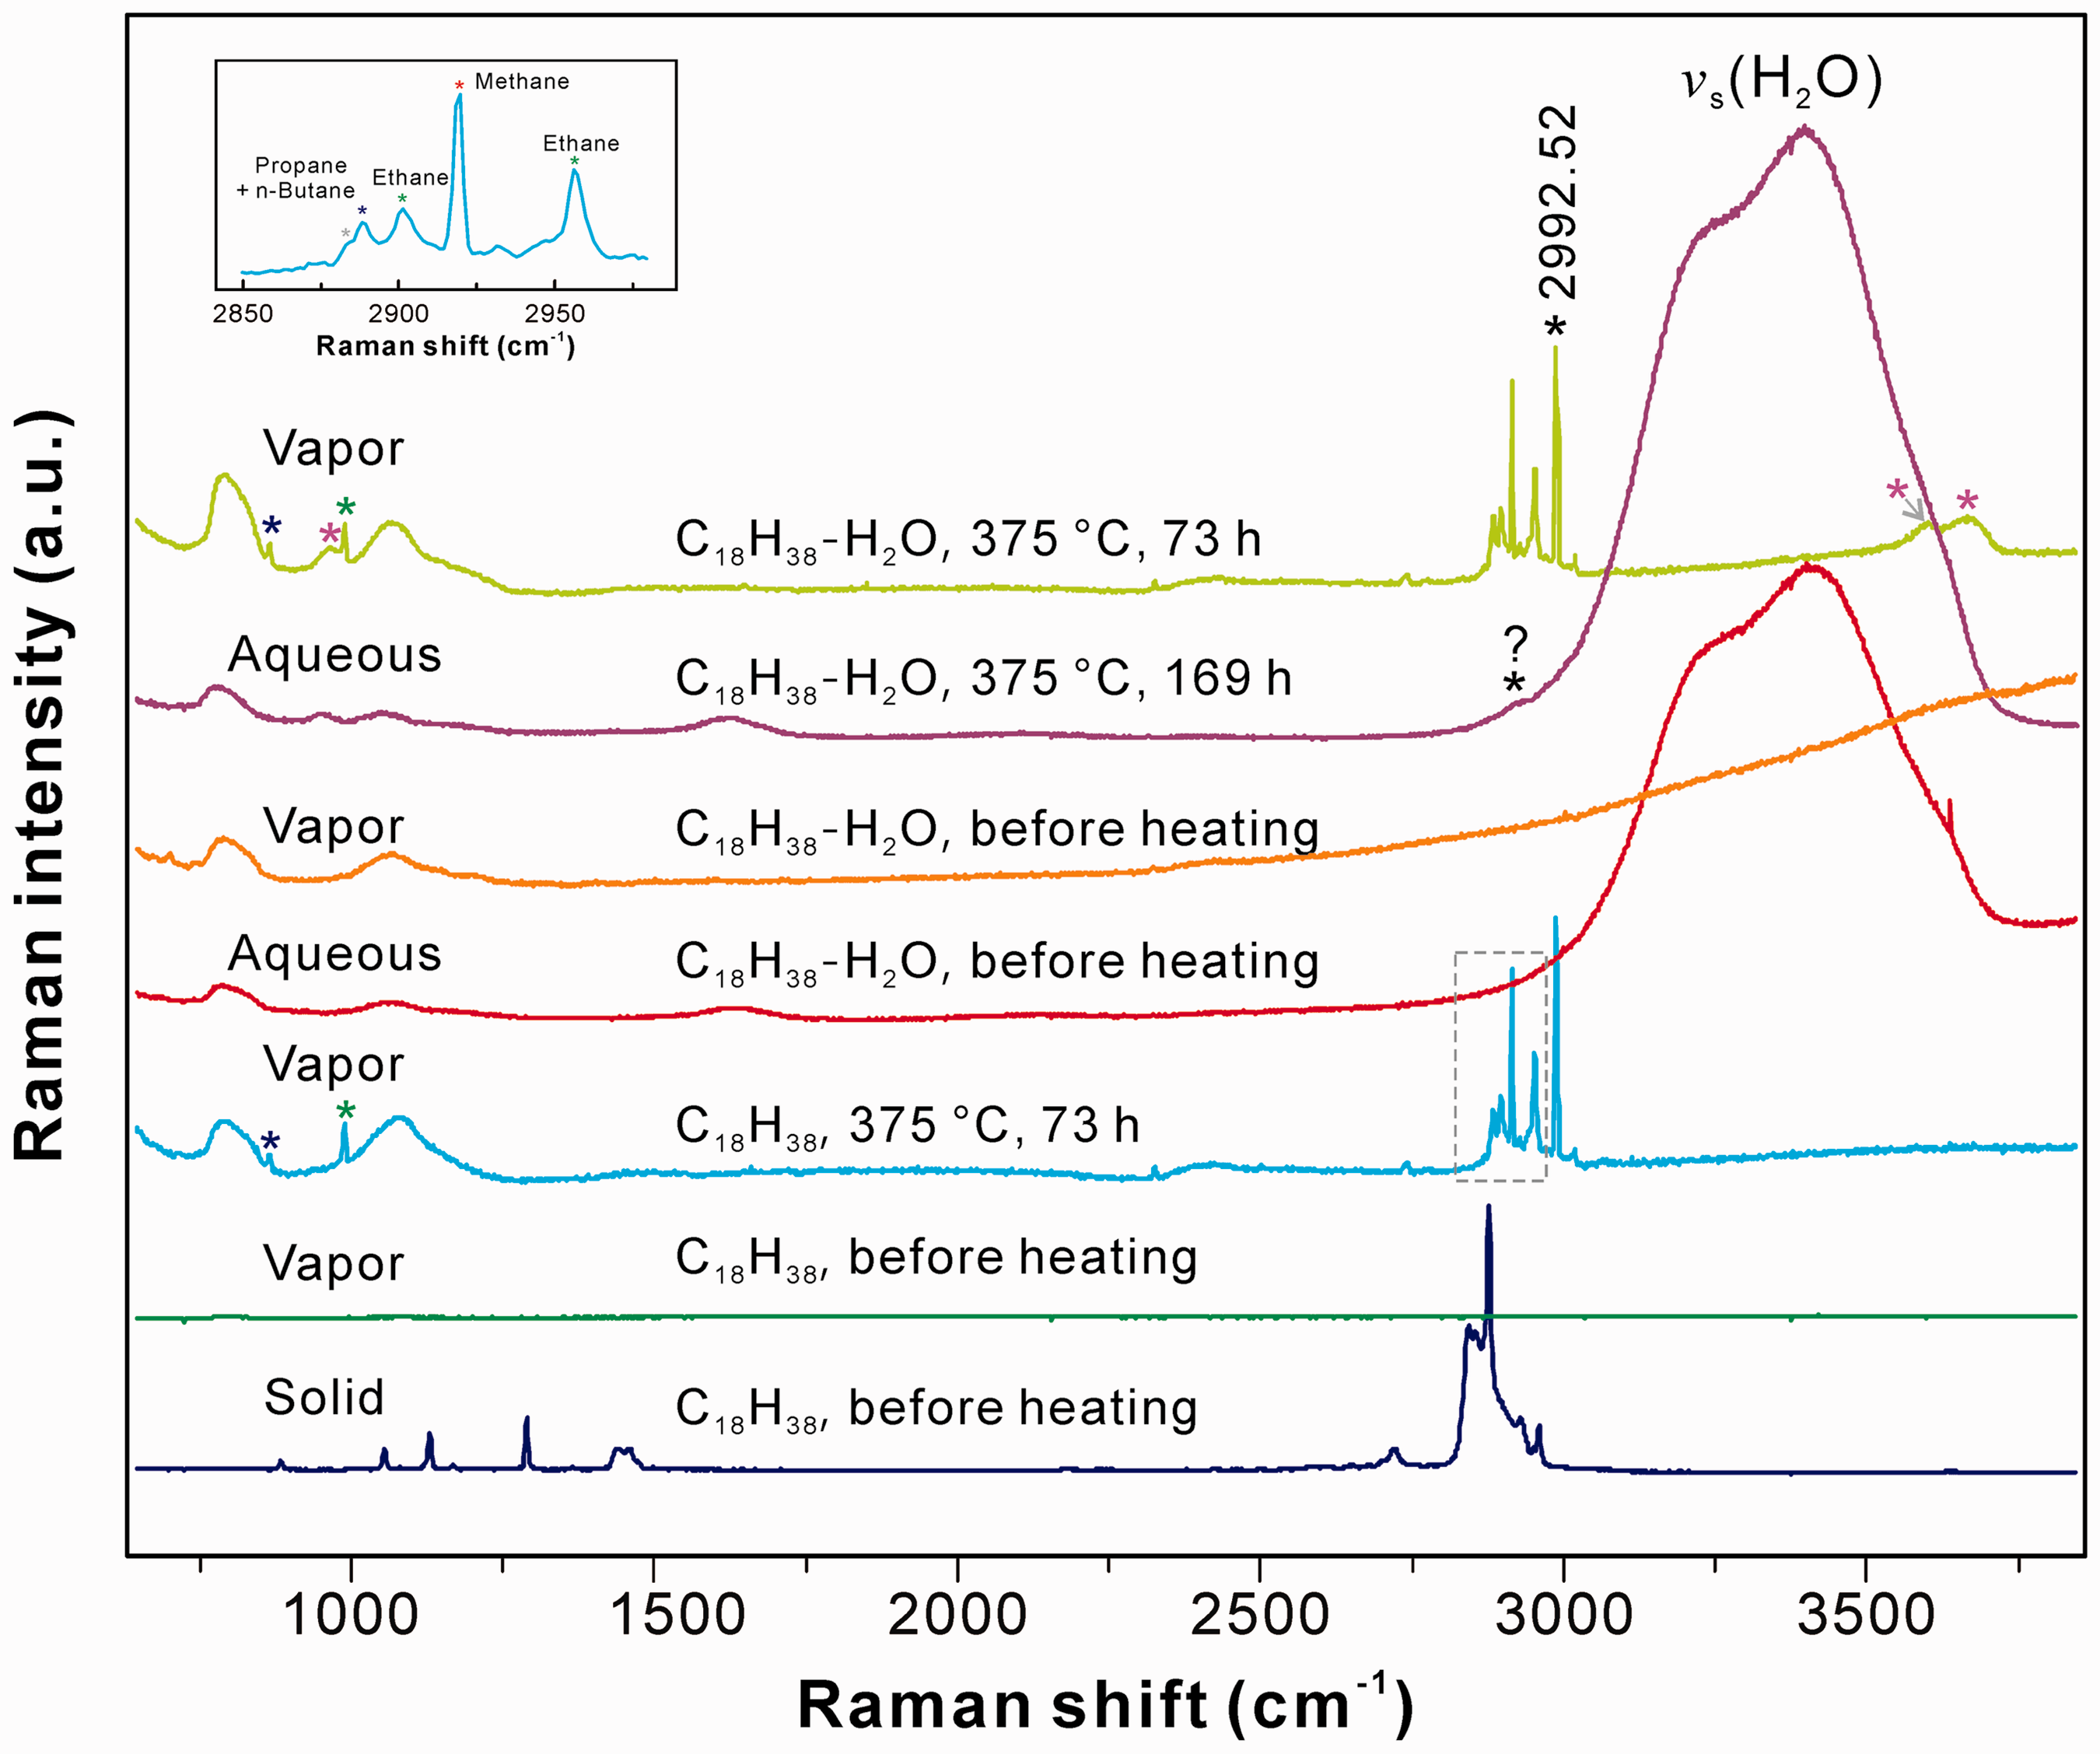
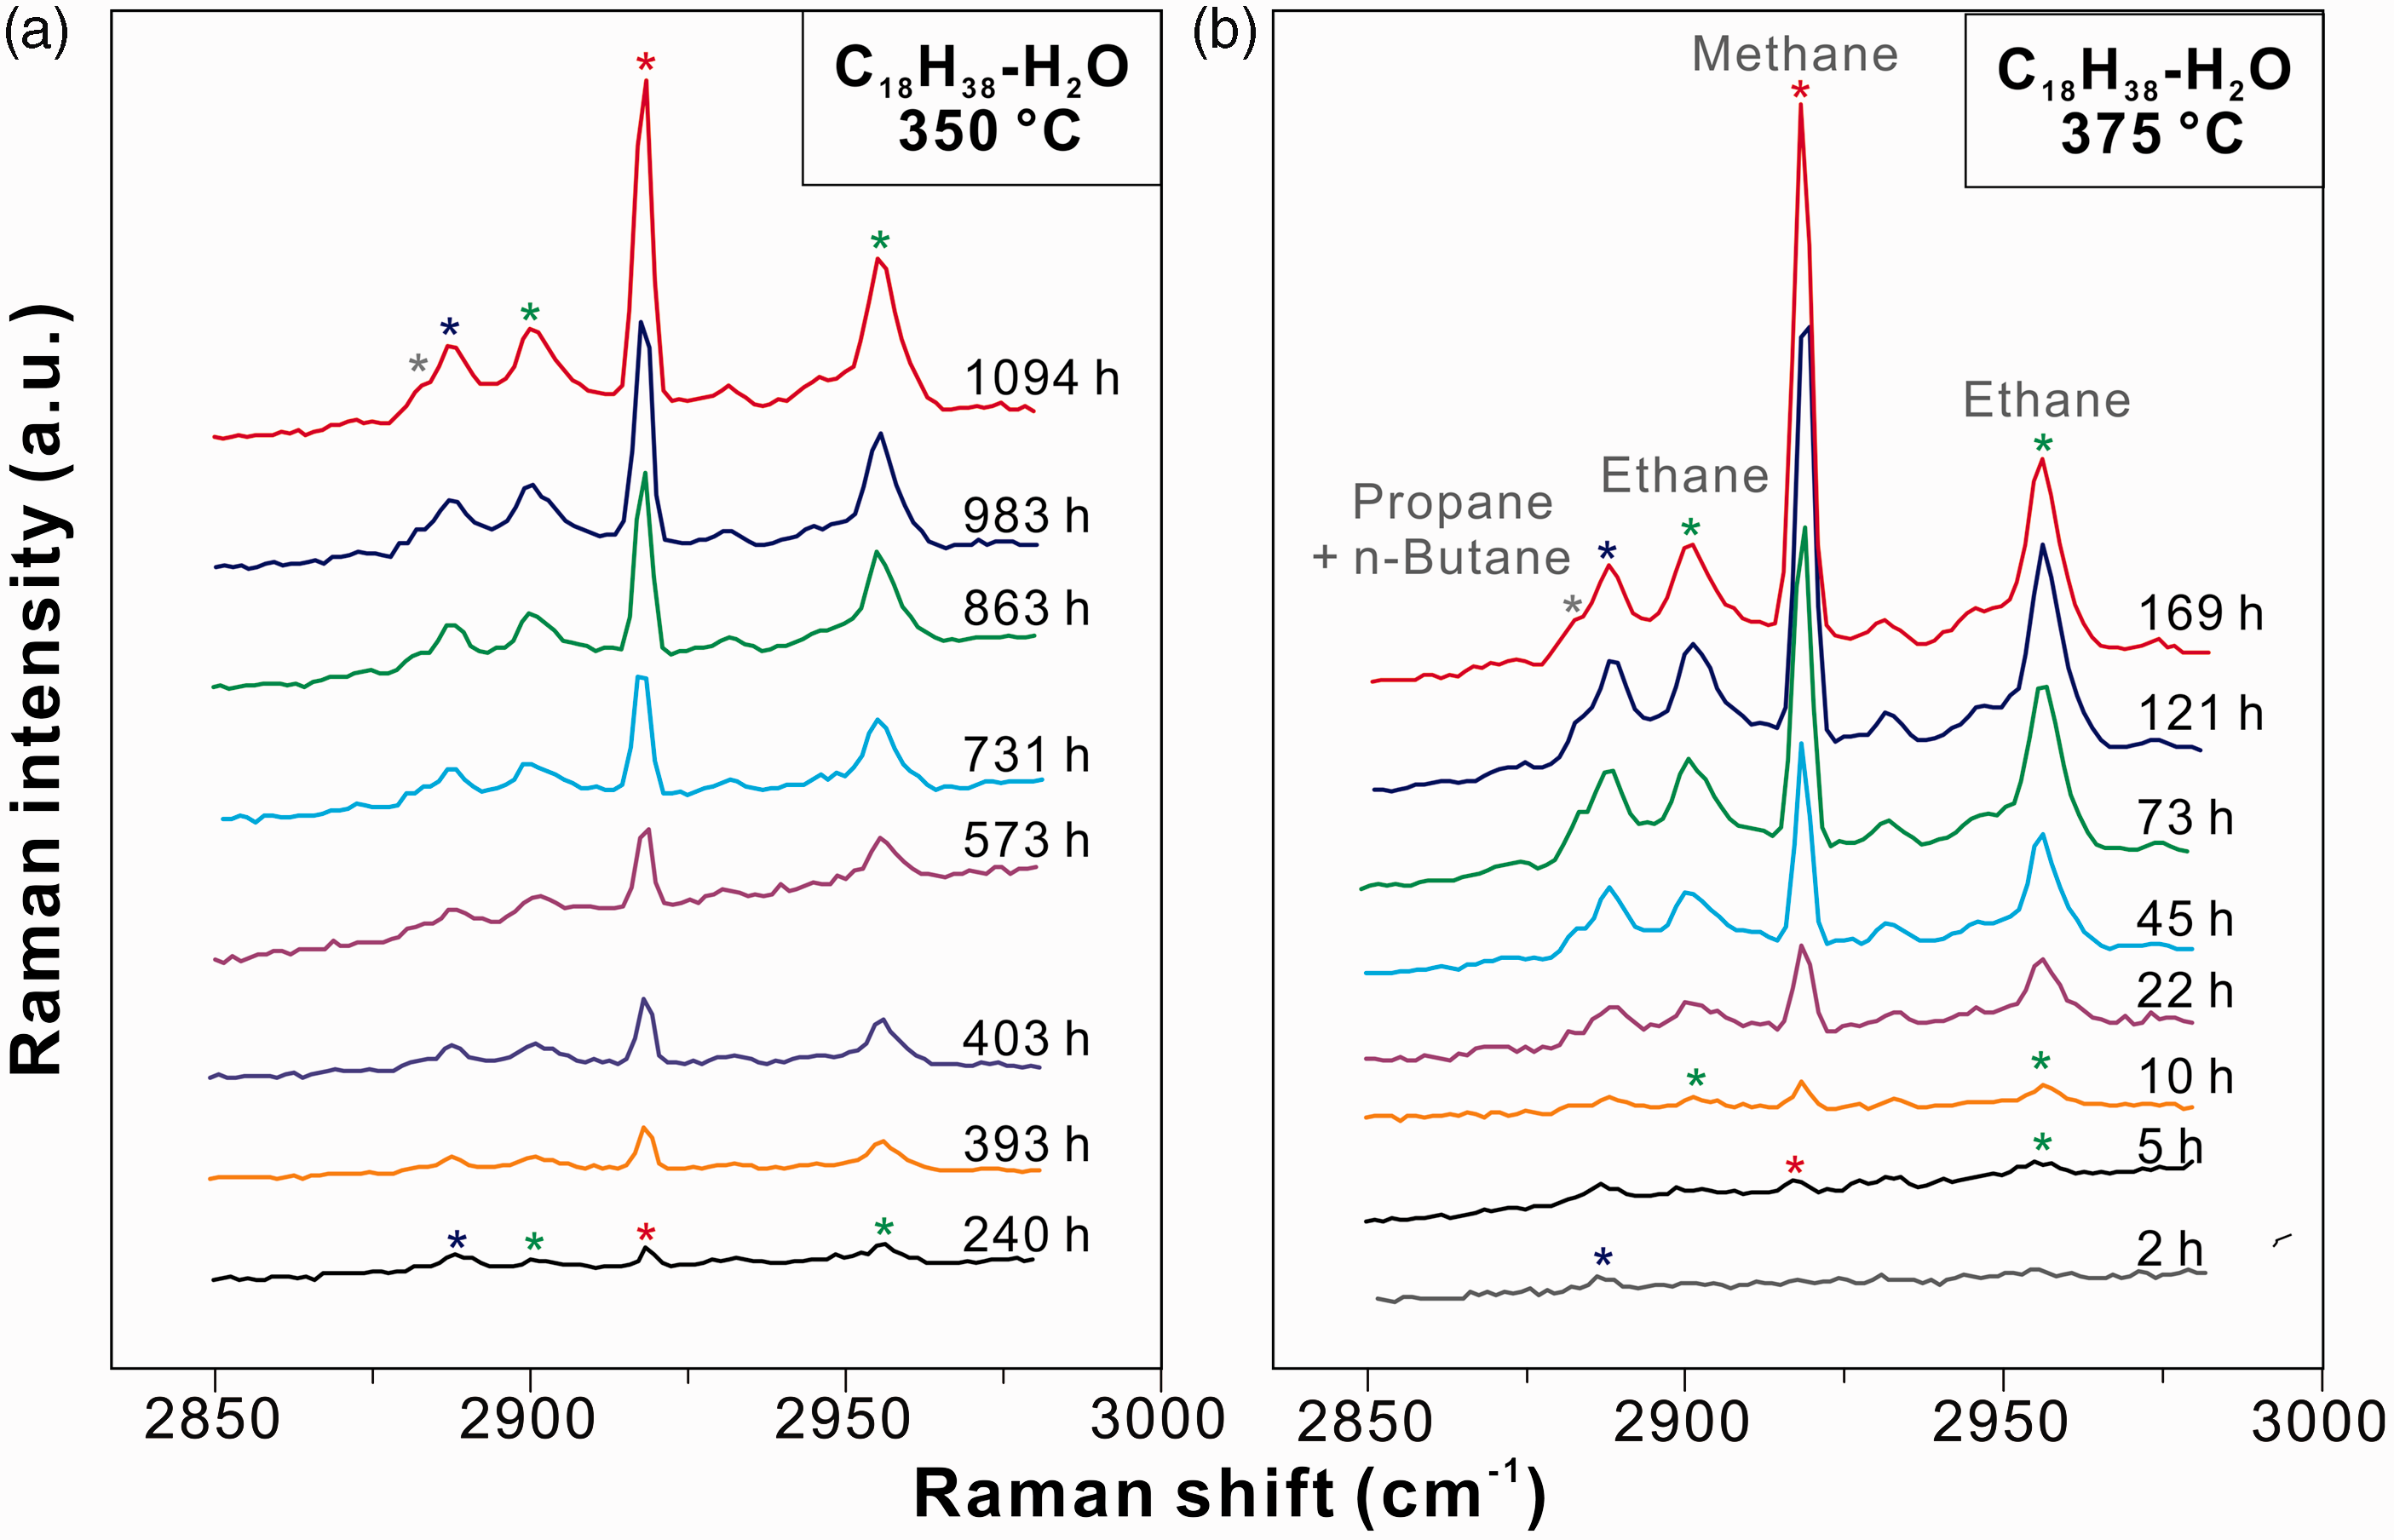
As to the n-octadecane–water system, the vapor phase spectrum can be well compared with that of the pure n-octadecane system; the spectra of methane, ethane, propane, and n-butane were also observed when the sample was heated at 375℃ for 73 h (Figure 3). After heated at 375℃ for 169 h, a weak shoulder (∼2918–2942 cm−1) was observed on the left side of the O–H stretching mode of water. The exact assignment of this peak was not accomplished in this study. However, taking into account the result of the n-pentane experiment, we suspect a possible assignment to alcohols (e.g. ethanol; Xu and Chou, 2017). Comparisons of the spectra before and after reactions indicated that both cracking and hydrolysis occurred in the presence of water. Additional peaks at ∼969, 3604, and 3678 cm−1 were ascribed to H2O or OH in the structure of silica tube formed during heating (purple star in Figure 3; Xu and Chou, 2017).
Figures 4 and 5 show the changes of the vapor phase Raman spectra covering the C–H stretching region at different experimental durations. The Raman signals of all produced gaseous hydrocarbons increased with increasing experimental duration, in which the increase of methane intensity was the most significant. Whether in the anhydrous experiments (Figure 4(a) and (b)) or in the hydrous experiments (Figure 5(a) and (b)), the effect of temperature on the production of gaseous hydrocarbon species was not obvious. For the isothermal experiments at 375℃ (Figures 4(b) and 5(b)), the methane signal was not detected after heating for 2 h, whereas the signals of ethane (∼2956 cm−1) and propane (∼2888 cm−1) were observed. Methane (∼2918 cm−1) was identified after 5 h of heating at 375℃
Raman spectra of the C–H stretching vibration region in the vapor phases of FSCCs containing n-octadecane after heating (a) at 350℃ for 240 to 983 h and (b) at 375℃ for 2 to 121 h, respectively. Raman spectra of the C–H stretching vibration region in the vapor phases of FSCCs containing n-octadecane and water after heating (a) at 350℃ for 240 to 1094 h and (b) at 375℃ for 2 to 169 h, respectively.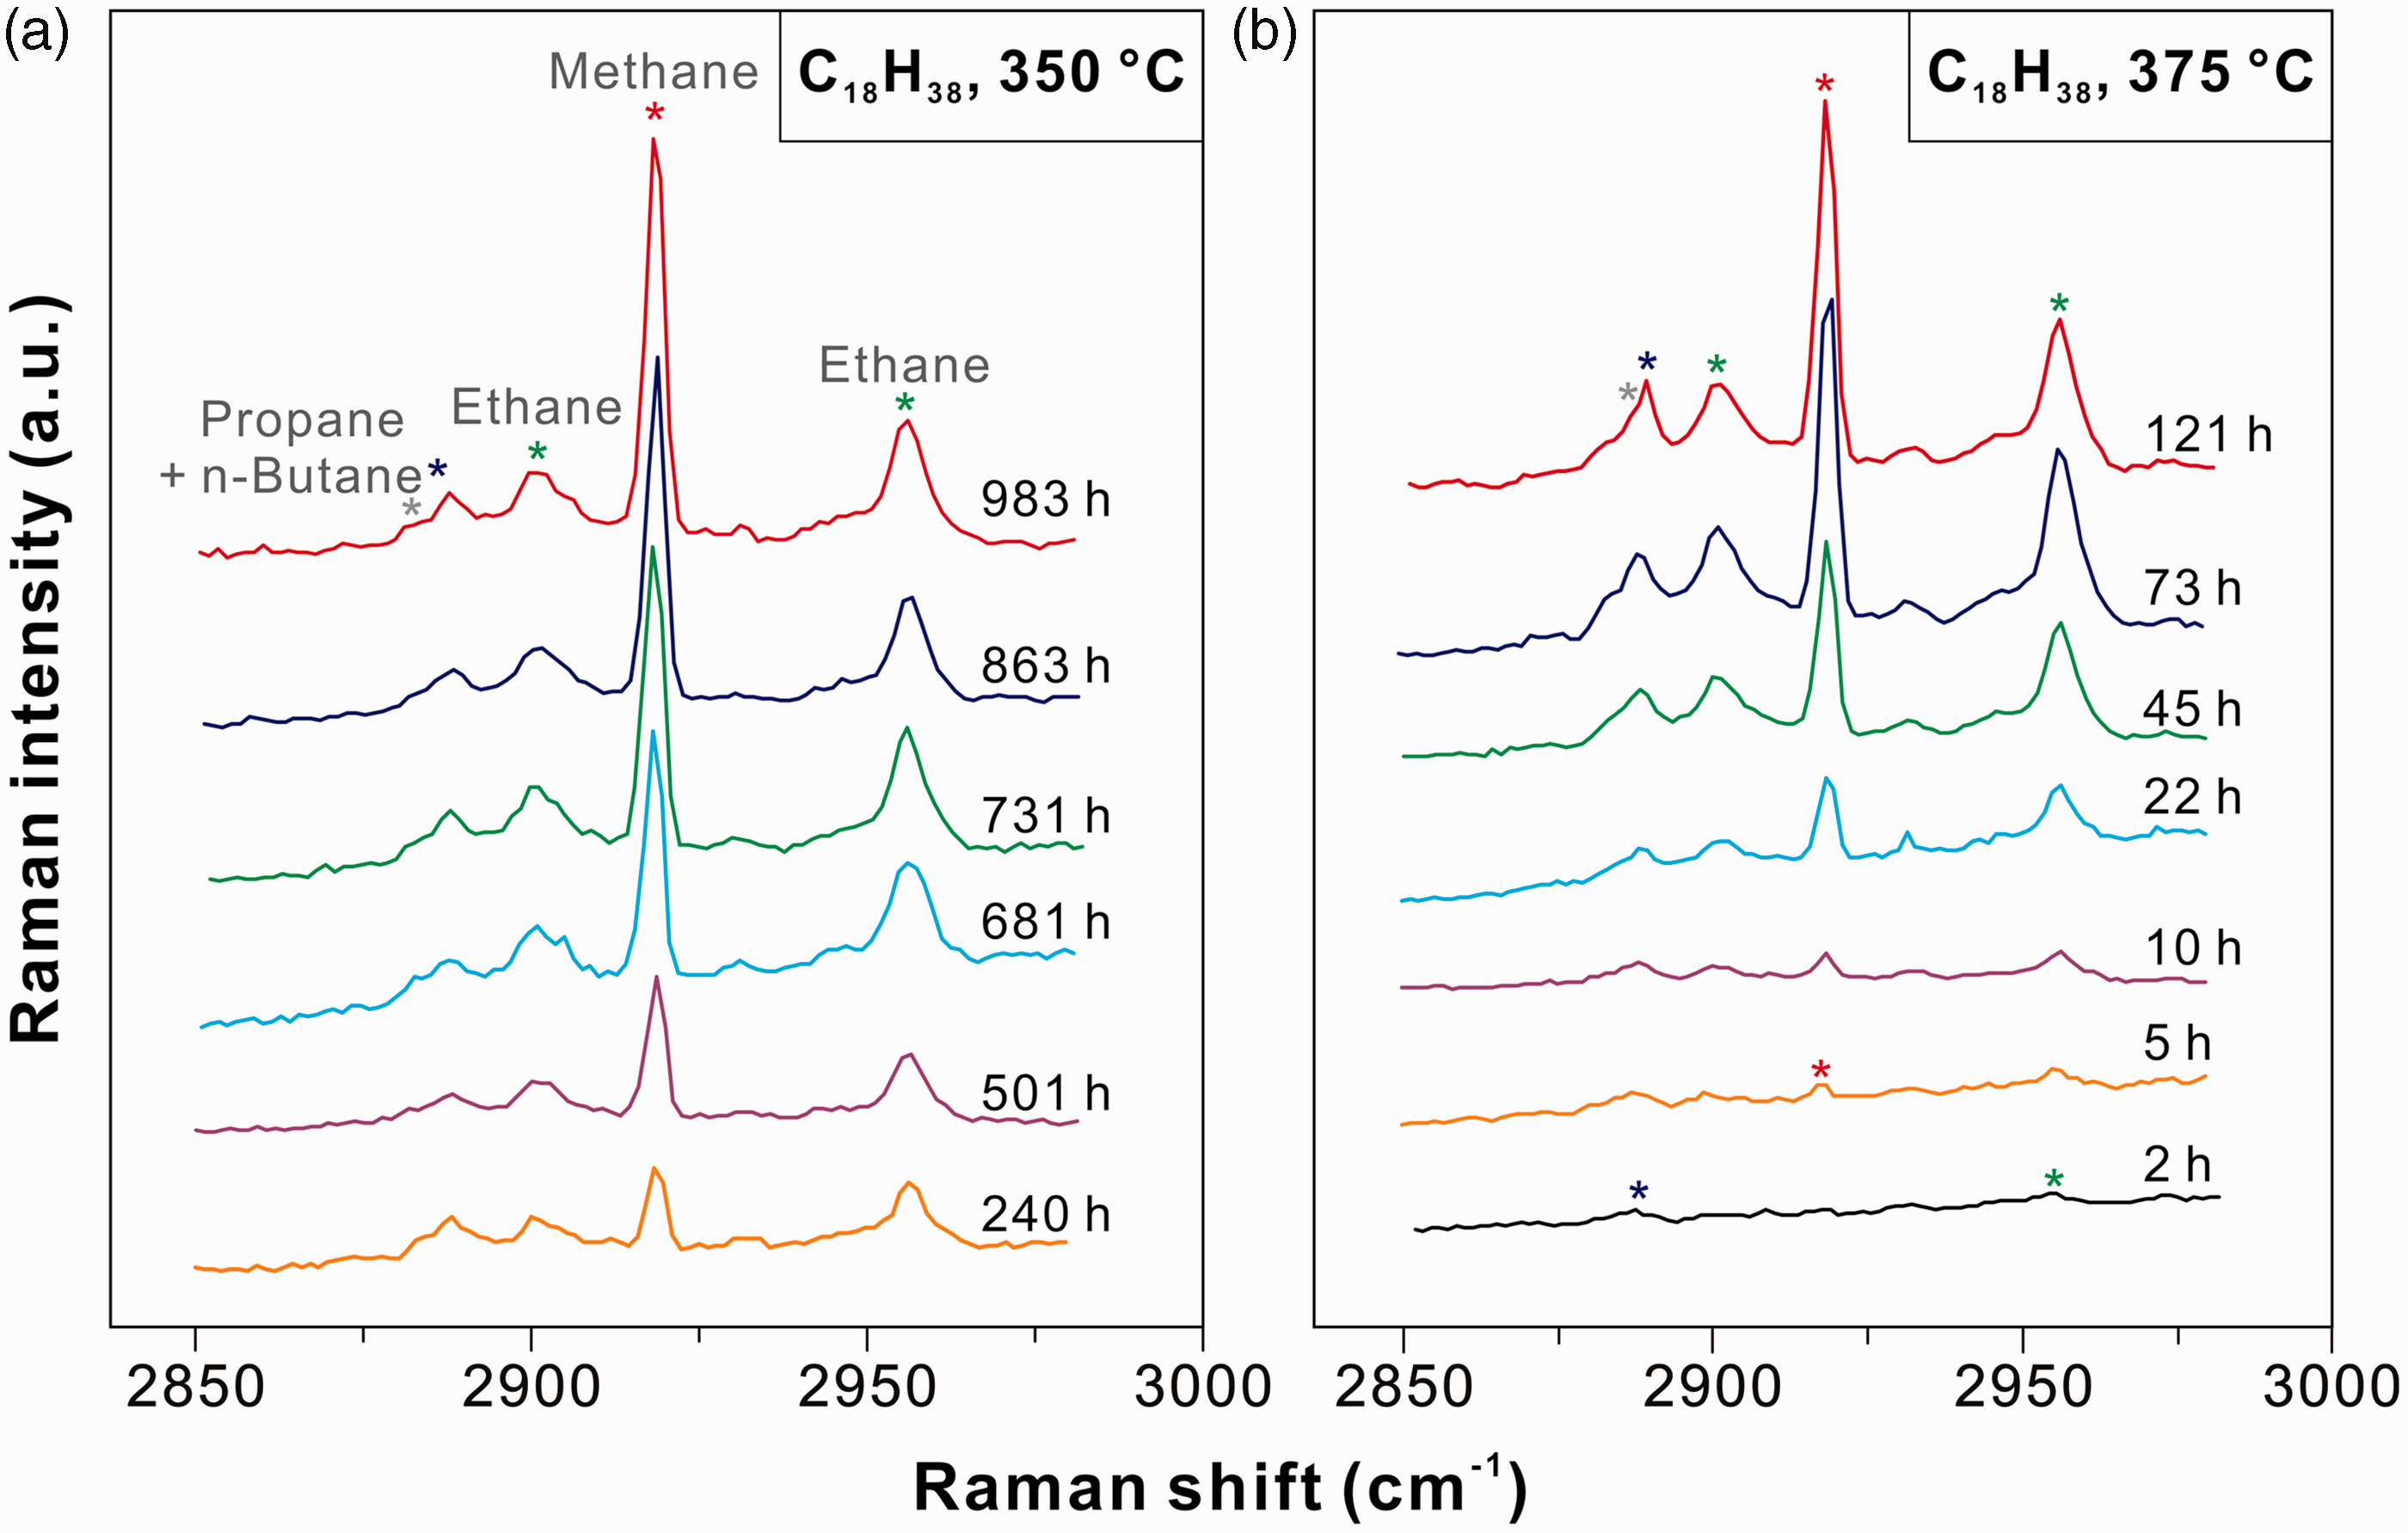
Discussion
Cracking of n-octadecane
Previous experimental studies were mainly focused on the kinetics of the cracking of petroleum and the compositions of the cracking yields (e.g. Chen et al., 2014, 2016; Feng et al., 2002; Guo et al., 2011; He et al., 2013; Jiang et al., 2009; Liu et al., 2016; Ma, 2016; Shuai et al., 2012; Tian et al., 2006; Uguna et al., 2016; Wang et al., 2015; Xiong et al., 2016; Zhang et al., 2009; Zhao et al., 2008), whereas relevant studies on the reaction pathway were limited. Hill et al. (2003) proposed an oil cracking scheme based on their experimental observations using pyrolysis of crude oil combined with gas chromatography–mass spectrometry (GC–MS) analysis. They argued that petroleum can be cracked to form lighter hydrocarbons, methane, and pyrobitumen. Xiong et al. (2004) investigated the thermal cracking of n-octadecane using GC and GC–MS methods. Their results showed that, in addition to lighter hydrocarbons, the cracking of n-octadecane generated residual carbon (Xiong et al., 2004). Therefore, the cracking scheme of n-octadecane might be summarized as follows:
C18H38 → C15+ + C6-14 + C2-5 + C1 + residual carbon C15+ → C6-14 + C2-5 + C1 + residual carbon C6-14 → C2-5 + C1 + residual carbon C2-5 → C1 + residual carbon
Since the Raman signals can be obscured in the presence of fluorescence, Raman spectra of the liquid hydrocarbon products were not available. Some other analytical methods, such as GC–MS used by Seewald (2001) and Teinturier et al. (2003), are needed to fully explore the cracking process of n-octadecane. This study was focused on the gas-phase products which could be detected at room temperature. In other words, the C4+ hydrocarbon products were also present in the FSCCs, but they could not be identified by Raman spectroscopy due to their low concentration in the vapor phase and/or presence of fluorescence. However, the Raman spectra of the vapor products indicated that C2+ hydrocarbons were cracked to form methane with increasing experimental durations (Figure 4(b)), which supports the cracking reaction pathway proposed by Hill et al. (2003).
The absolute yields of the vapor products could not be obtained due to the lack of an internal standard. Alternatively, the fractions of Raman peak areas of the v1 bands of methane, ethane, and propane + n-butane were calculated to describe the relative concentrations of C1–C4 components. The fractions of relevant Raman peak areas can be used to reveal the variations in the fractions of each gaseous product, similar to those in the calculation of the fractions of different aqueous sulfate species (Wan et al., 2017; Wang et al., 2016). In fact, the exact fractions of each vapor product cannot be obtained due to the lack of Raman scattering cross-sections of the v1 bands of C1–C4 (Burke, 2001). As shown in Figure 6(a), when the FSCC containing n-octadecane was heated at 350℃, the PAF of methane continued to increase with increasing experimental duration and reached 0.53 at 863 h. At the same time, the PAF of ethane and propane + n-butane decreased. This result indicated that long-chain alkanes might be further cracked to form methane. When n-octadecane was heated to 375℃, the PAF of ethane decreased with increasing experimental duration at <5 h, then increased at total heating duration of <45 h. After heated for 45 h, the PAF of ethane started to decrease with increasing time (Figure 6(b)). The PAF of methane always increased with time, whereas that of propane + n-butane decreased sharply with increasing time first, and reached 0.14–0.16 with experimental duration of > 22 h (Figure 6(b)). It should be noted that the variation in the PAFs of the above alkanes could also be ascribed to the continuous cracking of liquid hydrocarbon.
PAFs of the v1 symmetric stretching vibration bands of methane, ethane, and propane + n-butane as a function of experimental duration for pure n-octadecane system heated at (a) 350℃ and (b) 375℃.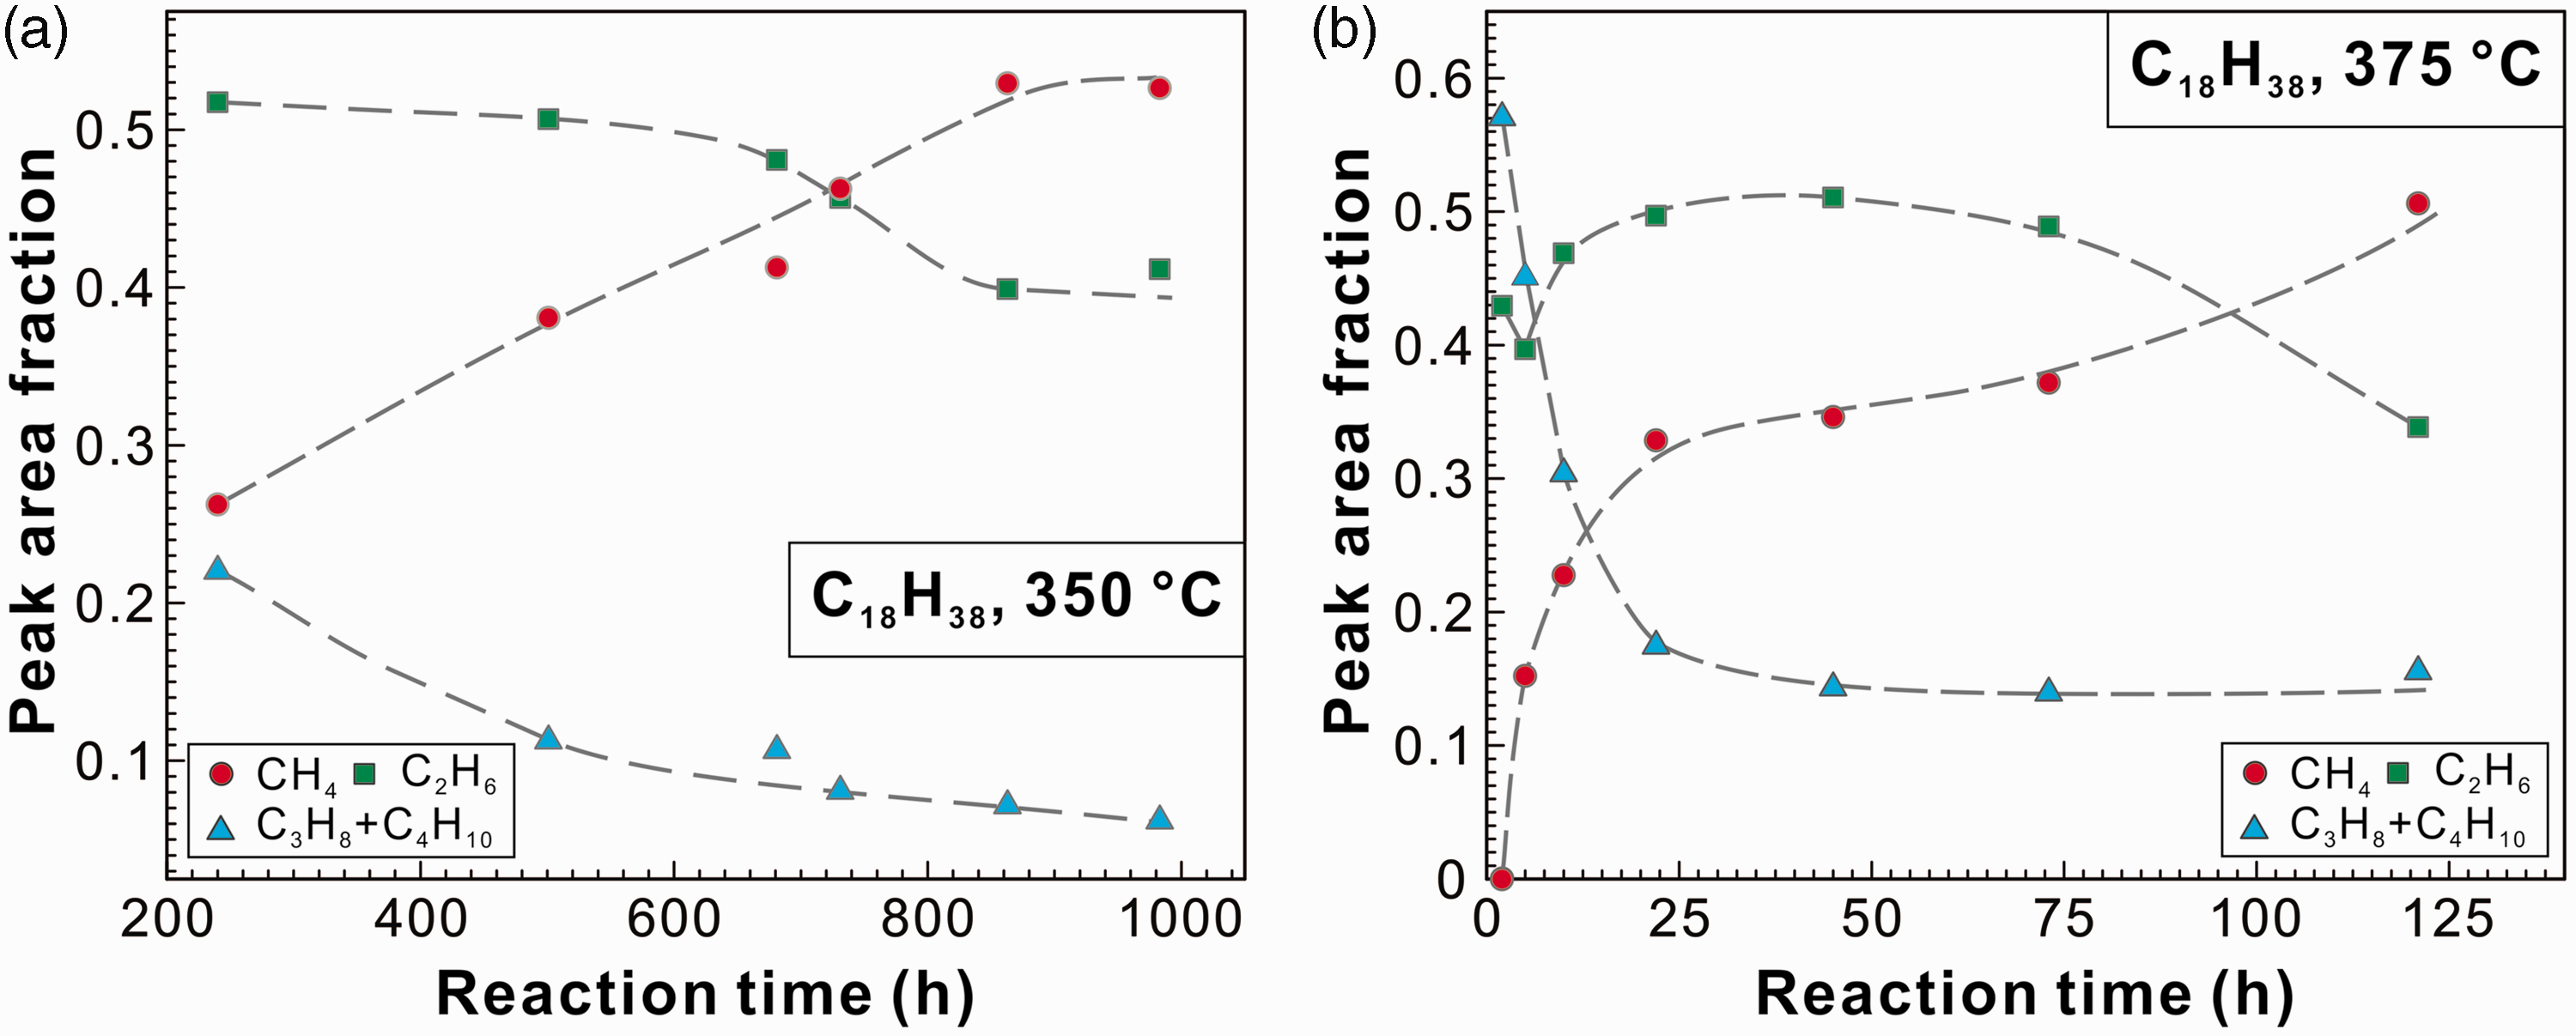
Hill et al. (2003) carried out pyrolysis experiments of 35° API gravity Devonian oil from the western Canada Sedimentary Basin in Alberta, Canada. The experiments were performed at temperatures ranging from 350 to 450℃ at 65 MPa pressure. At 360℃, both the C1 and C2–5 yields increased with experimental duration from 3 to 33.3 days. The fraction of C1 in the produced gaseous hydrocarbons can be calculated using the data listed in Table 1 of Hill et al. (2003); the fraction of C1 increased with increasing time. However, the fractions of other single gaseous alkanes (i.e. ethane, propane, butane, pentane) cannot be obtained. In this study, pentane was not detected in the vapor products, indicating its quite low concentration or quick conversion to C1–C4. The increase in the PAF of ethane (Figure 6(b)) might be ascribed to the extremely lower conversion rate of ethane to methane, compared with that of propane + n-butane to ethane. In addition, our results showed that, although the amount of total vapor yields increased with experimental duration, as indicated by the increasing Raman intensities, the fractions of single gaseous product varied a lot.
The vapor products of previous anhydrous pyrolysis experiments of petroleum often contained certain amount of hydrogen and alkene (Jiang et al., 2009; Shuai et al., 2012; Wang et al., 2001, 2015; Zhang et al., 2009). In this study, hydrogen and alkene were not detected. As to hydrogen, the diffusion of hydrogen in fused silica tube is much faster than that in the gold tube (Chou et al., 2008; Shang et al., 2009), and thus hydrogen tended to escape and could not be detected even when it was produced during the cracking of n-octadecane. For example, the production of CO2 and H2 in the decarboxylation of formic acid was observed after 2 h at 250℃ in an FSCC (Ong et al., 2013). However, the signal of H2 disappeared after 5 h, which was also ascribed to the diffusion of H2 molecule throughout the FSCC (Ong et al., 2013).
Figure 7(a) showed the variation of PAFs of methane, ethane, and propane + n-butane with time in the n-octadecane–water system. It can be seen that the cracking process of n-octadecane was similar to that in the anhydrous experiments (Figure 6(b)). Although the PAFs of the vapor products showed obvious differences before 121 h, the ultimate PAFs of these light hydrocarbons appeared to be similar (Figure 7(b)). Water was suggested to play important roles in the thermal maturation of kerogen and petroleum; water can serve as a solvent and catalyst, and an exogenous source of hydrogen (Feng et al., 2002; Lewan, 1997; Seewald, 2003; Shuai et al., 2012; Wang et al., 2015). In this study, the exact yields of C1–C4 were not available, thus the hydrogenation effect of water was not further discussed.
PAFs of the v1 symmetric stretching vibration bands of methane, ethane, and propane + n-butane as a function of experimental duration. (a) n-octadecane–water system heated at 375℃ and (b) comparison of PAFs of the produced gases during hydrous and anhydrous pyrolysis of n-octadecane at 375℃.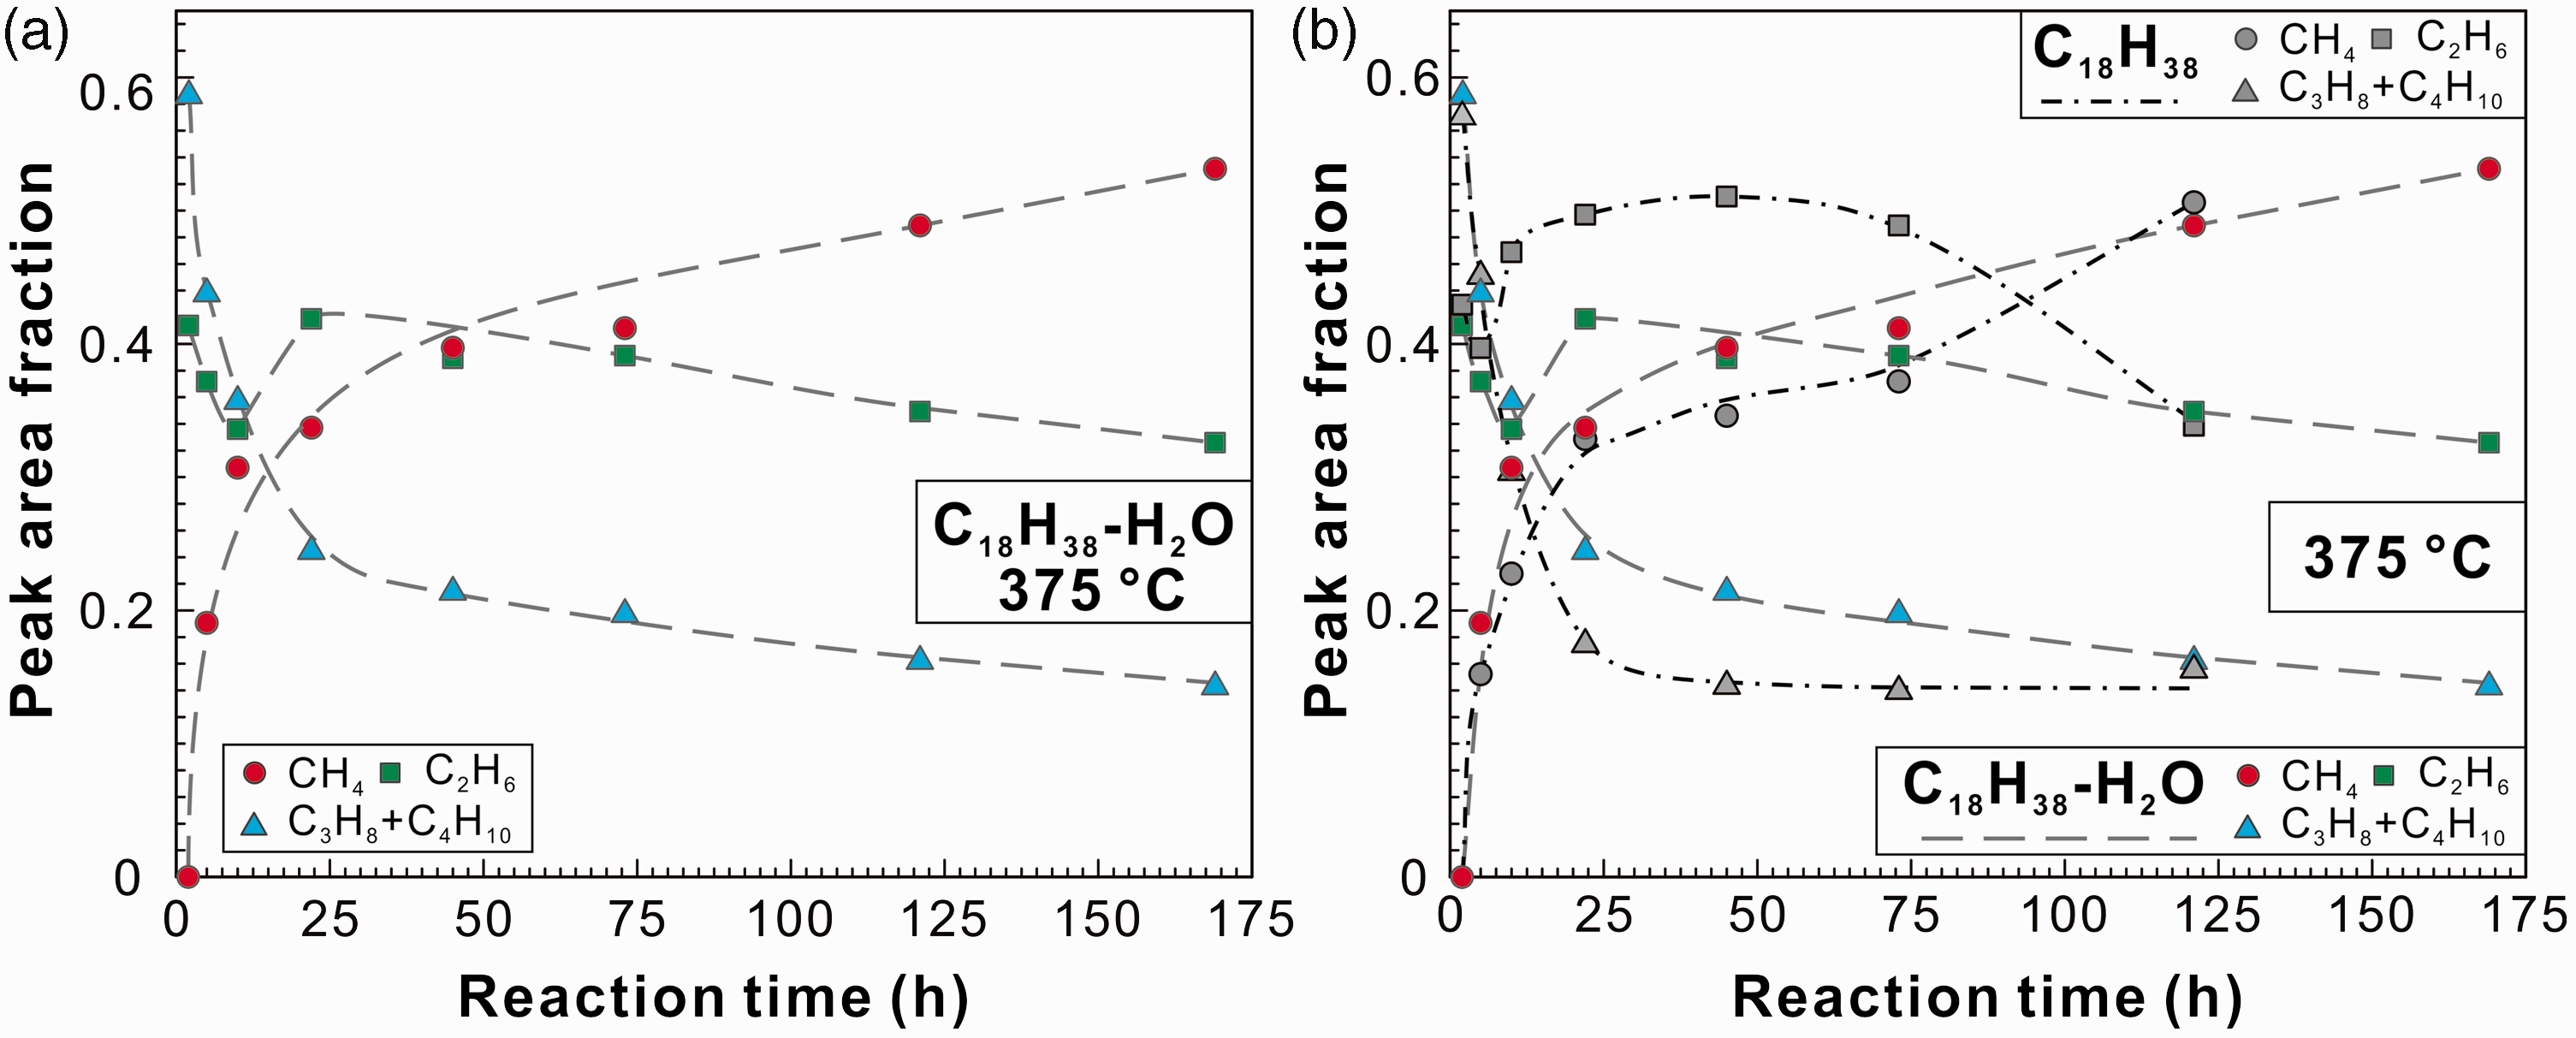
Oxidation of hydrocarbon in the presence of water
Water is also an exogenous source of oxygen during the evolution of kerogen and petroleum. For example, Seewald et al. (1998) carried out hydrous pyrolysis experiments to constrain factors that regulate the generation and relative abundance of hydrocarbon and nonhydrocarbon gases during thermal maturation of shale. CO2 was found to be the most abundant volatile organic alteration product. In high thermal maturation stage, water represented the major source of oxygen in CO2 (Seewald et al., 1998). Subsequent hydrothermal experiments showed that CO2 was the ultimate product during the oxidation of low molecular weight hydrocarbons, in the presence of iron-bearing minerals (Seewald, 2001). However, in the n-pentane–water and n-octadecane–water systems, neither CO2 in the vapor phase nor oxidation products other than alcohol in the aqueous phase were observed in this study (Figures 2 and 3), even the samples were heated to 350℃ for 1094 h or to 375℃ for 169 h. This result suggested that, without the iron-bearing mineral buffers, the hydrolysis of hydrocarbon in water at elevated temperatures and pressures was relatively limited, producing alcohols without further oxidation to ketones, organic acids, and CO2 (Xu and Chou, 2017). It should be noted that the decarboxylation of organic acids can occur in aqueous solutions at elevated temperatures, regardless of the presence of iron-bearing minerals. For example, Ong et al. (2013) described the decarboxylation of acetic and formic acids in FSCCs at 250℃. In the FSCC containing acetic acid solution, the decarboxylation products were CH4 and CO2, whereas the complete decarboxylation of formic acid yielded CO2, CO, and H2 (Ong et al., 2013). Besides, Seewald (2001) suggested that aqueous alkenes and their corresponding aqueous alkanes react reversibly. On the contrast, alkenes were not identified in this study (Figures 2 and 5), indicating that alkanes could react with water to form alcohol without the formation of alkene as intermediate (Chou et al., 2008). Alternative explanation is that the detection limit of Raman spectrometer is too low to detect such intermediate products (Xu and Chou, 2017).
Hydrogen was not observed in the hydrolysis of n-pentane and n-octadecane (Figures 2 and 3). To balance the equation of the alkane–water interaction to form alcohol, hydrogen was supposed to be an essential product. The absence of hydrogen again indicated its loss due to the high diffusion rate of hydrogen in fused silica (Chou et al., 2008; Shang et al., 2009).
Geological implications
Natural gas reservoir is usually characterized by high methane concentration (e.g. >85%; Guo et al., 2008). However, the fraction of methane in gaseous pyrolysis products was often lower than 60% (e.g. Evans and Felbeck, 1983; Horsfield et al., 1992; Snowdon, 2001). This study also indicated that the pyrolysis of n-octadecane produced a considerable amount of wet gas (i.e. ethane, propane, and n-butane). Snowdon (2001) pointed out that gas fractionation during expulsion and secondary migration could result in an enrichment of methane in the reservoir. He also proposed that cracking of propane to methane was fairly slow at reservoir temperatures, thus could not be used to interpret the enrichment of methane in the reservoir (Snowdon, 2001). According to the pyrolysis results from Seewald (2001), the oxidation of hydrocarbon to form carboxylic acid and subsequent decarboxylation could be as alternative explanation for the enrichment of methane. However, the oxidation of hydrocarbon by water to form carboxylic acid and/or CO2 appeared to be effective only in the presence of certain mineral buffers (e.g. iron-bearing minerals; Seewald, 2001). In addition, the oxidation of wet gas by iron/manganese oxides and sulfate could also contribute to the enrichment of methane in the reservoir (Guo et al., 2008; Hao et al., 2008; Pan et al., 2006).
Deep reservoirs are potential petroleum exploration targets. An issue of common concern during deep petroleum exploration is the stability and phase of petroleum under deep burial conditions. Our results showed that the hydrolysis of petroleum could produce alcohols, and further oxidation of petroleum could be limited in the absence of certain mineral buffers. Therefore, we support the conclusion by Xu and Chou (2017) that hydrocarbons, especially low molecular weight gases, may be more stable in iron-poor reservoirs like quartz arenites or carbonate grainstones than in mudstones or arkoses that are rich in redox-reactive iron-bearing siliciclastic and diagenetic minerals.
Another question is the diffusion of hydrogen during the thermal maturation of petroleum. During calculating the volume and pressure changes in the thermal cracking of oil to gas in reservoirs, the amount of available hydrogen was an important parameter controlling the amount of produced methane (Barker, 1990). In addition to the incorporation of hydrogen into nonhydrocarbon components (e.g. S; Barker, 1990), we propose that the diffusion of hydrogen could be another potential mechanism leading to a decrease in the conversion rate of oil to gas.
Conclusions
A series of hydrous and anhydrous isothermal experiments on n-pentane and n-octadecane were conducted at 300–375℃ for durations up to 1094 h, using FSCCs as micro-reactors. The FSCCs are transparent in the visible spectral region, which makes it suitable for optical and Raman spectroscopic observations. The liquid products were not analyzed due to the presence of fluorescence. Therefore, only the aqueous and vapor products were characterized using Raman spectroscopy. The major contributions were summarized as follows:
In the gaseous products of the cracking of n-octadecane at 350 and 375℃, the fractions of methane and propane + n-butane increased and decreased with time, respectively. The fraction of ethane generally decreased with experimental duration with fluctuations at the early cracking stage; the temporary increased fraction of ethane over time might be ascribed to the relatively lower conversion rate of ethane to methane, compared with that of propane + n-butane to ethane. Results support the petroleum-cracking pathway of Hill et al. (2003) that C2+ cracks to form methane. The presence of water did not show significant influence on the cracking process of n-octadecane. The ultimate fractions of methane, ethane, and propane + n-butane in the gaseous products approached those in anhydrous pyrolysis experiment. In addition, hydrogen and alkene were not observed in the gaseous and aqueous products. Hydrous pyrolysis experiments showed that hydrocarbon could be oxidized to alcohol. Unlike the results of Seewald (2001), we found that the oxidation of hydrocarbon was relatively limited in the absence of iron-bearing mineral buffers. Therefore, hydrocarbons might be more stable in reservoirs depleted in iron (e.g. carbonate rocks and quartz arenites) than those enriched in iron (e.g. mudstones and arkoses) under deep burial conditions. Unlike natural gas accumulations, the pyrolysis gas yields were rich in wet gas. In addition to gas fractionation during expulsion and secondary migration (Snowdon, 2001), the enrichment of methane might be ascribed to oxidation of wet gas by sulfate, iron/manganese oxides, and water in the presence of iron-bearing mineral buffers. The diffusion of hydrogen should be considered during calculating the volume and pressure changes in the thermal cracking of oil to gas in reservoirs, because the loss of hydrogen would result in a decrease in the conversion rate of oil to gas.
Footnotes
Acknowledgements
We thank three anonymous reviewers for their careful review and constructive comments and suggestions, which significantly improved the readability and scientificity of the manuscript. We acknowledge the support of the Mineral Program of U.S. Geological Survey.
Declaration of conflicting interests
The author(s) declared no potential conflicts of interest with respect to the research, authorship, and/or publication of this article.
Funding
The author(s) disclosed receipt of the following financial support for the research, authorship, and/or publication of this article: This work was financially supported by the National Natural Science Foundation of China (Grant no. 41230312 and 41573054), the Knowledge Innovation Program (SIDSSE-201302), the Hadal-trench Research Program (XDB06060100), and Key Frontier Science Program (QYZDY-SSW-DQC008) of Chinese Academy of Sciences.