
Abstract
This study revisits coal consumption, CO2 emissions and economic growth nexus for both China and India using a newly developed Bootstrap ARDL model over the period of 1969–2015. Empirical results indicate no long-run relationship among these three variables for both China and India, and Granger causality test based on Bootstrap ARDL model indicates a feedback between coal consumption and economic growth, between economic growth and CO2 emissions and between coal consumption and CO2 emissions in China. However, we find a one-way Granger causality running from coal consumption to economic growth and the feedback hypothesis is confirmed between economic growth and CO2 emissions and between coal consumption and CO2 emissions in India. The coefficients signal that coal consumption is an important factor towards the promotion economic growth in both China and India. For China, higher economic growth reduces CO2 emissions, while for India, it further increases CO2 emissions. Our empirical results have important policy implications for the government conducting effective energy polices to promote economic growth in both China and India.
Introduction
Both China and India are not only the two largest coal consumption countries but also two of the largest CO2 emission countries in the world. For the past decade, China and India experience a steady increase in their energy use, especially coal and oil, such that in aggregate, it is expected that they will consume 45% of the world’s coal in 2030 (Jayanthakumaran et al., 2012). China has per capita CO2 emissions of 26.31 tonnes and India has per capita CO2 emissions or 22.39 tonnes during the period of 1969–2015 (BP, 2014).
Both China and India are confronted with double challenges – addressing climate change in the international society and environmental protection with domestic economic transition in combination with increasingly high needs for energy – that based on their current supply mixes come from coal consumption that is considered amongst the main reasons of pollution.
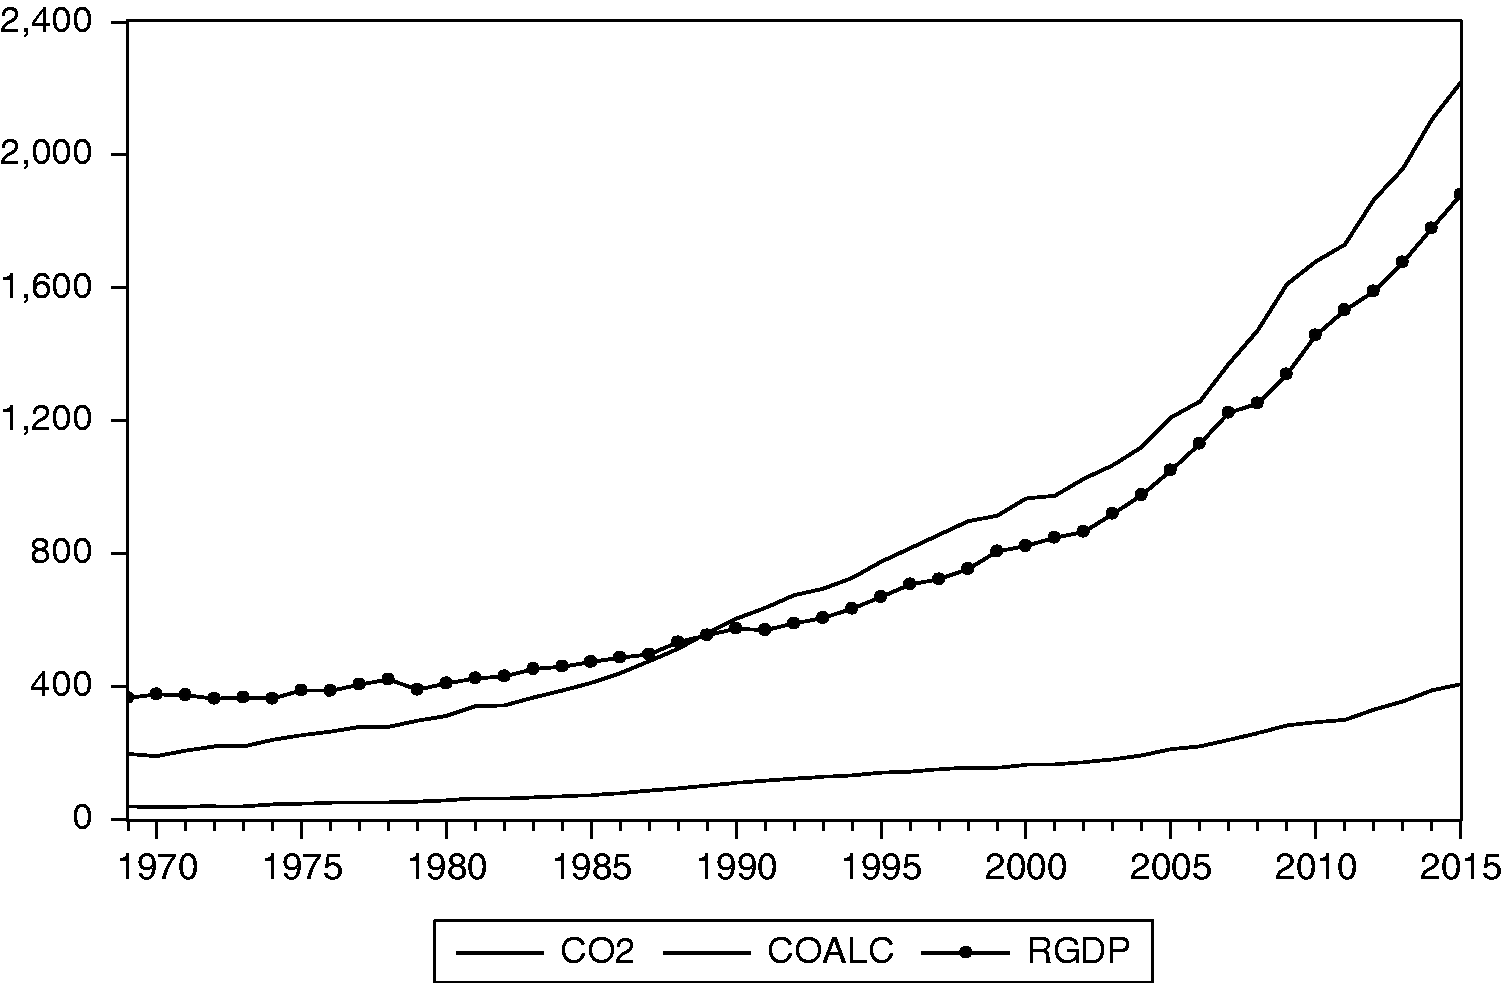
From Figures 1 and 2, it could be seen that coal consumption and CO2 emissions are increasing steadily in both China and India. This means air pollution is an important issue for both countries. The IEA Medium-Term Coal Market Report (IEA, 2011) noted that this boost in coal demand corresponds to rising coal usage, which amounted to approximately 720,000 tonnes every day since 2011.
1
As of March 2012, approximately 40% of the world’s electricity needs were provided by coal. Growth in coal demand varies from country to country: while coal consumption has stagnated among OECD countries since the beginning of the 21 first century, the surge in global coal consumption is driven primarily by developing economies, such as China and India. Economic growth is likely to be robust in both China and India over the next several years. If these trends continue, by 2020, China will become the largest and India the third-largest economy in the world. This rapid economic growth is likely to be associated with increased energy use and increased air pollution. Because coal is the key fuel in both countries’ energy mix and since economic growth and energy use are highly correlated, coal demand prospects for both countries are expected to bullish in 2017. Thus, knowledge of the causal relationship and the direction between energy consumption, CO2 emissions and economic growth are of particular importance to policy makers from China and India to make an appropriate energy strategy.
Plots of real GDP, coal consumption and CO2 emissions in China. Plots of Real GDP, coal consumption and CO2 emissions in India.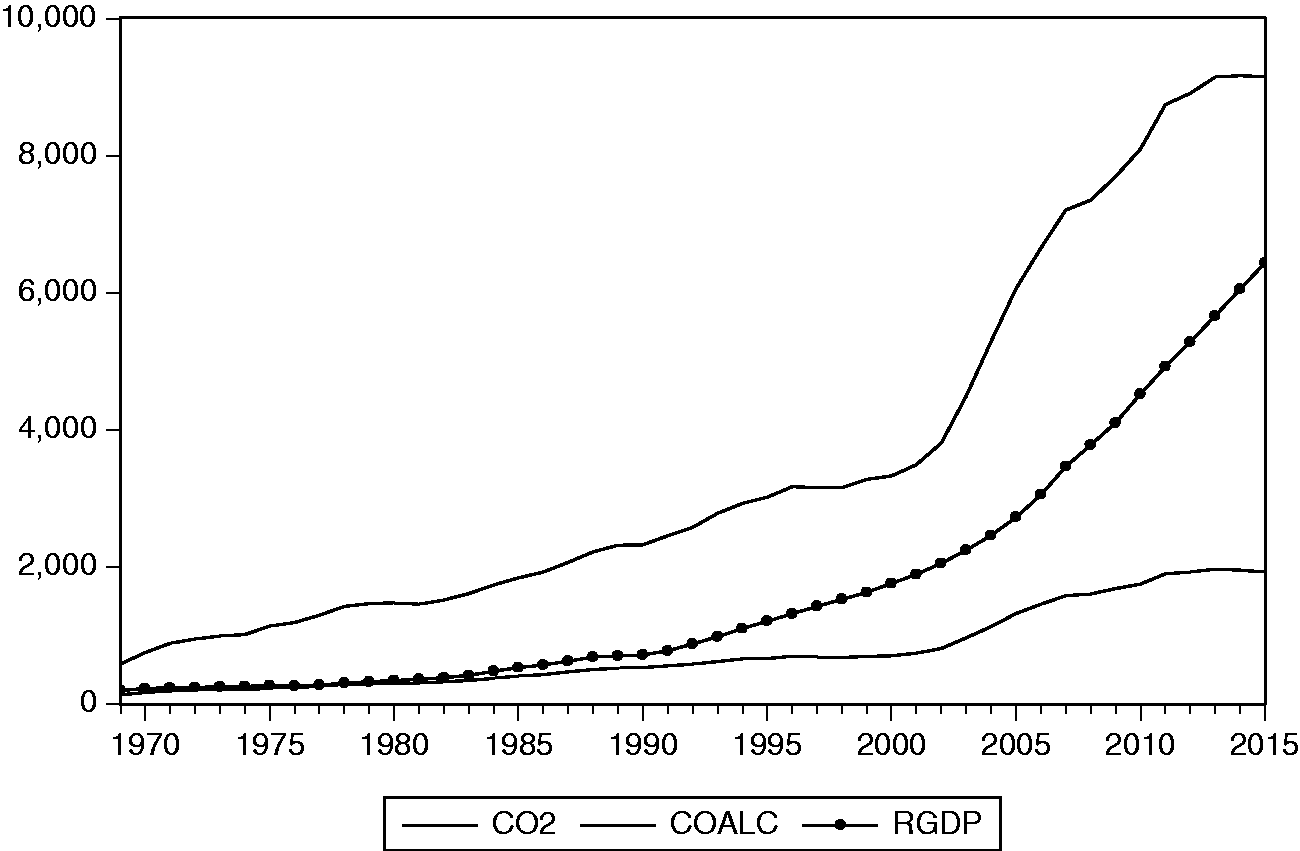
To evaluate the trivariate relationship between coal consumption CO2 emissions and economic growth in these two countries (China and India), this paper is going to use a specific ARDL econometric methodology. Since Pesaran et al. (2001) developed their ARDL bound test, this test has gone through several types of transformation. For example, single ARDL test of Li and Lee (2011) Nonlinear ARDL test of Shin et al. (2014) and System ARDL test of Li (2017). Recently, McNown et al., (2016) have further modified this test through bootstrap techniques and this newly developed bootstrap ARDL bound test has several advantages over conventional ARDL bound test of Pesaran et al. (2001).
The first advantage of Bootstrap ARDL bound test is that there is evidence that the endogeneity problem has only minor effects on the size and power properties of the ARDL bounds testing framework using the asymptotic critical values from the Monte Carlo simulations. In addition, if the resampling procedure is applied appropriately, the bootstrap test performs better than the asymptotic test in the ARDL bounds test based on size and power properties. Second, the bootstrap procedure has the additional advantage of eliminating the possibility of inconclusive inferences. Finally, but of significance, they present an extension of the ARDL testing framework for the alternative degenerate case, with critical values generated by the bootstrap procedure. Therefore, their proposed bootstrap ARDL test provides a better insight on the cointegration status of the series in the model.
This study revisits the coal consumption, CO2 emissions and economic growth nexus for both China and India using this newly developed Bootstrap ARDL model over the period of 1969–2015. This study is organized as follows. The next section describes the data used in our study. The subsequent section first briefly describes the traditional ARDL models of Pesaran and then describes the proposed new Bootstrap ARDL model of McNown et al. (2016). Then the empirical results and some policy implications of these empirical findings are presented. The last section offers the conclusions of this study.
Brief literature review
Evidently, the international energy literature has shown high interest in the examination of the energy-environment-economy nexus for different countries over different periods. The trivariate relationship was traditionally examined in two parts: the energy-growth and the growth-environmental degradation (air pollution in the form of emissions primarily) (Bekhet et al., 2017).
For the first strand of the literature, Kraft and Kraft (1978) have put the foundations towards the dynamics of the relationship between energy consumption and economic growth and energy consumption. Ozturk and Acaravci (2010) have presented an extended energy-growth survey showing that there is no consensus among the studies. Menegaki (2014) conducted a meta-data analysis of more than 150 papers with global data since 1949; this study showed that the existence and direction of the causality between GDP and energy consumption are highly dependent to the method and data used. Inglesi-Lotz and Pouris (2016) in a review paper for the nexus in South Africa confirmed the same conclusion. They also suggested that the inclusion of other factors in the analysis is also crucial for the results. Kalimeris et al. (2014) also discussed the complexity of the relationship and the impact of scarcity of resources for example might have on it. The literature is attracted by the lack of consensus, and hence a number of studies attempted to provide more robust results (Al-mulali et al., 2013; Apergis and Payne, 2011; Chang et al., 2017, 2016; Dergiades et al., 2013; Eggoh et al., 2011; Ozturk and Acaravci, 2010; Tang, 2008; Wang et al., 2011).
The inclusion of the environmental status quo of a country proxied by its emissions within the nexus examination is related to the Environmental Kuznets Curve (EKC) hypothesis. Firstly proposed by Grossman and Krueger (1991) and extensively discussed in Stern (2004) and Dinda (2004), the hypothesis postulates that the relationship between economic development (growth) has an inverted-U relationship with the environmental pollution levels of the country. Acaravci and Ozturk (2010) found that there is a bidirectional relationship from energy consumption to CO2 emissions for a group of 19 European countries. A strong relationship between CO2 emissions and economic growth was found in Saboori et al. (2014) for the OECD countries. Menyah and Wolde-Rufael (2010a, 2010b) examined the relationship between CO2 emissions, renewable and nuclear energy consumption, and real GDP for US finding that there is a unidirectional causality from nuclear to emissions but no causality from renewable consumption to emissions. A number of other studies have also tried to evaluate that relationship (Alam et al., 2012; Iwata et al., 2010; Pao and Tsai, 2011; Shahbaz and Lean, 2012; Shahbaz et al., 2012).
Methodology
ARDL bound test (Pesaran et al. 2001)
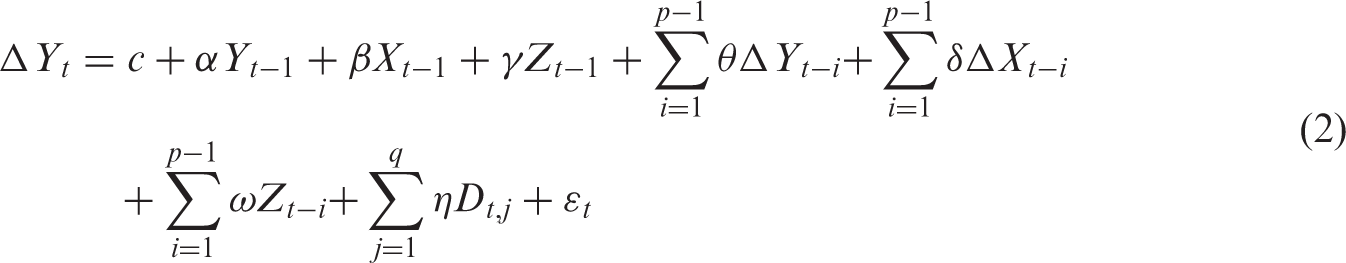
Following Pesaran et al. (2001), we can write our ARDL bound model as the follows

And equation (1) requires no feedback from Y to X. This means that we cannot allow two or more variables to be (weakly) endogenous and this violates the assumptions underlying the distributions of the test statistics presented by Pesaran et al. (2001). It assumes weak exogeneity of the regressors. These regressors are not impacted by the dependent variable in the long run, but this does not preclude the existence of cointegration among the regressions, nor does it assume the absence of (short run) Granger causality from the dependent variable to the regression. Many researchers ignore this assumption in the empirical implications of the ARDL bounds test.
Following Pesaran et al. (2001), the cointegration test requires F-test or t-test for the following hypothesis:
Bootstrap ARDL bound test (McNown et al. 2016)
McNown et al. (2016) suggest adding an additional t-test
Pesaran et al. (2001) present critical values for case #2, but not for case #1. To rule out degenerate case #1, the integration order for the dependent variable must be I (1). However, unit root tests are notorious for having low power (Perron, 1989). The Bootstrap ARDL test tackles this problem through additional test on the coefficients of the lagged independent variables. The advantage of Bootstrap ARDL bound test is that there is evidence that the endogeneity problem has only minor effects on the size and power properties of the ARDL bounds testing framework using the asymptotic critical values from the Monte Carlo simulations. In addition, if the resampling procedure is applied appropriately, the Bootstrap test performs better than the asymptotic test in the ARDL bounds test based on size and power properties. Furthermore, the Bootstrap procedure has the additional advantage of eliminating the possibility of inconclusive inferences. Finally, McNown et al. (2016) also present an extension of the ARDL testing framework for the alternative degenerate case, with critical values generated by the Bootstrap procedure. Therefore, the proposed Bootstrap ARDL test provides a better insight on the cointegration status of the series in the model.
Granger causality test based on bootstrap ARDL model
The direction of the short-run causal relationship will be determined by standard Granger-causality tests. If no cointegration is found between y and x when y is the dependent variable, then the Granger causality test for x ≥y should include the lagged differences on x only, that is, we test whether
In this case, the Granger-causality test for x ≥ y should include the lagged differences on x and the lagged level of x, i.e. test whether
The Bootstrap ARDL approach to cointegration testing has several interesting characteristics. First, it performs better to small samples compared to alternative multivariate cointegration procedures (Romilly et al., 2001). Second, it does not require the restrictive assumption that all series are integrated of the same order allowing for the inclusion of both
Data
We apply annual data covering the period from 1969 to 2015 for both China and India. The variables used in this study include the real gross domestic product (GDP), Coal consumption (Coalc) and CO2 emissions (CO2). Coal consumption and CO2 emissions are expressed in terms of millions of tonnes for both China and India and are sourced from the BP Statistic Review of World Energy (June, 2016). Real GDP for both China and India is from the World Development Indicators (WDI; The World Bank, 2016).
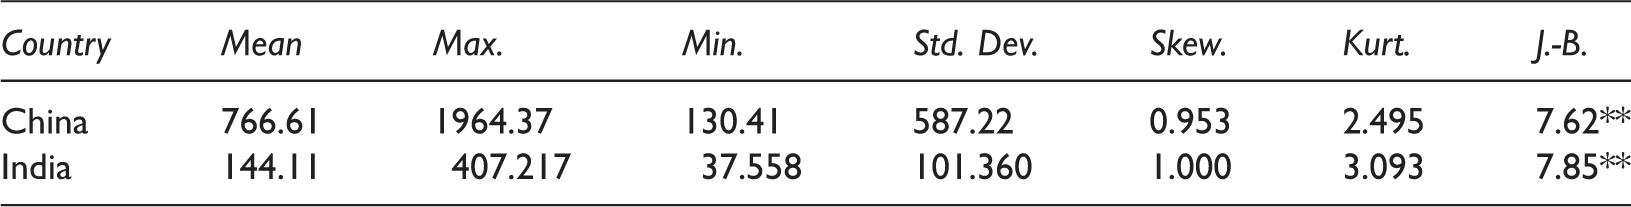
Summary statistics of GDP growth.
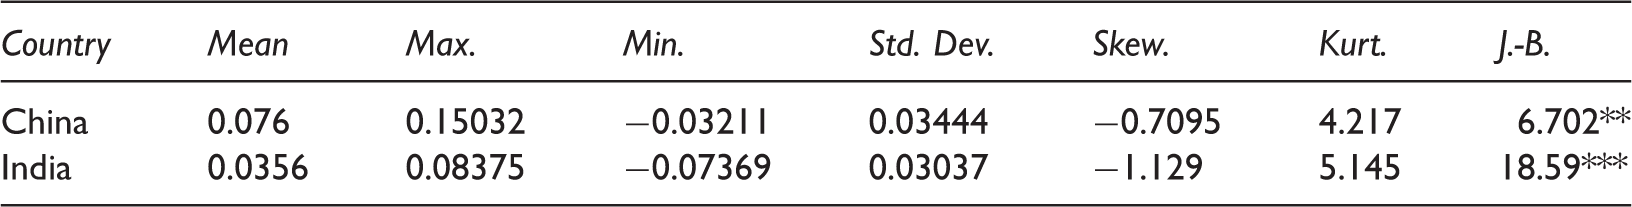
Note: The sample period is from 1969 to 2015.
GDP: gross domestic product. **(***) denote 5% (1%) level of significance.
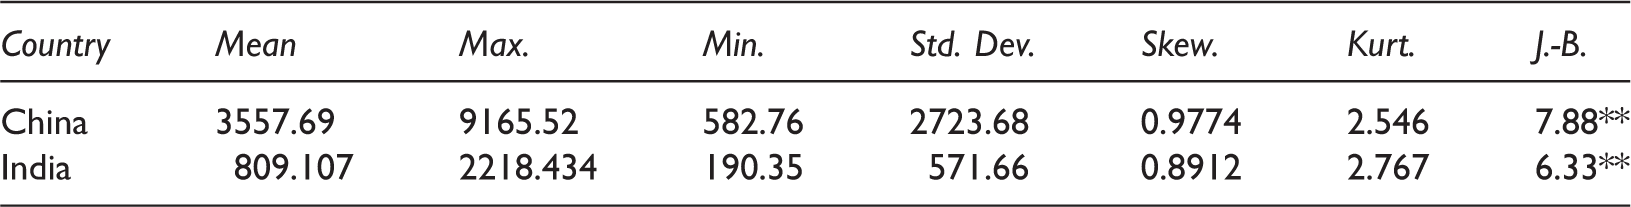
Summary statistics of coal consumption (million).
Note: The sample period is from 1969 to 2015. ** denote 5% level of significance.
Summary statistics of CO2 emissions (million).
Note: The sample period is from 1969 to 2015. ** denote 5% level of significance.
Empirical results and policy implications
Results from the unit root test
Univariate unit root tests.
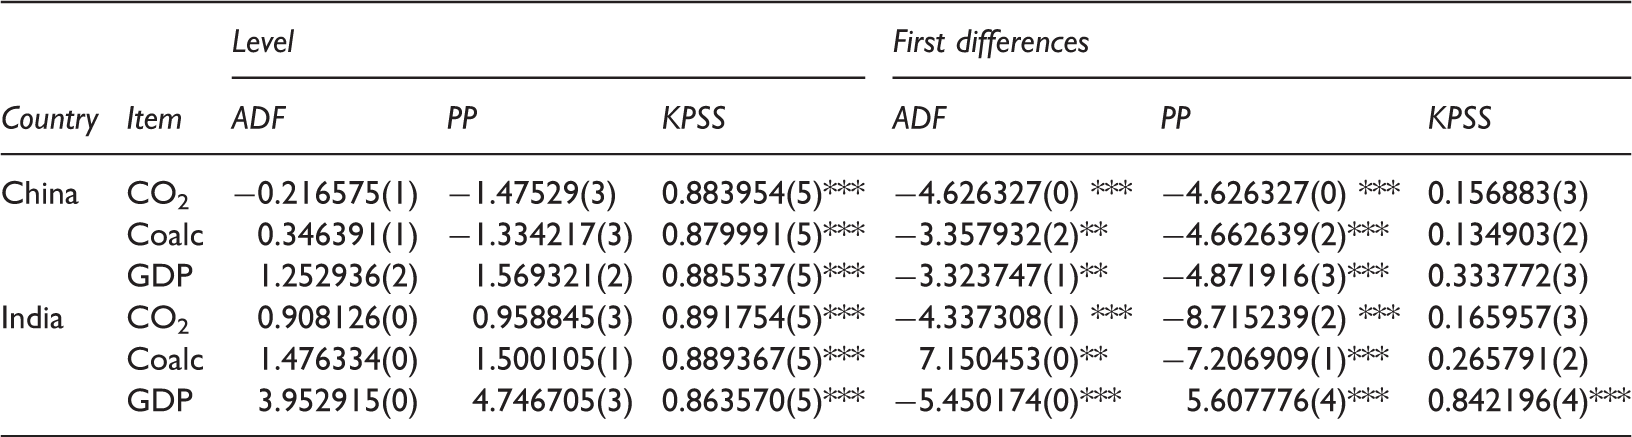
Notes: ***, ** and * indicate the null hypothesis is rejected at the 1%, 5% and 10% levels, respectively. The number in brackets indicates the lag order selected based on Schwarz information criterion. The number in the parenthesis indicates the truncation for the Bartlett Kernel, as suggested by the Newey-West test (1987).
Results from bootstrap ARDL bound test – Cointegration test
Cointegration results using bootstrap ARDL bound test – China.
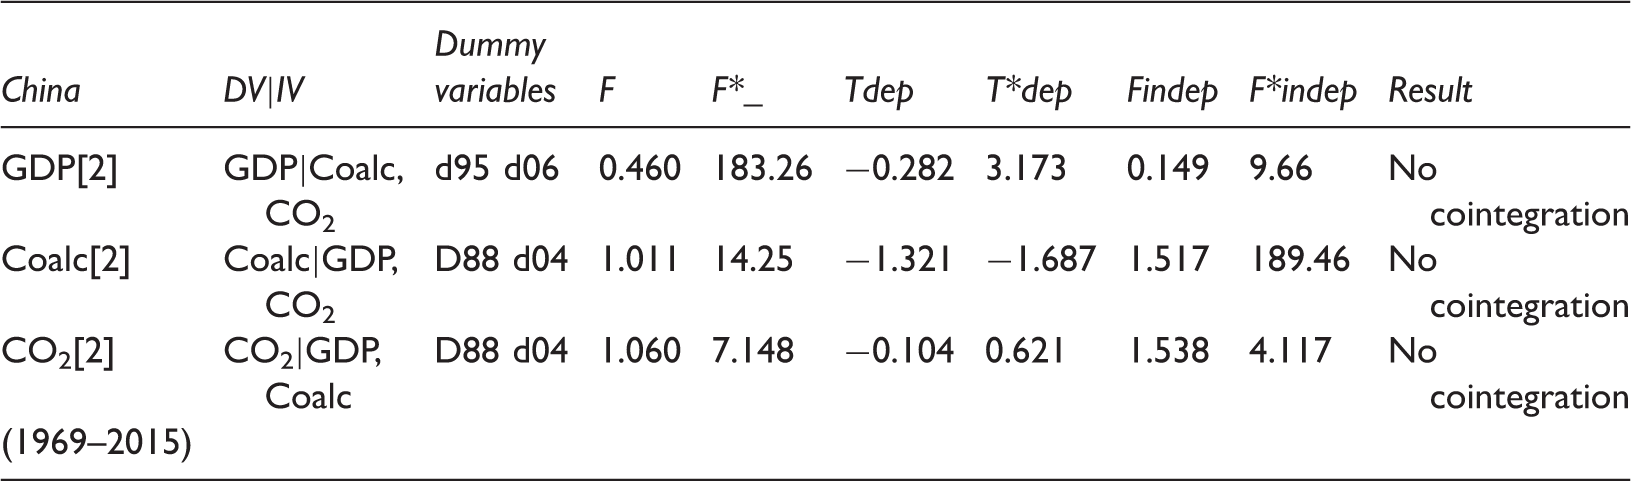
Notes: [.] is optimal lag order based on Akaike Information Criterion (AIC). F is the F-statistic for the coefficients of yt−1, x t−1 and zt−1; Tdep denotes the t-statistics for the dependent variable, Tindep denotes the t-statistics for the independent variable. F*, T_dep and T_indep are the critical values at 5% significance level, generated from the bootstrap program. Dummy variables are to capture any economics shocks. D41 means 1 for year 1941, other years are 0.
Cointegration results using bootstrap ARDL bound test – India.
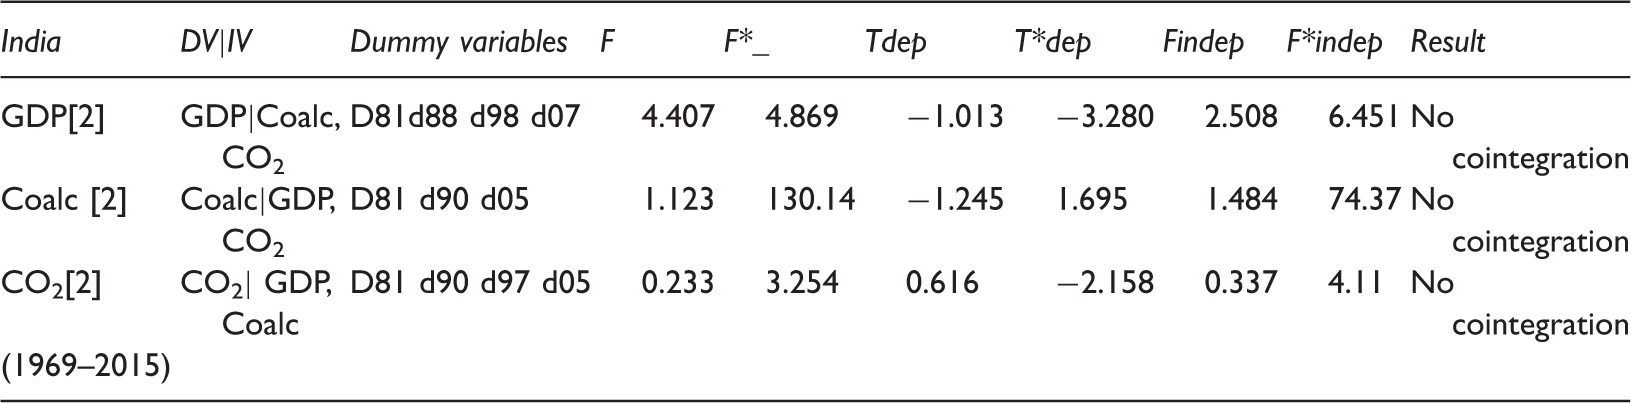
Notes: [.] is optimal lag order based on Akaike Information Criterion (AIC). F is the F-statistic for the coefficients of yt−1, x t−1 and zt−1; Tdep denotes the t-statistics for the dependent variable, Tindep denotes the t-statistics for the independent variable. F*, T_dep and T_indep are the critical values at 5% significance level, generated from the bootstrap program. Dummy variables are to capture any economics shocks. D41 means 1 for year 1941, other years are 0.
Granger causality test results based on bootstrap ARDL model and policy implications
ARDL granger-causality analysis – China.
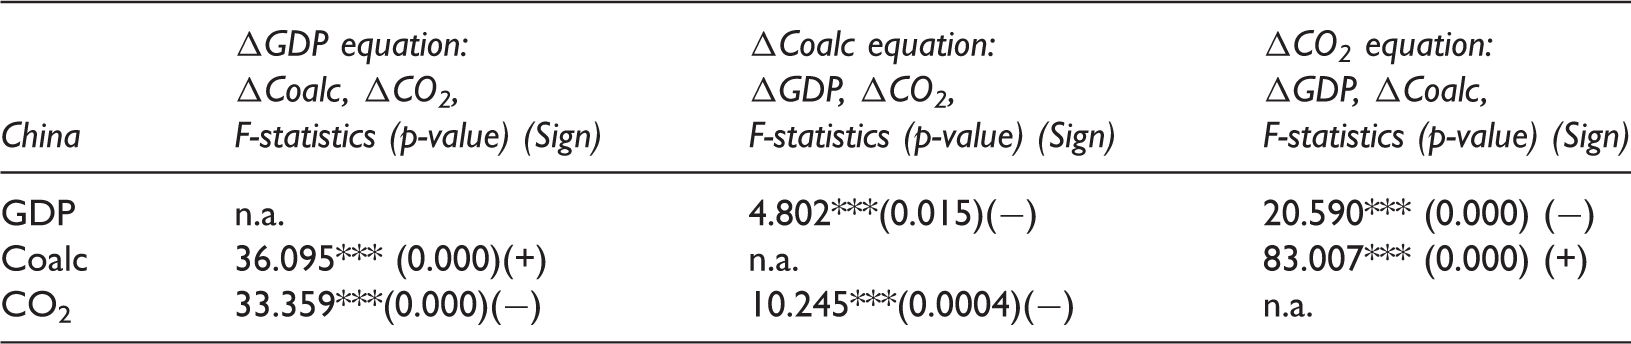
Note: Value in [.] is lag order, and (.) are p-value and sign for the coefficients. Bold values in the first row refer to the specific construction of the long-run equation tested for cointegration and the causality test involved its lagged level and differenced variables (for example, ΔGDP equation means that the differenced GDP is the dependent). Those values not in bold refer to the case of no-cointegration and its causality test involved only lagged differenced variables. ***, ** and * denote significant at 1%, 5% and 10% levels, respectively.
On the other hand, CO2 emissions harm economic growth and economic growth further reduces CO2 emissions in China because we find the signs are neither positive nor significant in either direction. Coal consumption increases along with the increase of CO2 emissions; however, CO2 emissions increase along with the decrease of coal consumption in China.
These empirical findings indicate that when economic growth increases (and people live in better conditions and healther environment), people will need clear air and government in China sets up clean-air policy to reduce CO2 emissions and at the meantime when CO2 emissions increase then coal consumption decreases. That leads the Chinese policy makers to look for appropriate policies for energy substitution.
Our study supports energy-led growth in China. However, this policy might create air pollution in China. It seems that the government in China did well in combating air pollution because we find that when coal consumption increases, the government also tries to reduce CO2 emissions and when CO2 emissions increase, to control for this continue climbing CO2 emissions, the government reduces coal consumption. However, this might further harm economic growth in China. The major policy implication of our study is that government in China should set up an effective-energy strategy for not only promoting economic growth but also controlling the CO2 emissions.
ARDL granger-causality analysis – India.
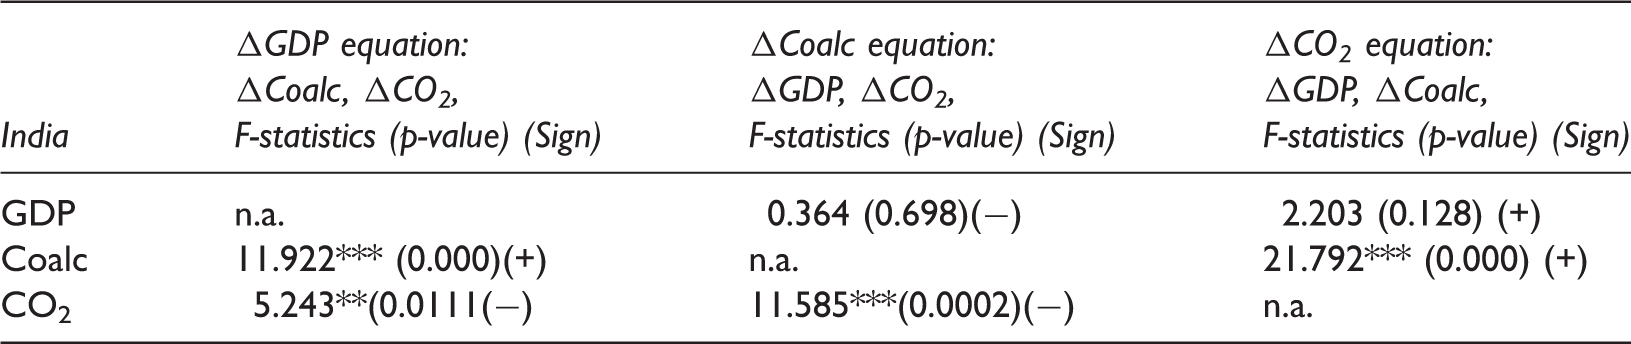
Notes: Value in [.] is lag order, and (.) are p-value and sign for the coefficients. Bold values refer to the case of cointegration and the causality test involved its lagged level and differenced variables. Those values not in bold refer to the case of no-cointegration and its causality test involved only lagged differenced variables. ***, ** and * denote significant at 1%, 5% and 10% levels, respectively.
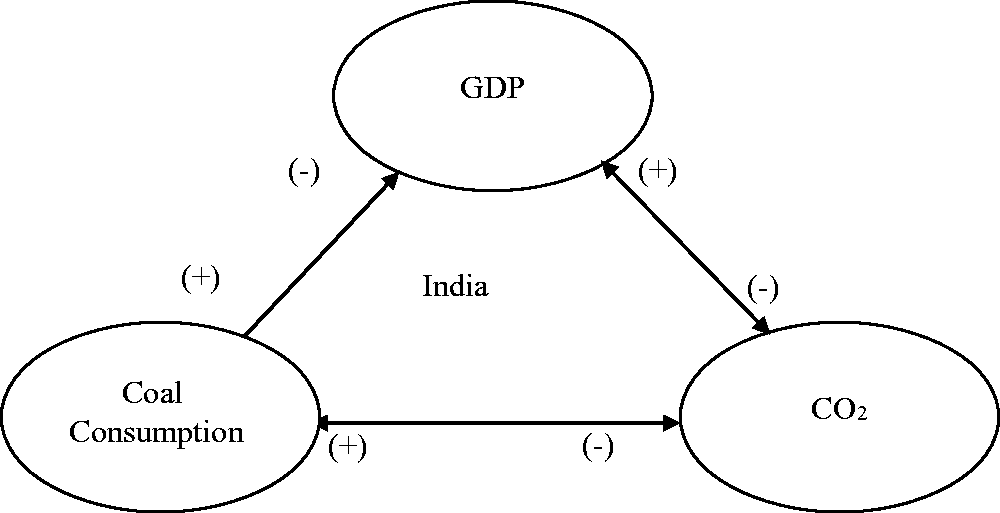
Figures 3 and 4 demonstrate the causal relationship among these three variables (i.e. economic growth (GDP), CO2 emissions and coal consumption) for China and India, respectively, and these two figures further confirm our empirical findings, which support the energy-led growth hypothesis for India and economic growth and coal consumption reinforce each other in China supporting feedback hypothesis.
Causal link among GDP, CO2 emissions and coal consumption in China. Causal link among GDP, CO2 emissions and coal consumption in India.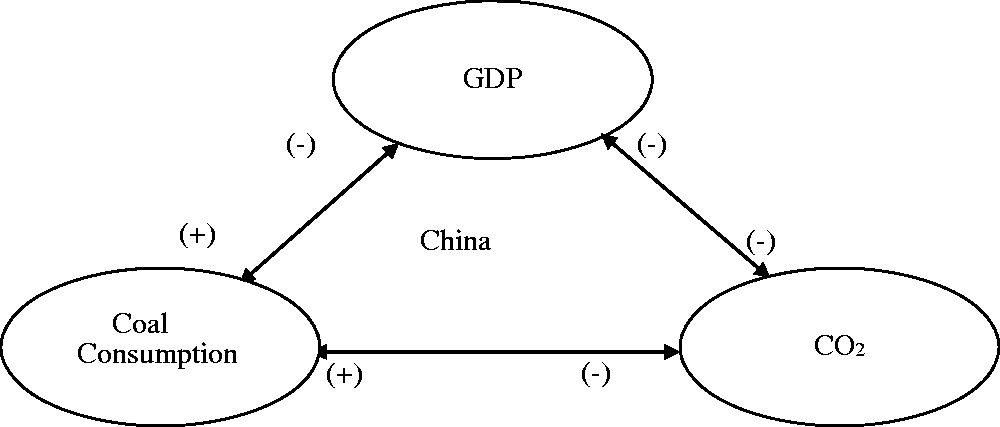
This result is consistent with those of Wang et al. (2011) and Bloch et al. (2012) revealing that there is bi-directional causality between coal consumption and pollutant emission both in the short and long run for both China and India and unidirectional causality from coal consumption to economic growth in India. Hence, it is very difficult for both China and India to pursue a greenhouse gas abatement policy through reducing coal consumption. Switching to greener energy sources might be a possible alternative in the long run. The results indicate that CO2 emissions in both China and India will not decrease in a long period of time and reducing CO2 emissions may handicap both China’s and India’s economic growth to some degree.
However, our results are not consistent with those of Li et al. (2011), Li and Lee (2011) and Li and Leung (2012), and Rafiq et al. (2014) found that a unidirectional causality running from economic growth to coal consumption existed in China, while a unidirectional causality from coal consumption to GDP did exist in India. Results are also not consistent with that of Chang (2010) supporting a unidirectional causality from output to both energy consumption and CO2 emissions and Yalta and Cakar (2012) supporting neutrality hypothesis in 53 out of 60 models estimated in China. Possible differences in the results might arise from the difference in the examined time periods and the inclusion of control variables and methodologies used (Inglesi-Lotz and Pouris, 2016).
Conclusions
We revisit the relationship between coal consumption, CO2 emissions and economic growth for both China and India using a newly developed Bootstrap ARDL model over the period of 1969–2015. Results indicate no long-run relationship among these three variables for both China and India and results from Granger causality test based on Bootstrap ARDL model indicate a feedback between coal consumption and economic growth, between economic growth and CO2 emissions and between coal consumption and CO2 emissions in China. However, we only find a one-way Granger causality coal consumption to economic growth and a feedback exists between economic growth and CO2 emissions and between coal consumption and CO2 emissions in India. By looking at the sign of coefficients of the independent variable, we find that coal consumption is a very important energy source for promoting economic growth in both China and India. Interesting is that we find economic growth reduce coal consumption in both China and India.
Our empirical results support energy-led growth hypothesis for India and feedback hypothesis for China. On the hand, we also find economic growth reduces CO2 emissions in China; however, economic growth further increases CO2 emissions in India. Regarding coal consumption and CO2 emissions, we find these two variables reinforce each other in both China and India. Coal consumption increases CO2 emissions but increase in CO2 emissions further reduces coal consumption in both China and India.
Thus, knowing the causal relationship and the direction between energy consumption, economic growth and CO2 emissions are of particular importance to policy makers to make an appropriate energy strategy. Our empirical results have important policy implications for the government conducting effective energy policies to promote economic growth and controlling CO2 emissions in both China and India. Therefore, developing cleaner and more efficient technologies is essential to reduce their CO2 emissions to reach sustainable development.
Footnotes
Declaration of conflicting interests
The author(s) declared no potential conflicts of interest with respect to the research, authorship, and/or publication of this article.
Funding
The author(s) received no financial support for the research, authorship, and/or publication of this article.