
Abstract
In this study, a joint evaluation of the wind and wave energy over the Black Sea basin is performed for a 20-year time interval. The importance of such a study is enhanced by the fact that the potential of the wave energy cannot be considered high compared to the large oceans, while the wind conditions over the Black Sea can be considered significant in various areas. The wind fields from the U.S. National Centers for Environmental Prediction were used for wind energy estimation. A high resolution wave hindcast database, as resulted from the simulations performed with the Simulating WAves Nearshore model, is used for a detailed analysis of the wave energy potential in the basin of the Black Sea. The reliability of the wave simulation results was increased by means of some data assimilation methodologies. The variability and complementarity of these renewable energy resources was investigated. The analysis showed that there exist some suitable areas for combined wind-wave exploitation.
Introduction
The attention paid to the exploitation of the renewable energy resources has increased significantly in the past years. The clean energy production is regarded as one of the technological solutions to fight the climate changes and for this reason it represents a priority for the environmental and political communities from many states. As regards the European Union (EU), the production of energy from renewable sources has grown significantly in the recent years, especially due to the legally binding targets and to the continuous efforts of the member states to support this kind of energy production.
The marine environment has a great potential for the development of the renewable energy projects. The ocean resources represented by the tidal currents and the ocean surface waves are clean energy resources with great potential over extended areas (Besio et al., 2016; Cornett, 2008; Hammar et al., 2012; Lopez et al., 2015; Rusu, 2014; Rusu and Onea, 2015). Moreover, harvesting the wind energy is also possible in these areas. An advantage for the development of the offshore wind against the wind projects developed on the land can be brought by the greater power of the resource, which is also steadier than onshore. However, the installation and maintenance costs of the offshore wind farms are higher (Thomsen, 2014). A possibility to counteract this weakness and to compensate the high costs can be to promote the use of a combined exploitation of the wind and wave resources using either hybrid devices or co-located wind-wave farms (Astariz et al., 2015b; Perez-Collazo et al., 2015). Since the hybrid wind-wave projects are at this moment in an early stage, probably the first step to be considered at this point would be to collocate wave energy converters in some places where wind farms are already operating. In this way the existing infrastructure can be used and moreover the wave converters can provide a sheltering effect to the wind farm (Onea and Rusu, 2016). On the other hand, Zanuttigh et al. (2016), Cradden et al. (2016) and Maisondieu and Healy (2015) are some relevant studies related to hybrid marine energy projects.
Evaluations of the wind and wave energy potential have been done in various locations of the world (Rusu and Onea, 2017), but only few studies analysed the complementarity of the two resources for combined exploitation. Recent studies related to the joint exploitation of the waves and the offshore wind energy show that this is a promising option in many areas of Europe (Emmanouil et al., 2016; Gallagher et al., 2016; Kalogeri et al., 2017; Veigas et al., 2014) or elsewhere in the world (Stoutenburg et al., 2010). In line with this, some works evaluated the combination of these resources and how they correlate and complement each other to enhance the economic competitiveness. Besides the benefit to increase the energy yield of an exploited area, the joint exploitation of waves and offshore wind can reduce the variability of renewable power (Fusco et al., 2010; Widén et al., 2015) and so the integration into the power system is less expensive (Lund, 2007, Prässler and Schaechtele, 2012). A key factor to decrease the variability of the produced power, and also the downtime period, is to find areas with low correlation between the two resources (Astariz and Iglesias, 2016). Another important aspect is related to the possibility to use the wave farms as a solution to improve the wind farm accessibility for maintenance activities (Astariz et al., 2015a) or to thwart the erosion processes that affect many coastal areas (Abanades et al., 2014; Mendoza et al., 2014; Zanopol et al., 2014a, 2014b) due to the reduction of the significant wave height in the lee of the wave farm.
Within the general context related to the assessment of the renewable resources and to their efficient exploitation, the present study is focused to evaluate the potential of wind and wave energy along the Black Sea basin and to estimate the more promising areas for joint exploitation of these two resources. Compared to the large oceans, the wave energy potential is lower due to the limited fetch of the basin, and also more variable conditions are encountered (Rusu, 2015). On the other hand, contrary to the wave energy conditions, the wind power over the Black Sea basin can be considered significant in several zones, where the wind power is comparable to the most energetic locations of the northwestern Europe (Onea and Rusu, 2014). The areas suitable for combined exploitation of the two renewable resources must accomplish some demands as: elevated mean values, stable behaviour as well as a low correlation of the two resources. These characteristics of the renewable resources are analysed in the present study using reanalysis data for the wind conditions and hindcast simulations of the sea states.
Methodology
Data sets
It is well known that the semi-enclosed/enclosed basins are complex environments and to accurately represent the wind and wave features high resolution spatial fields are necessary. For the Black Sea, which is a typical enclosed basin with a complicated orography of the region, the wind fields provided by the U.S. National Centers for Environmental Prediction, Climate Forecast System Reanalysis (NCEP-CFSR) are considered to have enough resolution to reflect the variability of the area (Saha et al., 2010, 2014). The 10 m wind fields (U10) with a spatial resolution of 0.312° × 0.312° and a temporal resolution of 3 hours over a domain that includes the Black Sea basin have been used for describing the wind climate.
Besides the fact that these data are used to assess the wind climate, they also represent the input for the numerical wave model. The numerical model used to simulate the wave conditions is Simulating WAves Nearshore (SWAN, Booij et al., 1999), a state-of-the-art wave model based on the spectrum concept. The SWAN model has been utilized and evaluated for the Black Sea basin in various studies conducted among others by Rusu et al. (2014a), Arkhipkin et al. (2014) and Akpinar et al. (2012). Based on the hindcast simulations carried out with the SWAN model, Rusu et al. (2014b) analysed the storms developed in the Black Sea and the accuracy of the results regarding these extreme events. The wave model settings considered in the present work are those used by Rusu (2015). Furthermore, the accuracy of the wave predictions have been increased by means of data assimilation methodologies based on the optimal interpolation approach. Satellite measurements are used for the implementation of the data assimilation algorithms. Additional details on these data assimilation schemes, as they were applied also in this work, can be found in Rusu (2015) and Rusu and Guedes Soares (2015). The wave fields including the main parameters have high spatial resolution (0.08° in latitude and longitude) and a 3-hour time resolution.
Wind and wave climate
The spatial distributions of the wind speed (U10), wind direction and the mean significant wave height (Hs) have been computed as the average of the total data for the 20-year period considered (1997–2016). The mean direction of the wind speed is computed by averaging its zone and the meridional components separately. The arrows indicate the wind direction, and they are scaled with the wind speed background field. The information necessary to compute the average seasonal values was extracted from the total amount of data following the seasonal partition: winter – DJF (December–January–February), spring – MAM (March–April–May), summer – JJA (June–July–August) and autumn – SON (September–October–November). The left panels of Figure 1 illustrate the results for the wind speeds, where the black line marks the coastal line of the Black Sea basin and the borders between the surrounding countries. The spatial distributions of the mean significant wave height are also presented in Figure 1 (right panels). The position of the maximum values is indicated by circles (red circle for wind and white circle for wave).
The spatial distribution of the mean wind fields (left panels) and the mean significant wave height fields (right panels) for the entire 20-year period 1997–2016 (first line), and for each season: winter (DJF) – second line, spring (MAM) – third line, summer (JJA) – fourth line, autumn (SON) – last line.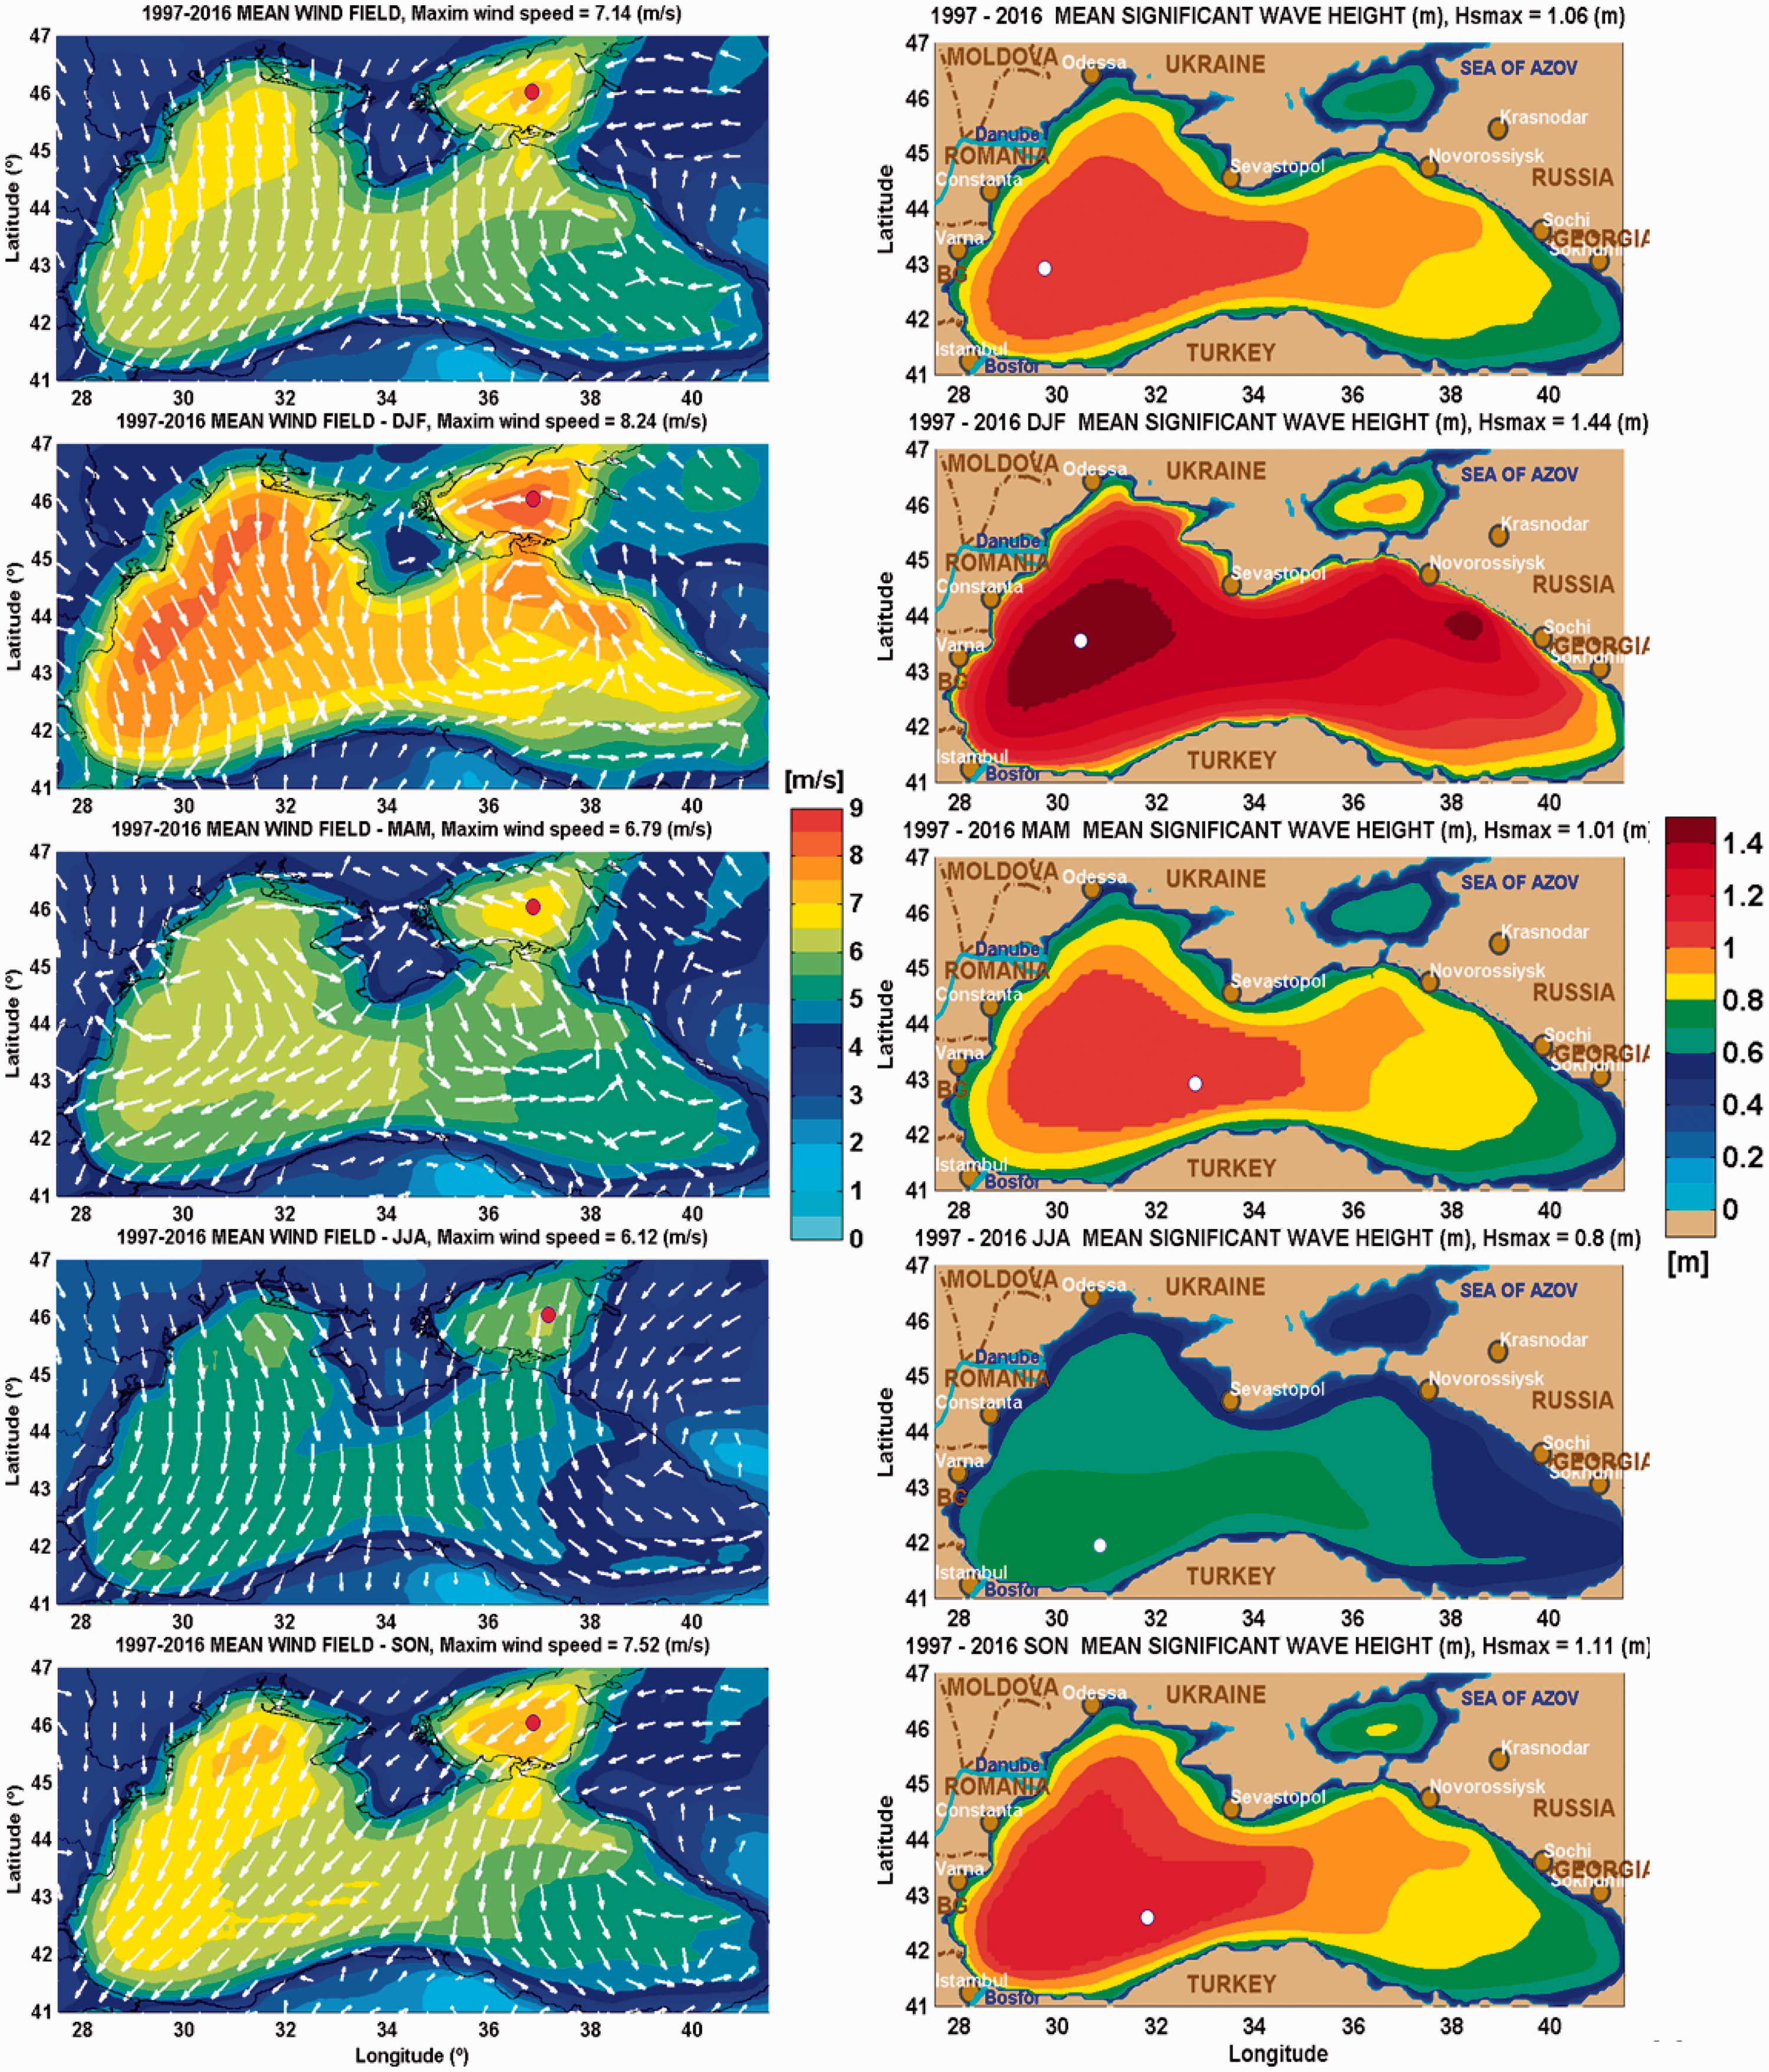
As Figure 1 shows in its left panels, the maximum values of the wind speed are always located over the Sea of Azov, followed by the western part of the Black Sea basin. A pronounced difference between the western and eastern parts of the basin is observed, with larger levels of U10 on the western part, even near the coast. The wind directions have also a well-defined pattern over the western part of the basin (compared to the eastern side), except in the spring when changes of the wind direction can be noticed along the Romanian coasts.
As regards the maximum mean value, for the total period, it reaches 7.14 m/s (in the middle of the Azov Sea), while in the western part of the basin the greatest values range between 6.5 and 7 m/s. The highest average values for U10 are encountered during the winter season, with a maximum around 8.24 m/s. In the western side of the basin there can be also encountered values higher than 8 m/s. In this season (DJF), even in the eastern part (near the Strait of Kerch that is the link between Black Sea and Sea of Azov), the means reach values between 7.5 and 8 m/s. During the summer season (JJA) the lowest values of U10 are noticed (with a maximum of 6.12 m/s), when an extended field with values between 5.5 and 6 m/s can be found just near to the coasts of the western side.
The examination of the spatial distribution of the mean significant wave height computed for the total period (Figure 1, first line to the right) shows that the Hs values reach 1 m in the centre and southwest of the Black Sea basin. This result is consistent with the mean wind direction over this area. On the other hand, the average Hs values in the eastern part of the basin do not exceed 0.9 m in any offshore zone.
The seasonal maps presented in Figure 1 indicate that the average significant wave heights have maximum values in the winter. In the middle of the Westside basin, it is located the maximum value (1.44 m). Around this point, and also in a small area located near the east coast, there are values around 1.4 m. The average values corresponding to the central part of the basin are also high (around 1.3 m). The spatial distributions of the mean Hs have similar patterns in spring and autumn. The spatial distribution plots show in autumn values slightly higher for the parameter mean Hs than in spring, but only in the west side. Regarding the map corresponding to the summer season, a more uniform wave field than in all the other seasons is observed, the higher values (around 0.8 m) being located in the southwest of the Black Sea.
Results
Wind and wave energy resource characterization
Based on the main met-ocean parameters available for the 20-year period 1997–2016, the wave and offshore wind energy will be evaluated in this section. The focus is to identify the areas with potential for joint wind-wave farm installations, that is those areas where the resources are complementary.
The wind speeds provided by NCEP-CFRS is given at a typical high of 10 m over the sea, but recently the more usual height for offshore wind energy exploitation raises at 80 m or more (Colmenar-Santos et al., 2016). In these conditions, the wind data need to be recompiled. Based on the assumption that wind speed increases roughly logarithmically with height in statically neutral surface layer (see Stull, 2015), the wind speed at a certain height can be calculated using the known wind speed at 10 m. According to this approach, the wind speed U at a certain height z can be expressed as
The wind power density p (W/m2) per unit of swept area is evaluated from (Boyle, 1996)

As regards the wave power, this is computed by the SWAN model as components of the energy transport over one meter of wave front (W/m). The relationships are (see Rusu, 2015)
Thus, the total wave power becomes

The average values of the wind power at 80 m and of the wave power, both computed for the 20-year period considered, are presented in Figure 2 (first line).
The spatial distribution of the mean wind power density at 80 m (left panels) and the mean wave power fields (right panels) for the entire 20-year period 1997–2016 (fist line), and for each season: winter (DJF) – second line, spring (MAM) – third line, summer (JJA) – fourth line, autumn (SON) – last line.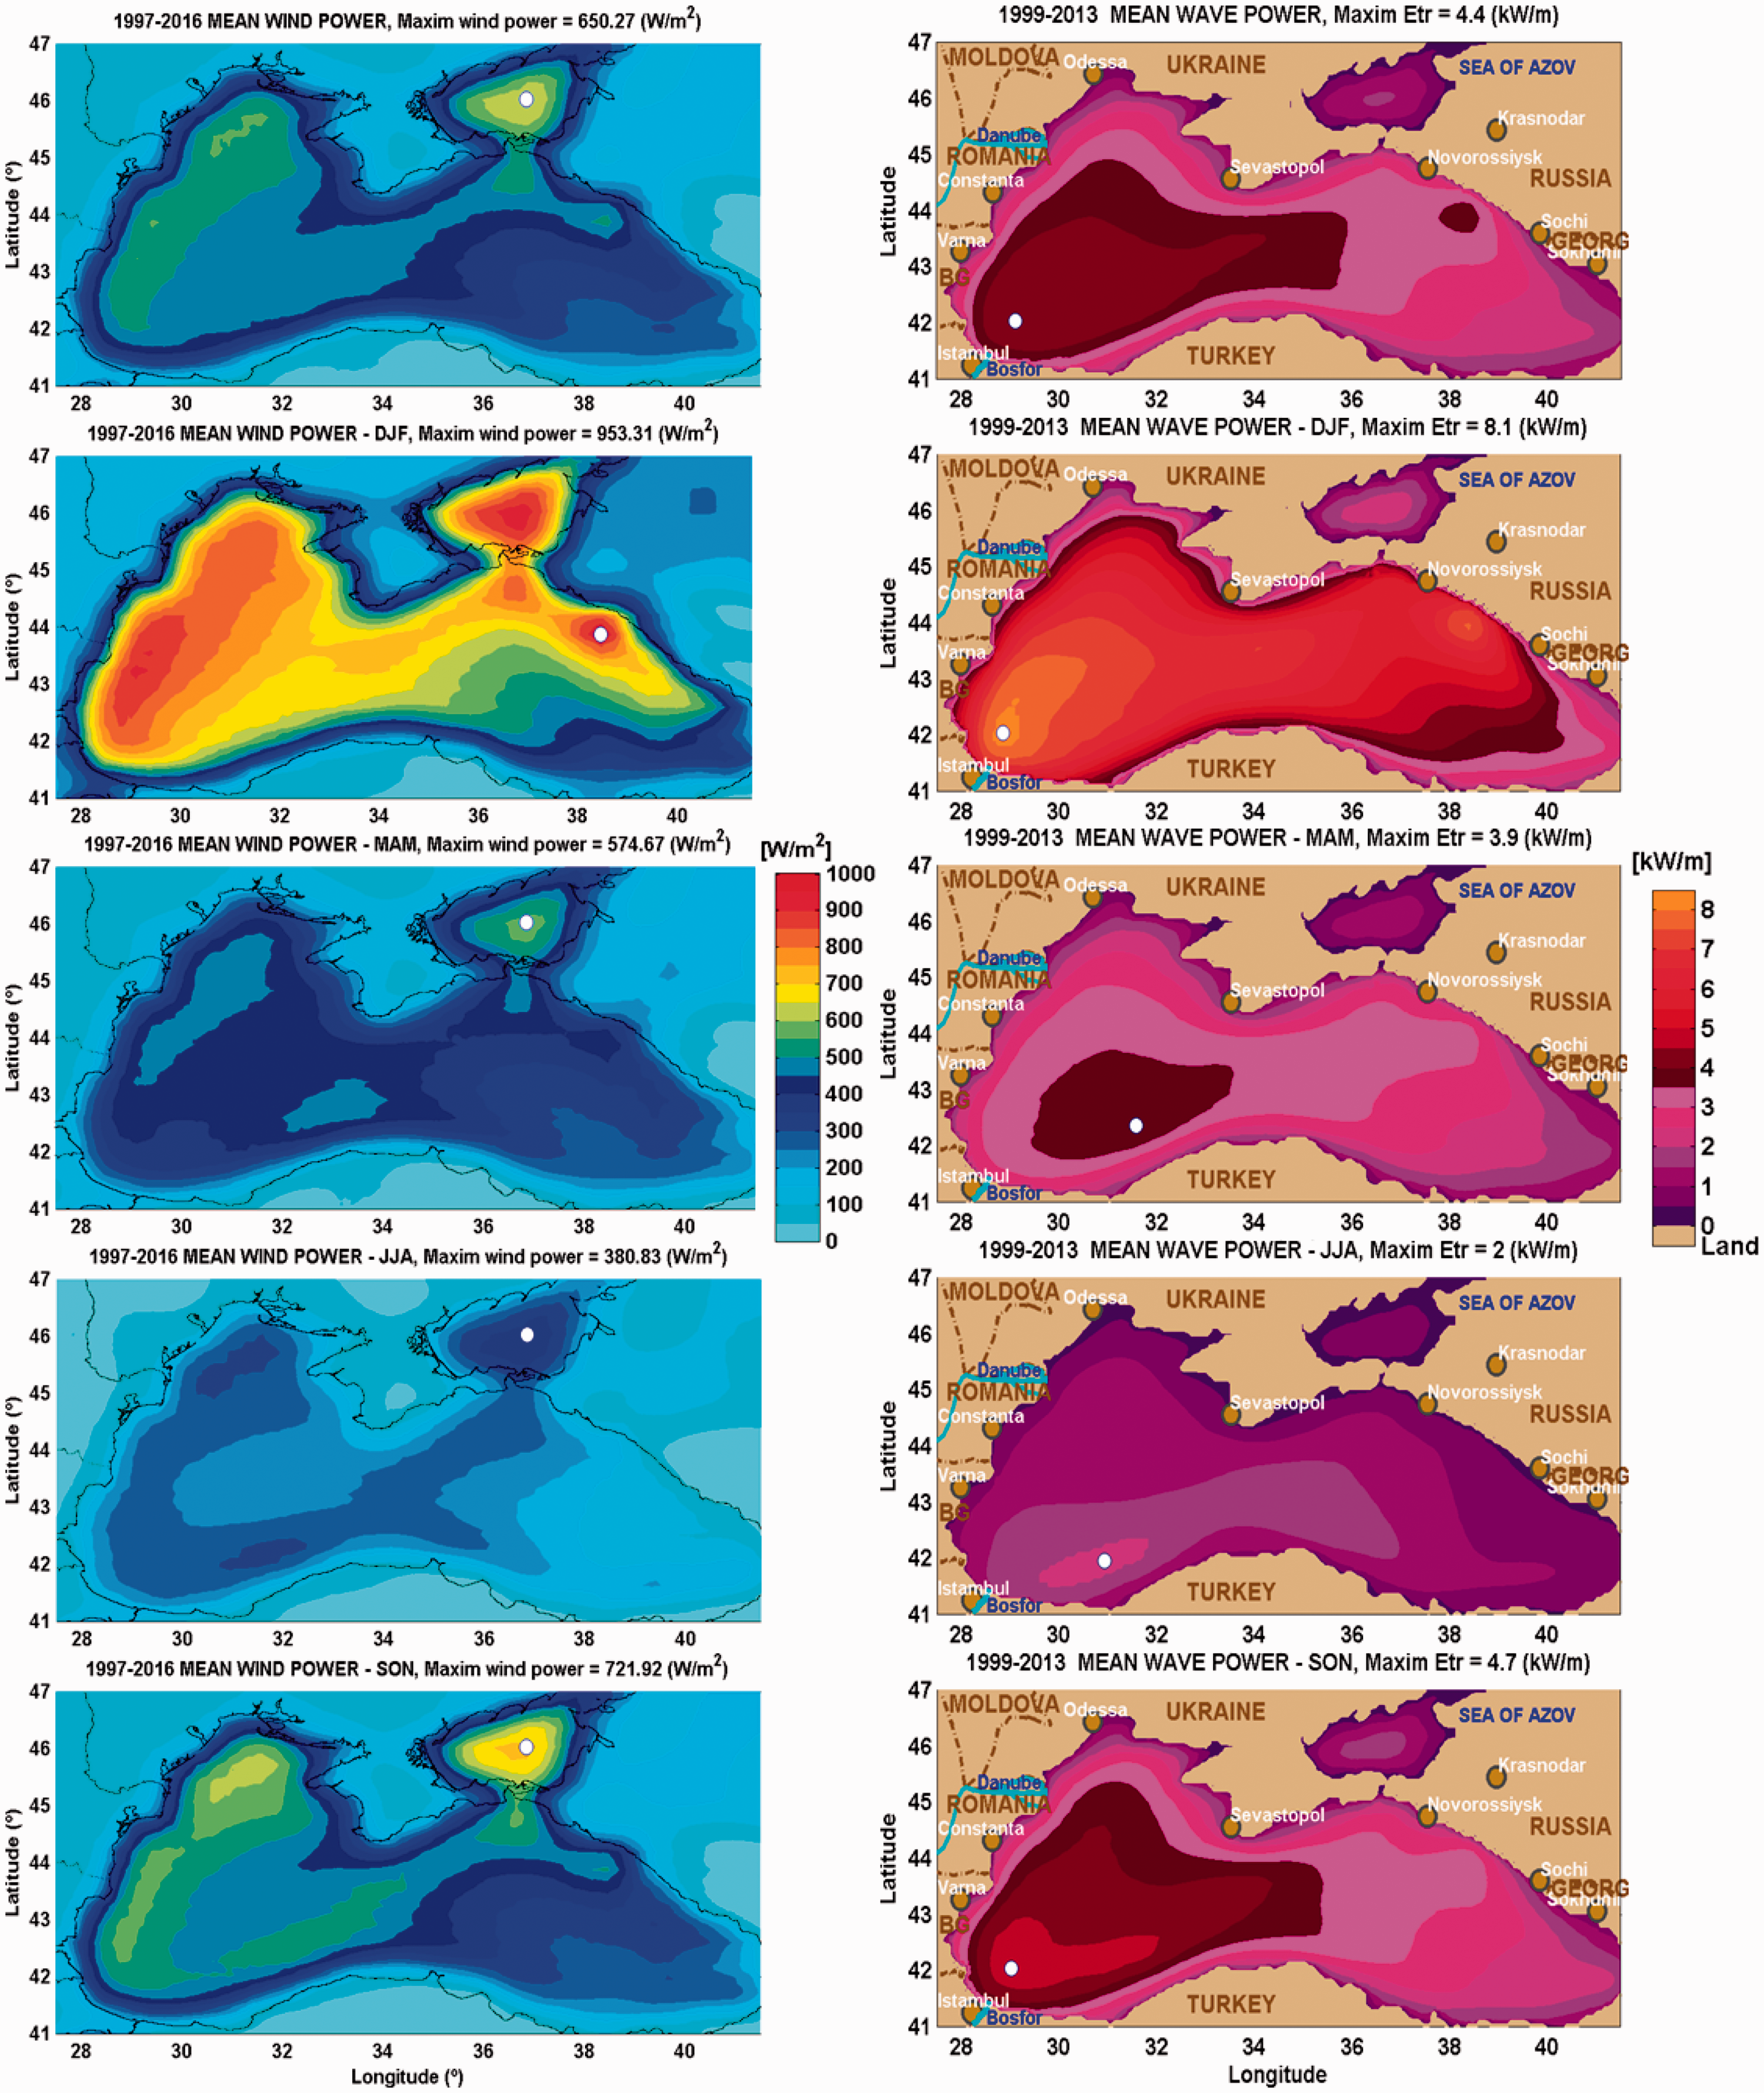
By examining the average wind power value (Figure 2, the first line to the left), it can be noticed that the strongest wind energy intensities are found in the Azov Sea with a maximum value around 650 W/m2, followed by the western side of the Black Sea where the wind power have values around 500 W/m2 on extended areas. As regards the wave power, the highest values are found in the southwest with maxima of 4.4 kW/m (Figure 2, the first line to the right).
As expected, it results from the seasonal variations of the mean wind power that the strongest wind energy intensity can be found in the winter season, with extended areas where the wind power is over 900 W/m2, followed by the autumn season (see Figure 2). The western region of the Black Sea and the Sea of Azov presents a high potential for the wind power exploitation, due to the greater values founded there and also because high values (over 400 W/m2) are encountered near the coastline. The comparison of the offshore wind power with the one over land indicates that the first is considerably greater, even near the coastline. This can make the coastal areas more attractive for future development of the wind farms.
The highest values of the mean wave power are found in the winter (8.1 kW/m). Thus, in wintertime on wide areas the average values are about twice than those computed for the entire period. The greatest fields are located in the southwestern side of the basin (in the offshore of Istanbul) and also in a small area in the northeast (along the Russian coastline). In autumn, the levels of the mean wave power are almost as high as those calculated for total period. During the summertime the wave energy levels are rather weak over the entire basin (the maximum value only reaches 2 kW/m). However, it can be also noticed that in the southeastern part of basin there are no remarkable differences between the seasons.
Variability of the wind and wave power
In general, the variability of the renewable energy resources at different timescales is a key factor for their integration in the power system (Cosseron et al., 2014; Lund, 2007). Thus, the viability of a site to become attractive for the wind and/or wave power exploitation is affected by the variability of the resources. Sometimes, the sites with moderate resources and steady energy behaviour can be more attractive to develop projects, than those with higher amount of resources but affected by the instabilities in time. Given the above considerations, a more detailed picture of the variability of the resources is necessary. Moreover, it is noteworthy that the wind and wave power in enclosed basins are more variable than in open seas (see Kalogeri et al., 2017). In addition, they pointed out that the wave power is more variable than the wind power.
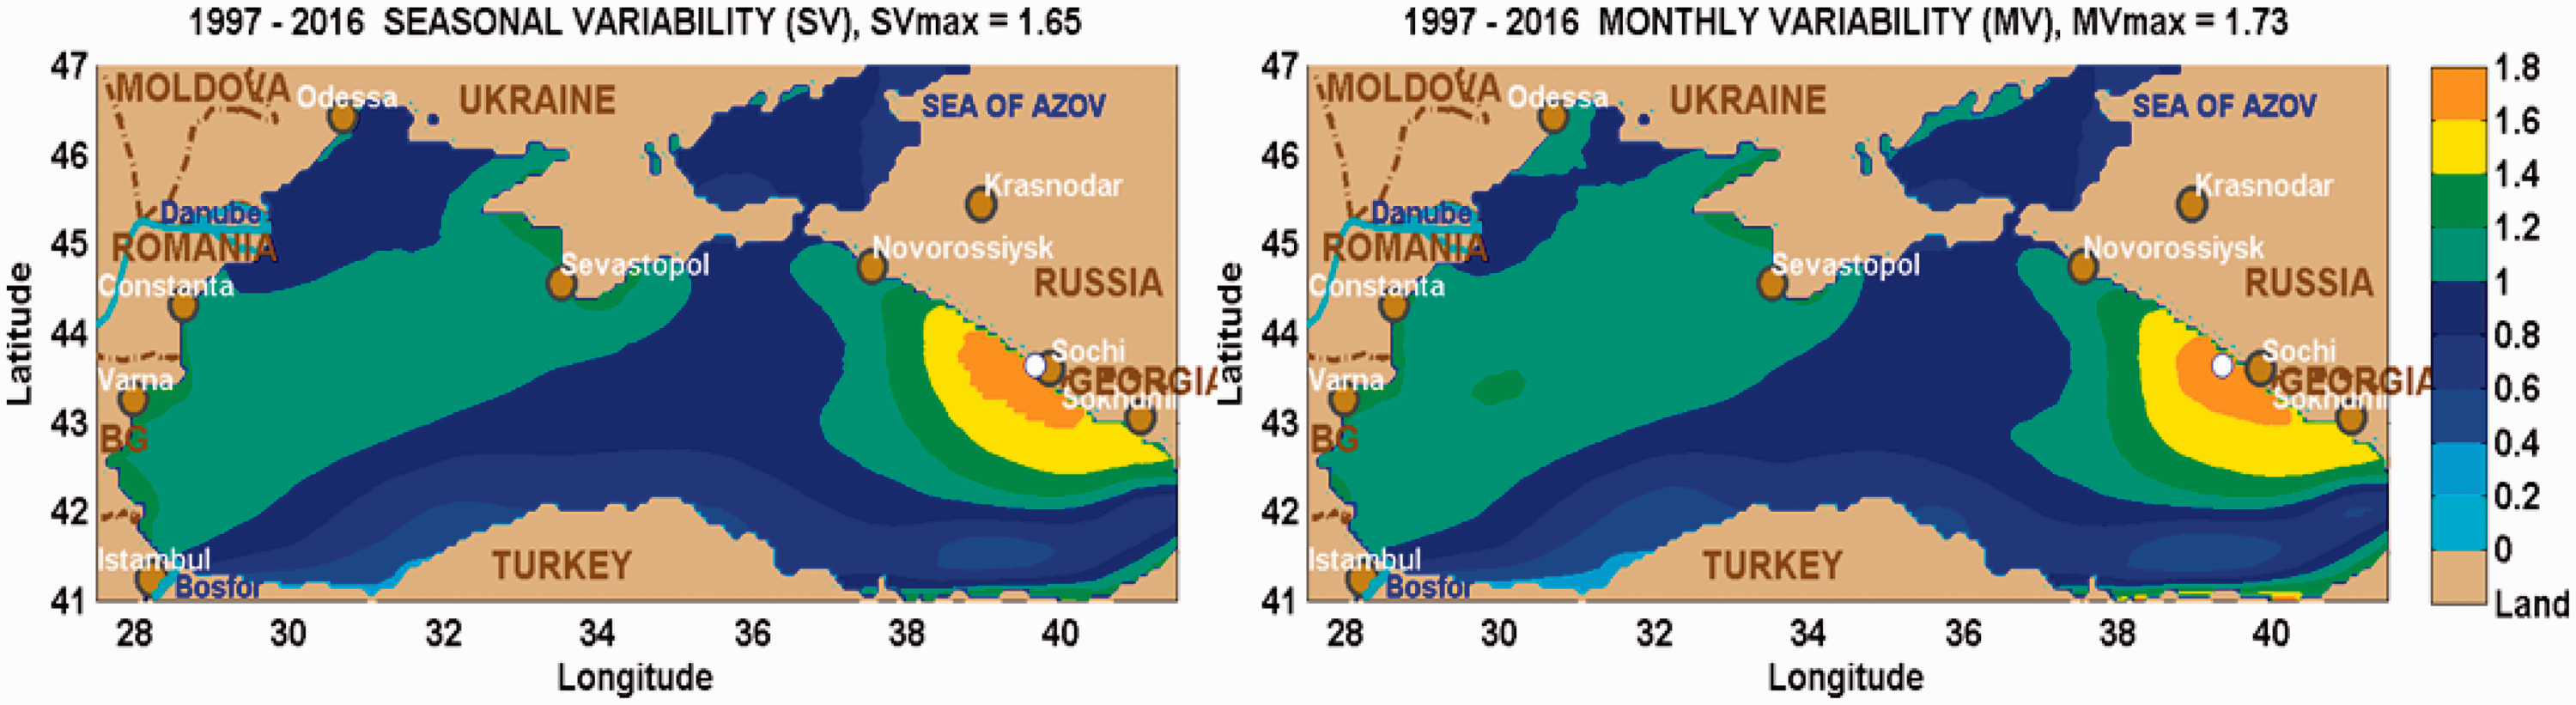
Thus, the information provided by the seasonal and monthly variability indexes (SV and MV, respectively) can help for a better description of the variation in time of the wind and wave power. These indexes are defined as the differences between the most energetic season/month and the least energetic season/month divided by the yearly average value evaluated over the whole data set (Cornett, 2008)


The SV and MV values computed for the wave and wind power are presented in Figures 3 and 4, respectively. Both indexes being dimensionless, the same colorbar was used for their spatial representation. The results show that the rate of variation from one month to another is somehow equal with the seasonal one, for each type of resources. In the case of the wave power resources the index patterns are quite similar, only a bit higher is MV (0.2). The analysis of both indexes indicates the northeastern basin as a more variable area in terms of the wave resources, while the eastern part for wind power at 80 m.
Seasonal (left) and monthly (right) variability of the mean wave power for the 20-year period 1997–2016. Seasonal (left) and monthly (right) variability of the mean wind power at 80 m for the 20-year period 1997–2016.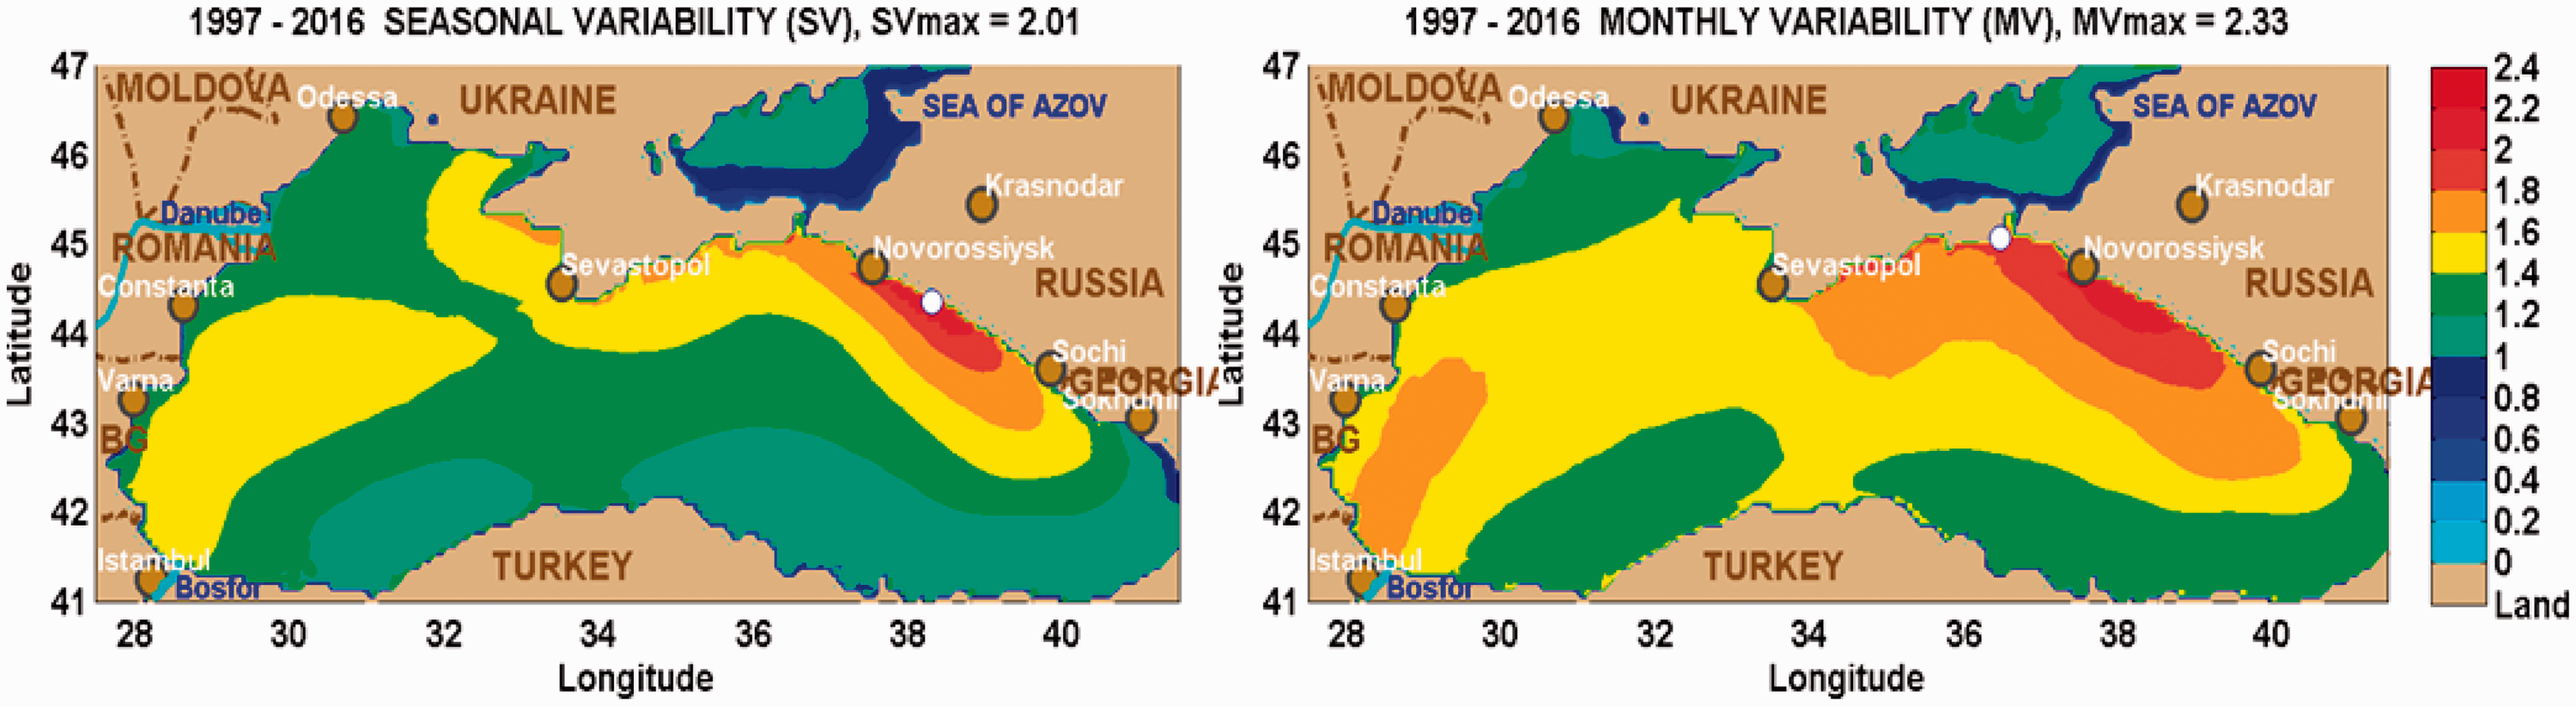
As a support for a better understanding of the spatiotemporal variability of the wind and wave power resources in the Black Sea basin, other three indexes were computed. First, the coefficient of variation (COV) is considered, while the other two indexes analysed are the skewness (Sk) and kurtosis (K). COV is calculated as the ratio of the standard deviation (σ) to the mean (μ), while Sk and Κ were evaluated with the following relationships


The spatial distribution of the COV index computed considering the 20-year period for the wind and wave power is illustrated in Figure 5. It is easy to notice that the wind power reveals lower COV values than the wave power, with extended areas (Sea of Azov and the western side of the basin) characterized by small COV values (around 1.4). As expected, in the eastern part the highest COVs values are noticed. Concerning the wave power variability, the COV indexes are greater (around 4) especially in the eastern side and around the Crimea Peninsula. An overview of COV for both resources indicates that the Romanian coastal environment and the Sea of Azov are among of the most stable areas of the Black Sea basin.
Coefficient of variation of the wind power potential at 80 m (left) and of the wave power potential (right), for the period 1997–2016.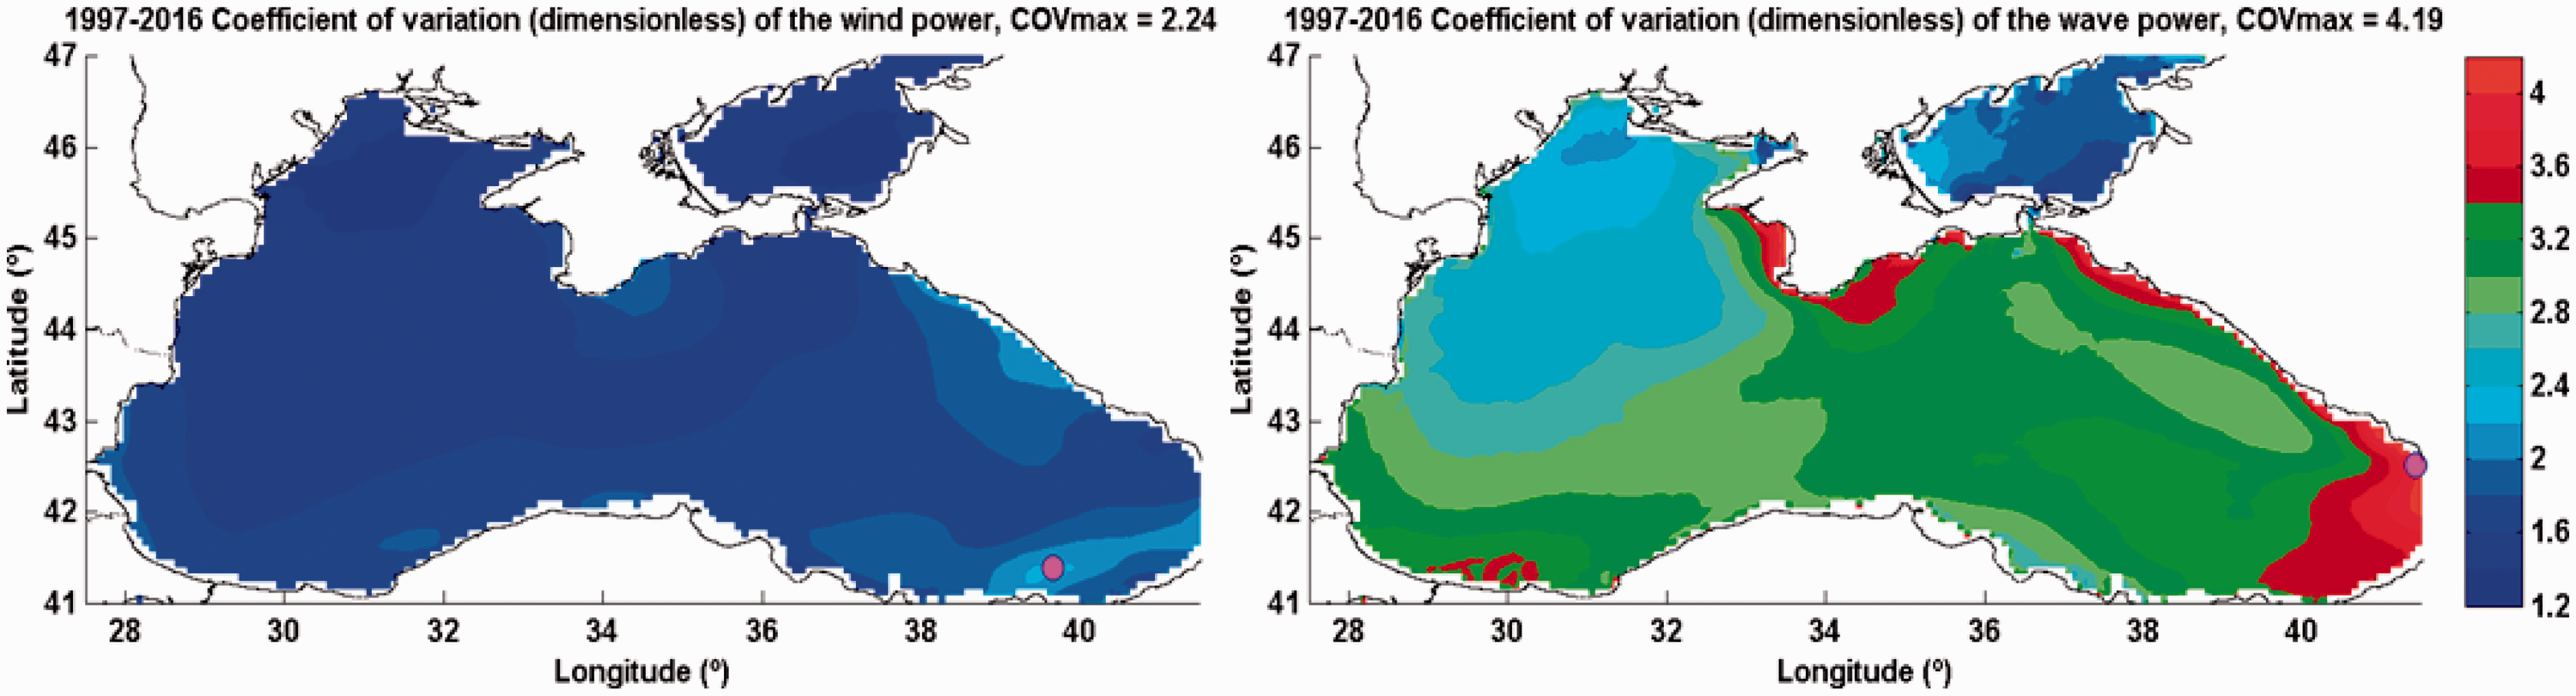
Sk and Κ indexes represent the higher moments of the data set and they are useful to evaluate the existence of extremes (greater or smaller values) and how often they occur. High values of these parameters indicate an unstable behaviour of the resources. Figure 6 presents the spatial distribution of the indices Sk and K, for both resources.
Skewness (first line) and kurtosis (second line) of the wind power potential at 80 m (left panels) and the wave power potential (right panels) respectively, for the 20-year period 1997–2016.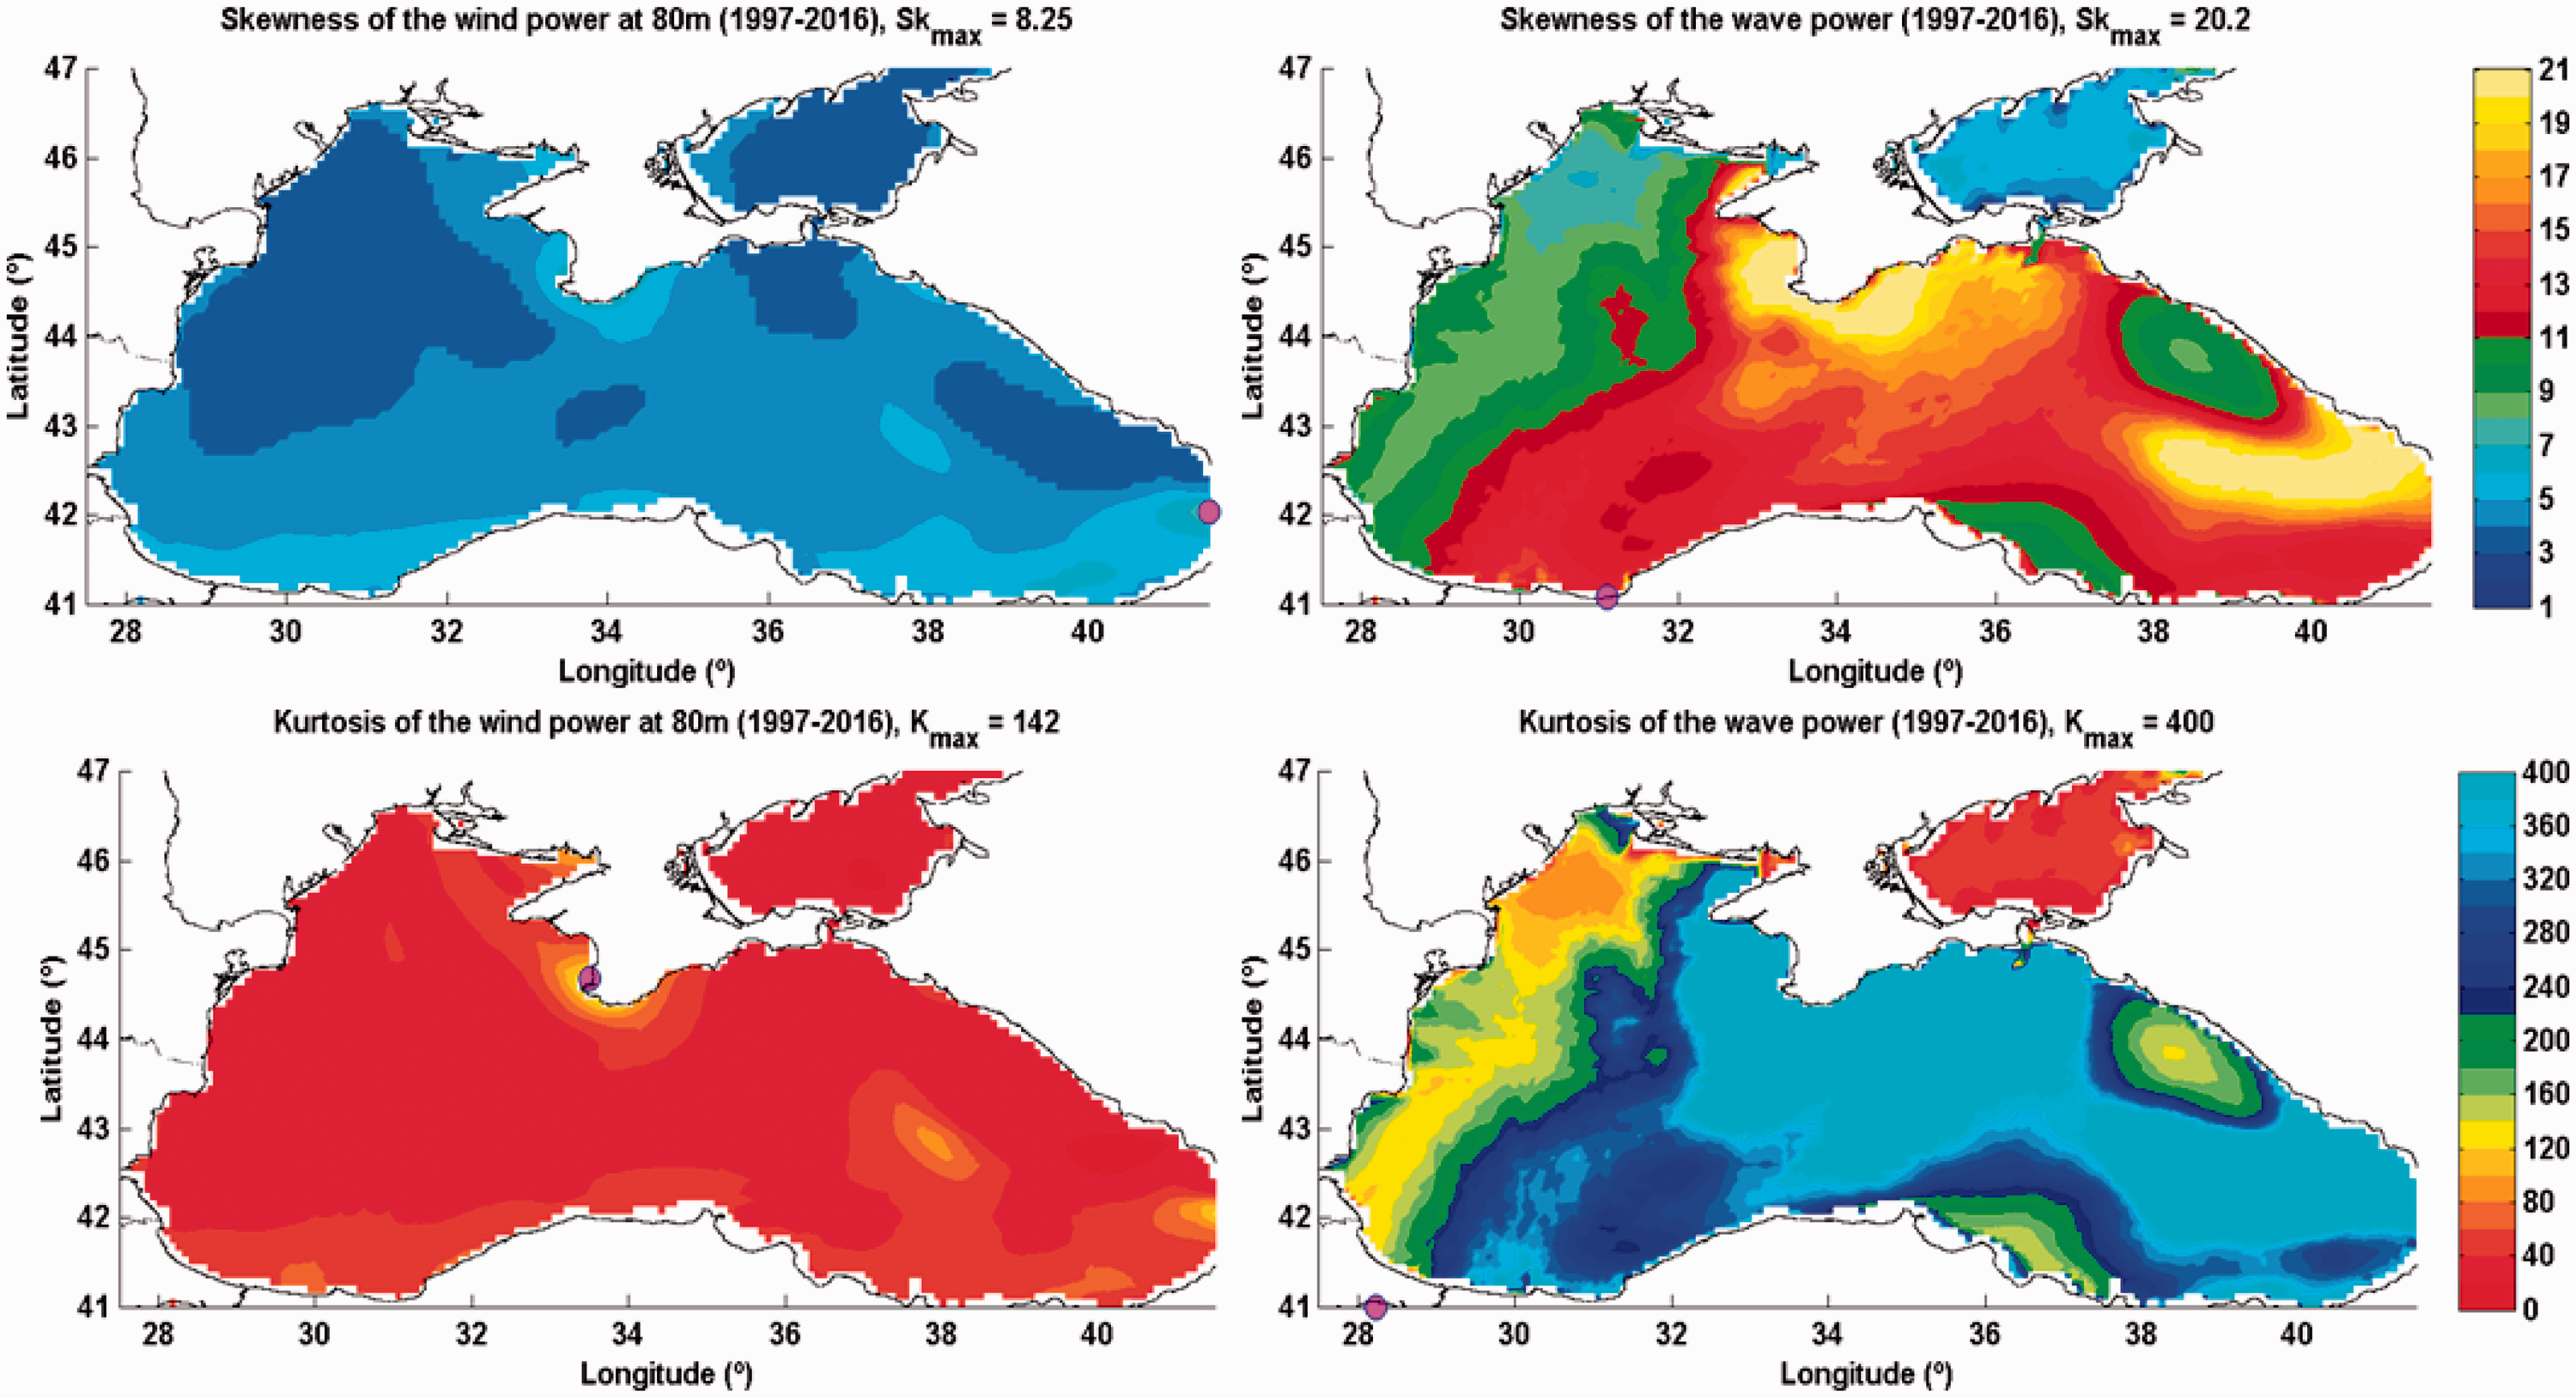
In the case of the wind power, the areas with higher values of both indexes are in the southern part of the basin and in north around the coastlines of Crimea Peninsula. As regards the wind power, the lower Sk and K values there are in the Azov Sea and in the western side of the basin. These results are consistent with the other results analysed until now. The wind power seems to have more stable features than the wave power, with lower values of the indexes Sk and K. This is in line with results obtained by Kalogeri et al. (2017) for the semi-enclosed basin represented by the Mediterranean Sea, considering a 10-year period of data for the analysis.
Assessment of the wind and wave power on local scales
In order to evaluate the wind and wave power at a local scale, two categories of reference points have been considered. The first category consists of 10 reference points located in intermediate water depth, at about 50 m. These are closer to the coast. The second category is represented by other 10 reference points, which are located offshore the points from the first category, at about 100 m water depth, denoted also as deep water (or offshore) points. Thus, there have been defined pairs of points, nearshore – offshore. Figure 7 presents the bathymetric map of the Black Sea, corresponding to the computational domain defined for the SWAN simulations, and also the locations of the reference points considered.
The bathymetric map of the Black Sea. In the foreground the reference points selected for the local analyses are illustrated (red triangles – points located in intermediate water depth, about 50 m, yellow circles – point located in deep water, about 100 m depth).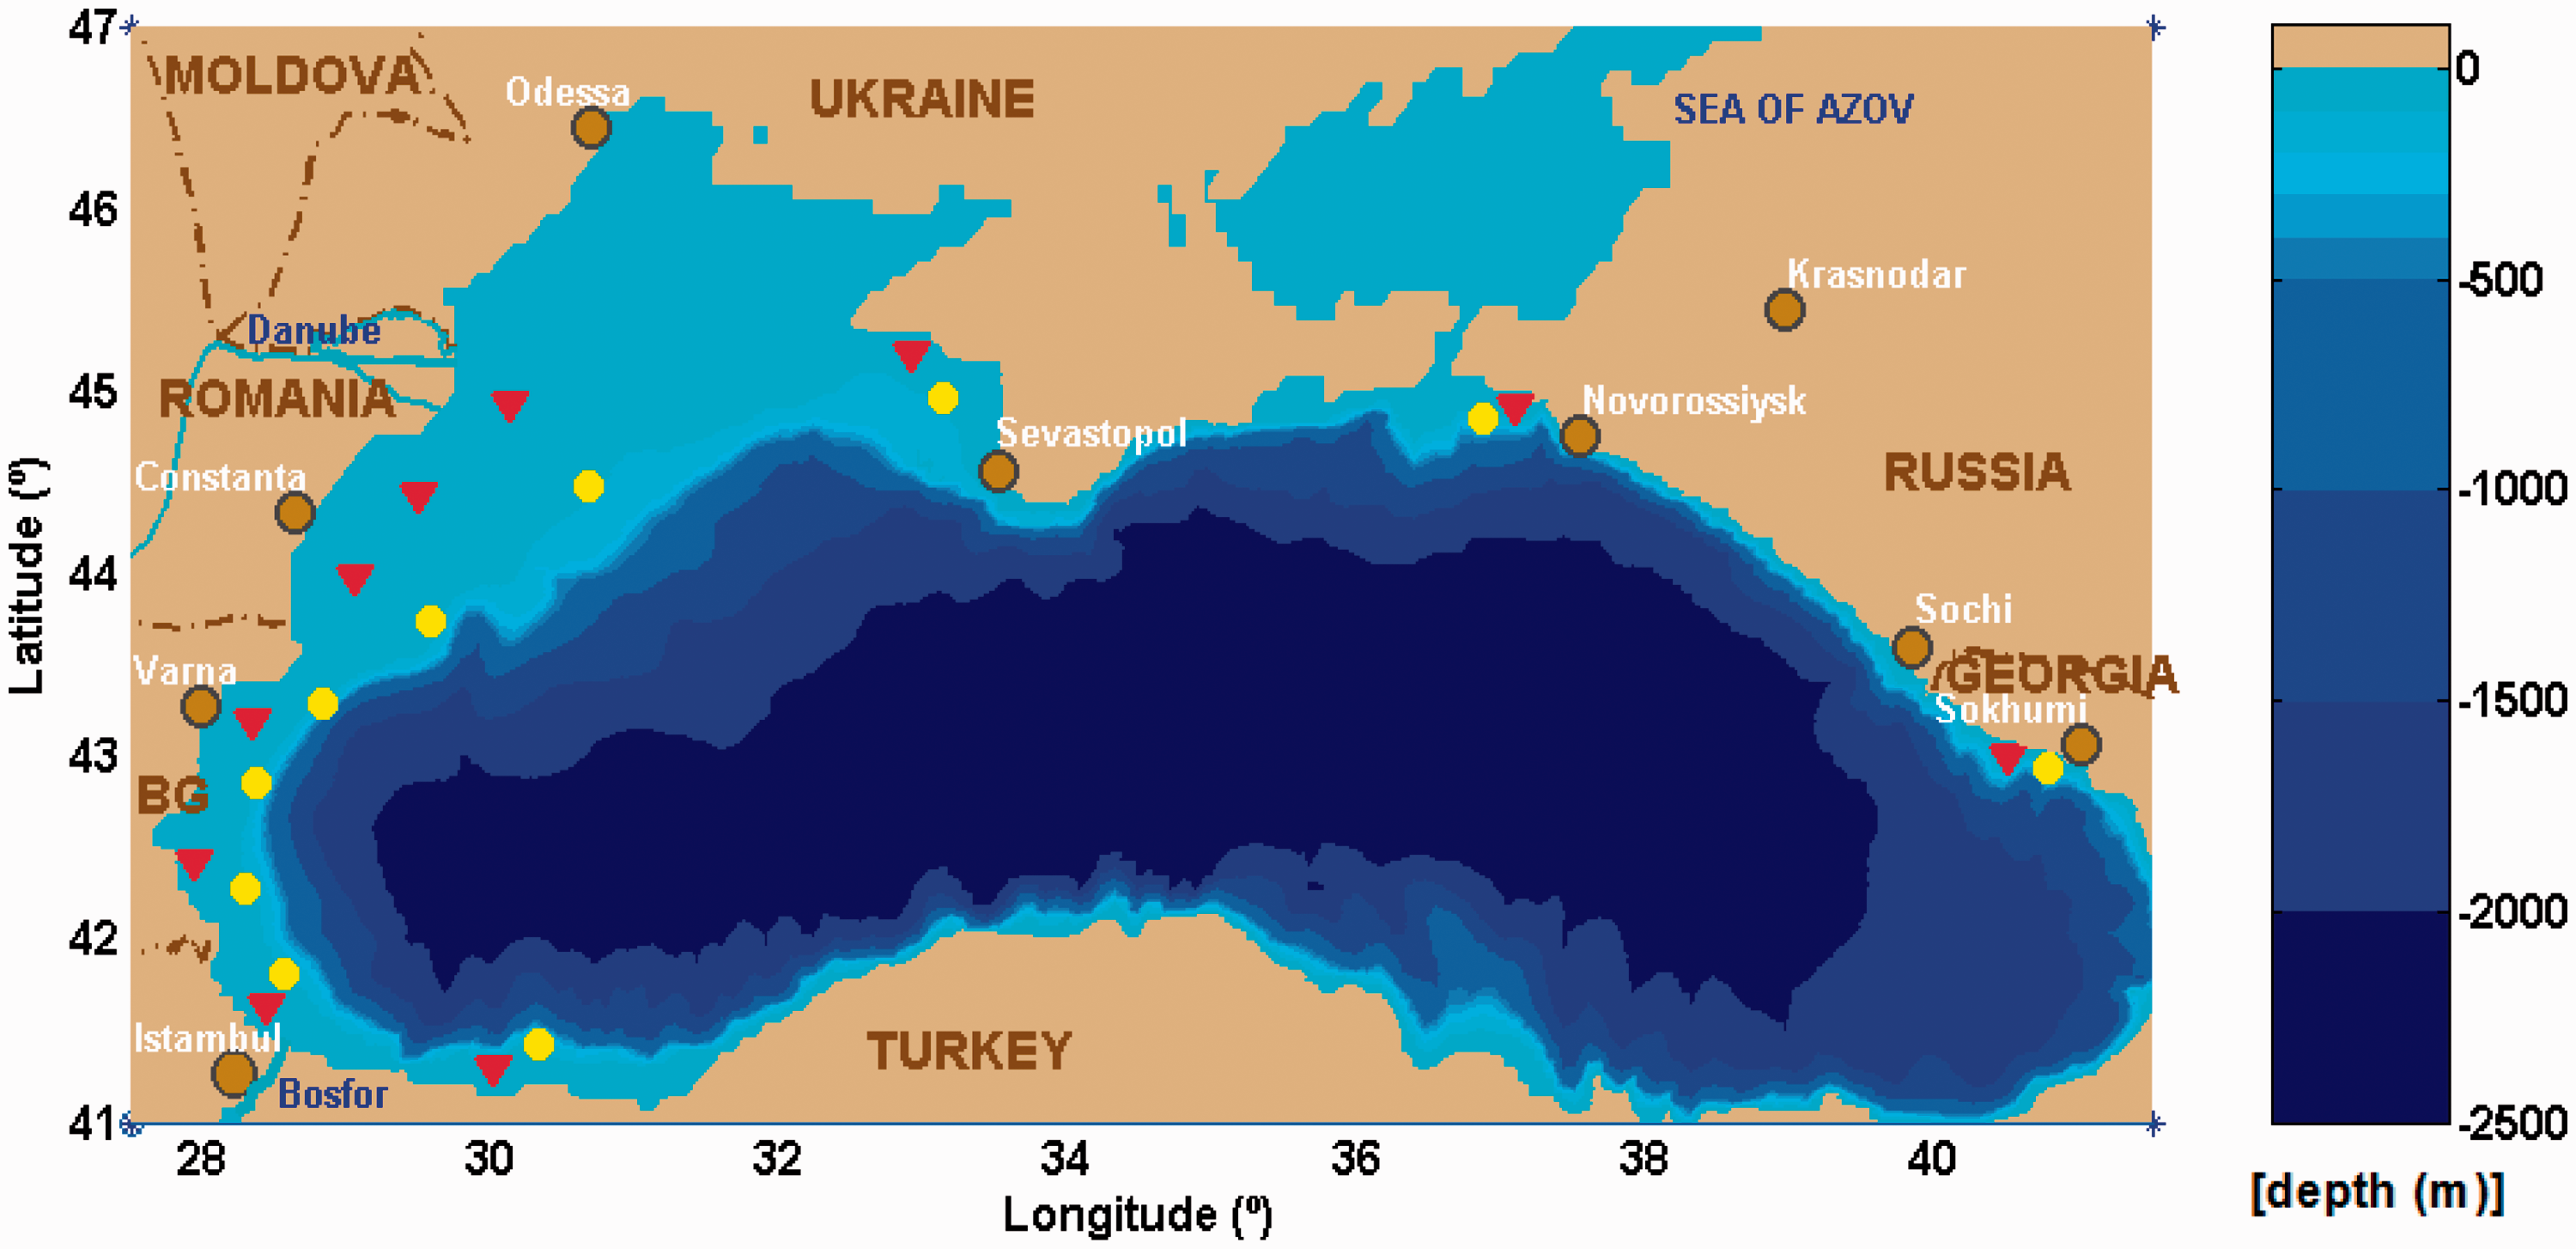
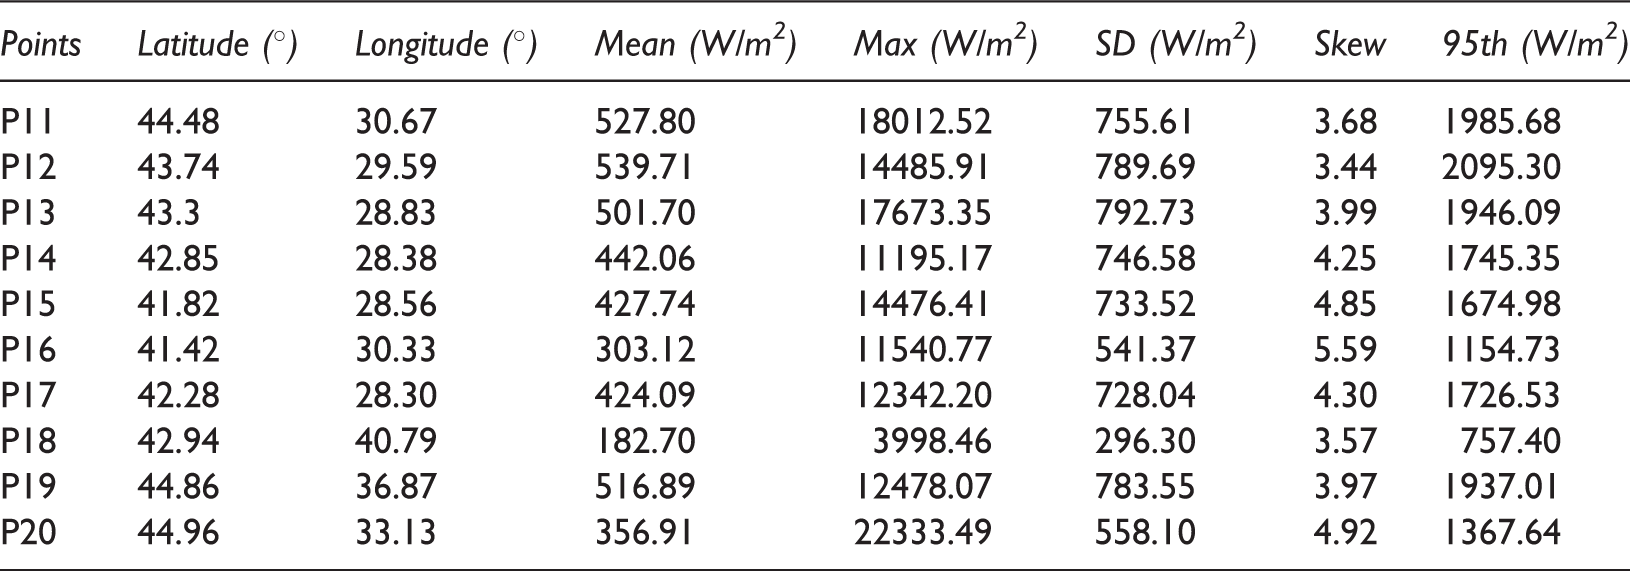
The main characteristics of the wave power corresponding to the reference points (red triangles) located in intermediate water depth, about 50 m.
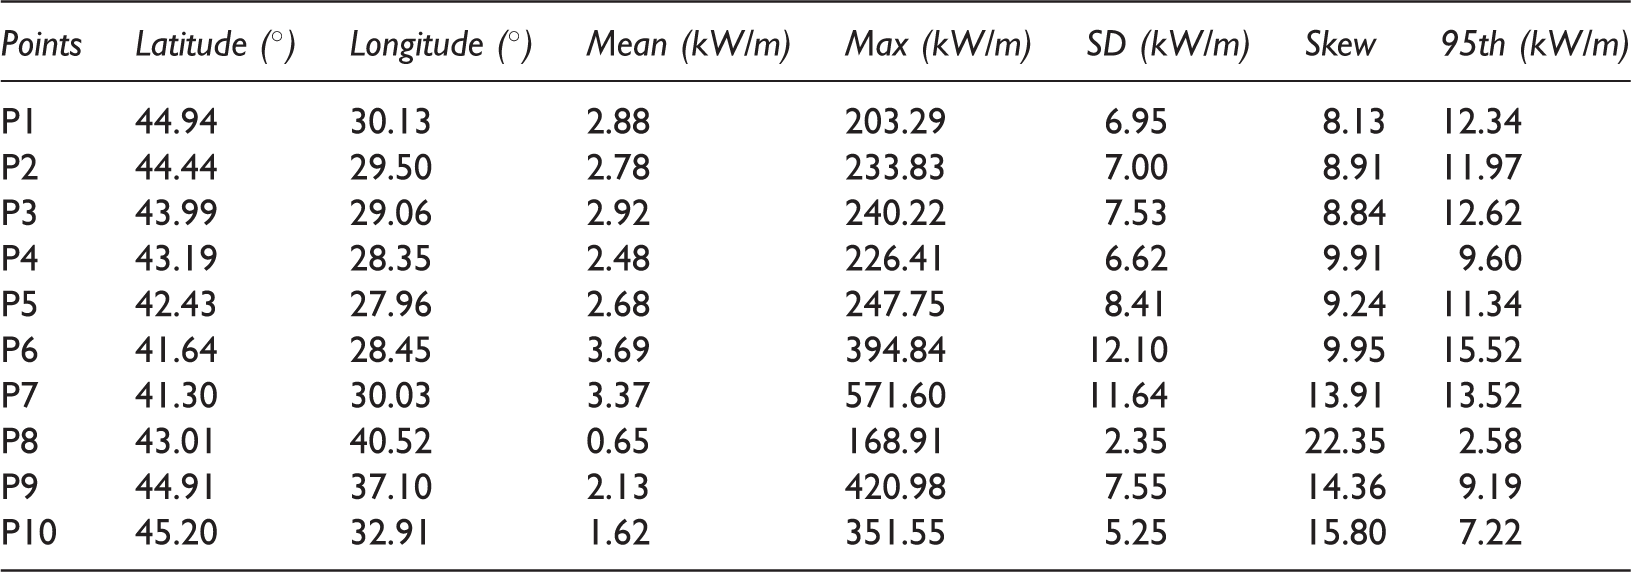
Note: The notation starts from the west counterclockwise, with P1 in front of the Romanian nearshore.
The main characteristics of the wave power corresponding to the reference points (red triangles) located in deep water, about 100 m depth.
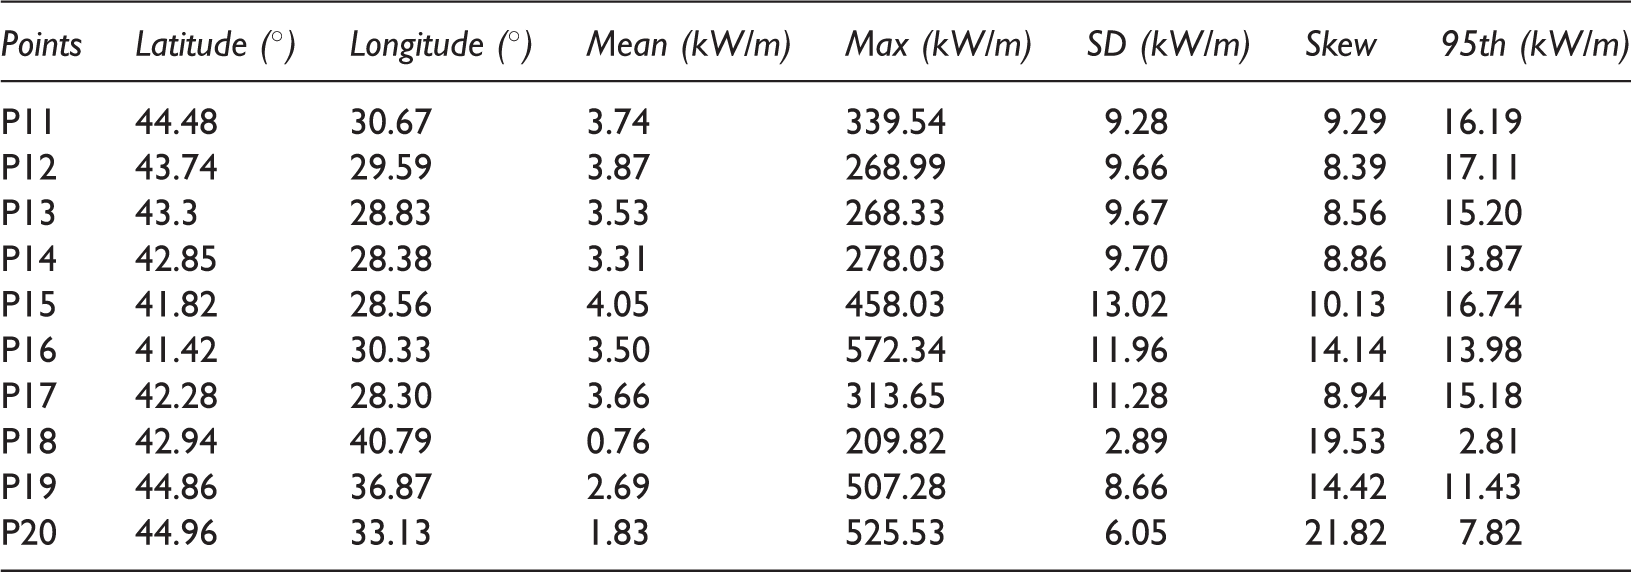
The notation starts from the west counterclockwise, with P11 offshore the Romanian coast.
The main characteristics of the wind power corresponding to the reference points (red triangles) located in intermediate water depth, about 50 m.
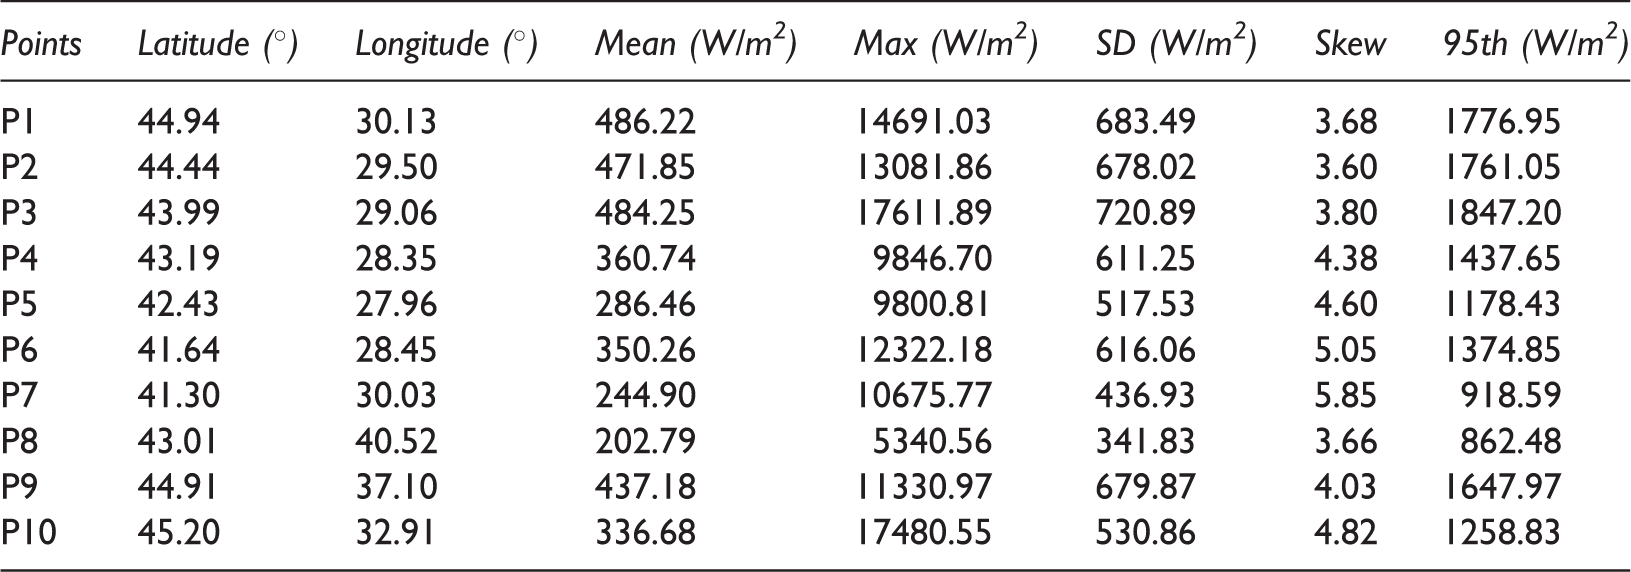
Note: The notation starts from the west counterclockwise, with P1 in front of the Romanian nearshore.
The main characteristics of the wind power corresponding to the reference points (red triangles) located in deep water, about 100 m depth.
Note: The notation starts from the west counterclockwise, with P11 in front of the Romanian nearshore.
The analysis starts with the statistical results presented in Tables 1 and 2, which are related to the wave power. From these data, it can be noticed that for the first five reference points located at about 50 m water depth (in the western side of the Black Sea basin) there are no significant differences, the mean power values being in the range 2.5–3 kW/m. By comparing now these values with those for the deep water points (100 m), it can be noticed that the mean power for the intermediate water points represent in general about 70% of the values of the wave power for the corresponding deep water points.
On the other hand, in the case of the reference points P6 and P7, located in the southwestern side of the basin (close to the city of Istanbul) the average wave power values are sensible equal for the intermediate and deep water points. At the same time, they are comparable with the values corresponding to the first five deep water points (in the range 3.3–4 kW/m). The average wave power values corresponding to the points situated in the east, P8 and P18, respectively (corresponding to both intermediate and deep water) are considerably lower (only around 0.7 kW/m). Finally, for the points from the north of the basin (P9 and P10 located in intermediate water and on the other hand P19 and P20 located in deep water), the average wave power values are inferior with about 20% in comparison with the values registered for the first five reference points. This aspect can be noticed also from the previous figures that provide the distribution of the wave parameters at the level of the entire sea basin.
As regards the maximum wave power, the highest values (over 350 kW/m) correspond to the reference points P6, P7, P9, P10 (intermediate water) and P15, P16, P19, P20 (deep water). As regards the standard deviation, the highest values (over 11 kW/m) are noticed in the southwest of the sea basin corresponding to the points P6, P7 (50 m) and P15, P16, P17 (100 m). The skewness is in general in the range 8–10, out of this interval being the values estimated for the points located in the east and the north of the basin, as also the reference points P7 and P16 from the southwestern side of the basin. These increased values indicate the fact that the data are non-symmetric.
The analysis of the wind data corresponding to the 20 reference points considered is presented in Tables 3 and 4. The average wind power values indicate that in general it does not exist a significant difference between the points located in intermediate water depth (50 m) and the points located in deep water (100 m). It can be noticed however one exception, for the pair of points P5 and P15, which are situated in front of the Bulgarian nearshore (close to the city of de Burgas). Thus, for the reference point P5 the average value of the wind power is 286.46 W/m2, while offshore at about 100 m depth the average value of the wind power is 427.74 W/m2. As regards the standard deviations, the greatest difference (about 300 W/m2) between the pairs of points nearshore-offshore occurs for the points P7 and P17 located in the southwestern part of the basin. In general, it can be noticed that the standard deviation has greater values in the offshore points. As regards the values of the maximum wind power, there is no relevant difference nearshore-offshore, while the highest values for this parameter can be noticed in the vicinity of the Crimea Peninsula (Sevastopol) and in the first points from the Romanian nearshore.
The skewness values are lowest in the western side of the basin and as going in the direction of the Turkish nearshore the data become non-symmetric, the highest values being noticed in the reference points P6, P7 and P16. As regards the reference point P17, although this is located close to P7, the skewness value is lower with 1.5. The reference point P8 has also a lower value of this index (about 3.6) being located in an area with decreased variability (see also Figure 5).
The next part of this section is dedicated to the analysis of the correlation between the wind and wave power. The reduction of the power variability of a mixed farm will be produced if the variable sources balance each other’s variations (Fusco et al., 2010). The complementarity of the two resources can be reflected by the correlation between the wave and wind power. The cross-correlation for two generic signals, x(k) and y(k) is computed with the relationship

The correlation coefficients between the wind and wave power were computed for each point, using data covering the 20-year period, and they are presented in Figure 8. The values of the coefficients computed in the points from the western and southwestern sides of the basin are in the range 0.7–0.8 for the nearshore points, while for the offshore points the value is almost the same, being around 0.9. In the eastern and northern parts of the basin the values of the coefficient are lower. The smallest values are noticed in the reference points P8 and P18 from the eastern side of the basin. Finally, it can be also noticed that in the reference points P16 and P18 located offshore, the values of the coefficients are lower than for the corresponding nearshore points.
The cross-correlation between wind and wave power, at a zero time lag.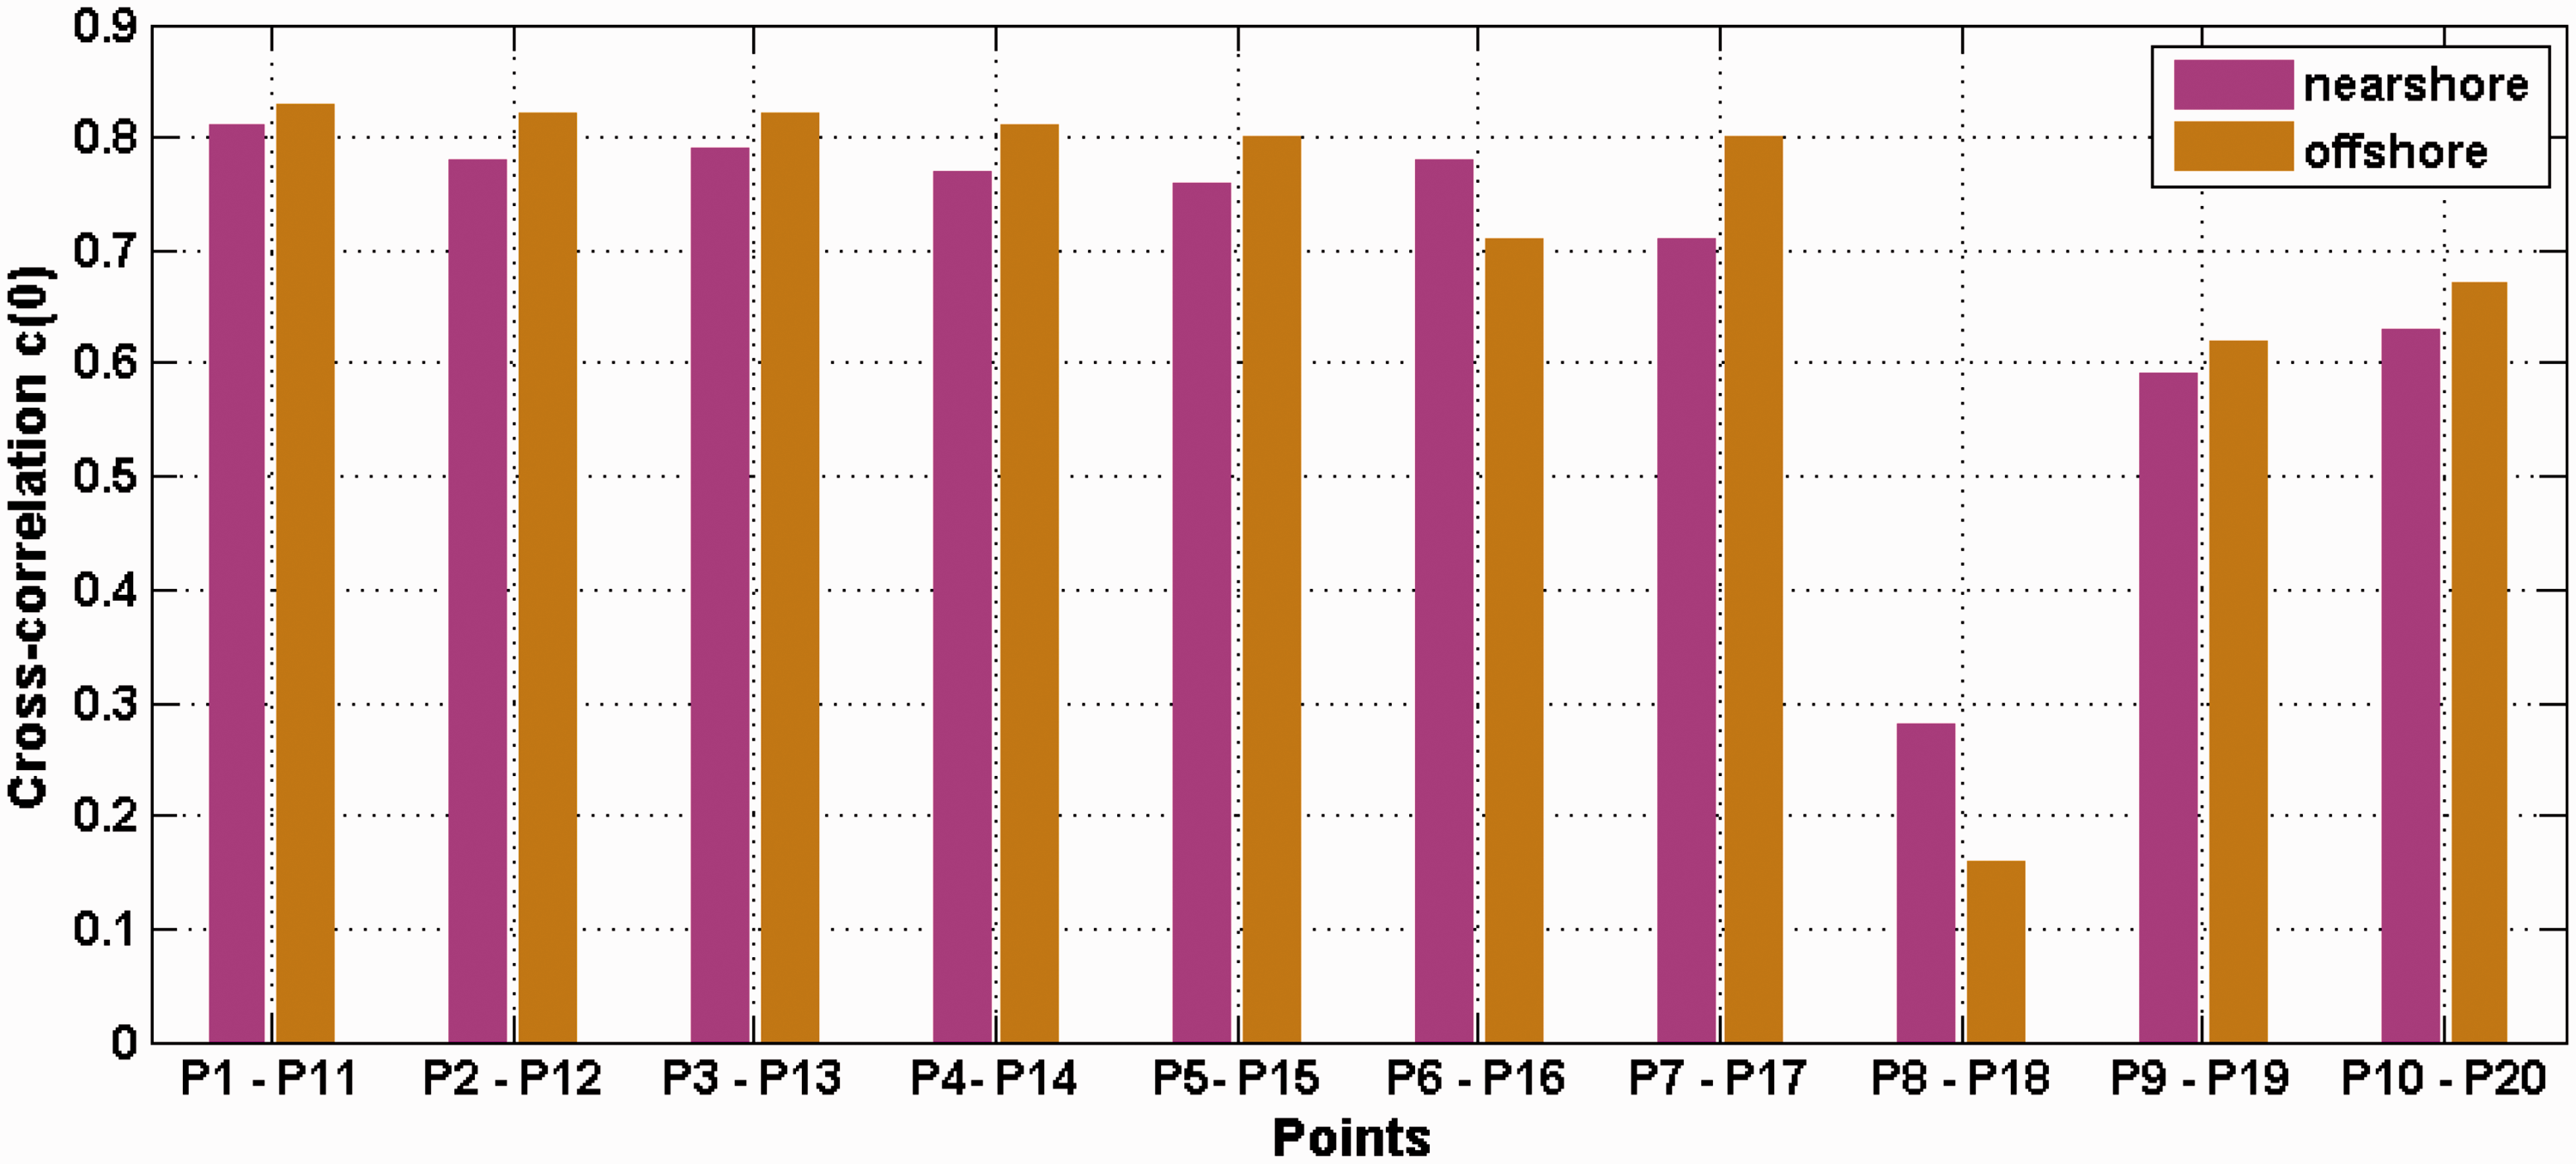
Conclusions
In this work, the assessment of the wind and wave energy resources was performed in the Black Sea, with the main objective to identify the most suitable areas for combined exploitation of both resources. First of all, an evaluation of the wind and wave climate in the Black Sea has been carried out on the basis of 10 m reanalysis wind field and on the hindcast wave simulations with data assimilation for a period of 20-year (1997–2016). The analysis of the wind speed variability was made considering the mean values of this parameter computed for all data and also for each season. The examination of the spatial distribution maps indicates the Sea of Azov and the western side of the Black Sea basin as being characterized by higher wind speeds. Black Sea is an enclosed sea with small fetches, which do not allow the formation of swell, and for this reason, the local winds have more impact on the waves. As a result of this feature, the highest mean significant wave heights were also found in the western side of the Black Sea. On the other hand, the Sea of Azov has relatively small depths (extended areas with depths about 10 m) that not allow to waves reach great heights, even for high wind speed conditions.
For the assessment of the wind power the wind speeds at 80 m height above the sea level have been considered. As expected, the areas with higher wind power near the coast are the Sea of Azov (water depths smaller than 50 m), the western side of the Black Sea basin and a small region located in the northeastern part of the basin. As regards the wave power, the western side appears to have more significant potential, because it has significant levels of wave energy and also a lower coefficient of variation. At the same time, the wind power seems to have more stable features than the wave power. The assessment of the wind and wave power on local scales indicated also the locations situated in the western side of the Black Sea basin as having greater potential for joint exploitation of both resources.
Finally, it can be concluded that there are some places in the coastal environment of the Black Sea, especially in the western side of the basin, which might become interesting for the extraction of the renewable energy.
Footnotes
Acknowledgements
The authors would like to express their gratitude to the reviewers for their constructive suggestions and observations that helped in improving the present work.
Declaration of conflicting interests
The author(s) declared no potential conflicts of interest with respect to the research, authorship, and/or publication of this article.
Funding
The author(s) disclosed receipt of the following financial support for the research, authorship, and/or publication of this article: This work was supported by a grant of Ministery of Research and Innovation, CNCS – UEFISCDI, project number PN-III-P4-ID-PCE-2016-0028 (project ACCWA), within PNCDI III.