
Abstract
The gas flow mechanisms in source rocks of coal measures under the effects of the pore structures and permeability characteristics were investigated by field-emission scanning electron microscopy, low-pressure nitrogen gas adsorption, high-pressure mercury intrusion, and pressure pulse decay permeability method. Various flow regimes were distinguished in the pores and fractures of differing scales, and the mass fluxes through the same were calculated using the data obtained by the numerical and experimental investigations. Results indicated that mesopores predominated in shale, while coal contained well-developed mesopores and macropores. In addition, the permeabilities of coal and shale were observed to be significantly anisotropic and highly stress dependent. The cross-sectional area proportions of the pores per unit cross-sectional area of the matrix in the free molecular, transition, and slip flow regimes in shale and coal were determined to be, respectively, 0.2:0.7:0.1 and 0.15:0.6:0.25. In the free molecular and transition flow regimes, the mass flux decreased with increasing reservoir depth, while the reverse was the case in the slip flow regime. Further, in the continuum flow regime, the mass flux was unimodally distributed with respect to the reservoir depth. The total mass flux in coal was greater in the direction perpendicular to the bedding compared to the direction parallel to the bedding, while the reverse was the case in shale. In addition, the continuum flow regime predominated in coal in both the directions perpendicular and parallel to the bedding, but only in the direction parallel to the bedding in shale. This work presents a comprehensive model for the analysis of all the flow regimes in pores and fractures of differing scales, as well as the anisotropy. Findings of the study are meaningful for establishing the coupling accumulation mechanism of the Three Coal Gases and developing a unified exploration and exploitation program.
Introduction
The unconventional gas resources in coal measures mainly comprise coalbed methane (CBM), shale gas, and tight sandstone gas, commonly referred to as the “Three Coal Gases” (Cao et al., 2014; Hou et al., 2016). The Three Coal Gases constitute a rich resource and are widely distributed in China, especially in the marine–continental strata deposited in the Carboniferous–Permian (Hou et al., 2016; Zhu et al., 2016). Present exploitation of the Three Coal gases mainly focuses on CBM and tight sandstone gas with independent perspectives (Zhang et al., 2016). However, the unified exploration and exploitation of the Three Coal Gases has been a major research subject because it is considered to be an effective means of improving the production of unconventional gas resources contained in coal measures (Qin et al., 2016; Zhu et al., 2016). Coalbed and organic-rich shale serve as typical self-generation and self-storage reservoirs for CBM and shale gas (Curtis, 2002). Understanding the gas flow mechanisms under the effects of the pore structures and permeability characteristics is the key to establishing the coupling accumulation mechanisms and achieving coexploration of the Three Coal Gases.
The source rocks of coal measures have complex pore structures, which include pores in inorganic and organic matter, and primary and secondary fractures (Wang et al., 2015). Gas flow regimes through a porous media are classified into four types, namely continuum regime, slip flow regime, transition regime, and free molecular regime (Freeman et al., 2011; Kast and Hohenthanner, 2000; Liu et al., 2012). The continuum regime can be described by the Navier–Stokes (N–S) equations with no-slip boundary conditions, while the slip flow regime can be described by slip boundary models based on the N–S equations. However, the transition and free molecular regimes cannot be described by the N–S equations with no-slip boundary conditions (Rasoul and Mahmoud, 2016), and other models such as the direct simulation Monte Carlo (Tokumasu and Matsumoto, 1999) and molecular dynamic (Arya et al., 2003) models have been proposed for their description. There have also been suggestions for describing the slip flow and transition regimes using N–S equations with modified boundary conditions and first-order, 1.5-order, and second-order slip boundary conditions (Maxwell, 1879; Mitsuya, 1993). The pore size of the source rocks of coal measures range from nanometers to micrometers, while the fracture apertures range from micrometers to millimeters. Hence, the gas flow through the matrix may comprise various flow regimes in pores/fractures of differing scales (Javadpour, 2009). Several models have been presented to explain gas flow on a nanoscale. Examples are Klinkenberg’s model, which is only valid for the slip flow and continuum regimes (Klinkenberg, 1941); Beskok and Karniadakis’ model, which can be used to describe various flow regimes for Kn < 1 (Beskok and Karniadakis, 1999); and Javadpour’s model, which linearly combines the slip flow and free molecular regimes (Javadpour, 2009). Few previous studies have undertaken the modeling of all the flow regimes in pores/fractures of differing scales (full scales) and considering dynamic reservoir properties (Anderson et al., 2014; Javadpour, 2009; Song et al., 2016). More research effort is thus required to bridge the knowledge gap in this area. This paper presents a gas flow model that comprehensively considers the various flow regimes in pores/fractures of differing scales under the effects of the pore structures and permeability characteristics. This is aimed at establishing the coupling accumulation mechanism of the Three Coal Gases.
Samples and experimental methods
Samples
The coalbed and organic-rich shale of the marine–continental strata deposited in the Carboniferous–Permian are well-overlapped extensions with the same degree of thermal evolution (Zhu et al., 2016). Previous explorations have found that the Taiyuan and Shanxi formations are favorable reservoirs for hydrocarbon generation and enrichment (Cao et al., 2014; Zhu et al., 2016). The maturity grades of the source rocks significantly impact the pore structures and permeability characteristics. In the present study, samples with nearly the same maturity grades were collected from the HS well in the Qinshui Basin (Figure 1). Regional transgression occurred in the Taiyuan formation sedimentary period of the late Carboniferous. There were alternating subsidences, which led to the deposition of the marine–continental strata including sandstone, mudstone/shale, siltstone, limestone, and coalbed with a cyclic sedimentary structure (Shao et al., 2008). There was subsequent regional regression in the Shanxi formation sedimentary period of the early Permian, resulting in the deposition of a marine delta strata and fluvial–lacustrine strata (Shao et al., 2008).
Locations of the source rocks of the analyzed samples.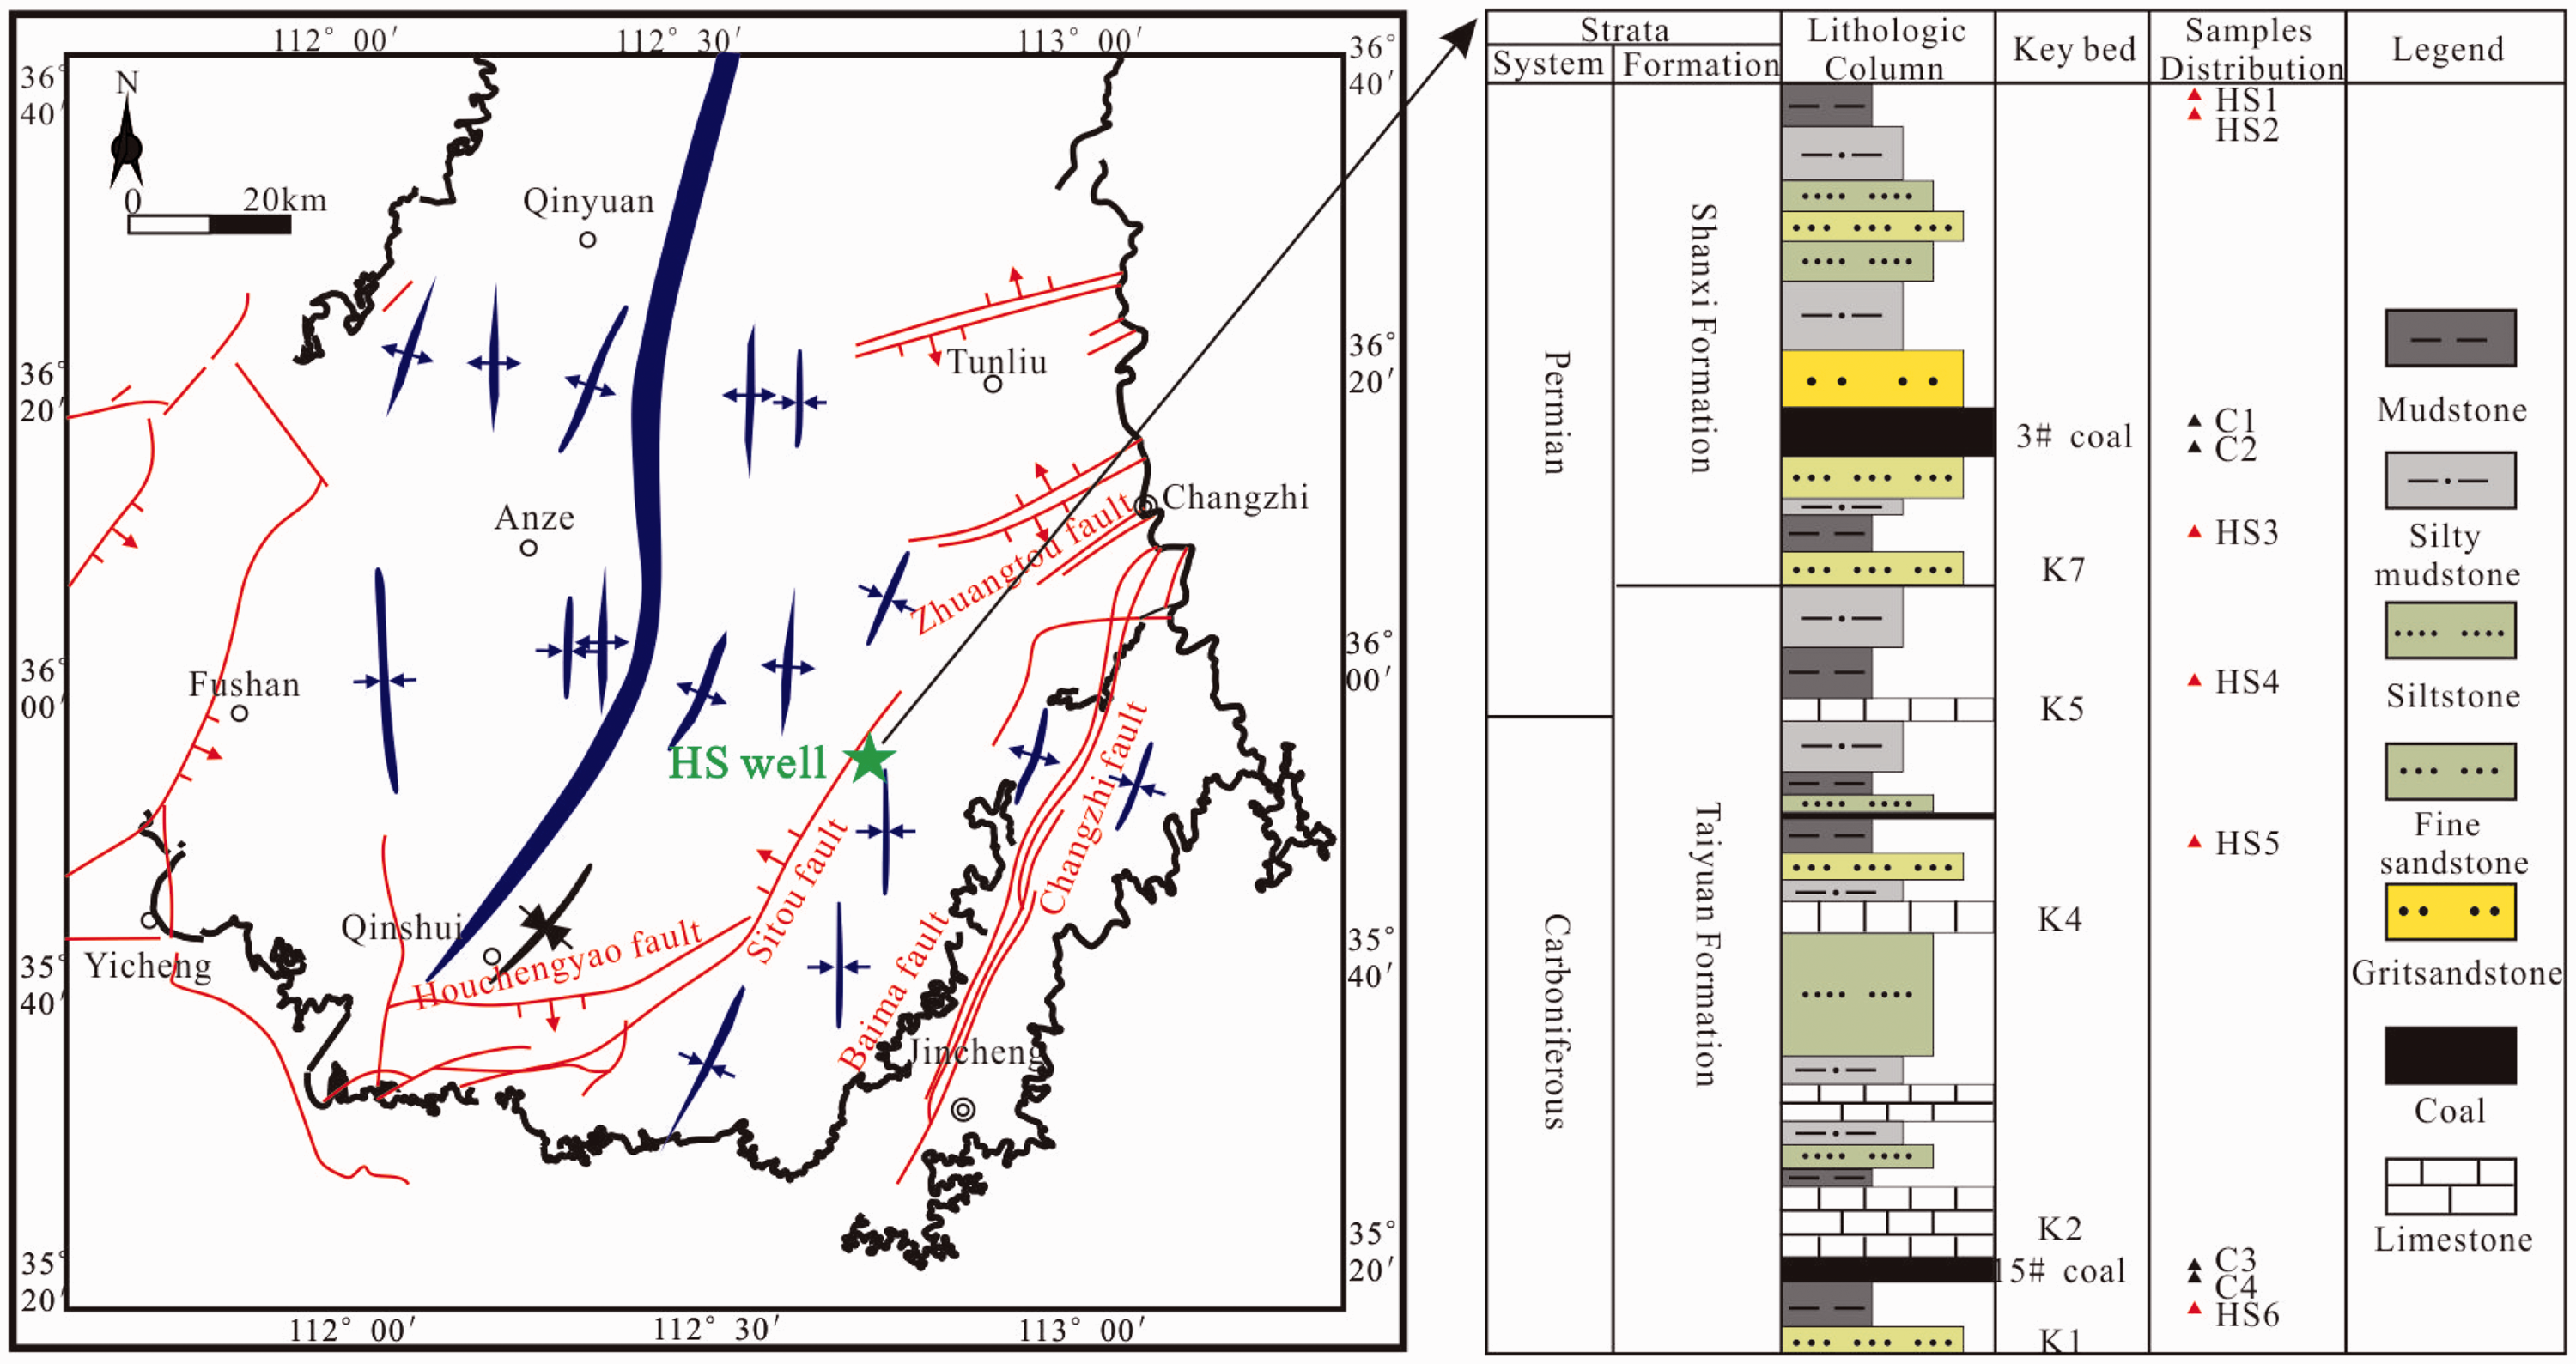
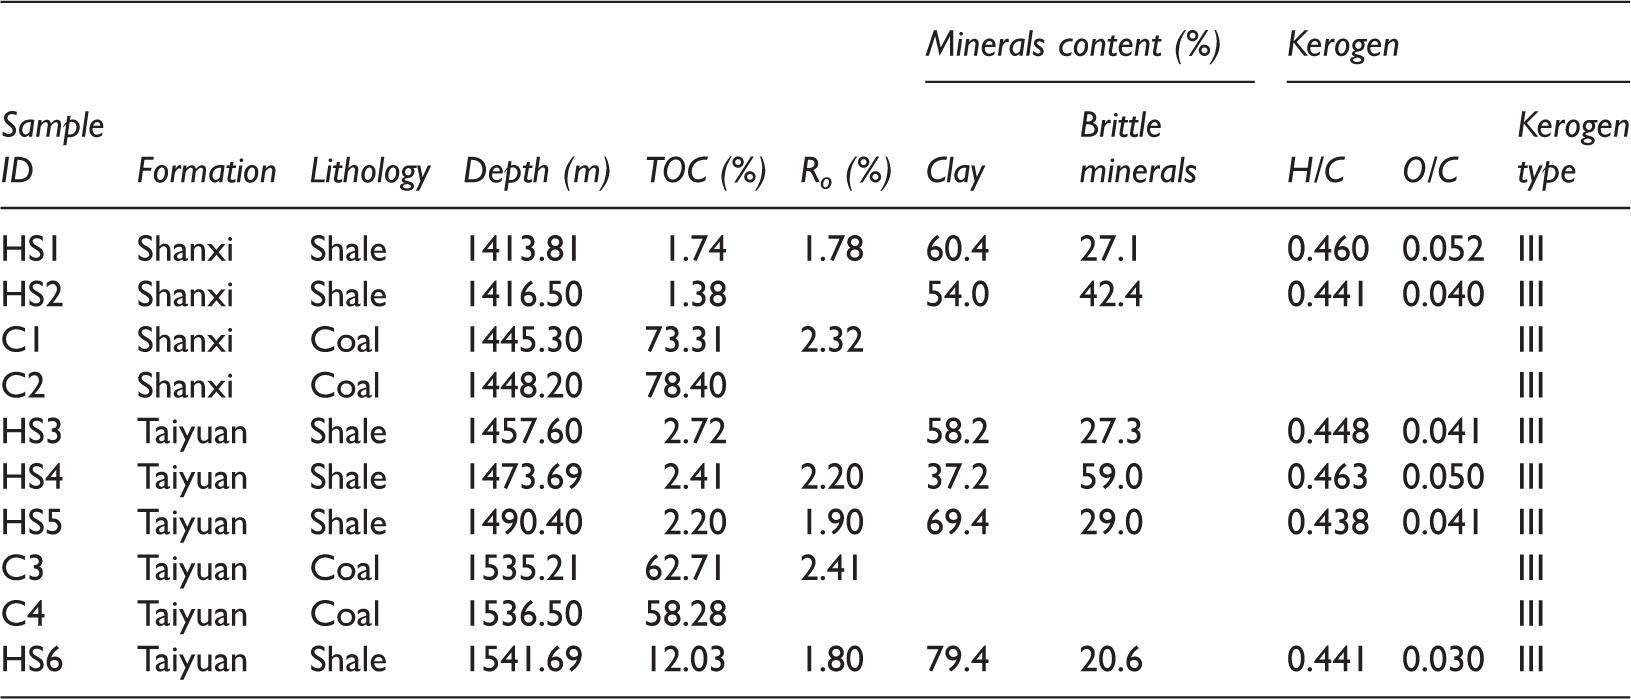
Samples and their properties.
Experimental protocol
The field-emission scanning electron microscopy (FE-SEM) investigation was performed at the China University of Petroleum, Beijing. A combination of a Quanta 200F FE-SEM instrument and an energy-dispersive spectrometer (EDS) was employed for the process (Wang et al., 2014), which was used to determine the mineral composition and the pore features of the samples. The FE-SEM samples were prepared by Ar-ion milling and spraying with gold to enhance their conductivity. Secondary electron and backscattered electron images were used to obtain important qualitative information about the general locations of the pores in the samples. The FE-SEM was performed using a resolution of 20 nm, and magnifications of 25–200,000. The investigations were conducted at a temperature of 24℃ and humidity of 35%.
The high-pressure mercury intrusion (HPMI) experiment was performed in the Key Laboratory of Coalbed Methane Resources and Reservoir Formation Process, Ministry of Education, China University of Mining and Technology. An AutoPore IV 9500 (Wang et al., 2014) with a maximum applied pressure of 60,000 psi (413 MPa) was used to determine the porosity, pore volume, and pore size distribution of the samples. The instrument can be used to measure pores of sizes between 3 nm and 100 µm. The samples used for the HPMI experiment were processed into bulks of about 1 cm3. Before the experiment, the samples were dried for 12 h at 70–80℃. During the experiment, the pressure was increased from 0.01 to 413 MPa in the mercury intrusion phase and then gradually decreased in the mercury ejection phase.
In addition, a low-pressure nitrogen gas adsorption (N2GA) analysis was conducted at the School of Chemical and Technology, China University of Mining and Technology. A Quantachrome Autosorb-1 was used (Wang et al., 2015) to determine the pore volume, surface area, and pore size distribution characteristics of the samples. The employed samples were crushed by a 60 mesh and dried for 8 h at 70℃ to remove the absorbed moisture and other volatiles. Degassed samples weighing 1–2 g were used for the serial experiments, which were performed at different gas adsorption levels in a nitrogen atmosphere at 77.3 K. The acquired surface area data were interpreted by the multipoint Brunauer–Emmett–Teller (BET) theory, while the characteristics of the pore size distribution were analyzed by discrete Fourier transform. The values of the relative balance pressure (p/p0) during the experiments were generally considered to be within 0.001–0.998.
The pressure pulse decay permeability experiment was performed at the Key Laboratory of Coalbed Methane Resources and Reservoir Formation Process, Ministry of Education, China University of Mining and Technology. A CoreLab/Temco PDP-200 (Zhang et al., 2016) was used to determine the absolute permeability with respect to the confining pressures for a given inlet pressure. The employed samples were first processed into lithologic columns of diameter 2.5 cm and length 5.0 cm, with the top and bottom surfaces polished to obtain parallel ends. The samples were then preserved in the experimental instrument. The permeability data of the samples were obtained under a constant inlet pressure of 600 psi (4.13 MPa), with the confining pressure increased from 800 psi (5.5 MPa) to 3600 psi (24.8 MPa) in the pressurization stage and then gradually decreased back to 800 psi (5.5 MPa). Each pressure point was maintained for more than 30 min. The analysis of the experimental results was basically based on Darcy’s law.
Results and discussion
Characteristics of pore structures and permeability
Qualitative description of pore morphology
Many researchers have investigated the characteristics of the pore structures of coal and shale through various techniques such as FE-SEM, TEM, and FIB-SEM (Gan et al., 1972; Slatt and O’Brien, 2011; Zhang, 2001). In the present study, a pore classification of the source rocks was undertaken using the scheme of Loucks et al. (2012), who identified three types of pores, namely organic matter pores, interparticle pores, and intraparticle pores. To better characterize the gas flow mechanisms, the pore size classification of the International Union of Pure and Applied Chemistry was used; the three classes are micropores (diameter < 2 nm), mesopores (2 nm < diameter < 50 nm), and macropores (diameter > 50 nm).
The combination of FE-SEM and EDS was suitable for determining the pore features of the coal and shale samples. The SEM images and material information indicated that the primary and secondary pores in the coal and shale were well developed. The organic matter pores were observed to be nanoscale pores with sizes generally ranging between 5 and 100 nm. They contained well-developed organic matter (especially the coal samples) and organic clay complexes, and their distribution was either dispersed or aggregated (Figure 2(a) and (j)). Their shapes were also diverse, including circular, ellipse, lenticular, and strip (Figure 2(a), (f), and (j)). Such well-developed organic matter pores with micropores that have a strong adsorption capacity are important for the storage of hydrocarbons (Wang et al., 2014).
Pore types of the coal and shale samples.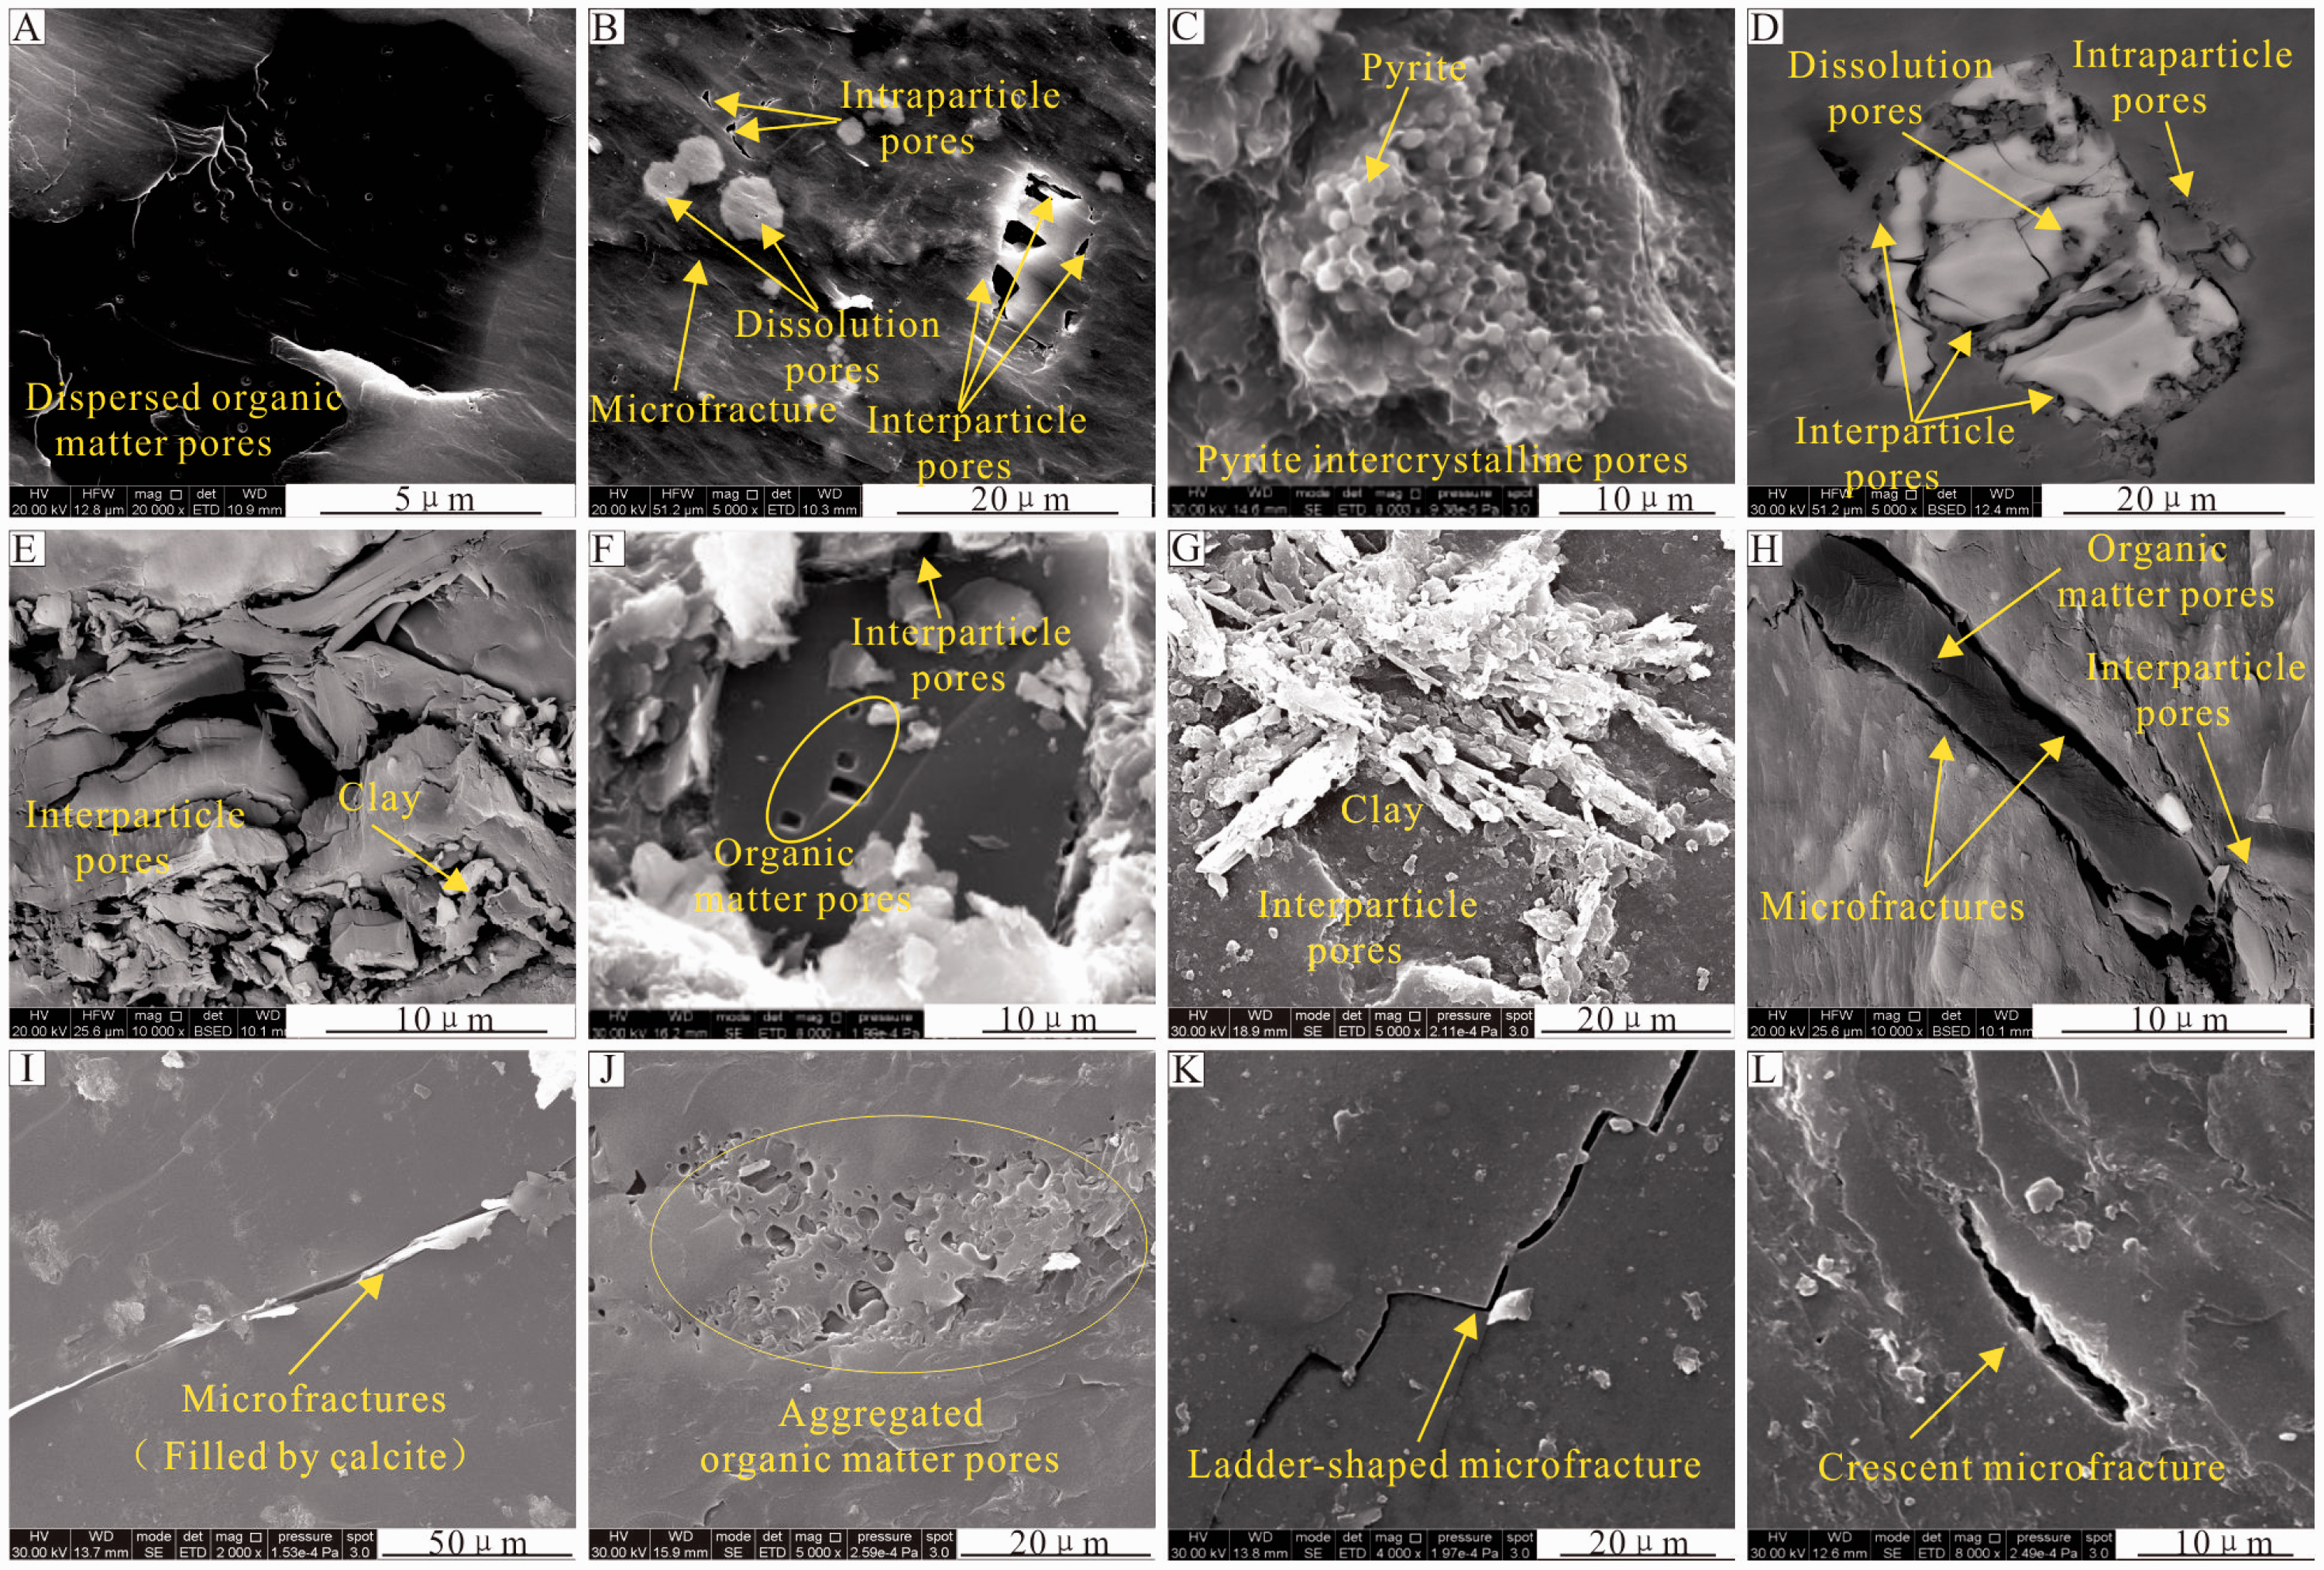
Some interparticle pores were also observed in the clay mineral aggregates and between the clay minerals, especially in the shale samples, which contained large amounts of clay minerals. The interparticle pores had different shapes such as elongated and polygonal (Figure 2(d), (e), and (g)) and were generally larger than 100 nm, which makes them capable of significantly impacting hydrocarbon storage. The dissolution pores formed by the dissolution of unstable minerals during diagenesis were also observed to be well developed (Figure 2(b)).
In contrast to the interparticle pores and organic matter pores, the intraparticle pores were found to be typically widely distributed in the clay layers (Figure 2(b) and (d)), with their sizes generally ranging between 50 and 200 nm. Conversely, the microfractures measured 2–400 µm long and 20–400 nm wide and were mostly observed on the edges of the mineral components (Figure 2(b) and (d)) and within the macerals and organic matter (Figure 2(i), (k), and (l)) of the samples. The microfractures developed with various shapes such as strip, crescent, and zigzag (Figure 2(i) and (k)). They are commonly considered to be the channels connecting the micropores and fractures, greatly improving the permeability and serving as storage space for free gases. Moreover, these pores and fractures may significantly enhance the exploitation of unconventional gas in coal measures (Jing et al., 2016).
Quantitative analyses of pores structure
Structural pore parameters of shale and coal.
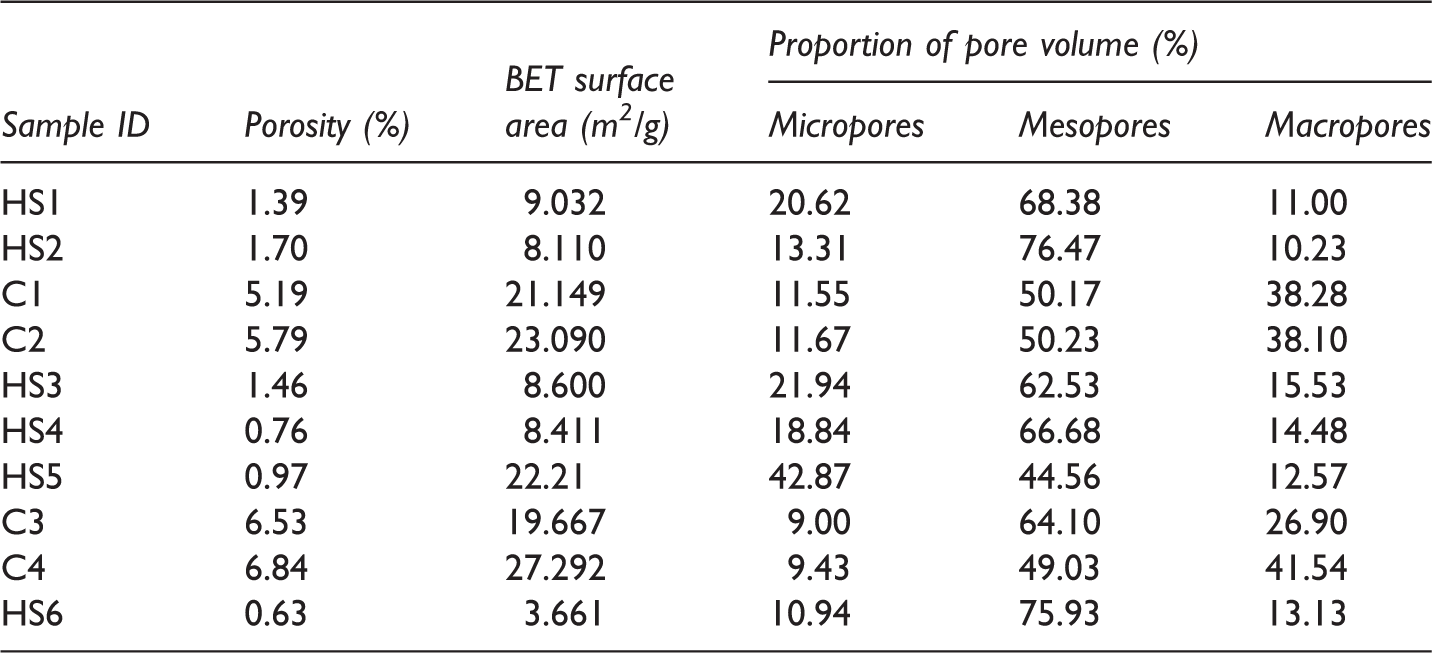
BET: Brunauer–Emmett–Teller
To further investigate the pore structures of the coal and shale samples, the pore size distributions of the coal and shale samples were characterized using the results of the HPMI and N2GA analyses, as recommended by Wang et al. (2014). The mesoporosity (pore diameters of 30–50 nm) and macroporosity (pore diameter > 50 nm) were characterized by HPMI analysis, while the mesoporosity (2 nm < pore diameter < 30 nm) and microporosity (pore diameter < 2 nm) were characterized using the N2GA results.
The experimental results showed that the pore sizes of the shale samples were bimodally distributed with peaks within the size ranges of the micropores (0.6–2 nm) and mesopores (3–50 nm). The pores in the shale samples were mostly mesopores (Figure 3), which accounted for 44.56–76.47% of the volume of the samples, with an average value of 65.76%. The micropores were also well developed in the shale samples, accounting for 10.94–42.87% of the volume of the samples, with an average value of 21.42% (see Table 2). Conversely, the pore sizes of the coal samples were unimodally distributed, with a peak within the range of the large micropores and the mesopores (1–50 nm) (Figure 3). The mesopores and macropores were also well developed in the coal samples (see Table 2).
Pore size distributions of shale (left) and coal (right).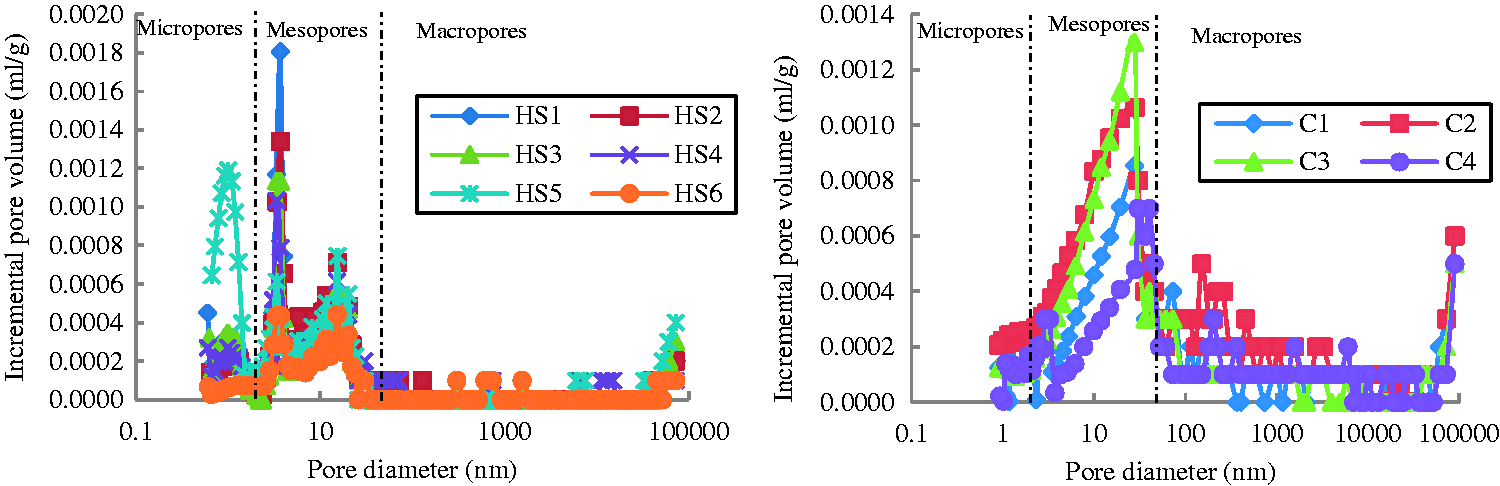
Permeability anisotropy
The results of the pressure pulse decay permeability experiments show that the permeabilities of the coal samples were larger than those of the shale samples, with the respective values being 0.22–4.18 mD (average value of 2.07 mD) and 0.0053–0.049 mD (average value of 0.022 mD) (Figure 4). The permeabilities of both the coal and shale samples exhibited significant anisotropy. The face cleats and butt cleats (fractures) of the coal samples were well developed, accounting for a major part of the permeability to gas flow, and were mutually orthogonal and perpendicular to the bedding. They also caused the coal permeability in the direction perpendicular to the bedding to be larger than that in the direction parallel to the bedding, the values of the former in the different samples being 4.5–15.6 times those of the latter. In addition, there were significant beddings with joint failure in the shale samples, and this significantly contributed to the permeability with the shale permeability in the direction parallel to the bedding being larger than that in the direction perpendicular to the bedding, the values of the former in the different samples were 2.6–5.6 times those of the latter.
Permeability anisotropies of coal and shale.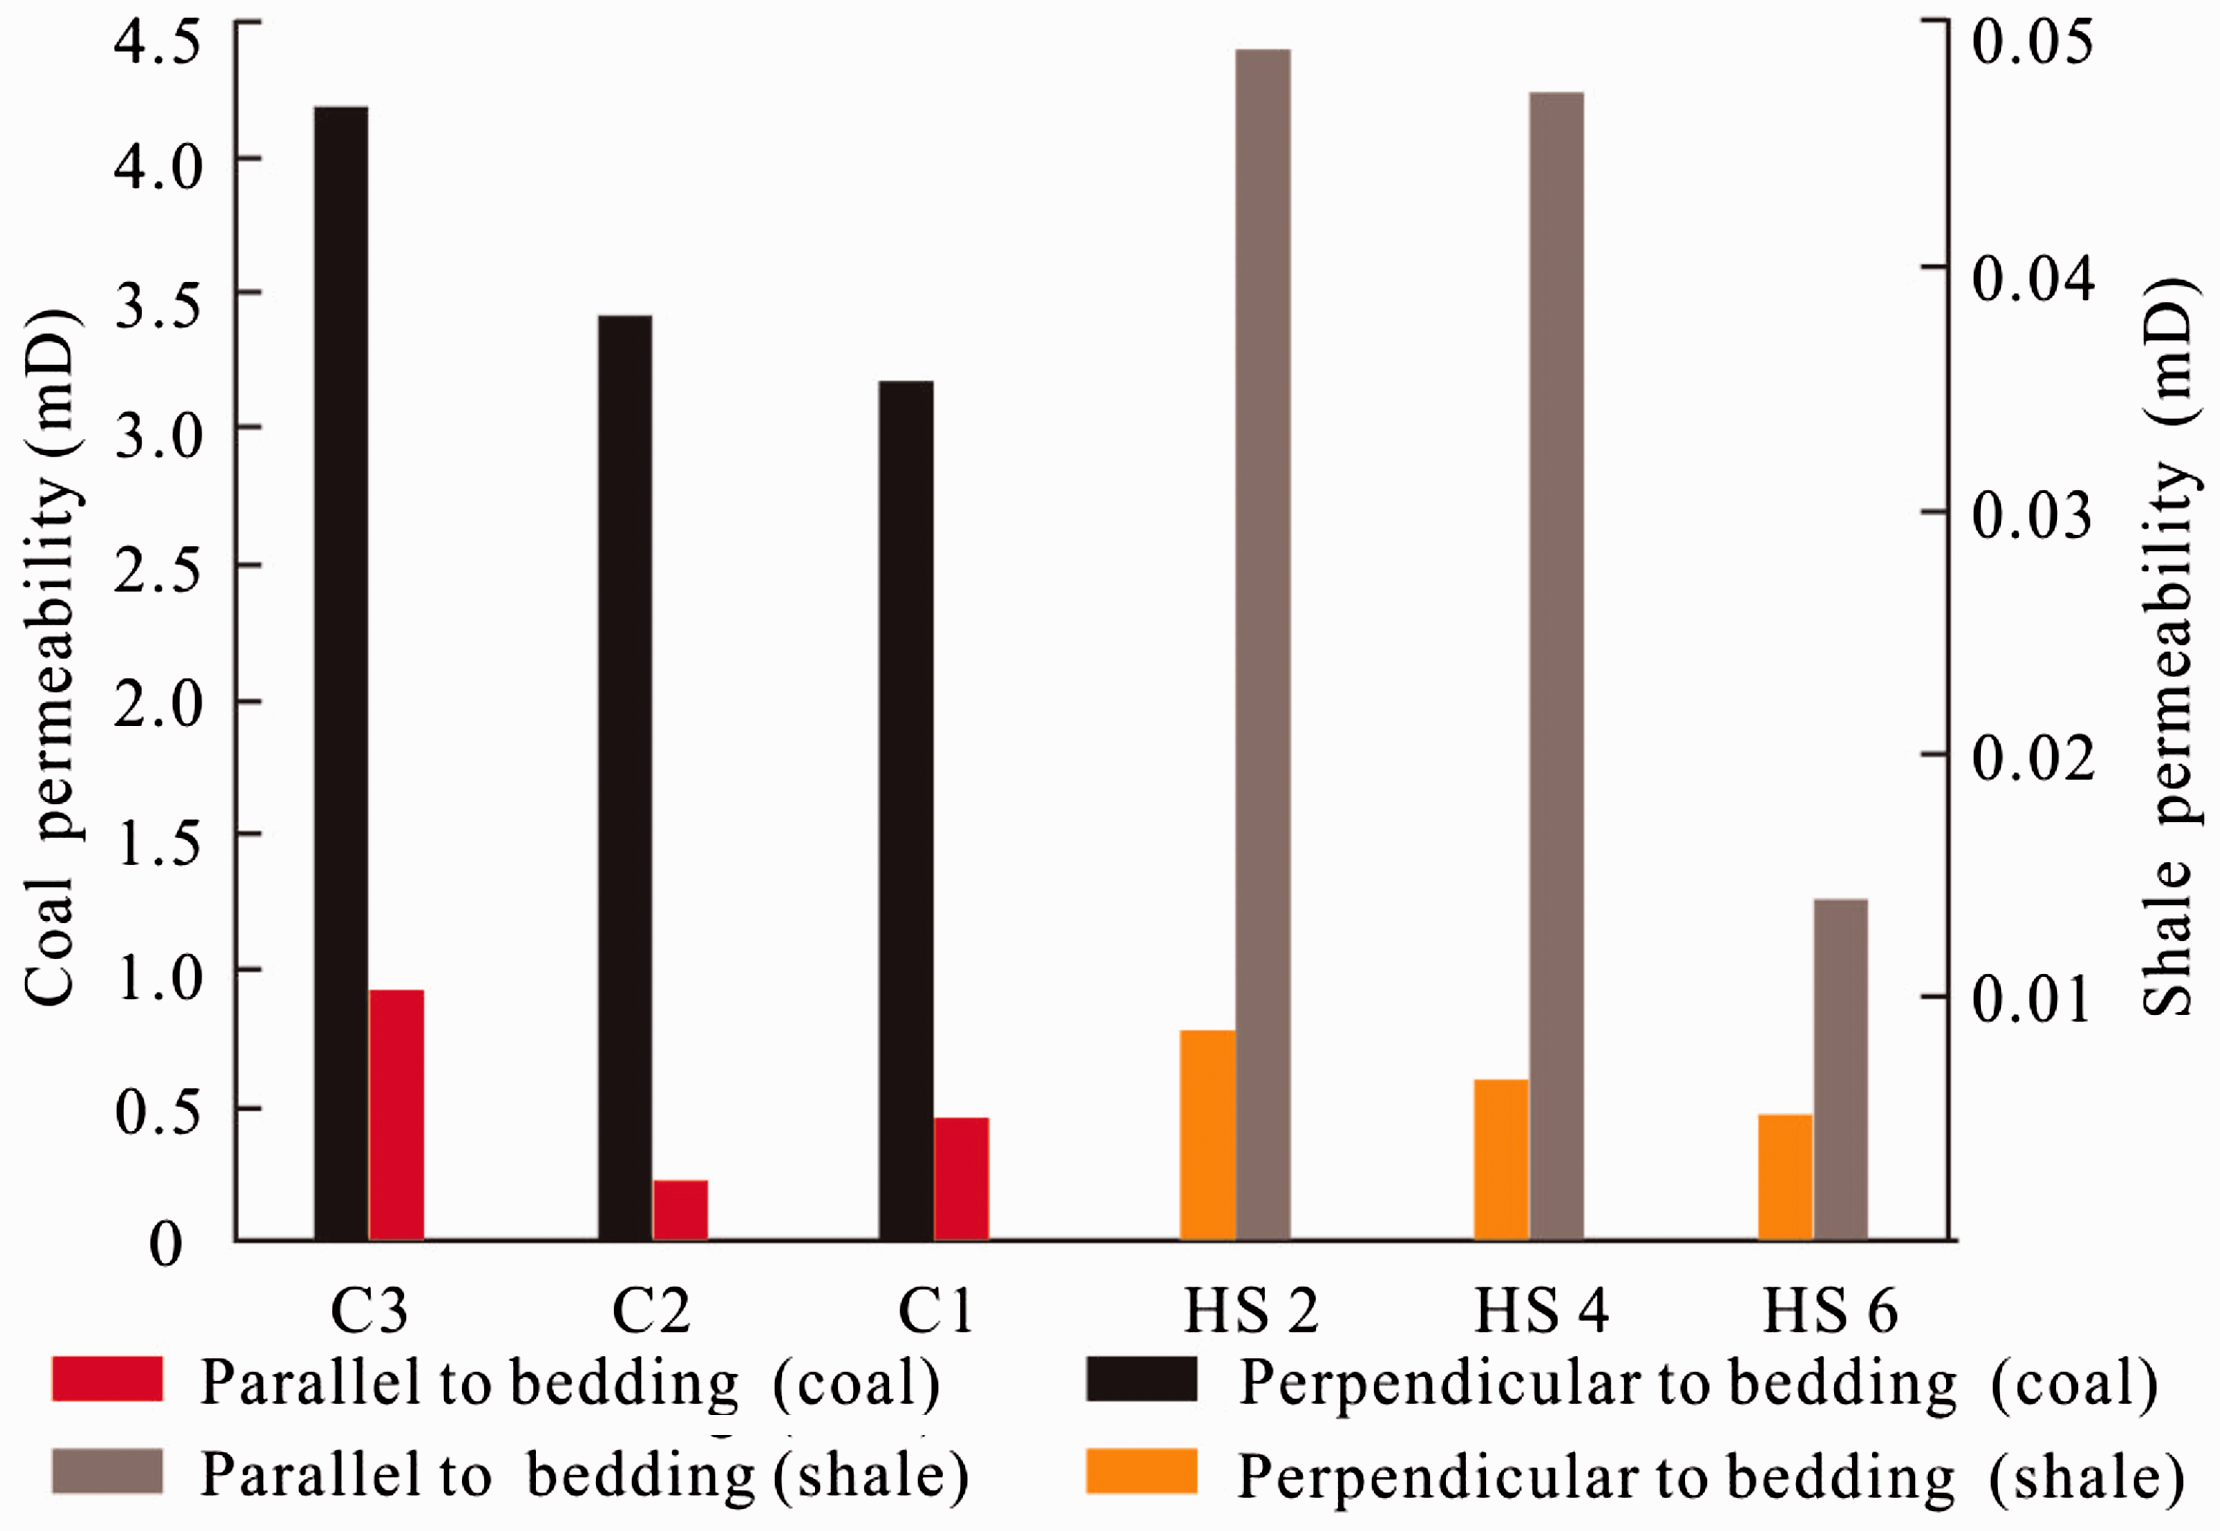
Stress sensitivity of permeability
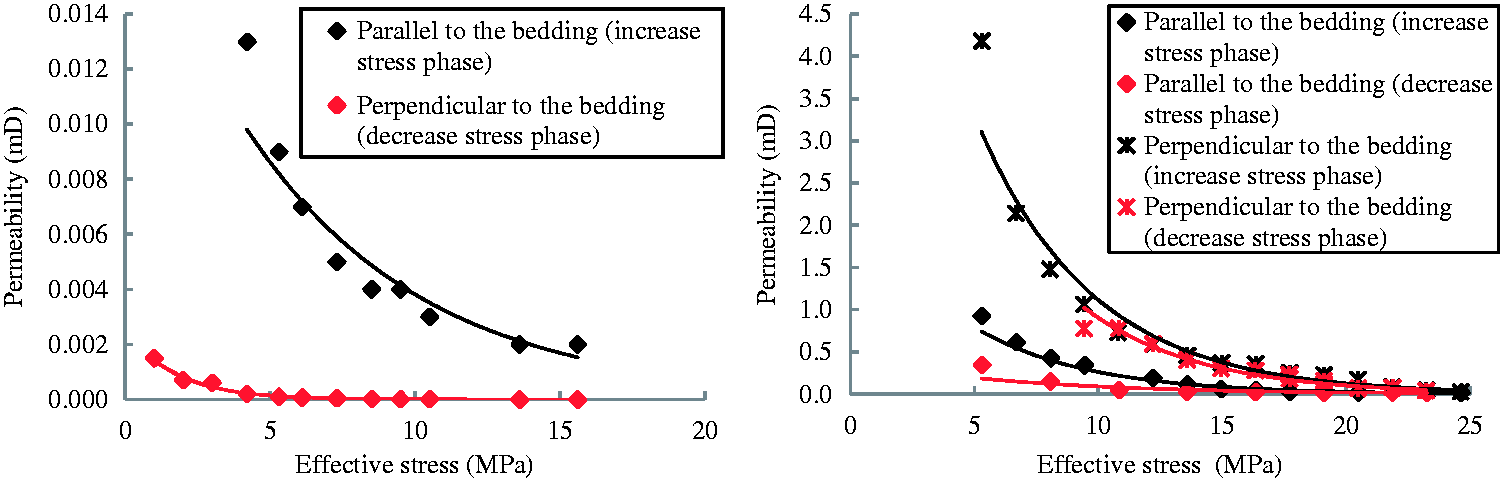
Many factors affect the permeabilities of coal and shale, such as temperature, stress condition, and water saturation, with the stress condition having the most significant effect (Kumar et al., 2016; Marte et al., 2015; Pan et al., 2015). The results of the pressure pulse decay permeability experiments reveal some clear features, as shown in Figure 5. As can be observed, the permeabilities of coal and shale samples are highly stress dependent (Li et al, 2016), exponentially decreasing with increasing effective stress. Further, the degree of permeability reduction of coal under stress is higher than that of shale. In addition, the impact on the permeability of a given change in effective stress in the direction parallel to the bedding was different from that of the same change in effective stress in the direction perpendicular to the bedding. Several previous studies (Hou et al., 2016; Meng et al., 2010) have found that the reservoir pressure, temperature, and effective stress linearly increase with increasing reservoir depth. Further, we determined the relationship between the permeability and the reservoir depth
Stress sensitivities of the permeabilities of shale (left) and coal (right).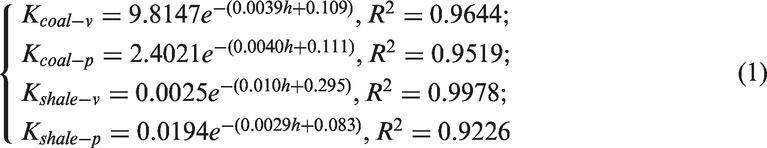
Model of gas flow mechanism
Knudsen number and flow regimes
Various flow regimes such as continuum, slip flow, transition, and free molecule regimes were identified in shale and coal based on the Knudsen number Kn, which is defined as (Beskok and Karniadakis, 1999)

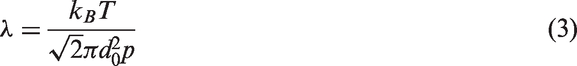
The classification of the various flow regimes observed in the porous media was based on the following criteria (Freeman et al., 2011; Kast and Hohenthanner, 2000; Liu et al., 2012): slip flow regime: 0.01 < Kn < 0.1, free molecular (Knudsen diffusion) regime: Kn > 10, transition regime: 0.1 < Kn < 10, and continuum (Darcy flow) regime: Kn < 0.01.
The depth of the source rocks of the coal measures in the Qinshui Basin is between 0 and 3000 m, with the reservoir pressure linearly increasing with increasing reservoir depth (Hou et al., 2016; Meng et al., 2010). Based on the relationship between the reservoir pressure and the reservoir depth in the Qinshui Basin, the variation of the Knudsen number with the reservoir depth with respect to the pore and fracture scales was derived (see Figure 6). Under geological conditions, the slip flow regime was mainly observed in the small macropores (50 nm < diameter < 1000 nm), the transition regime was mainly observed in the micropores and mesopores, the continuum regime was mainly observed in the large macropores (1000 nm < diameter) and fractures, while the free molecular regime was only significant in the micropores at low pressures.
Variation of Kn with the reservoir depth.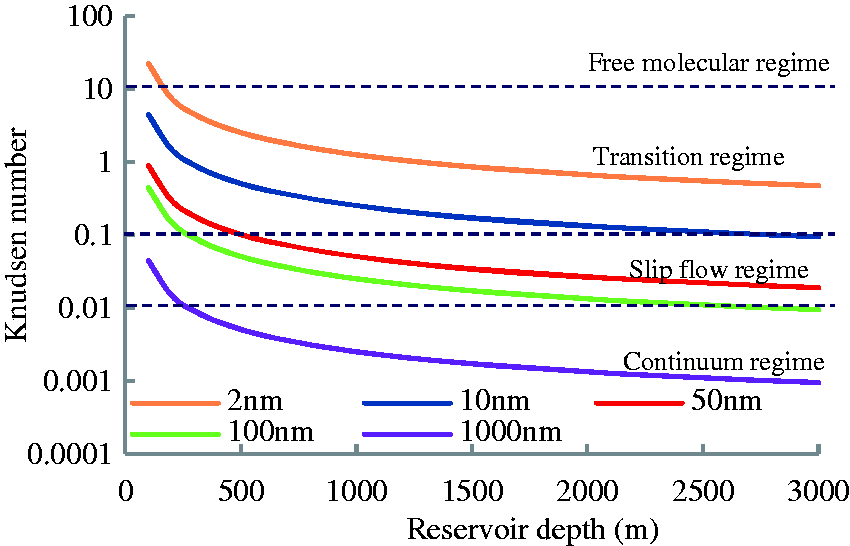
Mass flux
Beskok and Karniadakis (1999) derived a unified Hagen–Poiseuille-type equation of the volumetric gas flow qs through a single pipe, as follows

Beskok and Karniadakis (1999) also presented the following correlation


Beskok and Karniadakis (1999) submitted that α = 0 and b = −1 in the slip flow regime, based on which equation (6) becomes

Further, the tortuosity factor τ of porous media is defined as (Civan, 2010)
Slip flow regime
For slip flow, α = 0 and b = −1, and the volumetric flux is thus given by (Beskok and Karniadakis, 1999)

For an ideal gas, Free molecular regime
In the free molecular regime (K
n
> 10), the intermolecular collisions are negligible compared to the collisions between the gas molecules and wall surfaces. Whereas the Hagen–Poiseuille-type equation can be applied to various flow regimes, the empirical coefficients may cause large deviations when applied to the free molecular regime. The Knudsen diffusion equations more reasonably describe the free molecular regime (Beskok and Karniadakis, 1999). Based on the porosity ϕ and tortuosity factor τ, the Knudsen diffusion coefficient is given by (Javadpour, 2009)
The mass flux in the free molecular regime is defined as (Javadpour, 2009)
Transition regime
In the transition regime, both slip flow and free molecular flow may occur. It is the flow regime in which the traditional fluid dynamics equations begin to fail, with the chance of failure increasing with increasing Knudsen number. Although conventional equations may be applied to the regime (i.e. Darcy’s law with Knudsen correction and a Hagen–Poiseuille-type equation), the validity of such formulations with empirical coefficients is questionable. It is safer to apply Knudsen’s diffusion equations, especially for flows with higher Knudsen numbers (close to 10) (Ziarani and Aguilera, 2012). The mass flux in this regime is thus defined as (Ziarani and Aguilera, 2012)
Continuum regime
The application of Darcy’s law to the viscous gas flow in the continuum regime (Kn < 0.01) is more reasonable (Kast and Hohenthanner, 2000; Miguel and Serrenho, 2007; Ziarani and Aguilera, 2012). The law is expressed as (Song et al., 2016; Ye et al., 2015)

Comprehensive gas flow model
Model establishment
The above analysis shows that various flow regimes occur in the pores and fractures of the source rocks, with the transition and slip flow regimes being the main ones (Ziarani and Aguilera, 2012). In this study, the pores were assumed to be spherical, with S1, S2, and S3 denoting the cross-sectional areas of the micropores, mesopores, and small macropores (50 nm < diameter < 1000 nm) and V1, V2, and V3 denoting the pore volume proportions of the micropores, mesopores, and small macropores (50 nm < diameter < 1000 nm), respectively. The following was thus obtained

Considering the various flow regimes, the comprehensive model of the total mass flux in the source rock of coal measures can be expressed as
2. Model validation
Most of the previously proposed models of the gas flux in the source rocks focused on the nanoscale flow, with only few considering all the flow regimes in the pores/fractures of differing scales. Song et al. (2016) used Fick’s law and Darcy’s law to establish a comprehensive model of the gas flow in a shale matrix, taking diffusion, percolation, and slippage into consideration. Javadpour (2009) also used the Knudsen diffusion equations and Darcy’s law to establish a comprehensive model of the gas flow in a shale matrix, with the assumption that the mass flux in the matrix is induced by a combination of the Knudsen diffusion and pressure forces. These models, which were developed for the quantitative evaluation of the flux in full-scale pores/fractures, were used to validate the presently proposed model by comparison of the respective results. As can be observed from Figure 7, the mass fluxes calculated by the present and previous models are in good agreement, verifying the reliability of the present model for evaluating gas flows through shale and coal.
Comparison of the results of the present model and the previously proposed models.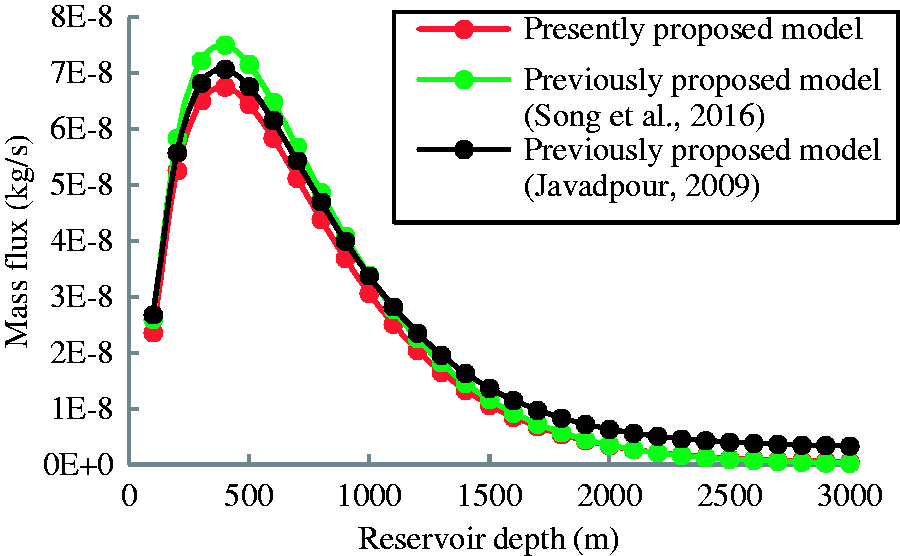
Application of comprehensive gas flow model
Mass fluxes in various flow regimes
Model parameters.
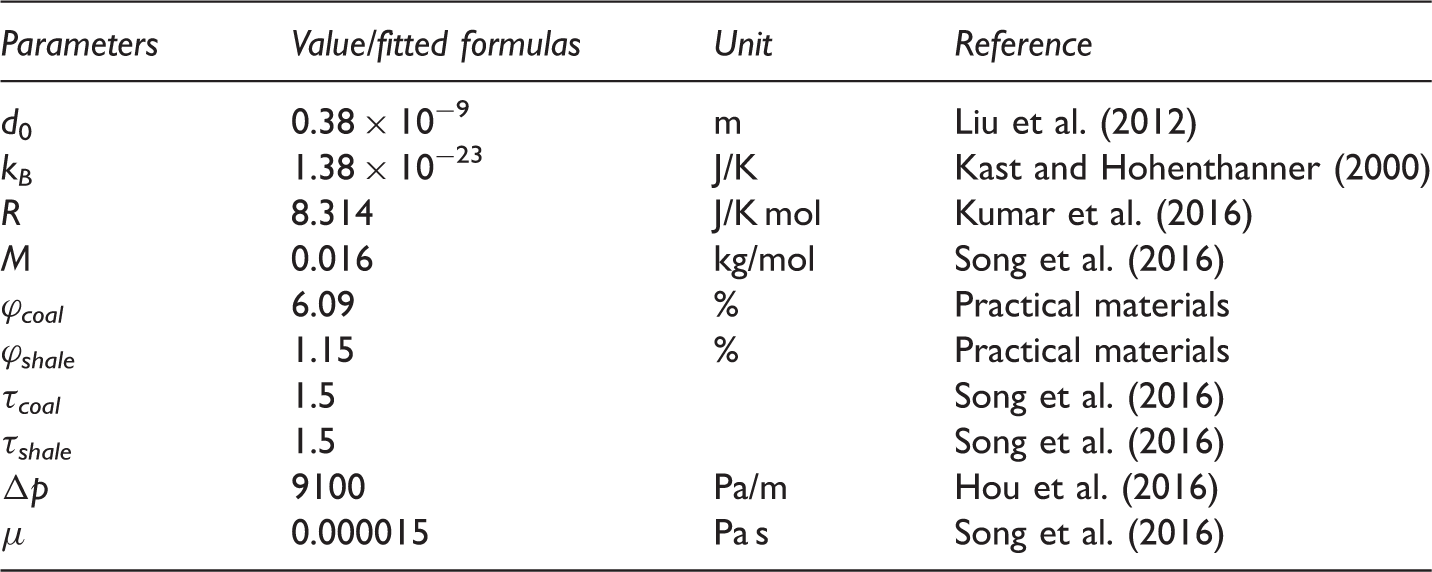
Figure 8 shows that, in both the free molecular and transition regimes, the mass flux decreases with increasing reservoir depth, while it increases significantly in the slip flow regime. The mass flux in the continuum regime was observed to be unimodally distributed with respect to the reservoir depth, with the peak flux occurring at a depth of 300 m. The reservoir pressure also increased with increasing reservoir depth, indicating that the driving force of the gas flow increased and was more beneficial to gas flow (“positive effect”). Conversely, the closure of the fractures and pores by the increased squeeze at greater depths attenuated the matrix permeability (“negative effect”). At depths of <300 m, the positive effect had greater effect on the continuum regime than the negative effect, while the reverse was the case at depths of >300 m. Hence, the mass flux decreased with increasing reservoir depth (Figure 9).
Mass fluxes in the free molecular, slip flow, and transition regimes in coal (left) and shale (right). Mass fluxes in the continuum regime in coal (left) and shale (right).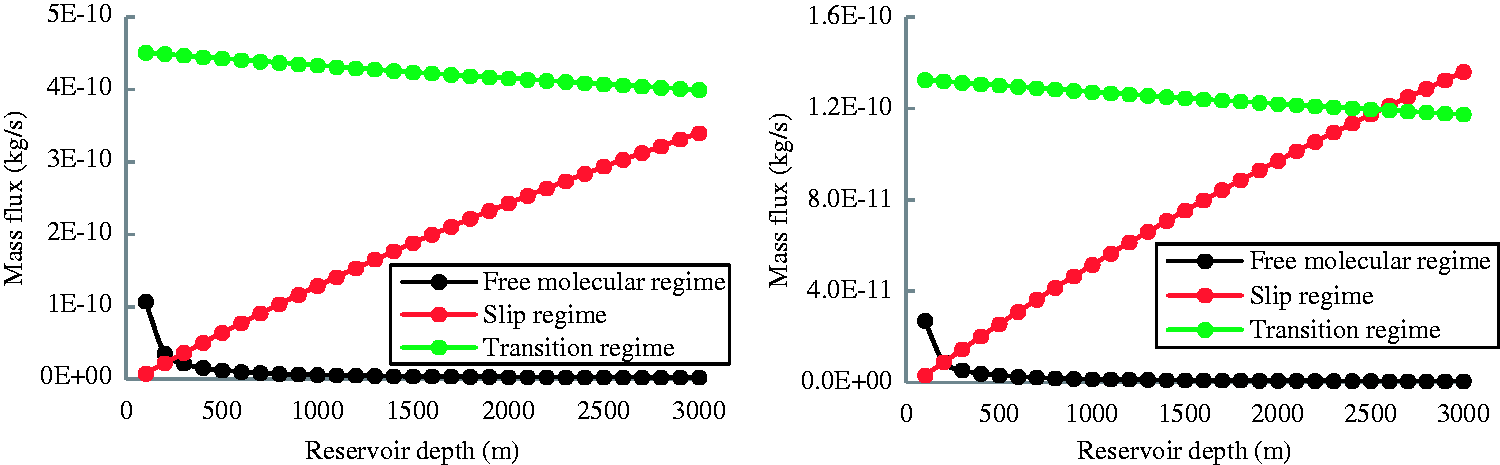
Mass flux heterogeneity
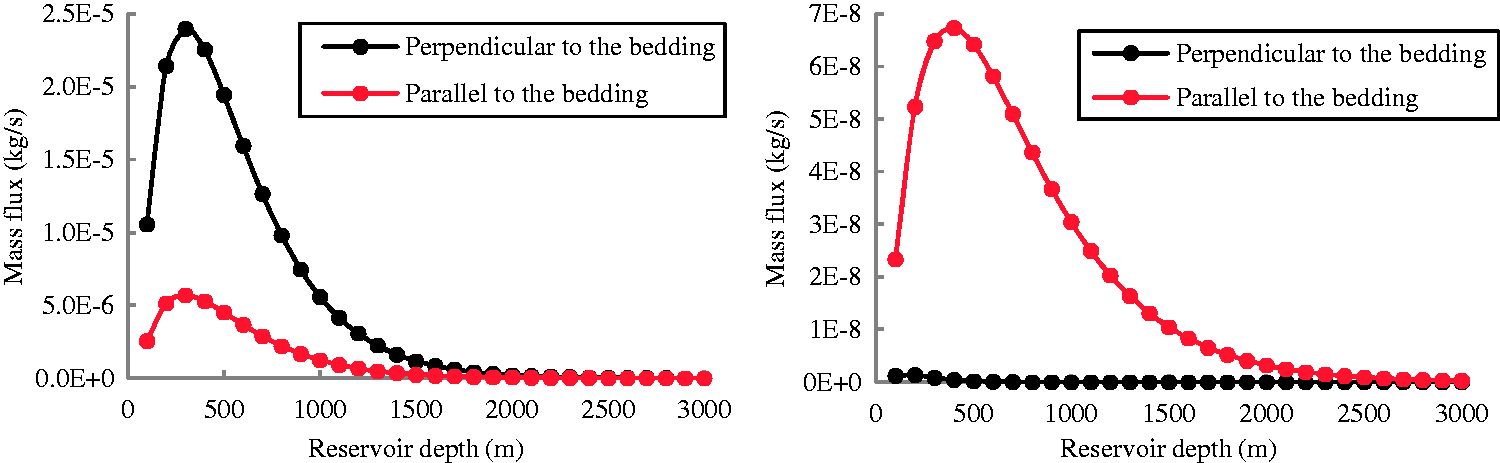
The relationships between the total mass flux and the reservoir depth for coal and shale are shown in Figure 10. The total mass flux can be observed to be significantly anisotropic in both cases. For coal, the total mass flux in the direction perpendicular to the bedding at a given reservoir depth is higher than that in the direction parallel to the bedding. This is attributable to the well-developed fractures in the perpendicular direction and the consequent higher permeability. However, for shale, the total mass flux in the direction parallel to the bedding is higher than that in the direction perpendicular to the bedding. In addition, in contrast to coal, the shale beddings with joint failure were well developed owing to the more effective permeability resulting from the fact that the shale permeability in the direction parallel to the bedding is larger than that in the direction perpendicular to the bedding. Concisely, the observed heterogeneity of the total mass flux in both coal and shale is attributable to the permeability anisotropy.
Total mass fluxes in coal (left) and shale (right).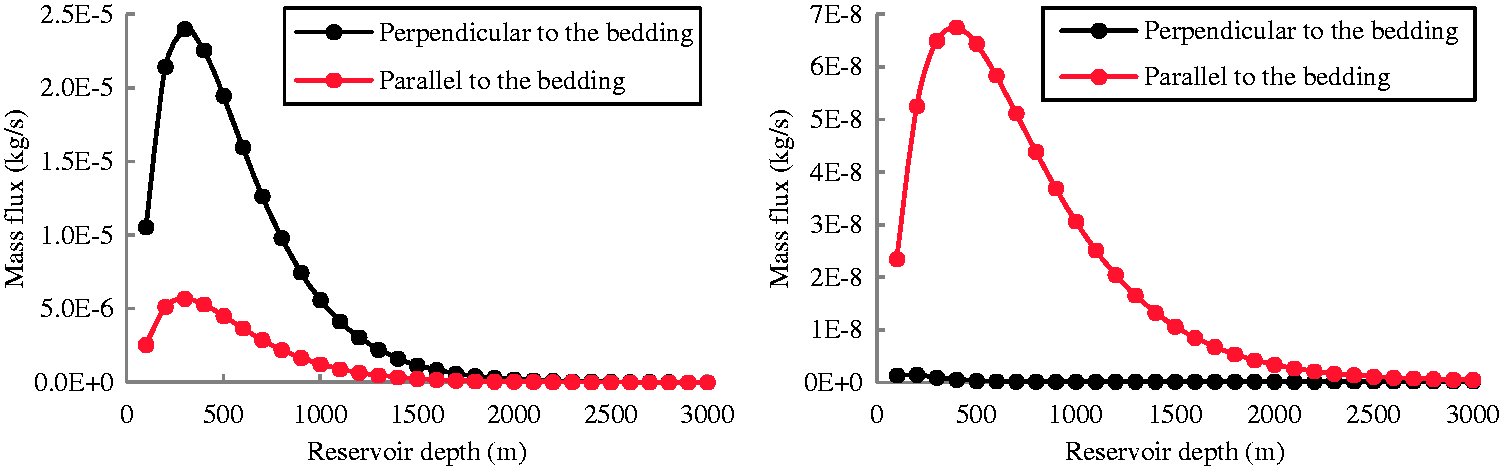
In the case of coal, in both the directions perpendicular and parallel to the bedding, the mass flux in the continuum regime was dominant, accounting for >50% of the total mass flux (Figure 11). In the case of shale, the mass flux in the continuum regime was dominant in the direction parallel to the bedding, accounting for >50% of the total mass flux in that direction. The corresponding mass flux in the direction perpendicular to the bedding decreased with increasing reservoir depth, with slip flow gradually becoming more dominant.
Proportions of the mass fluxes in the continuum regime in coal (left) and shale (right).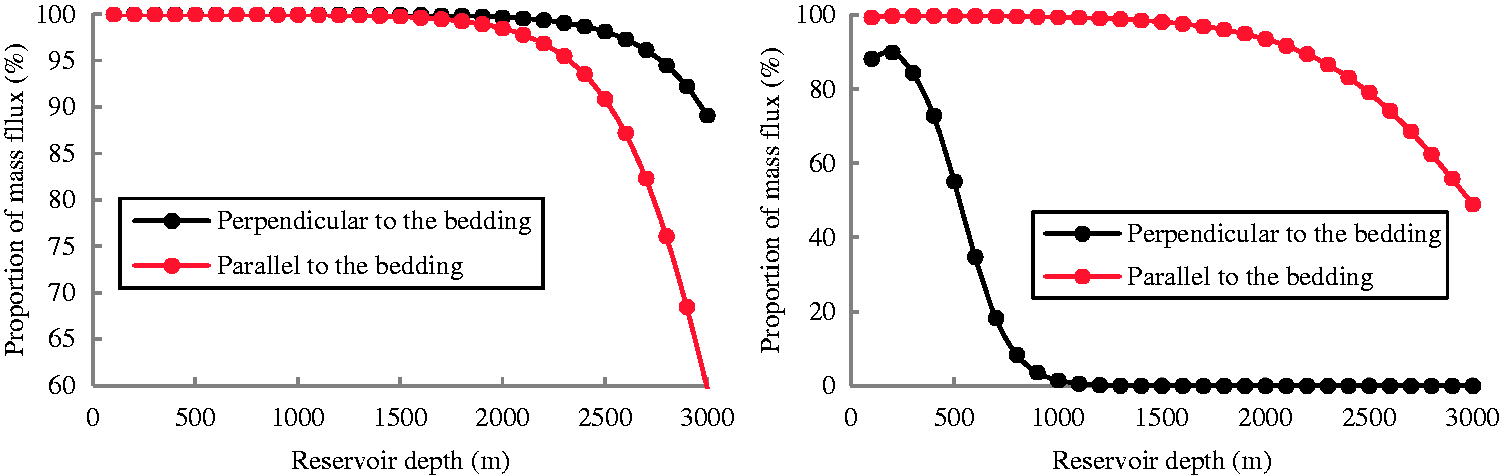
Conclusions
FE-SEM, HPMI, and N2GA were used to determine the pore structures of the source rocks of coal measures in the Qinshui Basin. The pressure pulse decay permeability technique was used to estimate the stress sensitivity of the permeability of the samples, and a comprehensive model of the gas flow through the pores/fractures of differing scales under the effects of the pore structure and permeability characteristics was developed. Based on the findings of the study, the following conclusions are drawn:
The pores in coal and shale are generally nanoscopic, with their sizes varying between several and several hundred nanometers. The organic matter pores are well developed in both materials. The total porosity of shale ranges between 0.63 and 1.70%, with mesopores dominating, resulting in an average porosity of the investigated shale samples of 65.76%. Coal has a total porosity ranging between 5.19 and 6.84%, with well-developed mesopores and macropores. The permeabilities of coal and shale exhibit significant anisotropy and high stress sensitivity, with an increase or decrease in the effective stress causing an exponential decrease or increase in permeability, respectively. The coal permeability in the direction perpendicular to the bedding is larger than that in the direction parallel to the bedding, while the reverse is the case in shale. Various flow regimes exist in the pores and fractures of differing scales. Under geological conditions, slip flow predominates in the small macropores (50 nm < diameter < 1000 nm), transition flow predominates in the micropores and mesopores, and continuum flow predominates in the large macropores (1000 nm < diameter) and fractures. Free molecular flow is only significant in the micropores at low pressures. The mass flux in the slip flow regime increases with increasing reservoir depth, while those in the transition and free molecular regimes slightly decrease with increasing reservoir depth. The mass flux in the continuum regime predominates in coal in both the directions perpendicular and parallel to the bedding, but only in the direction parallel to the bedding in shale. However, with increasing reservoir depth, the slip and transition flow regimes becoming more dominant in shale in the direction perpendicular to the bedding.
Footnotes
Acknowledgments
The authors also sincerely appreciate the editors and the reviewers for helping to improve the manuscript.
Declaration of conflicting interests
The author(s) declared no potential conflicts of interest with respect to the research, authorship, and/or publication of this article.
Funding
The author(s) disclosed receipt of the following financial support for the research, authorship, and/or publication of this article: This work was jointly sponsored by the Coal Fundamental Science and Technology Key Projects in Shanxi of China (No. MQ 2014), Scientific Research Foundation of Key Laboratory of Coalbed Methane Resources and Reservoir Formation Process, Ministry of Education (China University of Mining and Technology) (No. 2016-007), the National Natural Science Foundation of China (No. 41402124), and the Priority Academic Program Development of Jiangsu Higher Education Institutions (KYLX15-1397).