
Abstract
The objective of the present work is to evaluate the wind potential in the nearshore of the Mediterranean Sea. Thus, a comprehensive picture of the wind conditions is provided by considering 15-year of cumulative information coming from remotely sensed data and from two numerical models. These are provided by the European Center for Medium-Range Weather Forecasts (ECMWF) and the National Centers for Environmental Prediction (NCEP). Since most of the offshore wind turbines usually operate at about 80 m height, the initial wind conditions (reported at 10 m) were adjusted to this height and various wind parameters were evaluated. Besides these, the characteristics of the Vestas V90-3.0MW wind turbine were used to identify the efficiency of this type of generator in terms of operating capacity, rated capacity and capacity factor. From the analysis of these data, it can be noticed that more energetic wind conditions are encountered in the northern part of the basin (close to the Spain–France border and south of Greece) and also in the southern part of the sea (Tunisia sector). In the final part of the paper, based on satellite measurements, the wind conditions (monthly and seasonal) coresponding to some representative locations in the Mediterranean Sea were compared to those from several offshore locations where wind farms already operate.
Introduction
On a global scale, it can be noticed that the energy sector oscillates between the burning of fossil fuels and the renewable market. Although the conventional power plants are considered to be more efficient, since they use proven technology, developed during the last 260 years (starting with the industrial revolution), the benefits of the renewable energy sources and the engineering progress reported by this sector cannot be neglected (Badescu and Iacobescu, 2014; Kirtay, 2010).
Nowadays, the wind industry represents a key player in this market, if we consider the versatility of the wind turbines to be installed in various environments (onshore and offshore). Besides the countries well known for their results in this field (as Denmark or Germany), there is a growing interest to implement similar systems in various parts of the world, including countries such as India, Taiwan or Saudi Arabia, some of them being recognized as important oil suppliers (Bassyouni et al., 2015; Nouni et al., 2007). On the other hand, the constant improvement of the wind turbine capacities can be associated with the simplicity of the rotor design (the classical three blades – Danish model), most of the previous and current researches being focused on this type of configuration (Hau and Renouard 2006; McWilliam and Johnson, 2008). At the end of 2013, the global wind power market was estimated to be around 318 GW, a significant increase being reported during 2012–2013, when almost 118 billion of Euros were invested in 80 GW of new capacity. Although most of the wind farms operate in Europe, from the analysis of the installed capacity, it can be noticed that China is in the first place with 91GW, being followed by the USA – 61 GW, Germany – 34 GW, Spain – 23 GW, India – 20 GW and the UK – 10 GW (GWEC, 2014).
As a response to the high population density and the limited areas (windy areas) for the onshore wind farms, a relative young sector has begun to develop in the marine regions (Albani et al., 2014; Sørensen, 2008). As concerns the offshore wind industry, it can be mentioned that Europe stands out with an installed capacity of 1.8 GW in 2013, at an investment of 7 billion of Euros. Moreover, an upward trend is expected, which can reach 2.6GW/9.4 billion of Euros in 2016 and 4.5 GW/14.4 billion of Euros in 2020. Compared to these values, it is estimated that the projects from the North America will increase from 0 GW (in 2013) to 0.5 GW (in 2020) while the countries from Asia Pacific will expand from 0.4 GW (in 2013) to 1.5 GW (in 2020) (Berger, 2013; Clean Energy Pipeline (CEP), 2014). At this moment, the offshore European market is dominated by the UK, with an installed capacity of 4.6 GW, followed by Germany (1.5 GW), Denmark (1.3 GW) and Belgium (0.7 GW). Reported to the capacity under construction, the market is divided between Germany (1.7 GW), UK (0.4 GW) and the Netherlands (0.13 GW) (4C Offshore, 2014). Following this evolution, it is expected that in the near future, the wave energy will benefit from these advances (Rusu and Onea, 2015, 2016; Onea and Rusu, 2016a).
Although the costs are much higher than for the onshore projects, in the case of an offshore farm, the viability of such project results from the high power density of wind conditions, which is usually more significant than in the onshore areas. Since almost 71% of Earth's surface is covered by water, there are many potential coastline sectors where this type of farms can be developed. From this perspective, even some enclosed basins such as the Mediterranean, the Caspian or the Black seas may present a real interest (Chronis et al., 2011; Onea and Rusu, 2016b; Onea et al., 2015; Raileanu et al., 2015, 2014b).
Among the European seas, the Mediterranean basin is the largest. It is defined by a surface of about 2.5 million km2, a coastal length of 46,000 km (for 24 countries) and an average depth of 1500 km. In the western part, the sea is connected to the Atlantic Ocean throughout the Strait of Gibraltar, while in the east this basin is linked to the Sea of Marmara and the Black Sea by the Dardanelles and Bosporus straits, respectively. Although the orography of the coasts is quite complex, this basin can be formally divided into four sectors: (a) Western Mediterranean; (b) Adriatic Sea; (c) Ionian Sea and Central Mediterranean and (d) Aegean Sea-Levantine Sea (Bazairi et al., 2010).
A complete picture of the wind regime of the Mediterranean Sea is given by analyzing the particularity of the local wind cells (Koroneos et al., 2013). The Levante wind can be found in the western part of the basin. It is generated by the high pressure over the Western Europe and low pressure to the southwest of Gibraltar. This may occur any time, especially in the interval July–October and in March, when maximum values of 20 m/s could be encountered in the Strait of Gibraltar (Bentamy et al., 2007). Another important wind is the Mistral, which occurs in the northwestern part. This is observed in the area located between the southern part of France and the Gulf of Lion, only for short periods of time, which may vary from a few days to a week. It is usually reported during winter and spring. However, much higher values are noticed between these two seasons, when wind speeds greater than 15 m/s can be encountered (McAneny et al., 1988). Other important winds are: Tramonte and Bora (in the north); Etesian (in the northeast) and Sirocco (in the south and the southeast).
Some previous studies suggest that more energetic conditions can be encountered in the Western Mediterranean and in the Ionian seas. Thus, a mean wind speed of 8 m/s is usually noticed, while much higher value, in the range of 16–18 m/s, can be expected in the Gulf of Lion (Herrmann et al., 2011). It is also important to mention that, in this region, there are some large islands, which locally influence the wind patterns, from which there can be mentioned: Cyprus, Crete, Sardinia, Corsica, Sicily and Malta. By analyzing their geographical positions, it can be observed that Spain and Turkey have the best opportunity to develop offshore projects. This is because they are characterized by large coastlines along the Mediterranean Sea, but also in the Atlantic Ocean and respectively in the Black Sea, which significantly increase the number of potential sites. In the case of Turkey, there is a growing interest in the wind energy (Genç, 2010, 2011; Genç and Gökçek, 2009; Gokcek and Genç, 2009) not only to produce electricity, but also for the hydrogen production (Genç et al., 2012a, 2012b). Since the technology is already available, it can be expected that in the near future the attention will shift on the marine areas.
Although some previous researches indicated a suitable wind potential, at this moment, there is no offshore wind farm operating in the Mediterranean Sea. From this perspective, the main objective of the present work is to evaluate the coastal wind conditions along the entire basin, in order to identify better the viability of such projects in the coastal areas of the Mediterranean Sea.
At this point, it has to be highlighted that previous studies show that the evaluation of the wind conditions in the Mediterranean Sea is made mostly at local levels, as in Egypt (Shata and Hanitsch, 2006) or Greece (Emmanouil et al., 2015), without comparing the results at a wider regional scale. Moreover, most of the studies are based only on a single data source, or use numerical models that can provide inaccurate results without a proper calibration.
From this perspective, in order to provide a more comprehensive picture of the wind conditions, the present study considers two independent data sources that cover the entire coastal environment of the Mediterranean Sea. The first is represented by the satellite observations coming from the AVISO multi-mission project, which have the advantage that can provide information without being restricted by the geographical characteristics (as the basin area, land configuration, islands, etc.). The second is given by two reanalysis models (ECMWF and NCEP) that have a higher temporal resolution and that can be considered very appropriate to evaluate the performances of a wind turbine. It can be also highlighted that by using some reference points, the results should be more precise than in the case of using spatial maps covering the entire target area.
An element of originality of the proposed work is represented by the comparisons performed between the wind resources in the most promising areas of the of the Mediterranean Sea with the wind characteristics close to some other European areas where wind projects are already operational. This represents a new approach while the main activities in this region are focused on the implementation of some floating platforms as WindFloat (Onea and Rusu, 2015). Thus, taking into account the coastal environment targeted, the time interval and the comparisons carried out against offshore locations where wind farm project have been already implemented, it can be considered that the present work represents a complex and innovative study that can contribute to a better understanding of the wind energy potential in the Mediterranean Sea.
Methods and materials
The target area
The entire Mediterranean Sea basin is considered in the present analysis. The seasonal and spatial wind characteristics are identified throughout 19 reference points (denoted from N1 to N19) and their locations are presented in Figure 1. Since another objective of the work is to anticipate the performances of a typical offshore wind turbine, all the N-points were selected to be located in water depths of about 30 m. This can be considered to be a viable depth for the wind projects. Most of the existing offshore parks are currently operating in depths of 20–30 m, while the trend is to go beyond this limit (EWEA, 2013). The points are distributed clockwise, and starting from the western part of the sea. They can be grouped as follows: N1 – Morocco; N2 – Spain; N3 – Spain/France; N4 – Italy (Sardinia); N5, N6 – Italy; N7 – Italy (Sicilia); N8 – Croatia; N9 – Albania; N10, N11 – Greece; N12, N13 – Turkey; N14, N15 – Egypt; N16, N17 – Libya; N18 – Tunisia and N19 – Algeria.
The locations of the 19 reference points selected for the Mediterranean Sea coastal environment. Figure processed from Google Earth (2014).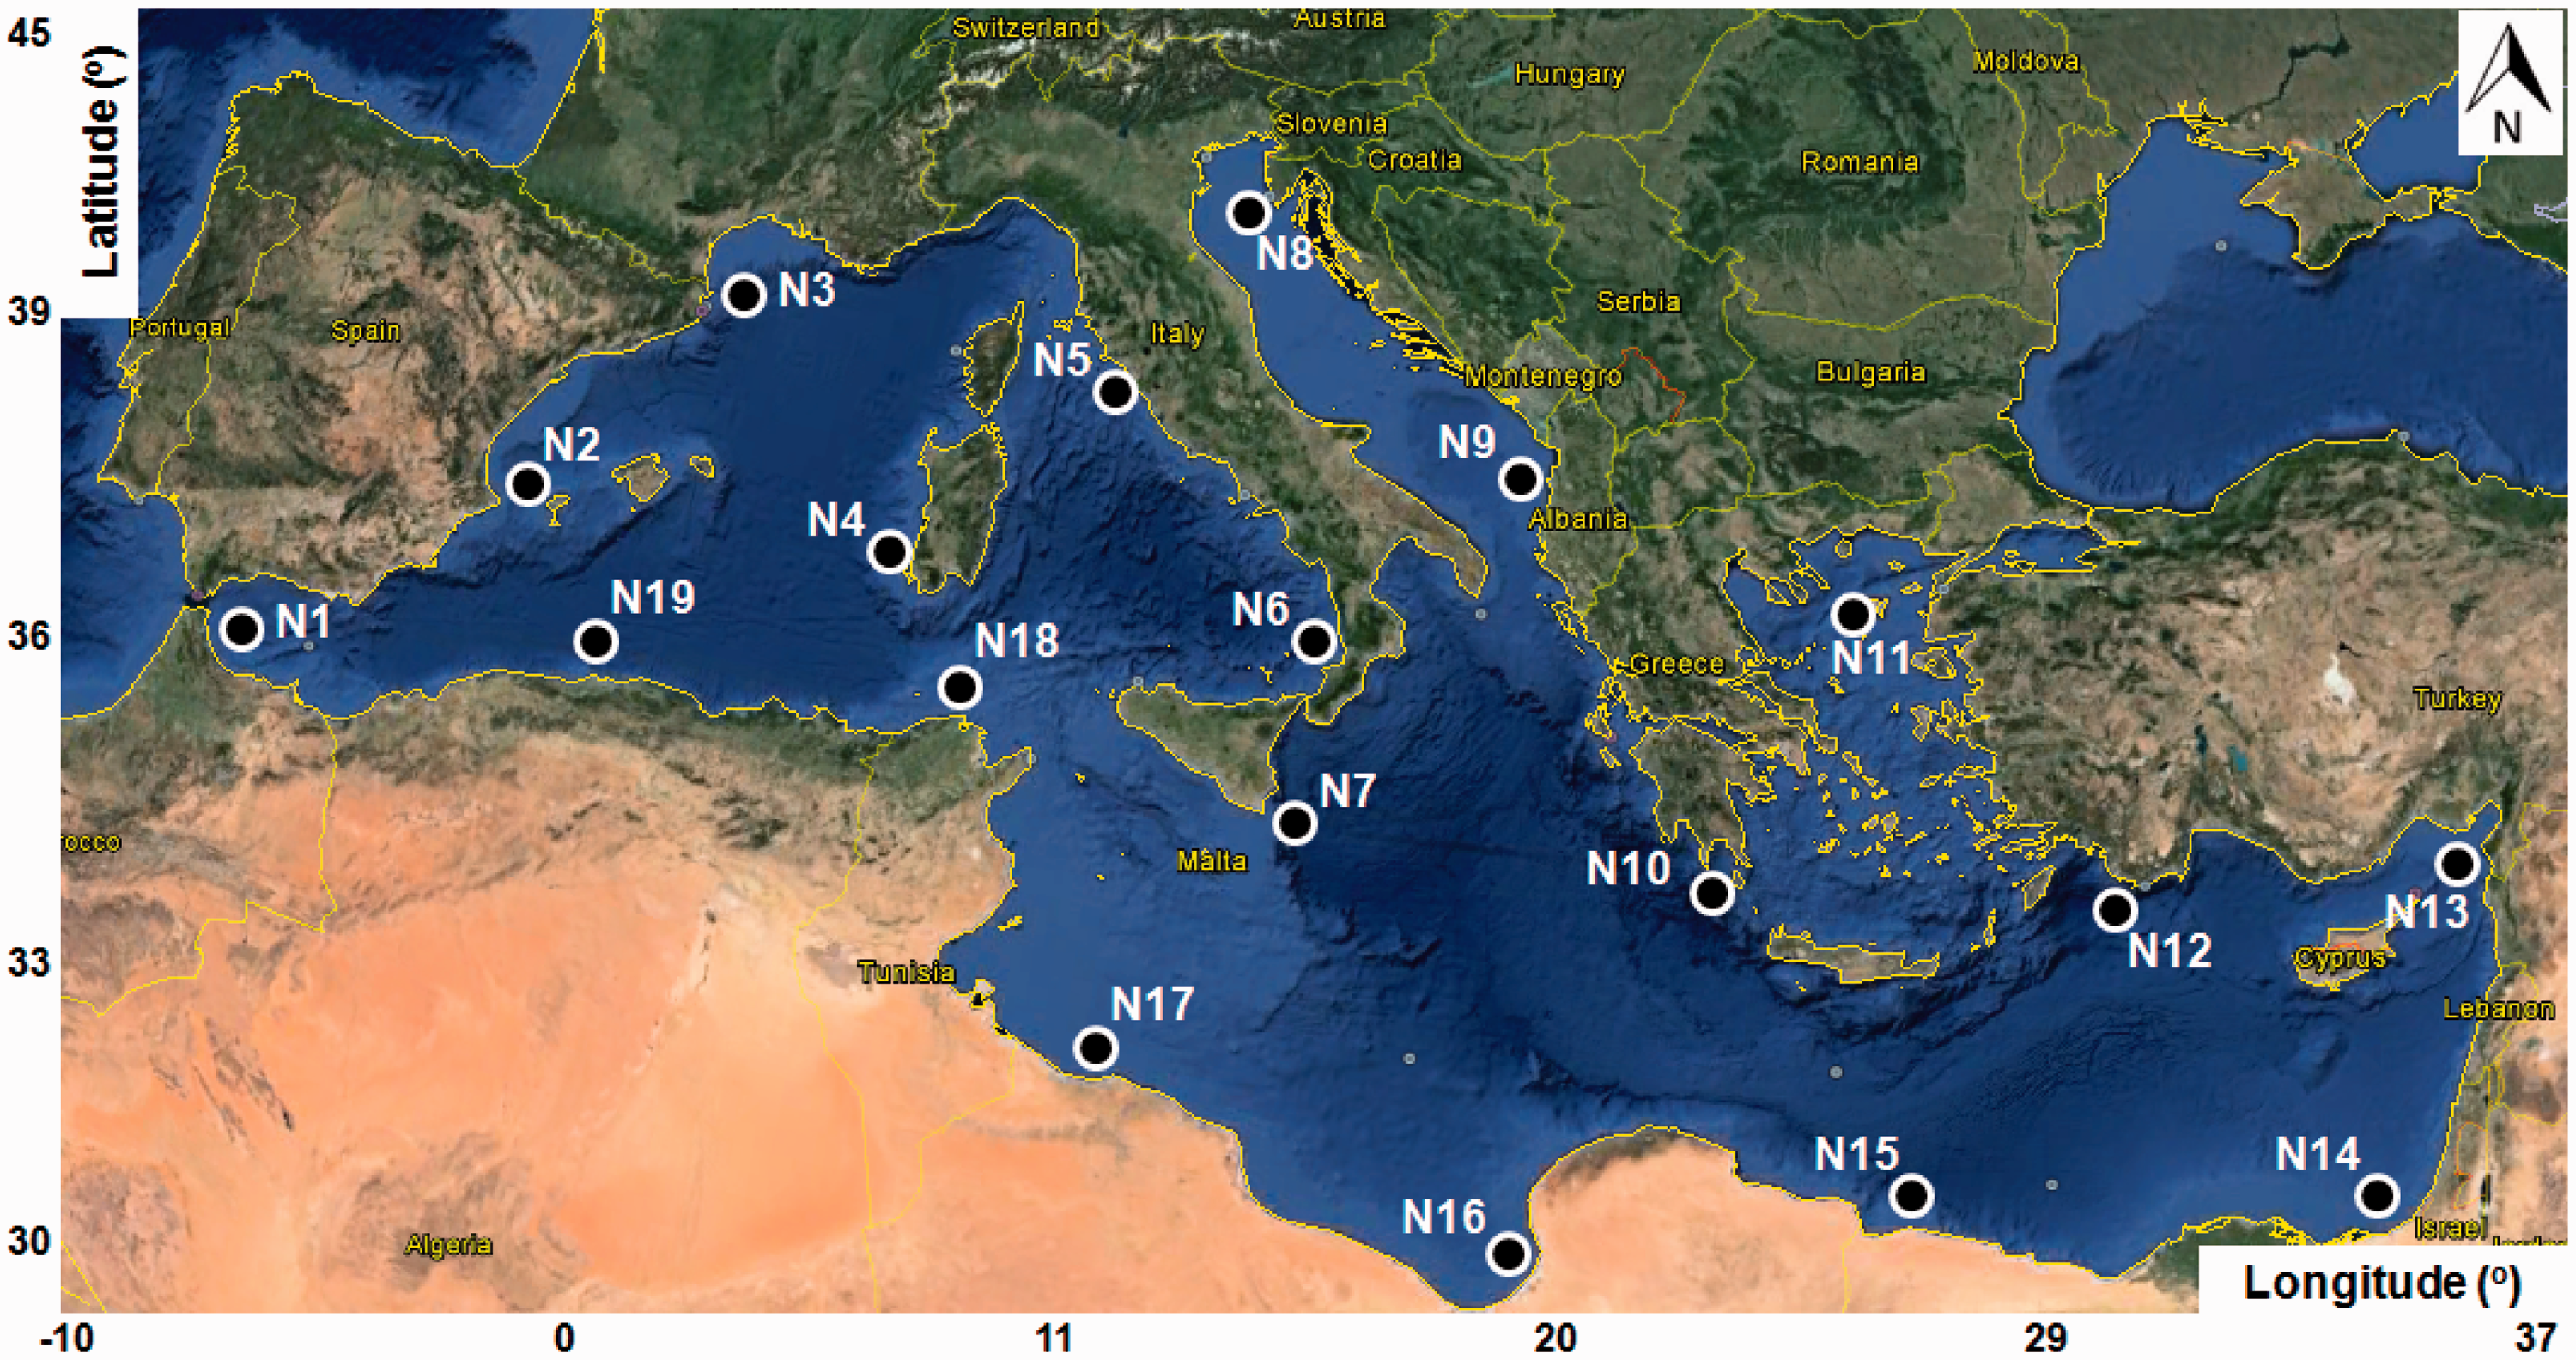
Another factor, which needs to be taken into account when planning an offshore project, is the distance to the shoreline. In the present cases, this is below 4 km for most of the points, greater distances being reported by: N8 (21.53 km); N5, N14 (13 km) and N16 (10 km), respectively.
Datasets
In order to perform a complete and more accurate analysis concerning the real wind energy potential, information coming from three different data sources have been considered. The first data source is represented by the satellite measurements provided by AVISO (Archiving, Validation and Interpretation of Satellite Oceanographic data) and CNES (Centre National d'Etudes Spaciales). The other two data sources are represented by the reanalysis data provided by two well-known institutions for weather prediction, the European Center for Medium Weather Forecasts (ECMWF) and the National Centers for Environmental Prediction (NCEP) – Climate Forecast System Reanalysis (CFSR). Differences may occur between the information concerning the wind velocity provided by the two reanalysis data bases, both as regards the homogeneity in time and the extreme values (see, for example, the recent work of Stopa and Cheung, 2014). However, both of them represent credible sources, validated at a global scale and widely used for climatology studies or other applications. Some more details concerning the three different data sources considered in the present work are given next.
Remotely sensed data
The satellite measurements can be considered an important source of data, since they provide information regarding the wind conditions over large water areas. The wind speed is evaluated above the sea surface (at 10 m height) by measuring the intensity of the backscatter signal, which may change according to the steepness of the sea waves. Other parameters that may influence the normalized radar backscatter cross section (σ0) are polarization, frequency and incidence angle (θ). In general, the measurement process involves the use of the altimeter or scatterometer system, which can evaluate the incident angles at θ = 0° (down-looking), and θ = 20–60° (side-looking), respectively (Tran et al., 2007).
The altimeter wind measurements considered in the present work are those produced by Ssalto/Duacs and distributed by Aviso, with support from Cnes (http://www.aviso.altimetry.fr/duacs/). The wind data analyzed come from a multi-mission process. This involves in the input stage the use of two days of data only if at least two missions are available. In the processing phase, all the collected data are cross-calibrated using OSTM/Jason-2 (Hausleitner et al., 2012) as a reference mission. First, the wave histograms and backscatter section are evaluated. After this, the OSTM/Jason-2 wind algorithm is applied to the cross calibrated backscatter σ0. The final results are obtained throughout a bathymetry mask, which force each point from the inland (considered to be at least 2° from the sea) to be replaced with a default value (AVISO, 2014).
The satellite data used in the present work cover the time period September 2009–June 2014 and consist of one measurement per day.
ECMWF dataset
The ECMWF maintains several reanalysis models, one of them being ERA-Interim (Berrisford et al., 2011). This is a global model, which provides environmental data from 1979 to present. It is based on an integrated forecast system, which combines a four-dimensional variational analysis at 12-h interval. The spatial resolution of the data is around 80 km, which spans over 60 vertical levels, starting from the surface and reaching 0.1 hPa (Berrisford et al., 2007; Persson and Grazzini, 2005). The four-daily wind data (00-06-12-18 UTC) were processed for the time interval January 2004–December 2013, considering the U and V components, which are reported at 10 m height above the sea surface.
The NCEP dataset
The NCEP uses a state-of-the-art forecast and a data assimilation scheme providing valuable atmospheric information for the time interval 1979–2010, with a global spatial resolution of about 38 km. In order to compute the ocean surface wind speed, different types of data are integrated. The first source consists of microwave imager data from the special sensor microwave/imager (SSM/I) reported by the DMSP (Defense Meteorological Satellite Program) satellites. These were introduced in the model in 1997, throughout a neural network algorithm, which converts brightness temperature data into wind speeds (Gemmill and Krasnopolsky 1999). The European Space Agency represents another important data source, which, throughout the missions ERS-1/AMI and ERS-2/AMI, has provided ocean surface wind vectors since 1991 and 1996. These were reprocessed for the time interval 1991–2007. The QuikSCAT SeaWinds and the NRL WindSat scatterometers have been also included in the reanalysis processes since 2001 and 2008, respectively (Saha et al., 2010).
Similar to the ECMWF model, in the present work, only four data per day were considered (00-06-12-18 UTC) for the time interval January 1999–December 2008, although the NCEP model is characterized by an hourly resolution reported at 10 m height.
Methods
Since most of the offshore wind systems operate at 80 m height, the wind profile at this level can be identified by adjusting the initial datasets (reported at 10 m) throughout a logarithmic law (Kubik et al., 2011). This is expressed as

The wind energy potential in a specific location can be identified throughout the power density index, which is defined as

Finally, the theoretical energy output of any wind turbine can be identified as follow

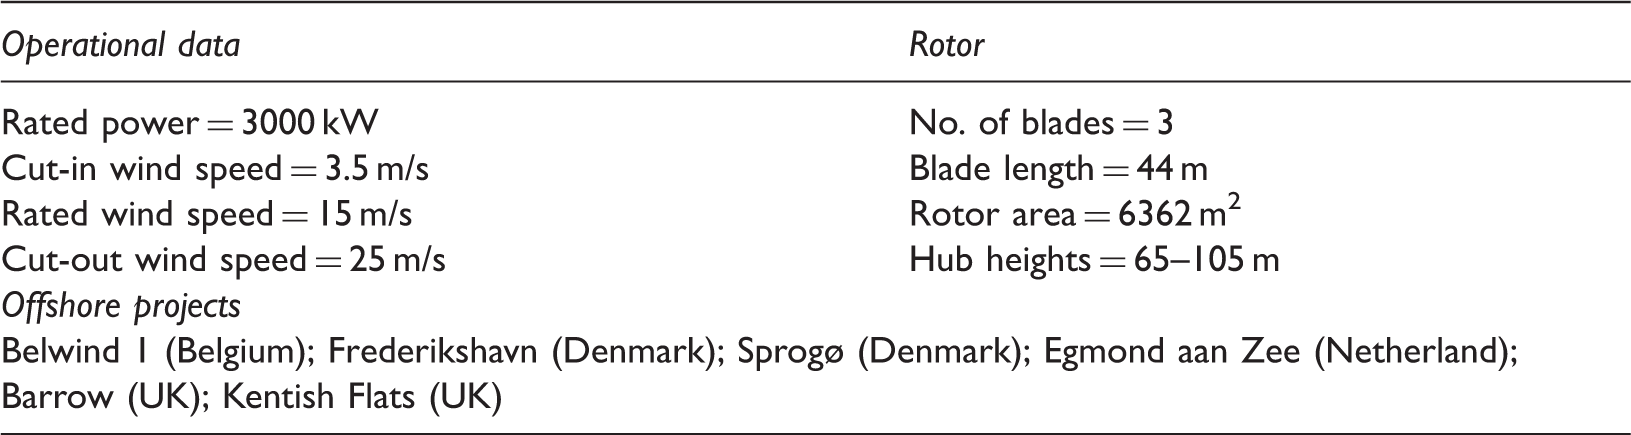
Characteristics of the Vestas V90-3.0 wind turbine.
Accuracy of the dataset
Although the satellite missions cover the entire marine areas, in the vicinity of the coastline (interface land–water), the dataset can include some missing values which are denoted as Not a Number (NaN) (Risien and Chelton, 2006). Since all the reference points (N1–N19) were selected in the vicinity of the Mediterranean coasts, such an evaluation was performed in Figure 2. This is made both for the total period and for the winter time (which is the time interval from October to March). In general, it can be noticed that a more significant number of missing data can be reported in the Adriatic Sea and in the eastern part of the Mediterranean basin. Thus, during the total time they can reach significant percentages in N13 – 16.3%; N9 – 14.1%; N14 – 13.4% and N8 – 12.2%, respectively. Much lower values can be observed from the analysis of the reference points N3–N6 and N18. Thus N3 reports a minimum of 2.4% (winter time), while N5 indicates a maximum of 4.1% (N5). The remaining points present NaN values which may vary in the interval 5–9%. However, much higher values are encountered in the total time.
Distribution of the missing data (NaN – not a number), corresponding to the satellite data. Analysis related to the interval September 2009–June 2014, corresponding to the total and the winter time intervals, respectively.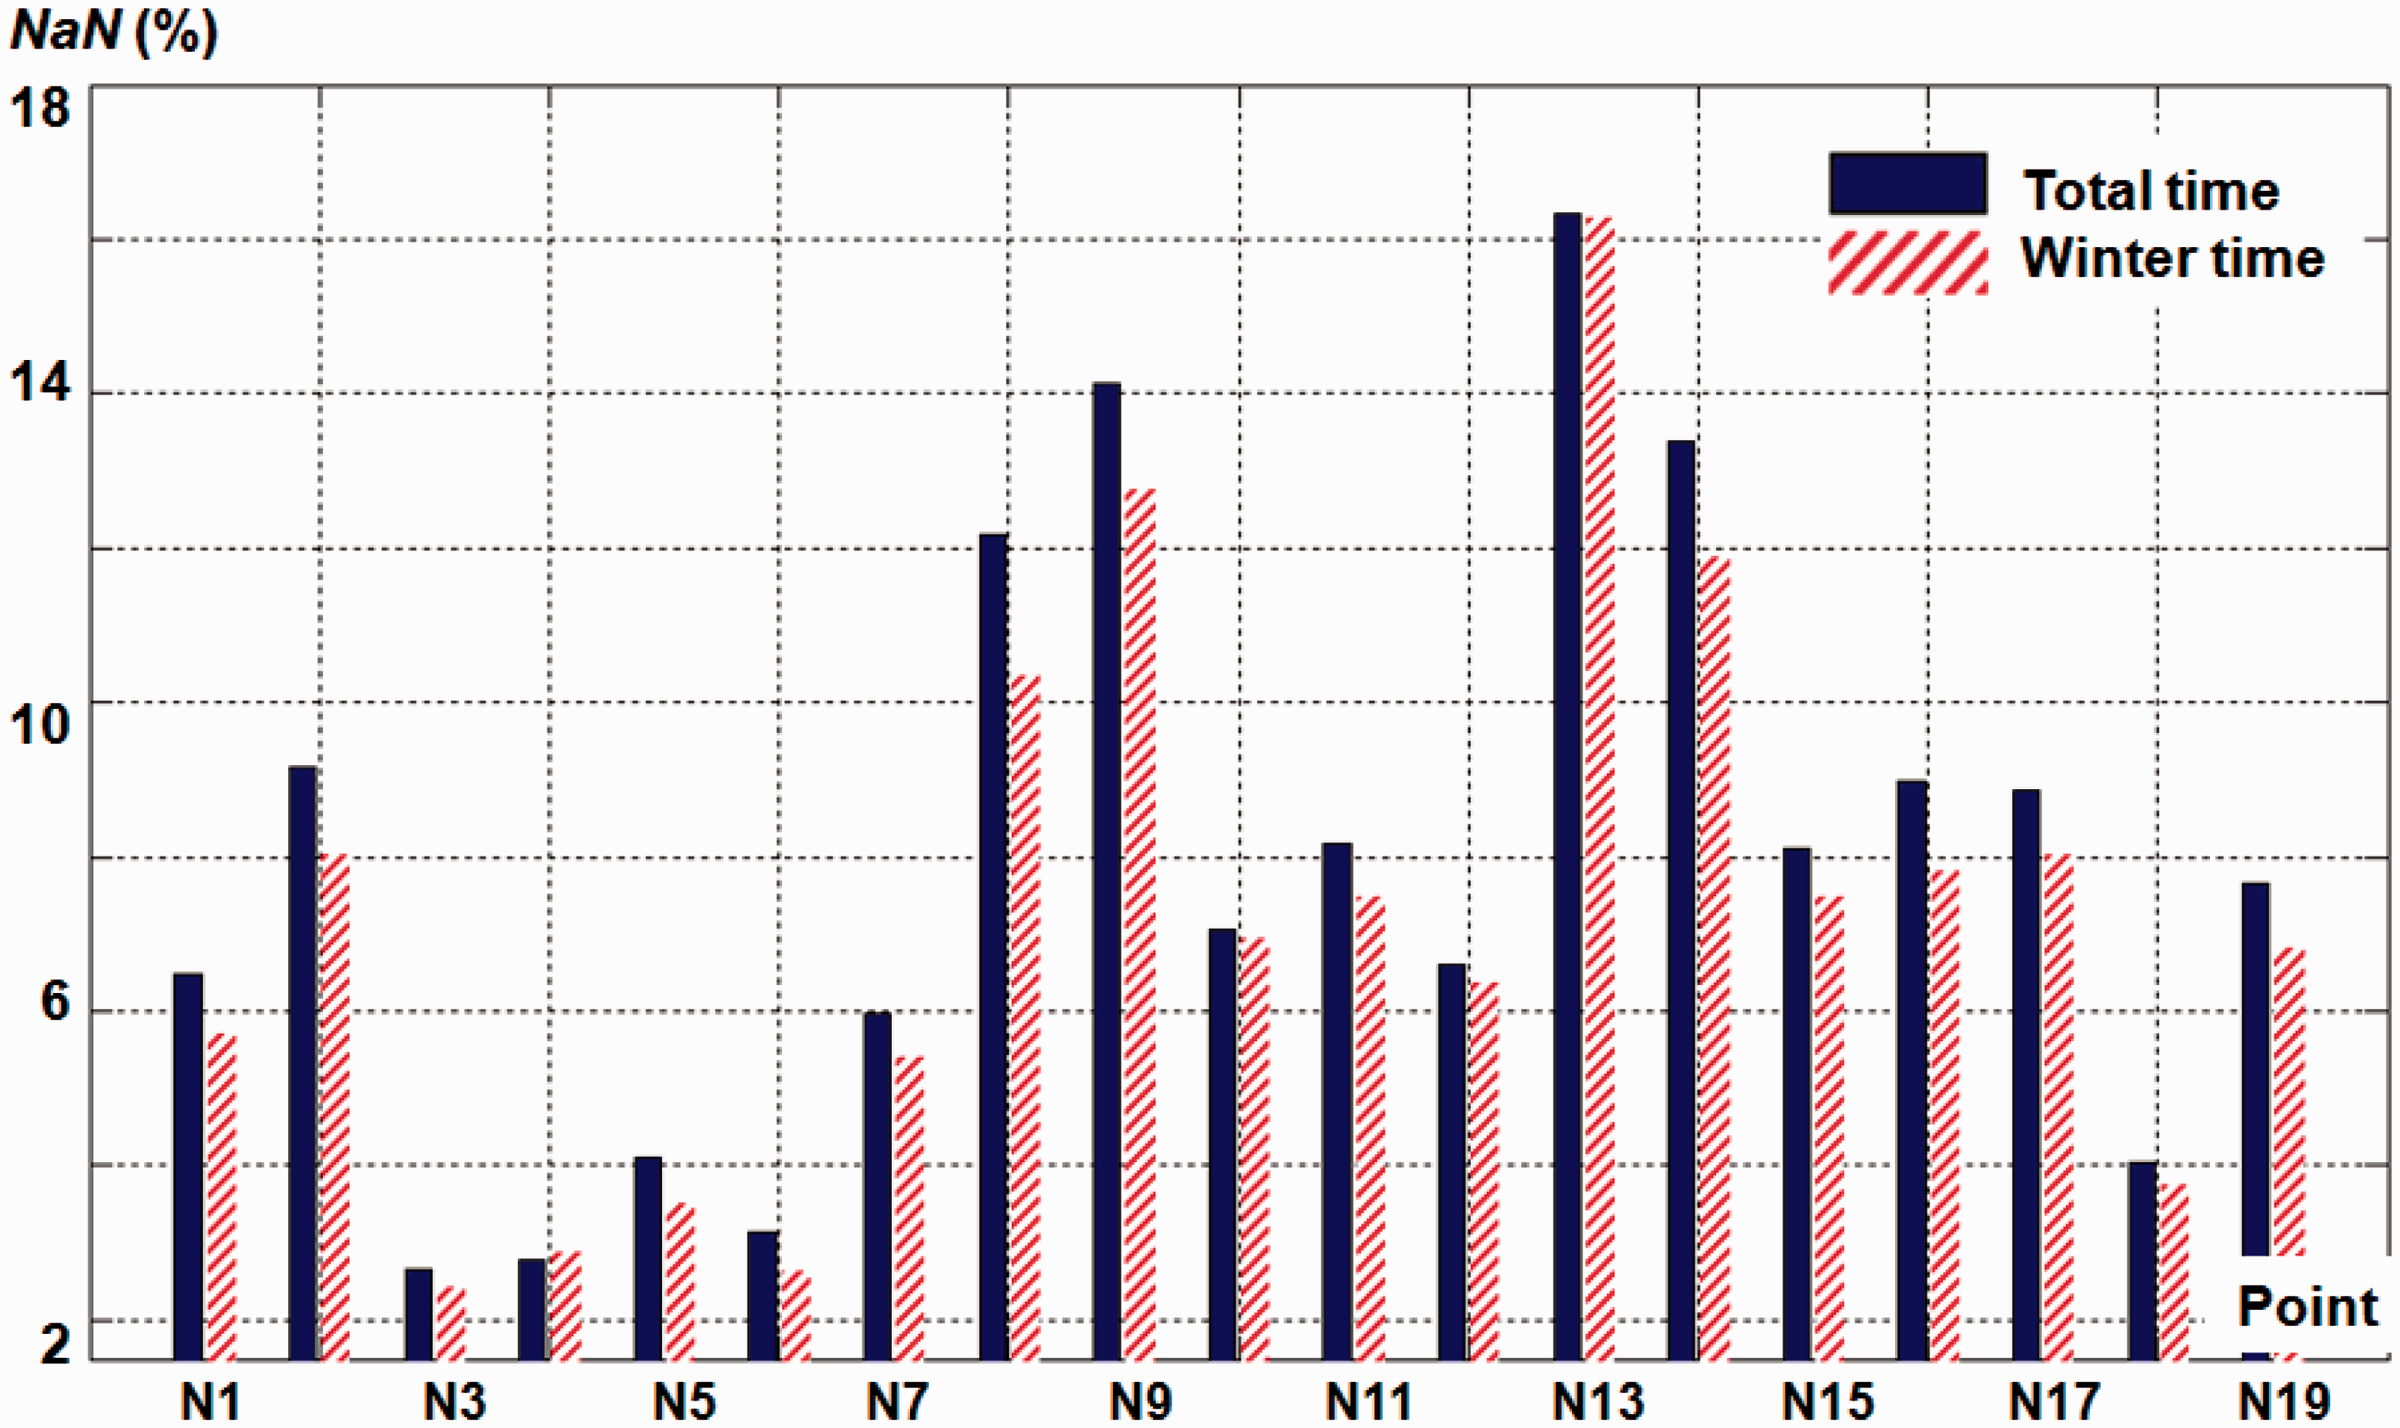
Since the quality of the results is directly related to the proportion of the missing data and a NaN percentage that exceeds 10% is not recommended (Dong and Peng, 2013), the points N8, N9, N13 and N14 will be further excluded from the analysis of the satellite measurements.
Statistical comparisons of the ECMWF data against the NCEP data.
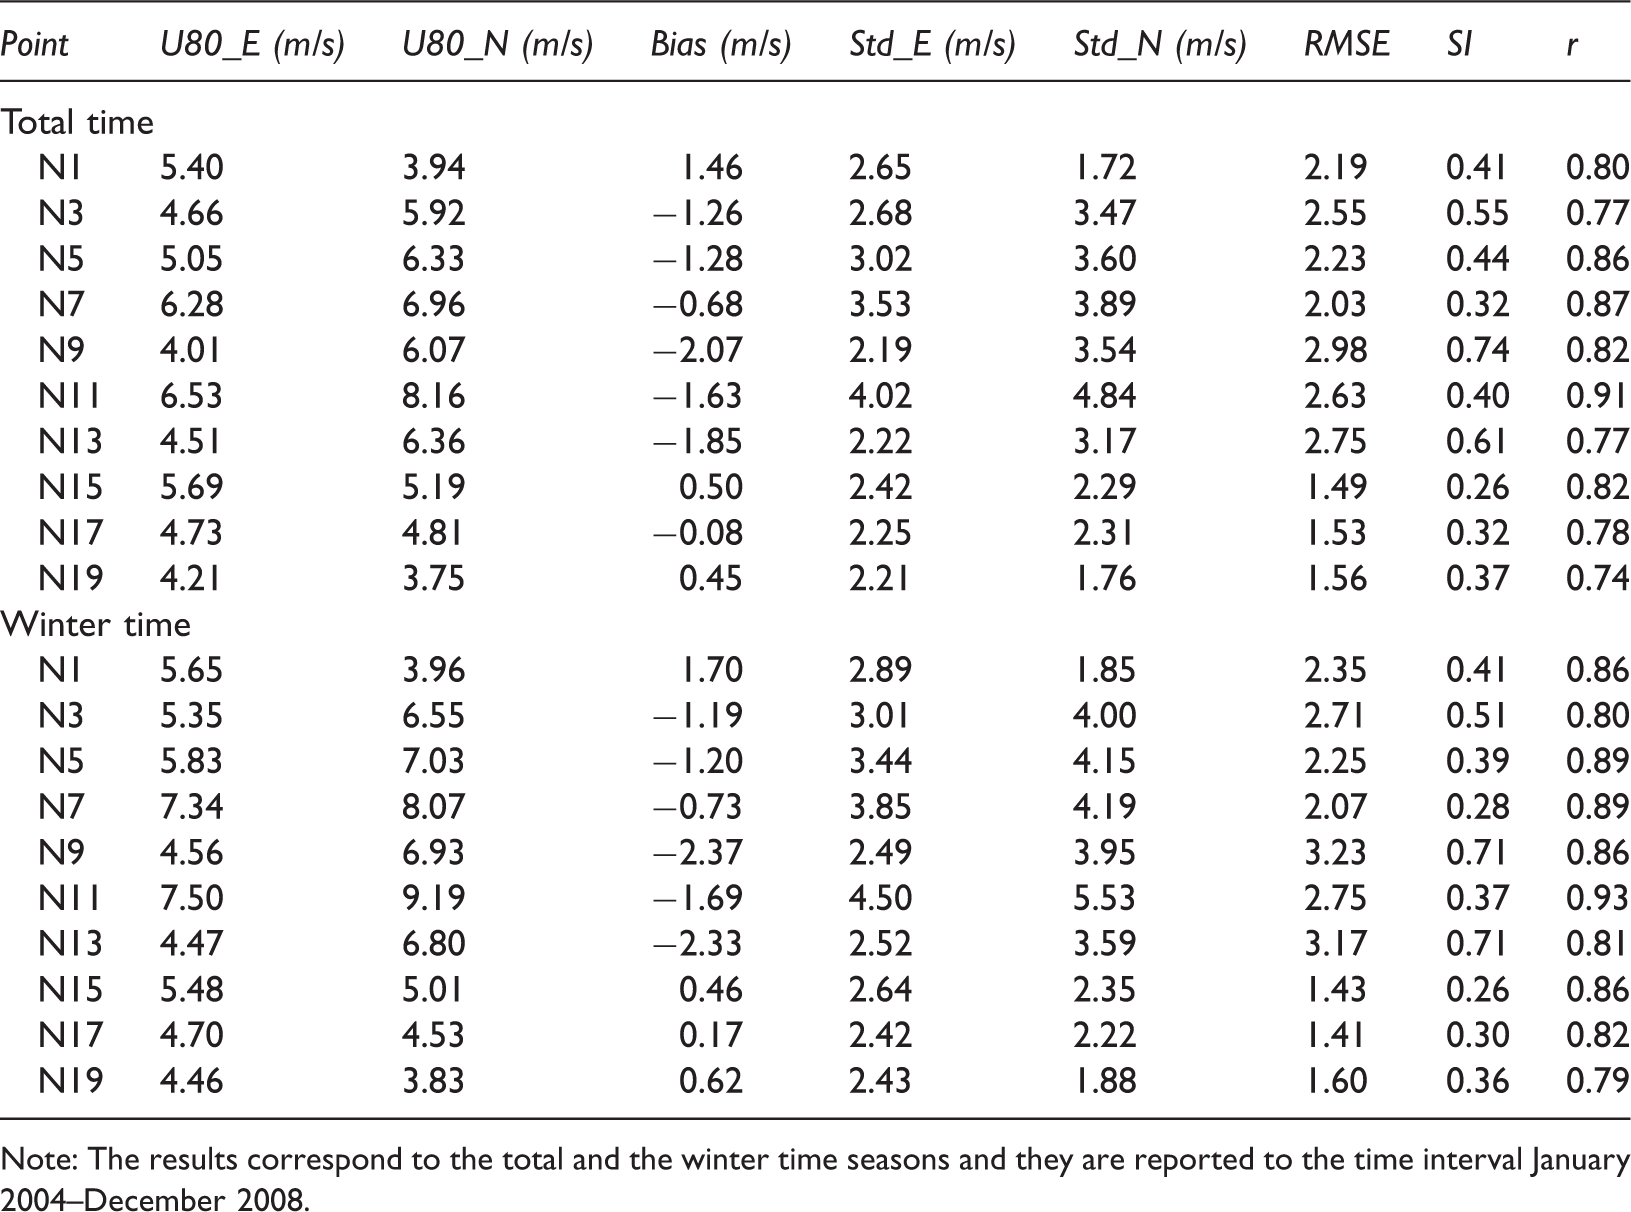
Note: The results correspond to the total and the winter time seasons and they are reported to the time interval January 2004–December 2008.
Regarding the standard deviation, most of the points present values in the range of 2.2–3.5 m/s. More significant values can be expected in the point N11 (between 4 m/s and 4.9 m/s). The NCEP model also reveals some values located close to 1.75 m/s, for N1 and N19. Since a lower value of the RMSE and SI is an indication of a better consistency between the two datasets, the points N15, N17, and N19 reveal a good agreement. In this category can be also included N7 which presents a SI of 0.32. Regarding the r index, it can be observed a strong positive linear correlation. The best fit of the two models is observed for N11, while the points N3, N13, N17, and N19 present a much lower concordance (≈0.77).
The evolution of the statistical parameters for the winter season is also presented in Table 2. The results presented in this table indicate that the differences between the ECMWF and NCEP models remain almost the same, with the mention that much higher values are observed in the winter season, when more energetic conditions can be encountered.
Figure 3 presents several scatter diagrams of the wind speed (based on the total time data). They show in a more detailed way the differences between the two models, which tend to become more severe around the 6–8 m/s wind speed interval.
Scatter plots of the U80 parameter, considering the ECMWF and NCEP data. The results cover the time interval January 2004–December 2008 and correspond to: (a) N1; (b) N3; (c) N7; (d) N11; (e) N15; and (f) N19.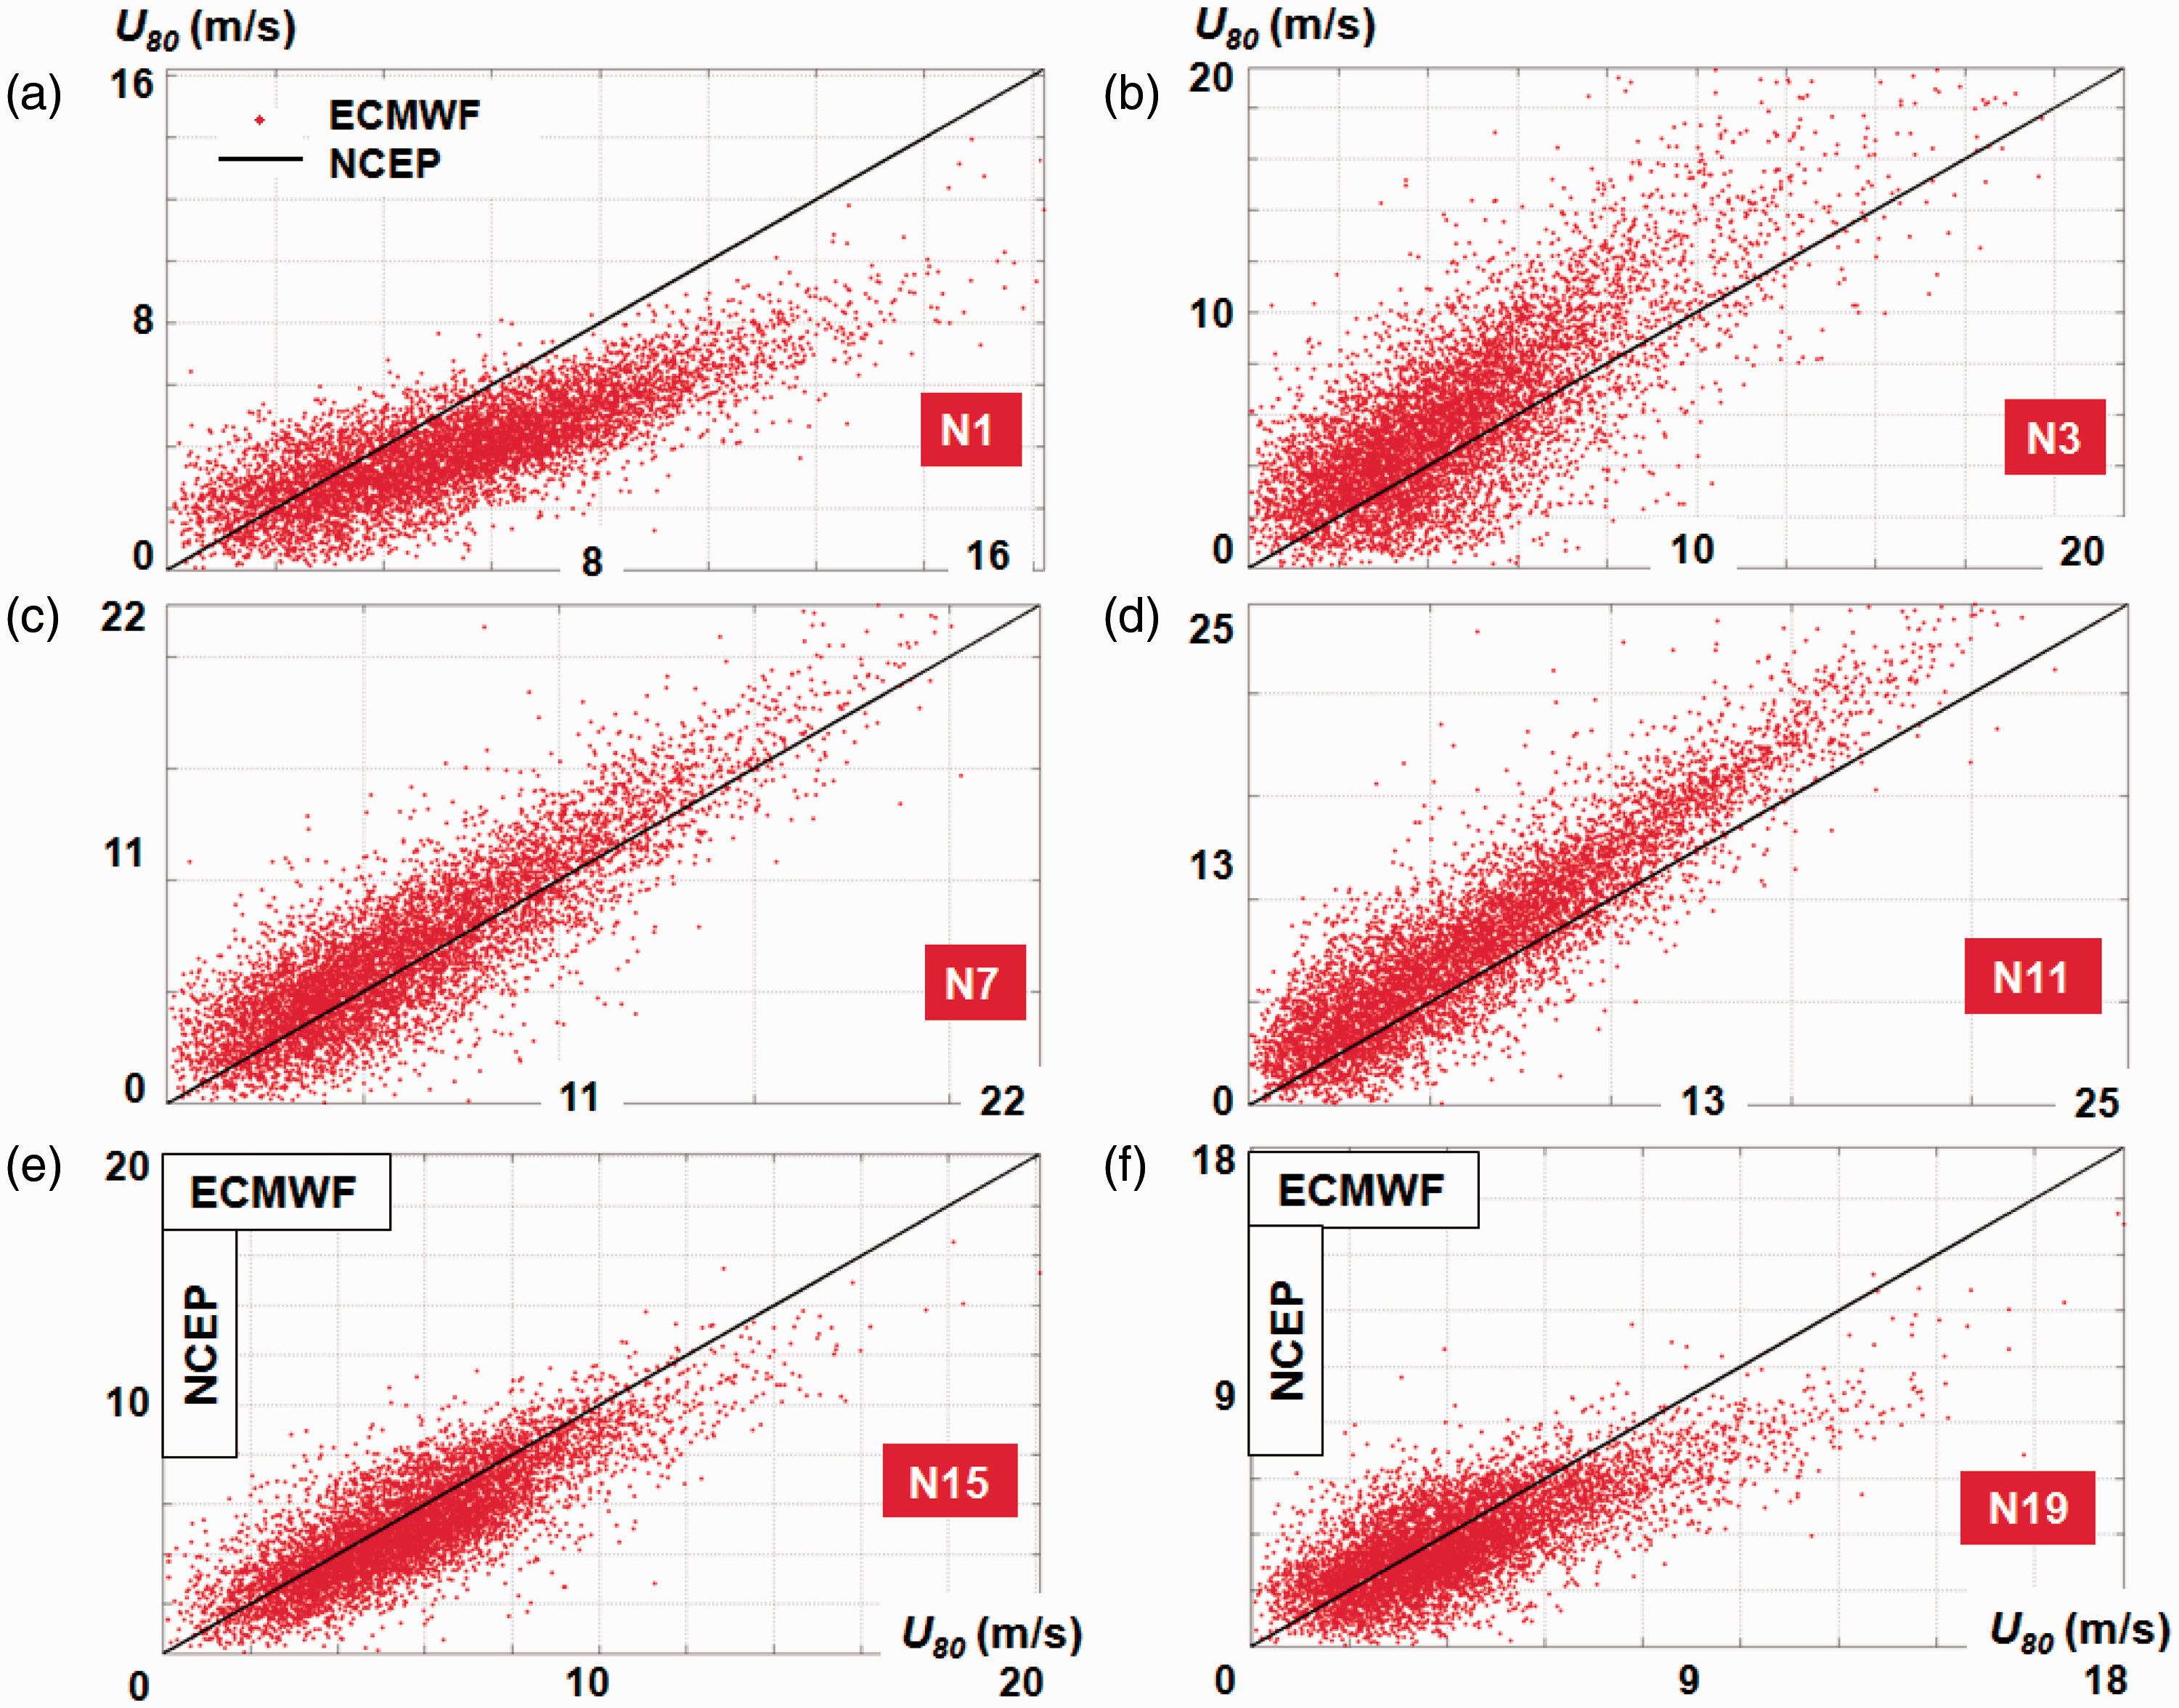
Results
Analysis of the remotely sensed data
Figure 4 presents the evolution of the mean wind speed values (the left legend) and the power density values (the right legend), for the time interval September 2009–June 2014. They were estimated for the total and winter time periods, respectively. During the winter time, the most significant values are observed for: N3 – 6.17 m/s (315 W/m2); N4 – 5.84 m/s (236 W/m2); N10 – 5.84 m/s (220 W/m2) and N18 – 5.51 m/s (201 W/m2). For this season, most of the points report values in the range of 5–5.5 m/s, while during the total time, only the points N3 and N10 present values close to 5 m/s and 203 W/m2. During the total time, much lower values are encountered at the points N5, N6, and N11, which usually do not exceed wind speeds of 4.2 m/s or power densities of 133 W/m2.
Average wind speed (at 80 m height) and power density (at 80 m height) based on the satellite data. The results are structured in total time and winter time and they correspond to the time interval September 2009–June 2014.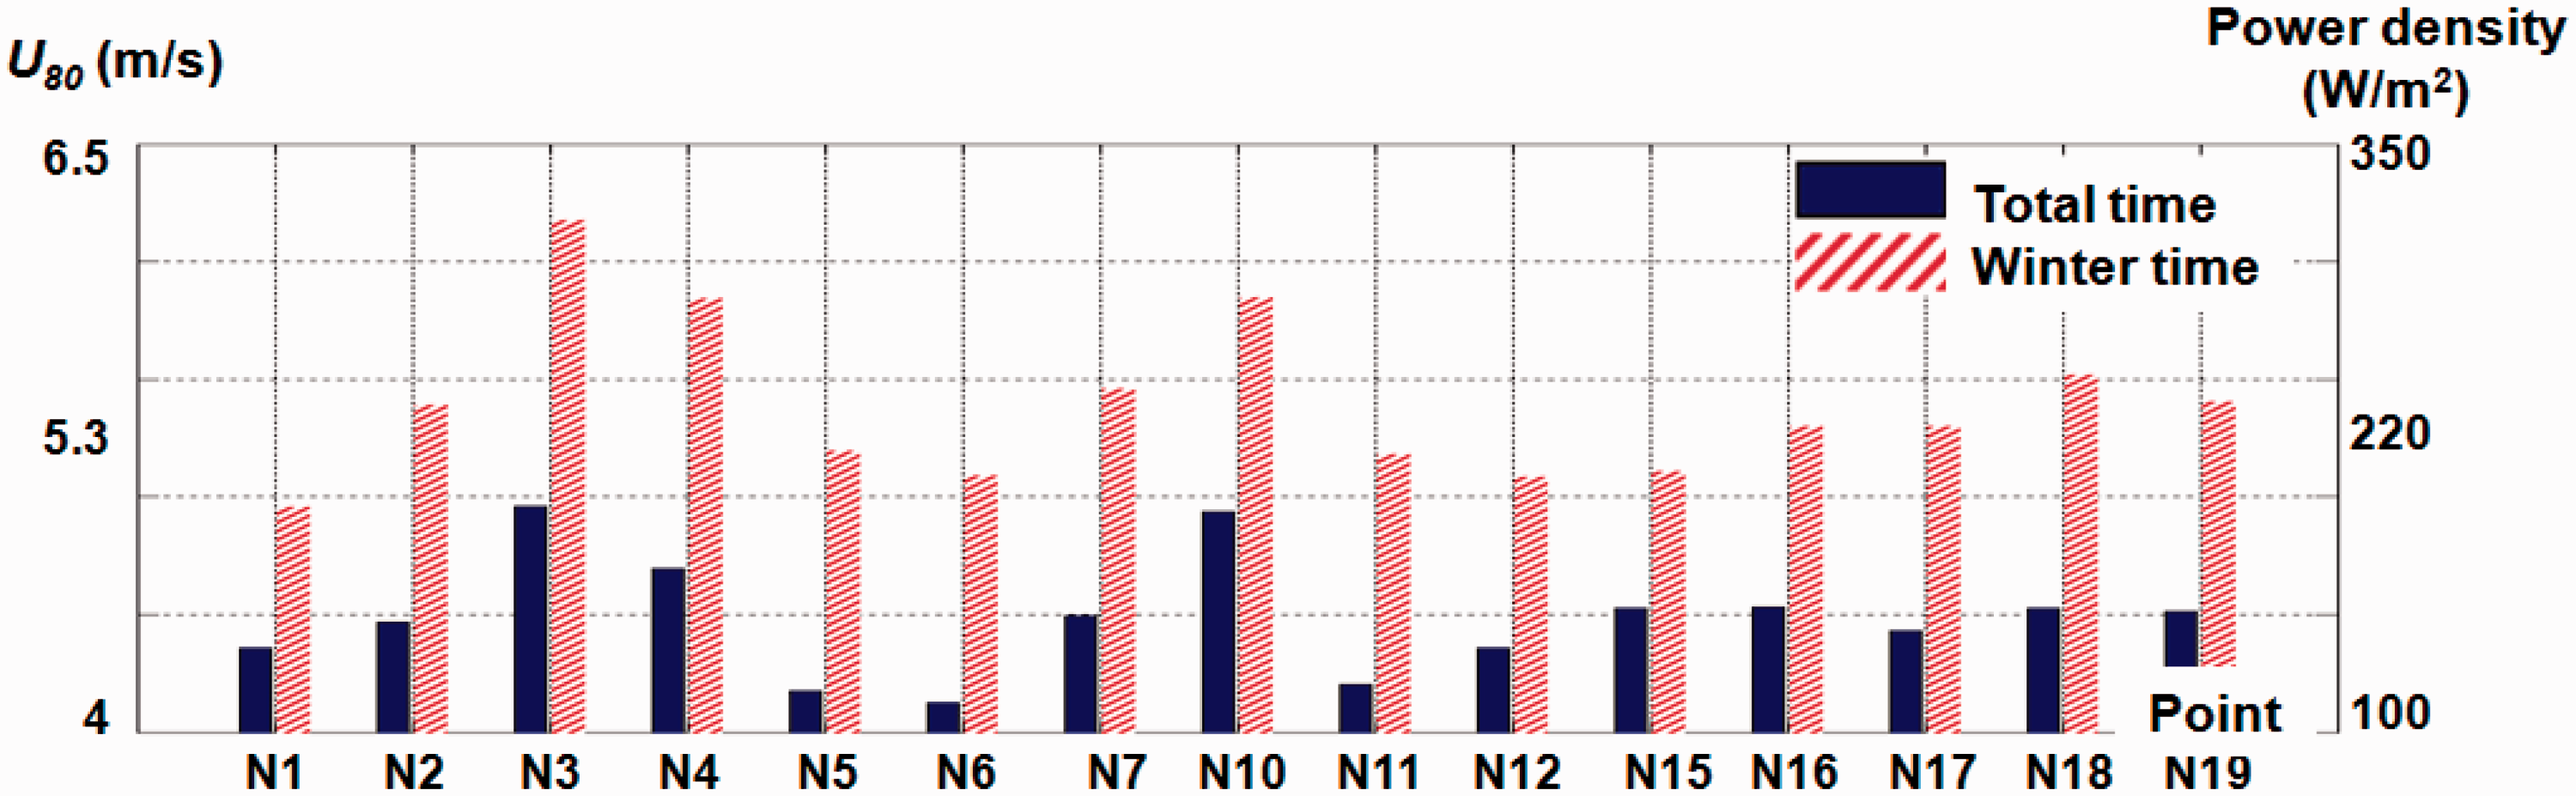
The histogram distribution of the U80 parameter is presented in Figure 5, for the same time interval. The analysis was focused on the points N3, N10, N15 and N18, the results being reported to the total time and winter time, respectively. Regardless of the time period analyzed, it can be noticed that the wind classes 3–6 m/s are dominant. This indicates a distribution close to 55%, which is followed by the 6–9 m/s with 20% (total time) and 30% (winter time), respectively. For the winter season, the increases of the wind speeds from the classes 6–9 m/s and 12–15 m/s can be associated with the decreases of the wind speeds in the interval 0–3 m/s, since the wind speeds higher than 12 m/s do not present major variations.
Wind speed histograms (%) based on the satellite data, considering the interval September 2009–June 2014. Analysis performed for the points N3, N10, N15, and N18, where (a) is total time and (b) winter time.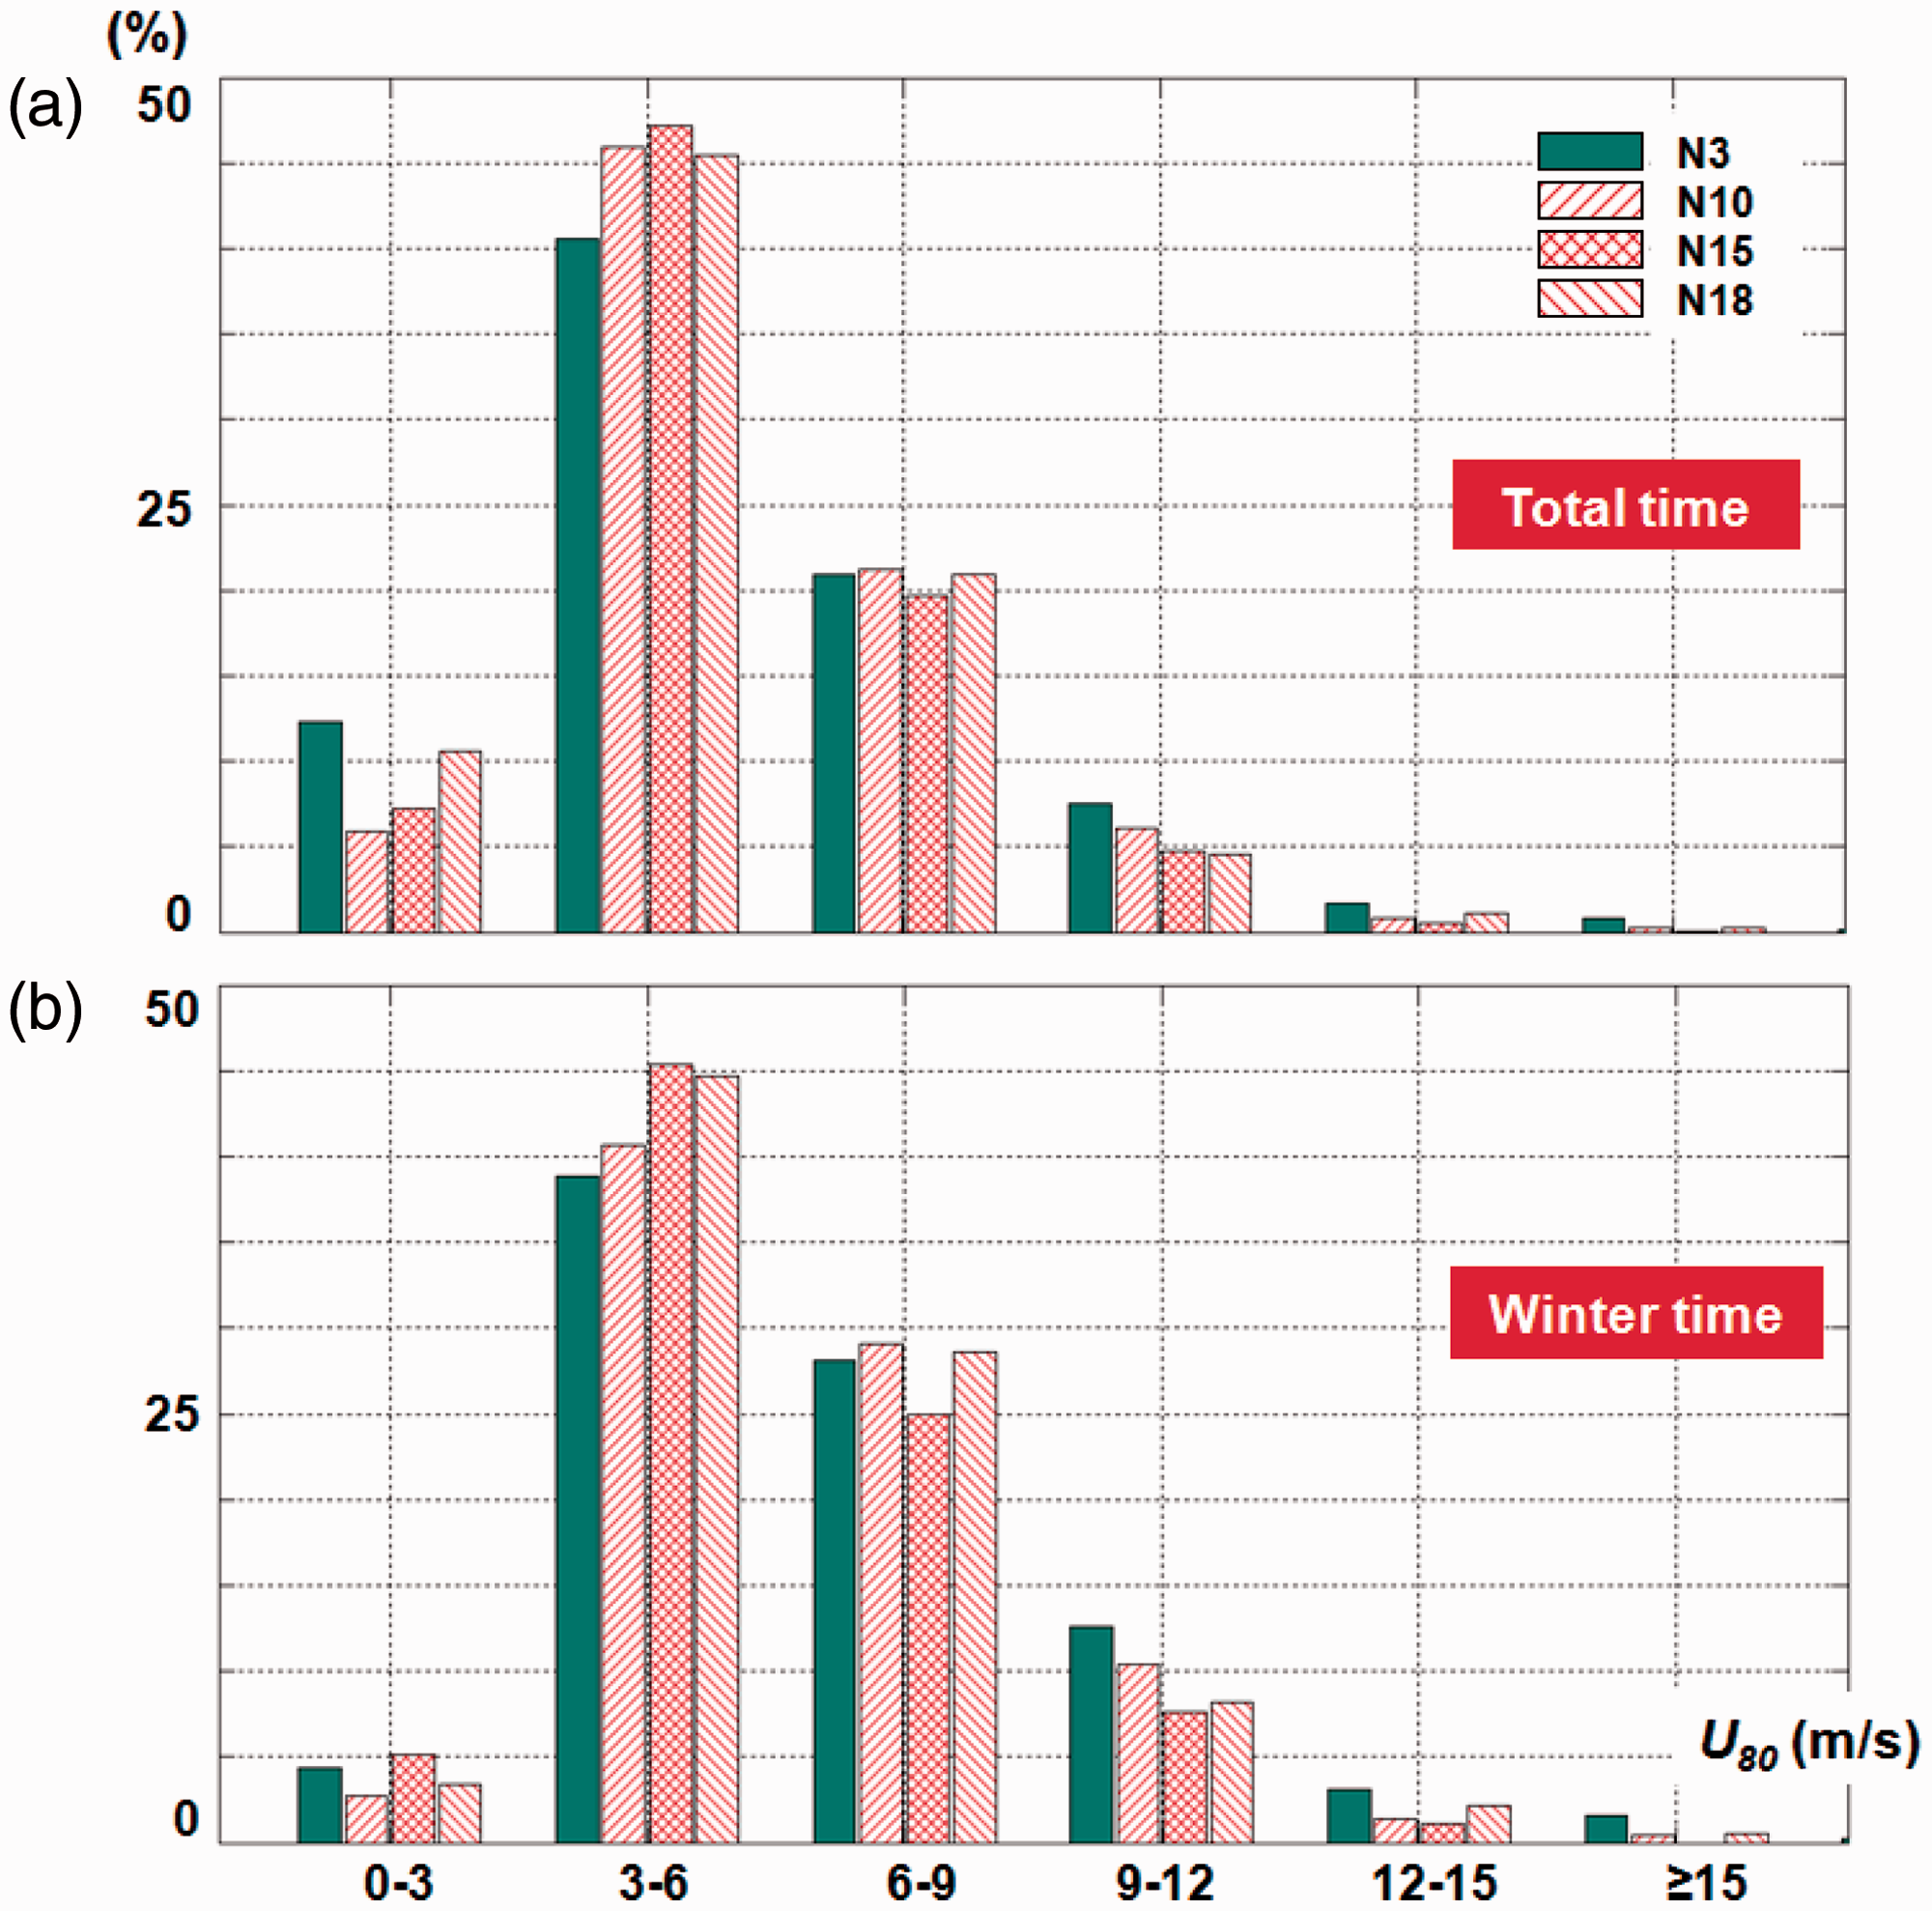
Overall statistics of the remotely sensed data registered in the Mediterranean Sea, in nine reference points.
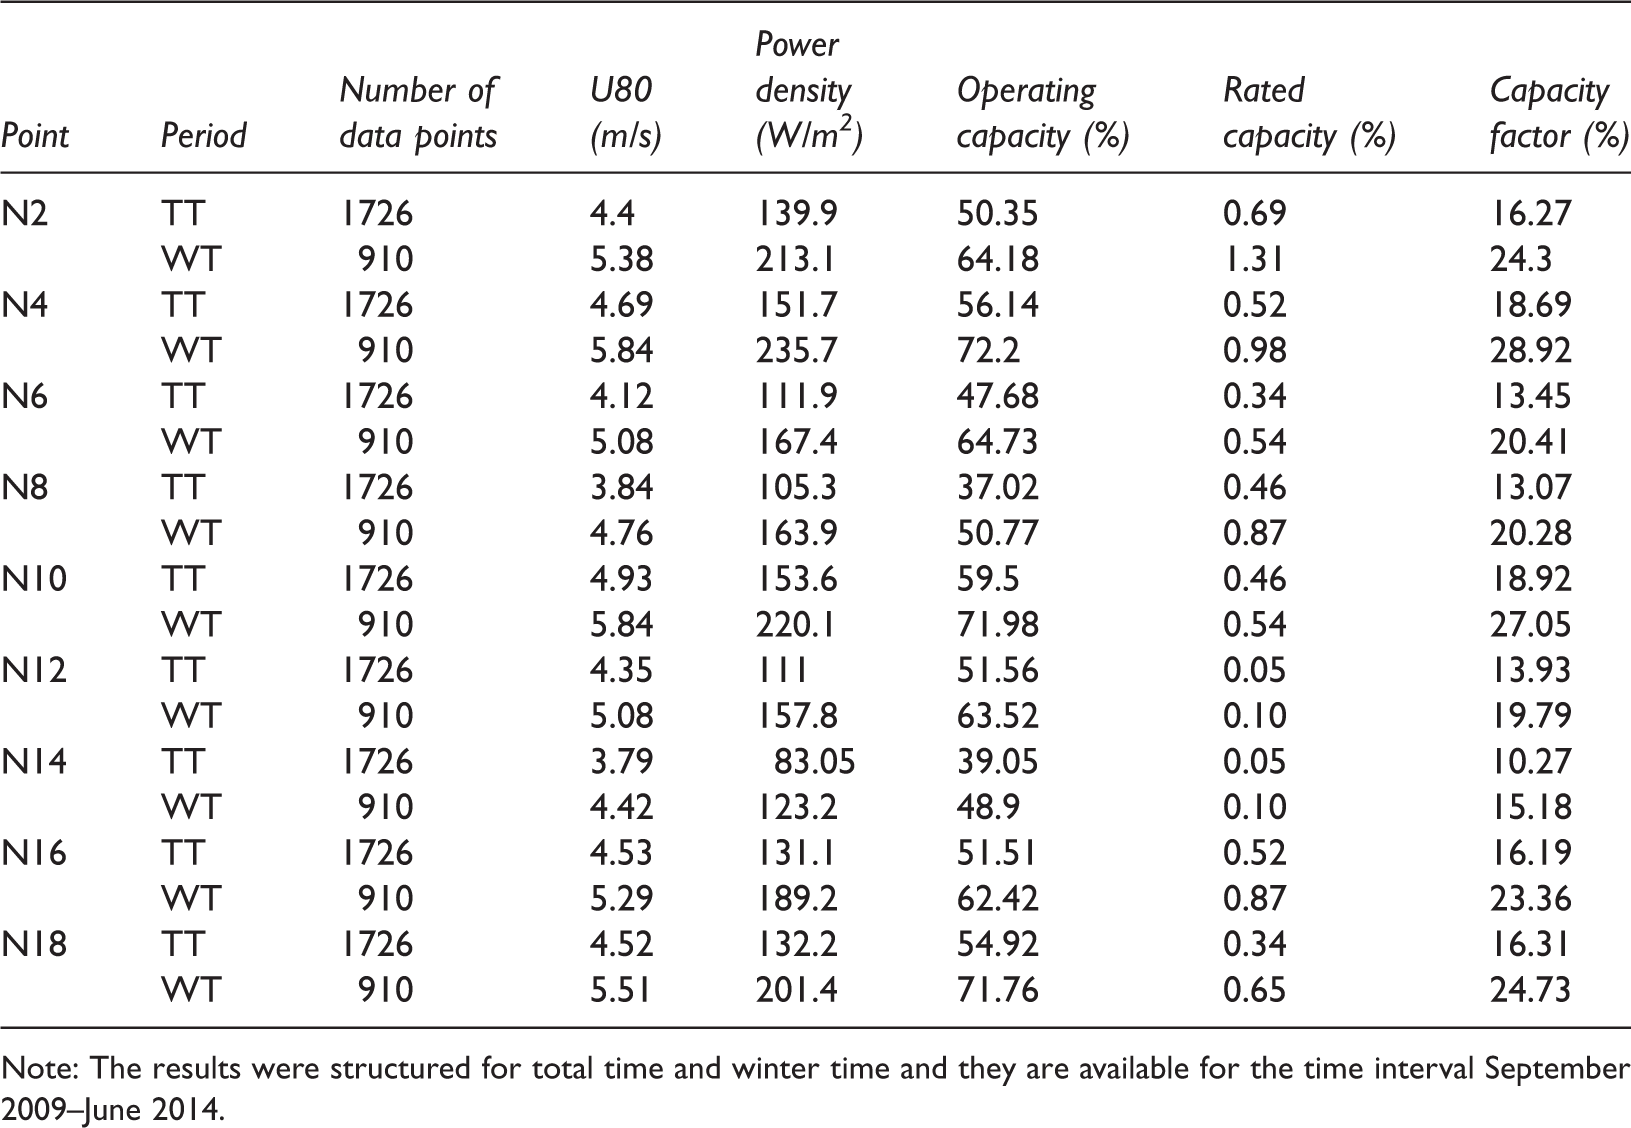
Note: The results were structured for total time and winter time and they are available for the time interval September 2009–June 2014.
Another way to assess the performances of a wind turbine is throughout the capacity factor (CF ), which can be defined by the relationship

Regarding the operating capacity, the points N4, N10, and N18 present higher values during the winter time, which are close to 72%, while, from this point of view, the points N8 and N14 cannot be considered suitable for an offshore project since they have much lower values (≈50%). During the total time, the point N10 does not exceed 60%, as compared to N8, which reports a value of 37%. For the rated capacity index, it can be observed that although the point N2 was not considered to be very energetic, it is the only one which reports a maximum of 1.31% (winter time). This is followed by N4 with 0.98%, during the same time interval, while a value of 0.87% is noticed close to N8 and N16, respectively. According to the characteristics of the Vestas V90-3.0 system, it can be mentioned that during the total time, this turbine can report values of ≈18.8% – N4 and N10, 16.3% – N2 and N18, and 13.1% – N8. During the winter time, the point N4 presents a maximum of 28.9%, being followed by N10 – 27%, N2 and N16 ≈24%, and N8 and N12 ≈20%. On an opposite side, much lower values are accounted by N14, with 10.27% and 15.18%, for the total and winter time, respectively.
At this point it has to be highlighted also the choice of considering the Vestas V90 3 MW wind turbine in the present work. Thus, at this moment the Mediterranean Sea presents an increasing interest from the point of view of the wind energy extraction with various plans for offshore wind projects development. Despite this, it is not yet very clear the type of wind turbine that would be more appropriate for this region. Nevertheless, from the information provided by MedPAN (MedPAN, 2016), it is estimated that the Mediterranean countries have in view the implementation of some project that will use wind turbines in the range of 2.5–3.5 MW. As a consequence by using Vestas V90 3 MW wind turbines, a relatively good performance is expected in comparison with the other wind turbines. This turbine is already used with good results in some operational projects, as Thanet (UK) with 100 such turbines. Moreover, by considering the theoretical characteristics and the specific power curve, the performances of other types of turbines can be also identified. Furthermore, the work is still ongoing and the next target is to perform a comparison with several other state-of-the-art types of wind turbines.
Evaluation of the reanalysis dataset
In Figure 6, the wind roses are presented for the ECMWF and NCEP datasets corresponding to a 5-year interval (2004–2008). Both datasets present similar features for the wind directions, except for the point N1 located in the Alboran Sea (west of the basin). There the ECMWF model indicates the west and east directions as being dominant, as compared to NCEP, which highlights the northeast and the Southwest sectors, respectively. From the analysis of the ECMWF data, it can be mentioned that, for the points N3 and N8, the prevailing winds are from the land area (northern sector), as compared to N13, N15, and N17, where the dominant direction is from the sea. The points N6 and N10, located in the center of the basin, indicate the northwest sector as dominant, with the mention that N10 also reports conditions from the northeast and also values located close to 9 m/s. Regarding the NCEP data, it can be mentioned that in the vicinity of the point N3, the wind conditions from the northeast and the Southwest are also more frequent. For N8, the Southeast winds seem to be more relevant. For the point N13, the Southwest represents the dominant direction, while for the point N17, the wind conditions are divided between the northeastern and the southern sectors. In terms of the wind speed, both models (ECMWF and NCEP) indicate the points N3, N8, and N10 as being more energetic (values close to 9 m/s), with the mention that NCEP also includes the point N13 in this category. For the remaining points, the wind conditions located under 6 m/s represent common events, especially in the case of N17, which is located close to the Tripoli area (Libya).
Wind roses in several relevant reference points (N1, N3, N6, N8, N10, N13, N15 and N17) based on: (a) ECMWF data and (b) NCEP data. The datasets used for the analysis correspond to the five-year interval (2004–2008).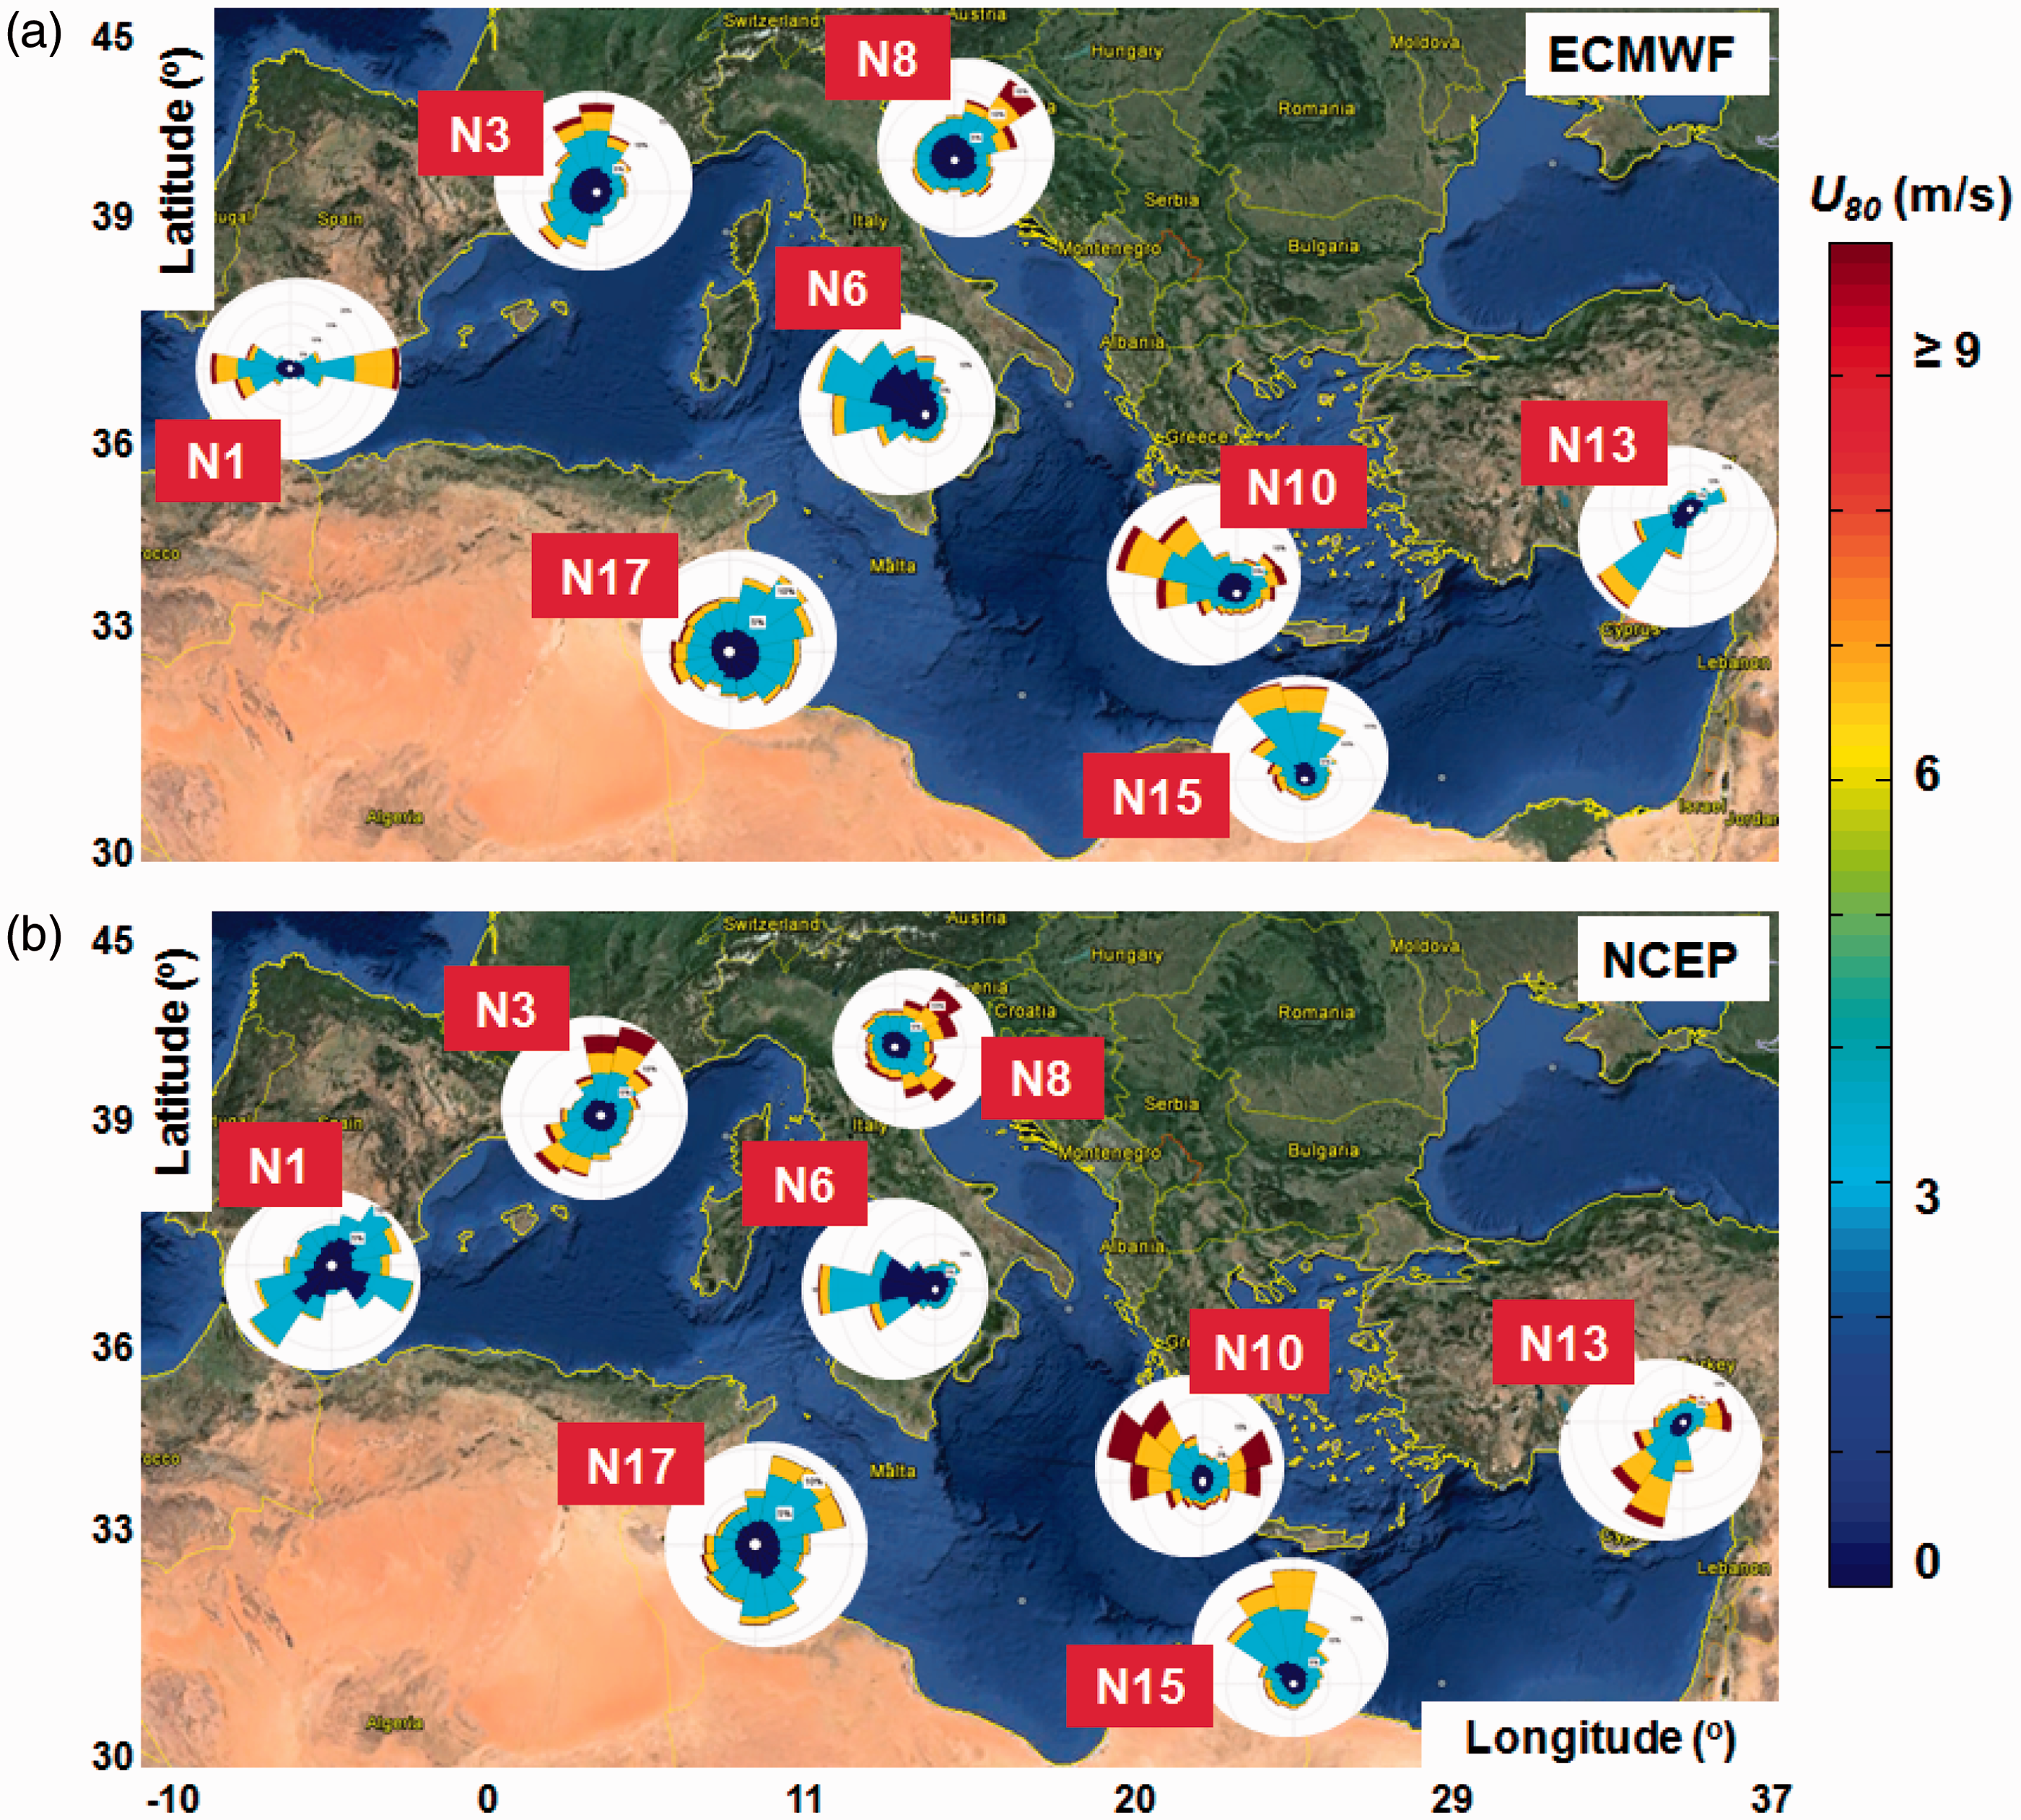
Figure 7 presents the distribution of the mean wind speed (the left legend) and the power density (the right legend), reported by the ECMWF and NCEP models at an 80 m height above sea level, for different time periods, which cover in total 15 years of data (1999–2013). From the analysis of the ECMWF data, it can be noticed that the points N4, N7 and N11 reveal more energetic peaks, presenting values located in the interval 6.34–6.94 m/s for the wind speed and 332–417 W/m2 for the power density, during the total time. During the winter time, these values may increase by almost 11% in N4 and N11, while N7 reports an increase of 16%. From the southern sector, the point N16 also reports some significant values, being characterized by a maximum of 6.48 m/s (total time) and 260.8 W/m2 (winter time). Much lower values are accounted for by the points N6, N8, and N12. They present wind conditions in the range of 3.35–4.72 m/s and a power density between 37.9 and 177.8 W/m2, during the total time.
Reanalysis data, average wind speed (at 80 m height) and power density (at 80 m height) corresponding to the total and the winter time intervals, based on: (a) ECMWF data (10-year time interval 2004–2013) and (b) NCEP data (10-year time interval 1999–2008).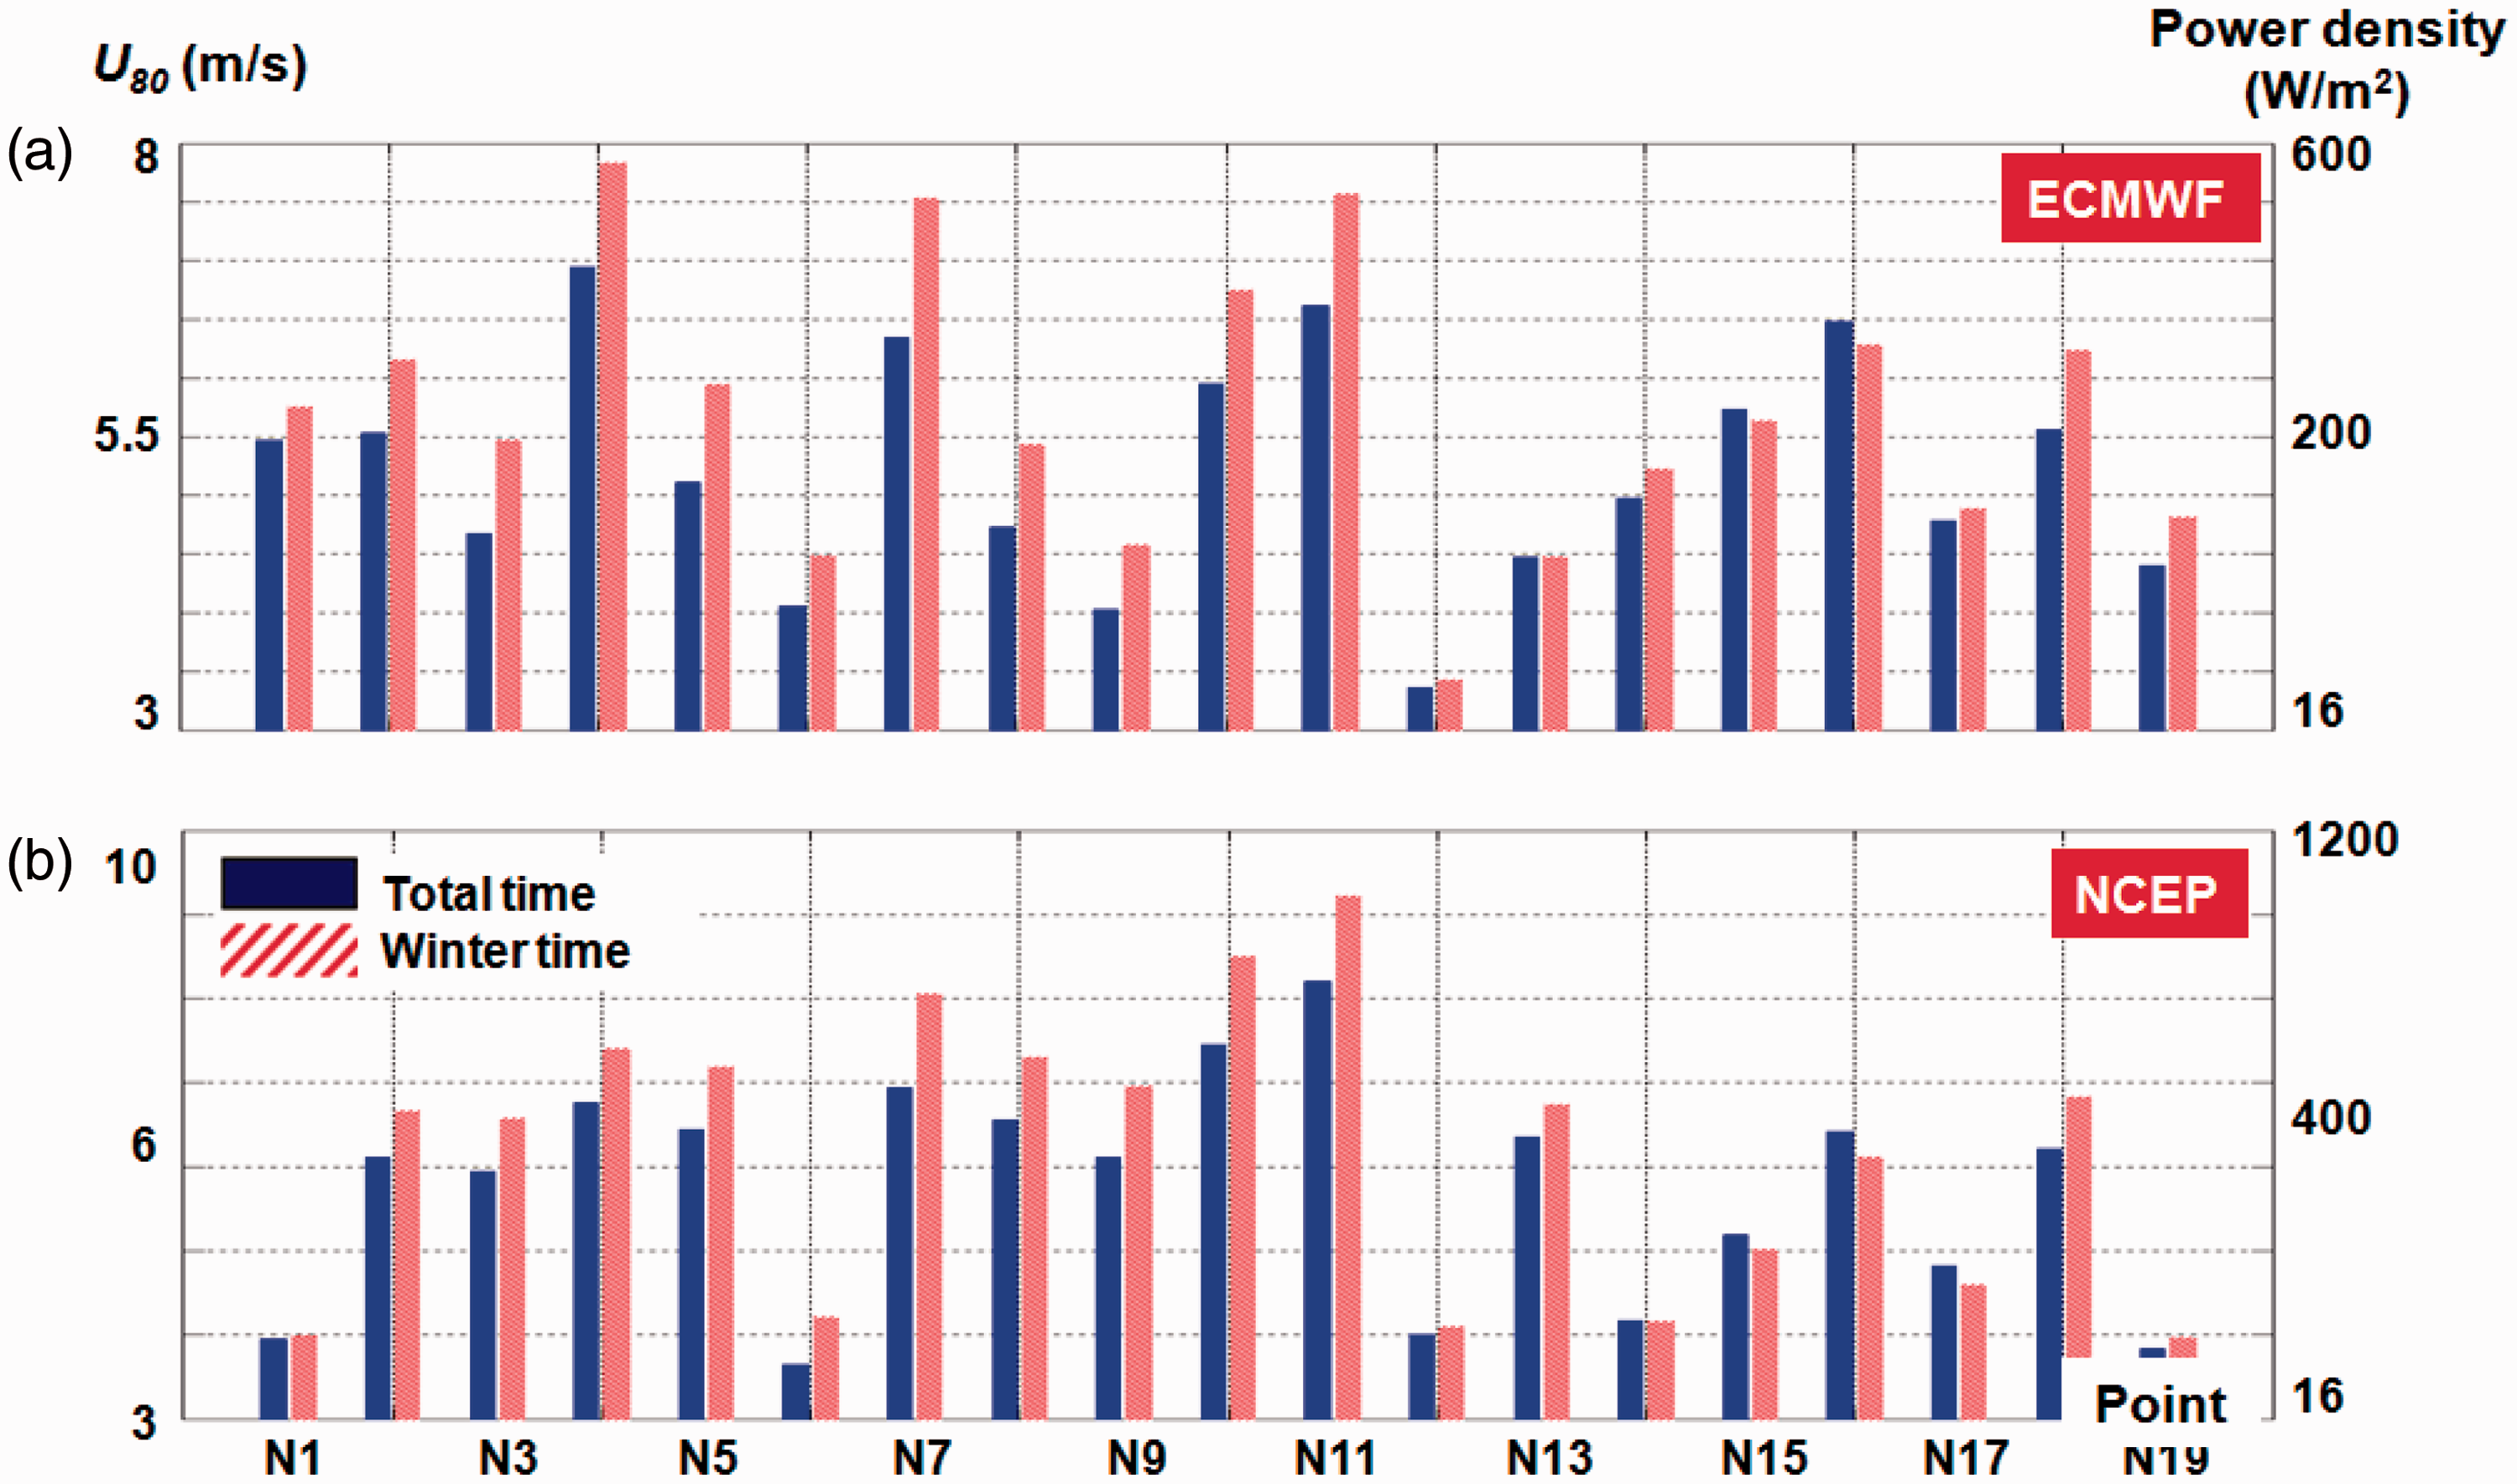
Regarding the NCEP data, the points from the central and the northeastern parts of the sea (N7, N10, and N11) present much higher values. Less energetic conditions are indicated for N1, N6, N12, N14, and N19, which typically do not exceed values of 4.2 m/s and 84 W/m2, during the total and winter time, respectively. The group points N2–N5, located in the eastern part of the Mediterranean Sea, also present some consistent wind conditions. They may reach during the winter time maximums of 7.4 m/s and 512.2 W/m2, respectively. Reported to these results, the point N11 indicates values of 8.2 m/s and 748 W/m2 (total time) which may significantly increase to 9.2 m/s and 1061 W/m2 (winter time).
Considering the two reanalysis datasets, Figure 8 presents the wind speed histograms (in percentage) for the points N3, N10, N15 and N18, taking into account only the total time period. In general, the wind conditions in the interval 3–9 m/s occur more frequent. In the interval 3–6 m/s, the ECMWF model indicates a value located close to 60% for N3, during the total time. During winter time, N3 and N15 report values located close to 50%, in the same wind speed interval (3–6 m/s). According to the NCEP data, the point N15 reports a peak of 52% (total time) and 56% (winter time) for the interval 3–6 m/s. Comparing to the ECMWF data, it can be noticed a significant presence of the wind conditions higher than 15 m/s.
Wind speed histograms (%) based on the reanalysis data, considering the 10-year time intervals 2004–2013, for ECMWF data and 1999–2008 for NCEP, respectively. Analysis reported for: (a) and (c) total time; (b) and (d) winter time.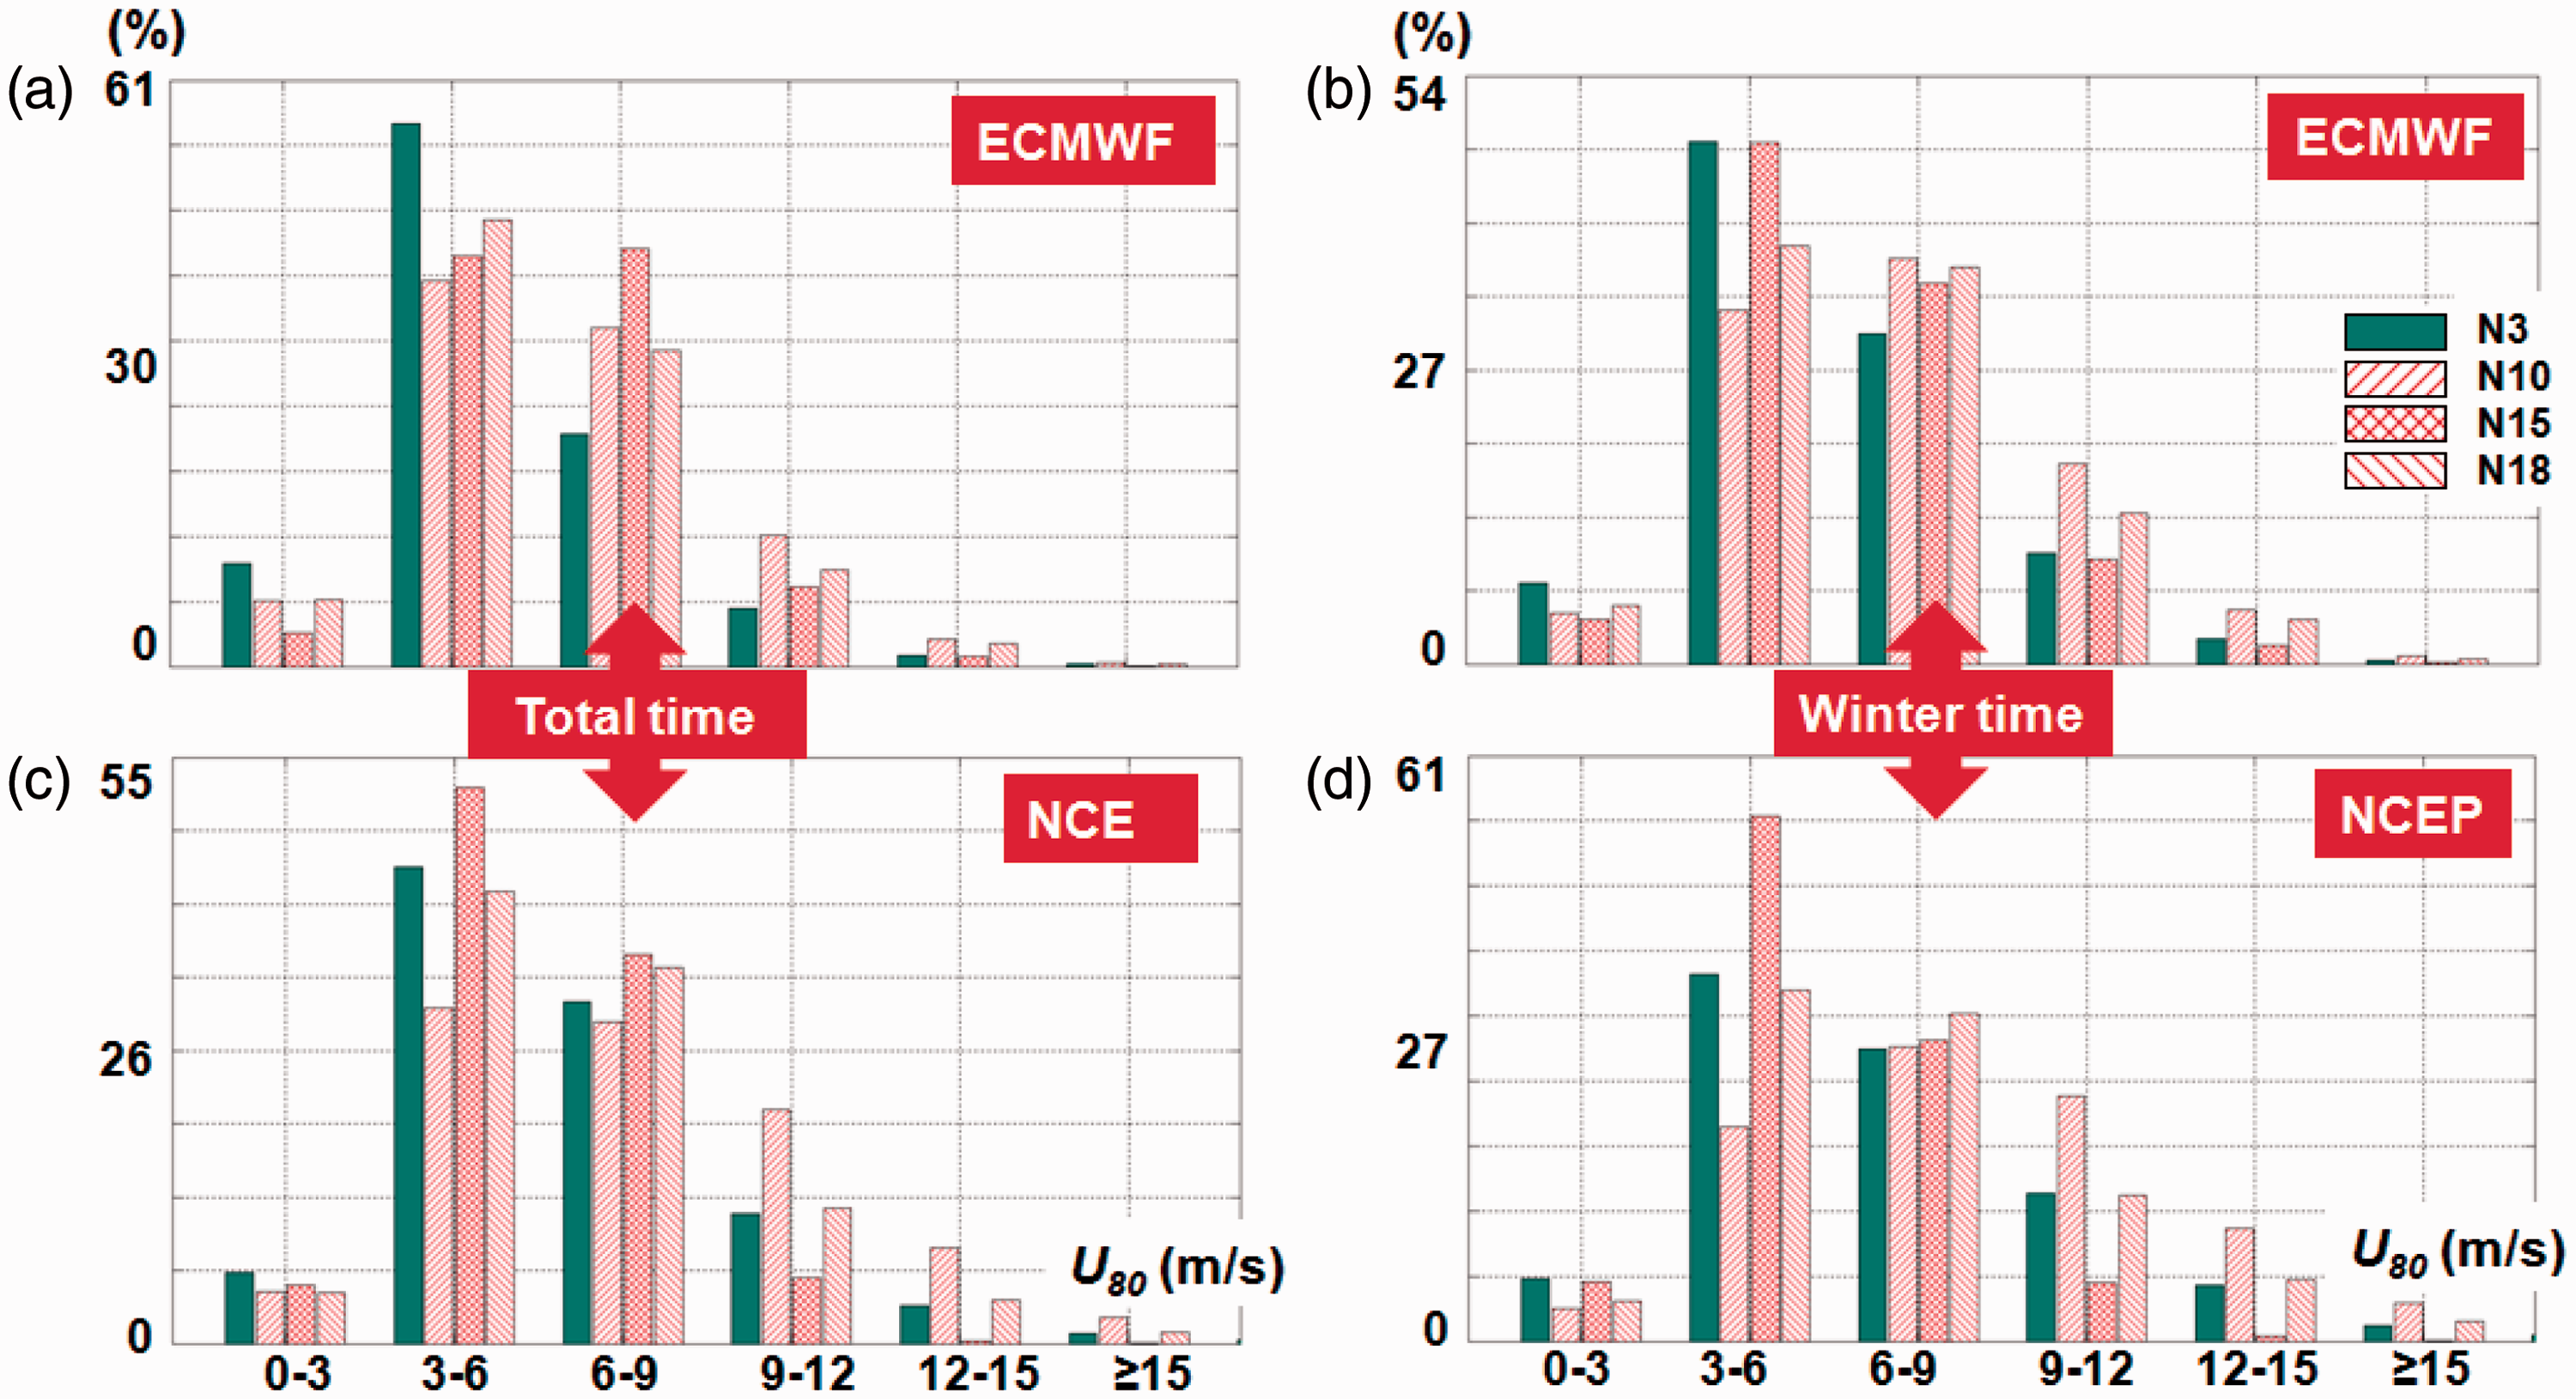
The wind conditions along the Mediterranean Sea, as reflected by the ECMWF data.
Note: Statistical results evaluated for total time and winter time, respectively, corresponding to the time interval January 2004–December 2013.
The Vestas V90-3.0 wind turbine can operate at 86.44% of the total time in N16, but it has only a rated capacity of 0.28%. This may lead to a capacity factor of 32.06% as compared to a rated capacity of 3.28% reported in N4. This allows for the turbine to reach a maximum capacity factor of 48.01%. For the winter season, much better performance is noticed in N4. This has a rated capacity of 5.74% and can reach a capacity factor of 62% and an operating capacity rate of 85.48. On the other hand, the point N12 presents much lower values (both in total and winter time), with an operating capacity around 45%, no values for the rated capacity, while the capacity factor does not exceed 6%.
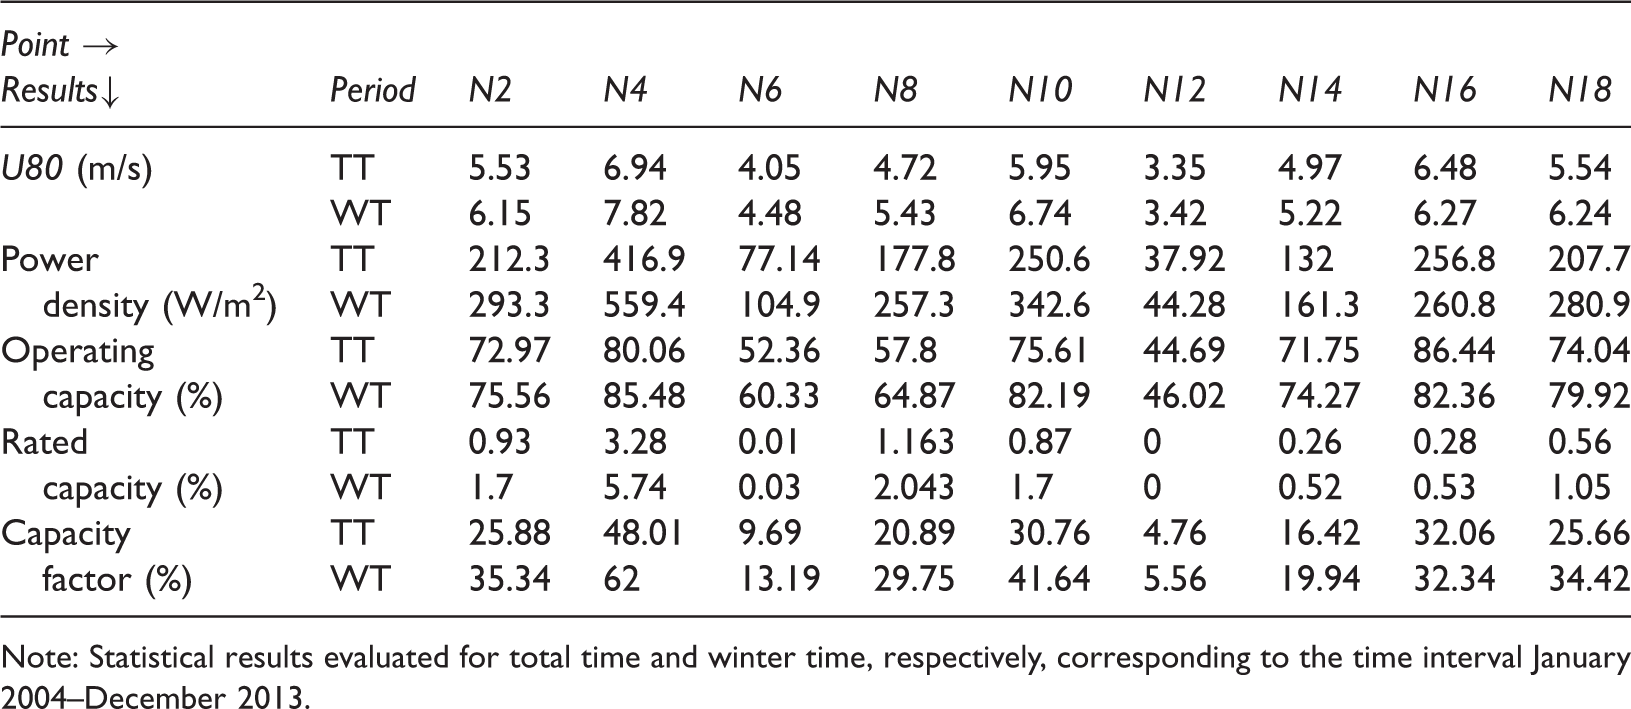
The wind conditions along the Mediterranean Sea as reflected in the NCEP data.
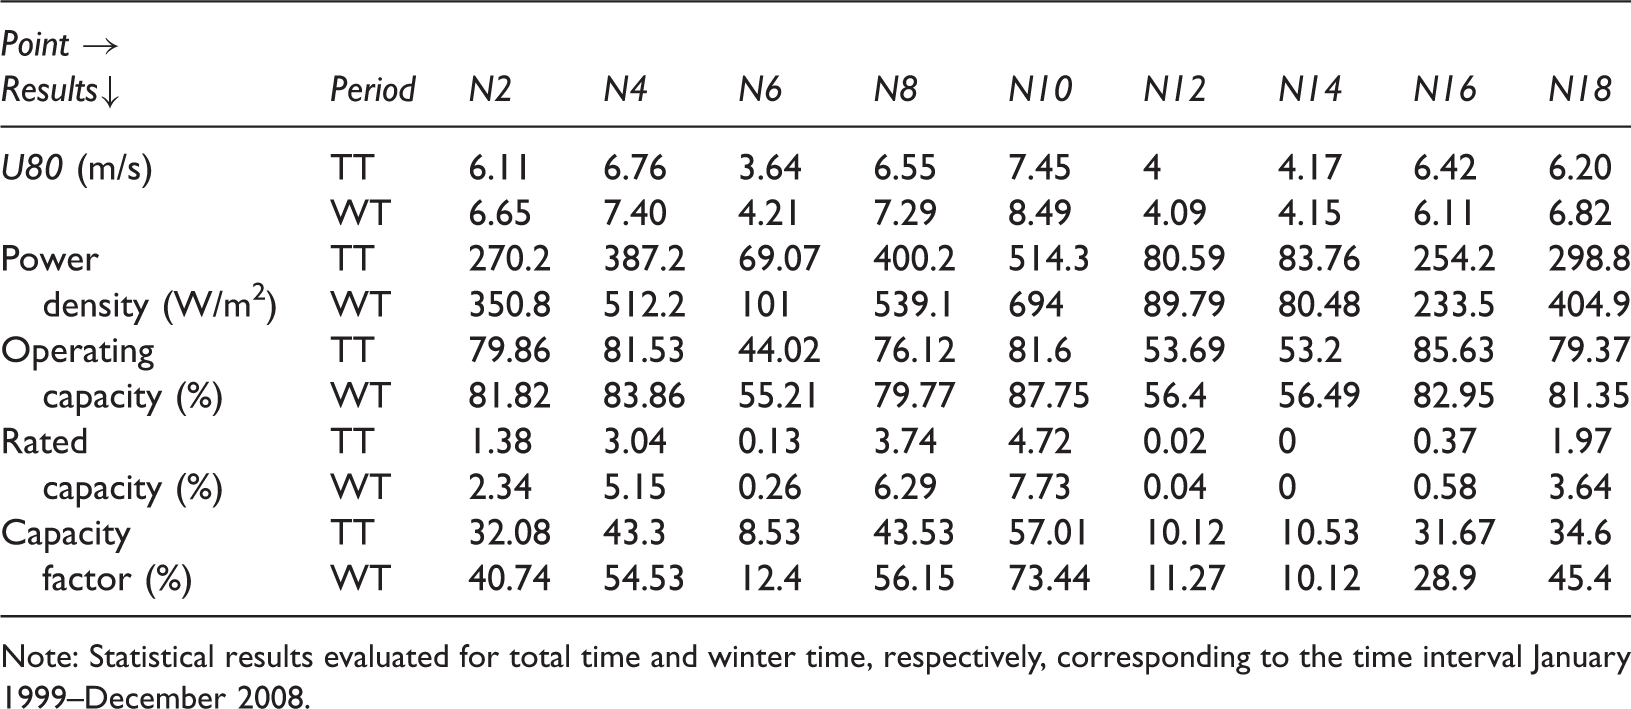
Note: Statistical results evaluated for total time and winter time, respectively, corresponding to the time interval January 1999–December 2008.
In Figure 9, the performances of the Vestas V90-3.0 system are assessed for all the reference points based on the ECMWF and NCEP data. It is important to mention that the two data sets are defined by different time intervals. Thus, a direct comparison for each point cannot be considered to be very useful. Instead, the main purpose is to provide a general overview of the local conditions, considering at least 10 year of data (for each dataset). From the analysis of the operating capacity, it can be noticed that both datasets indicate the points N12, N6 and N19 as being less energetic (<47%), mentioning that, although the NCEP model also includes the points N1 and N14 in this category, the ECMWF model does not reflect this aspect. In general, it can be noticed that both models predict quite well the wind conditions from the central part of the sea (N4, N7, N10, or N18). There, a maximum operating capacity of ≈85% can be reported in N7, N10 or N16. Although the winter season can be considered to be more energetic, from the analysis of the NCEP data, it can be noticed that some points (mostly in the southern part) may present much higher values during the total time, such as N1 (57.45%), N15 (75.83%), N16 (85.63%), and N17 (69.2%). For the ECMWF data, only the point N16 (86.44%) reports this characteristic. From the analysis of the rated capacity index, it can be noticed that the NCEP model presents much higher values for the point N11, which reports 9.32% during total time and 15.2% in the winter season. This is followed by N10 with a maximum of 7.7% during the winter season. The rest of the points do not exceed 3.9% during the total time and 6.5% in the winter. The ECMWF data reveal three energetic peaks in N4, N7, and N11, which, during the winter season, report values of 5.7%, 4.4%, and 6.1%. The group points N14–N17 present values close to zero (similar to the NCEP data). In this case, the ECMWF dataset presents values much lower than the ECMWF model, at the same time indicating more points where the wind turbine will report a lower efficiency. As concerns the performances of the turbine expressed in terms of the capacity factor, it can be noticed that the ECMWF and NCEP models indicate, in general, similar reference points as being more energetic (N4, N7, N11, or N18) and also points with much lower potential (N6, N12, or N19), although the results are reported for different time intervals. In this case, much higher value can be observed during the winter time, when the NCEP model indicates N11 as being more energetic (90.2%). From the ECMWF data, there can be mentioned the points N4, N7, or N11 (≈60%).
Assessments of the Vestas V90-3.0 wind turbine performances based on reanalysis data. The results are based on the ECMWF data (2004–2013) and the NCEP data (1999–2008) and they are indicated in terms of the average values of: (a) operating capacity (%); (b) rated capacity (%); (c) capacity factor (%).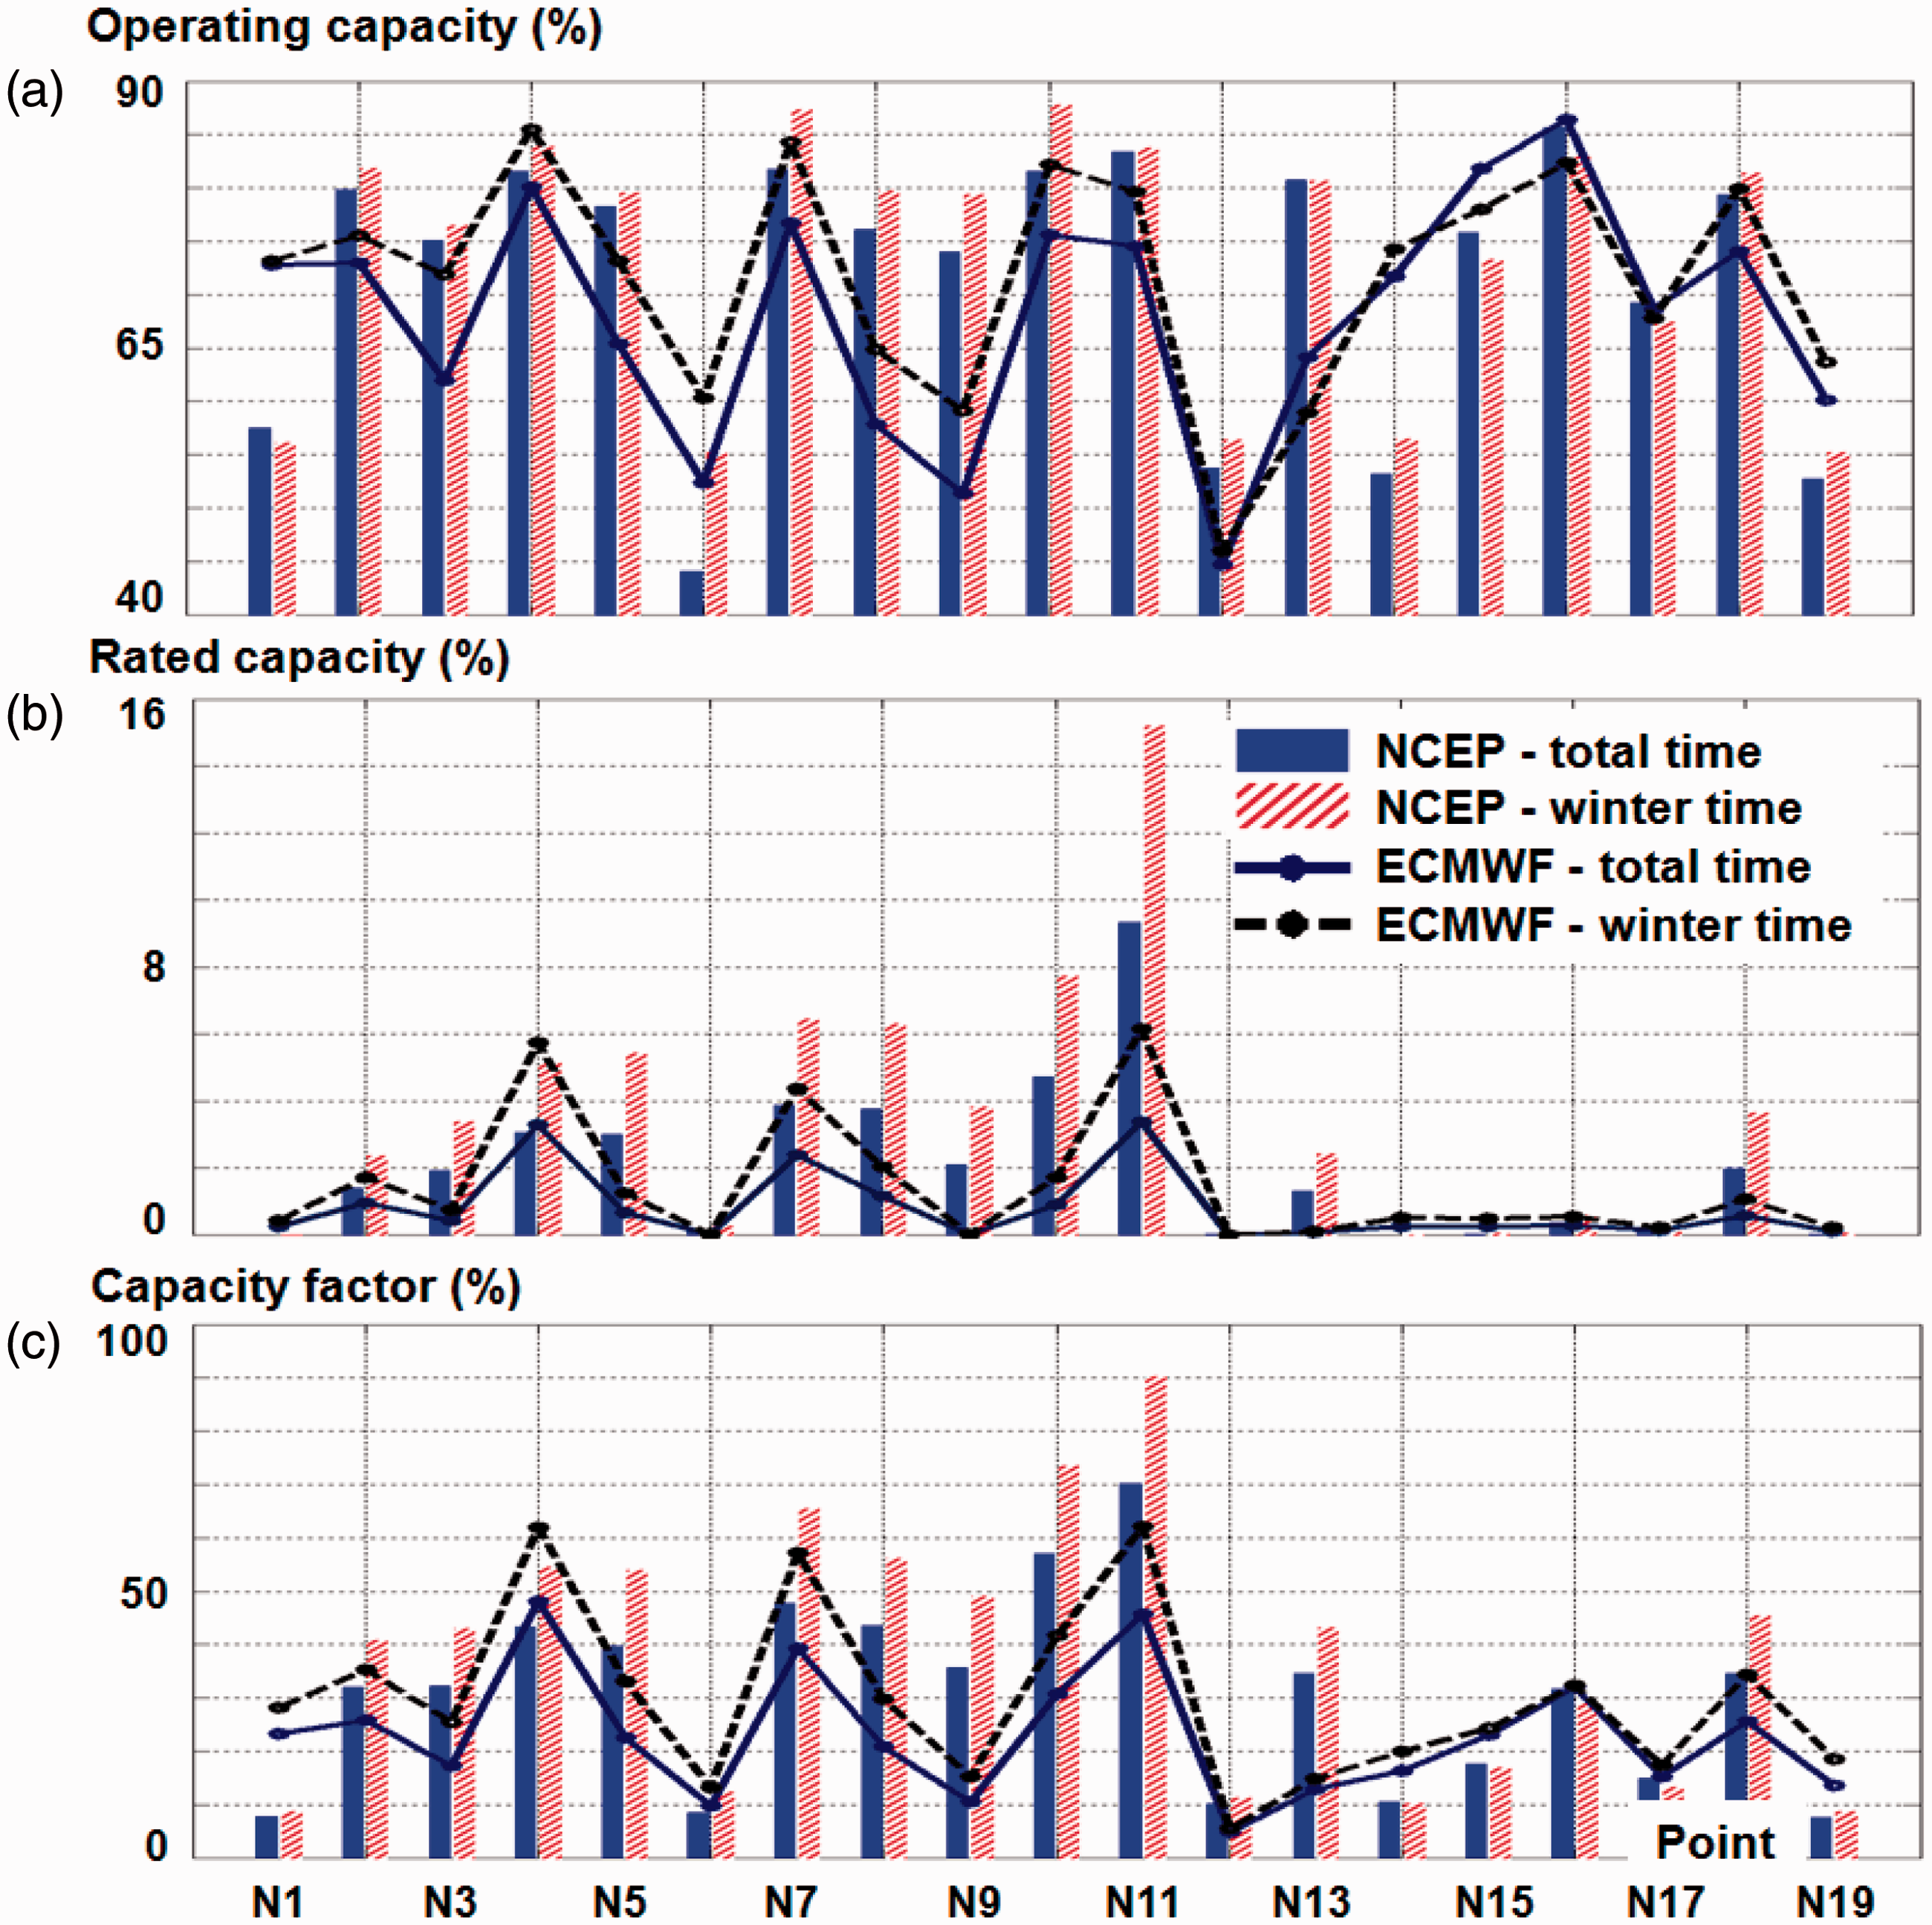
Discussion of the results
In the Mediterranean Sea, there is no offshore wind park currently operating and the purpose of the present work is to identify some suitable conditions for such projects. From this perspective, this section will focus on performing various comparisons between the local wind conditions and those encountered in the northern part of Europe, where offshore farms operate or are planned to be installed in the near future. From the Mediterranean Sea area, three points were considered for evaluation. These are: N3 – selected based on the satellite results; N10 and N18 – indicated by the ECMWF and NCEP data, which present a relatively significant wind energy potential. The information regarding the offshore wind projects has been obtained from the 4C Offshore website (4C Offshore, 2014) and consists of details related to the position, the capacity, and the distance to the shore.
In order to carry out this analysis, the satellite data were used for the evaluation. Since almost 146 offshore projects (from Belgium, France, Germany, or the Netherlands) were taken into account, only four years of data have been considered (January 2010–December 2013). By screening the results, three categories of offshore projects were considered for comparison in relationship with the N-points, namely: (a) operating projects with similar wind conditions; (b) approved projects with similar conditions; (c) operating projects defined by higher wind conditions.
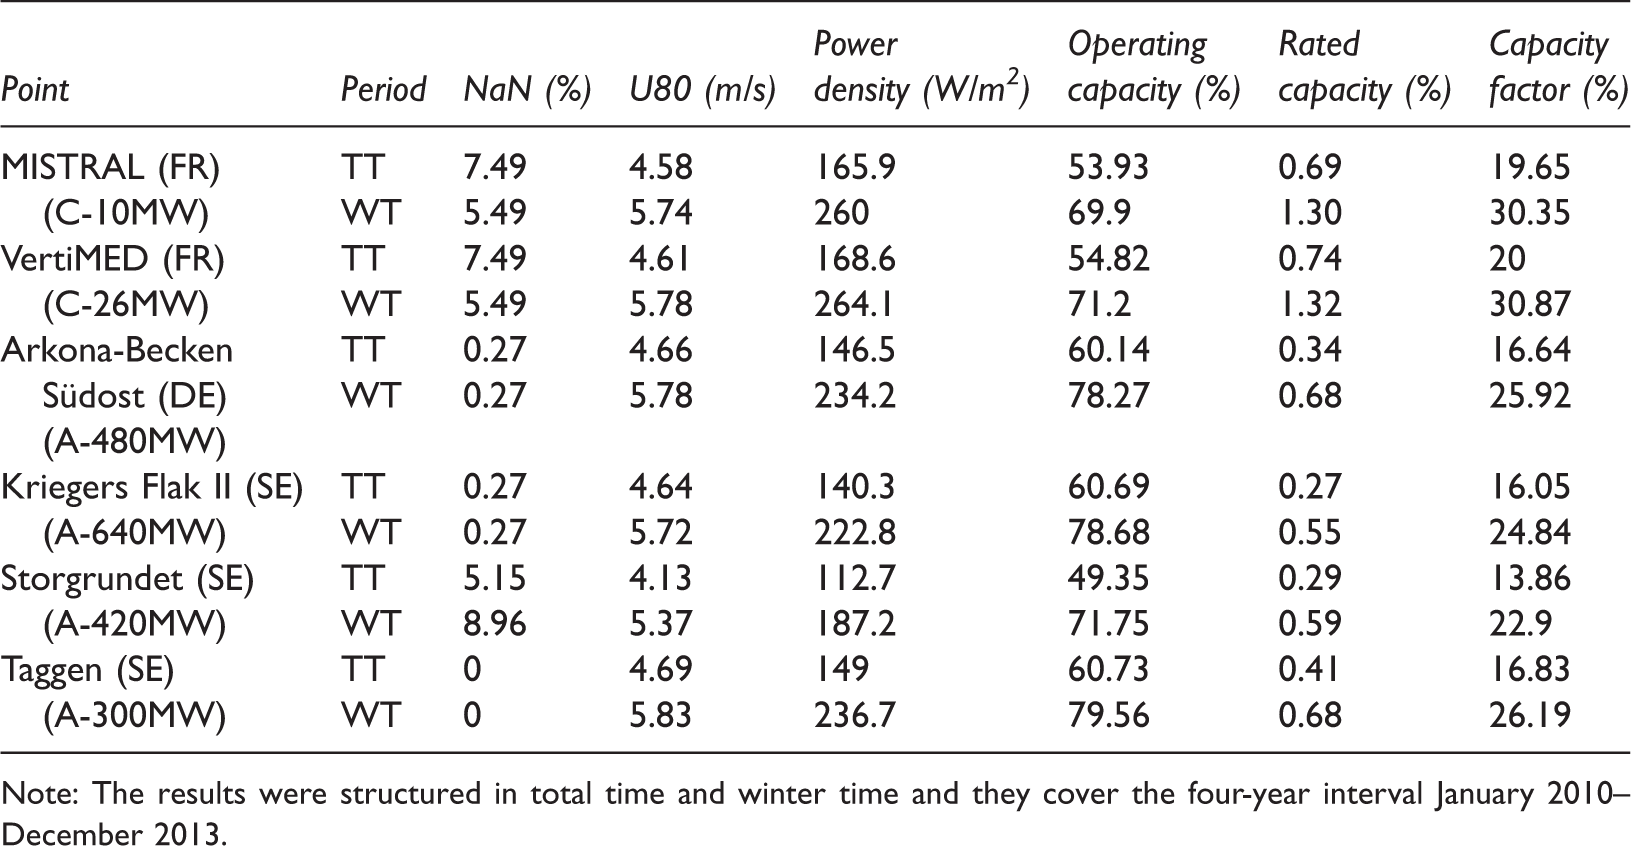
Overall statistics of the remotely sensed data corresponding to three reference points from the Mediterranean Sea (N3, N10 and N18) and to the locations of six operational offshore wind farms.
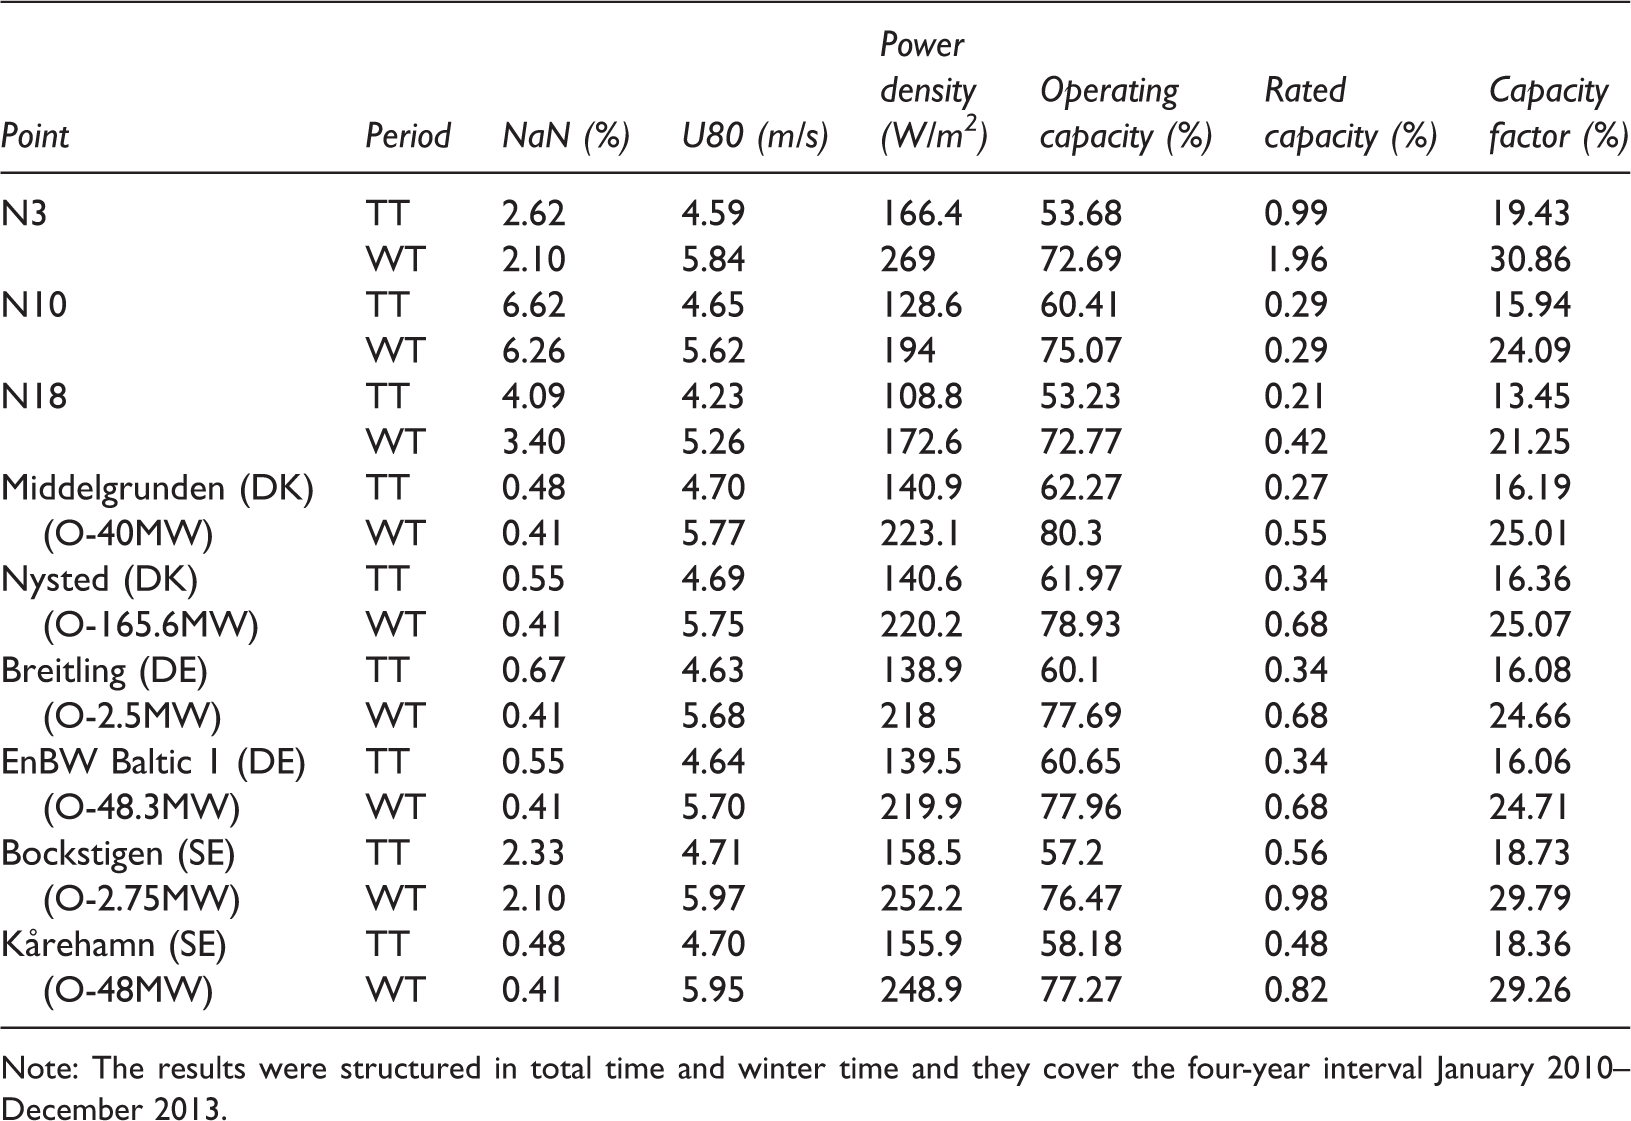
Note: The results were structured in total time and winter time and they cover the four-year interval January 2010–December 2013.
From the analysis of the U80 parameter, it can be noticed that, during the total time, the points N3 and N10 present similar values with the offshore locations like Breitling and EnBW Baltic 1, where there is an installed capacity of 2.5 MW and 48.3 MW, respectively. Concerning the winter season, the point N3 exceeds most of the points and it is relatively close to the projects Bockstigen (2.75 MW – capacity) and Kårehamn (48 MW), respectively, from Sweden. In terms of power density, the point N3 exceeds all the points (both in total and winter time), in this category entering the projects Middelgrunden (40 MW) and Nysted (165.6 MW). In general, the operating capacity of the N-points appears to be lower than in the case of the considered offshore wind projects, which report a maximum of 80.3% in Middelgrunden. The point N3 stands out in terms of the rated capacity. This is followed by Bockstigen with 0.56% (total time) and 0.98% (winter time) and by Kårehamn with 0.82% (winter time). Following these results, it can be observed that the capacity factor corresponding to the point N3 is the highest one. The point N10 presents similar features during the total time with Breitling and EnBW Baltic 1, respectively.
Figure 10 presents the monthly average values of the wind potential, considering all the reference points from Table 6. From the analysis of the U80 index, it can be observed that the N-points present much higher value during the interval February–May and similar characteristics during January, June, July, and August, especially in the points N3 and N10. During the interval January–August, the point N10 presents higher values as compared to N3. This reveals more energetic features during October–November and a peak in February (6.13 m/s). The offshore locations present much higher value during December, when a maximum of 7.68 m/s is observed, as compared to the interval April–August, when they do not exceed 3.5 m/s. A similar trend is observed for the power density, when all the N-points report similar or much higher values, for the interval January–August. The point N3 also indicates significant values for the remaining months registering a peak during November (383 W/m2). Small differences are reported for the operating capacity, where the point N3 is defined by 34.48% in February and 43.78% in November, N10 – 23.2% in March and 35.8% in December, while a maximum of 50.2% is accounted by the offshore projects in December.
Assessment of the wind conditions corresponding to the points N3, N10, and N18 and to several operational offshore wind farm projects. The results are based on the satellite data (at 80 m height) and cover a four-year interval (January 2010–December 2013): (a) average wind speed; (b) power density; and (c) operating capacity.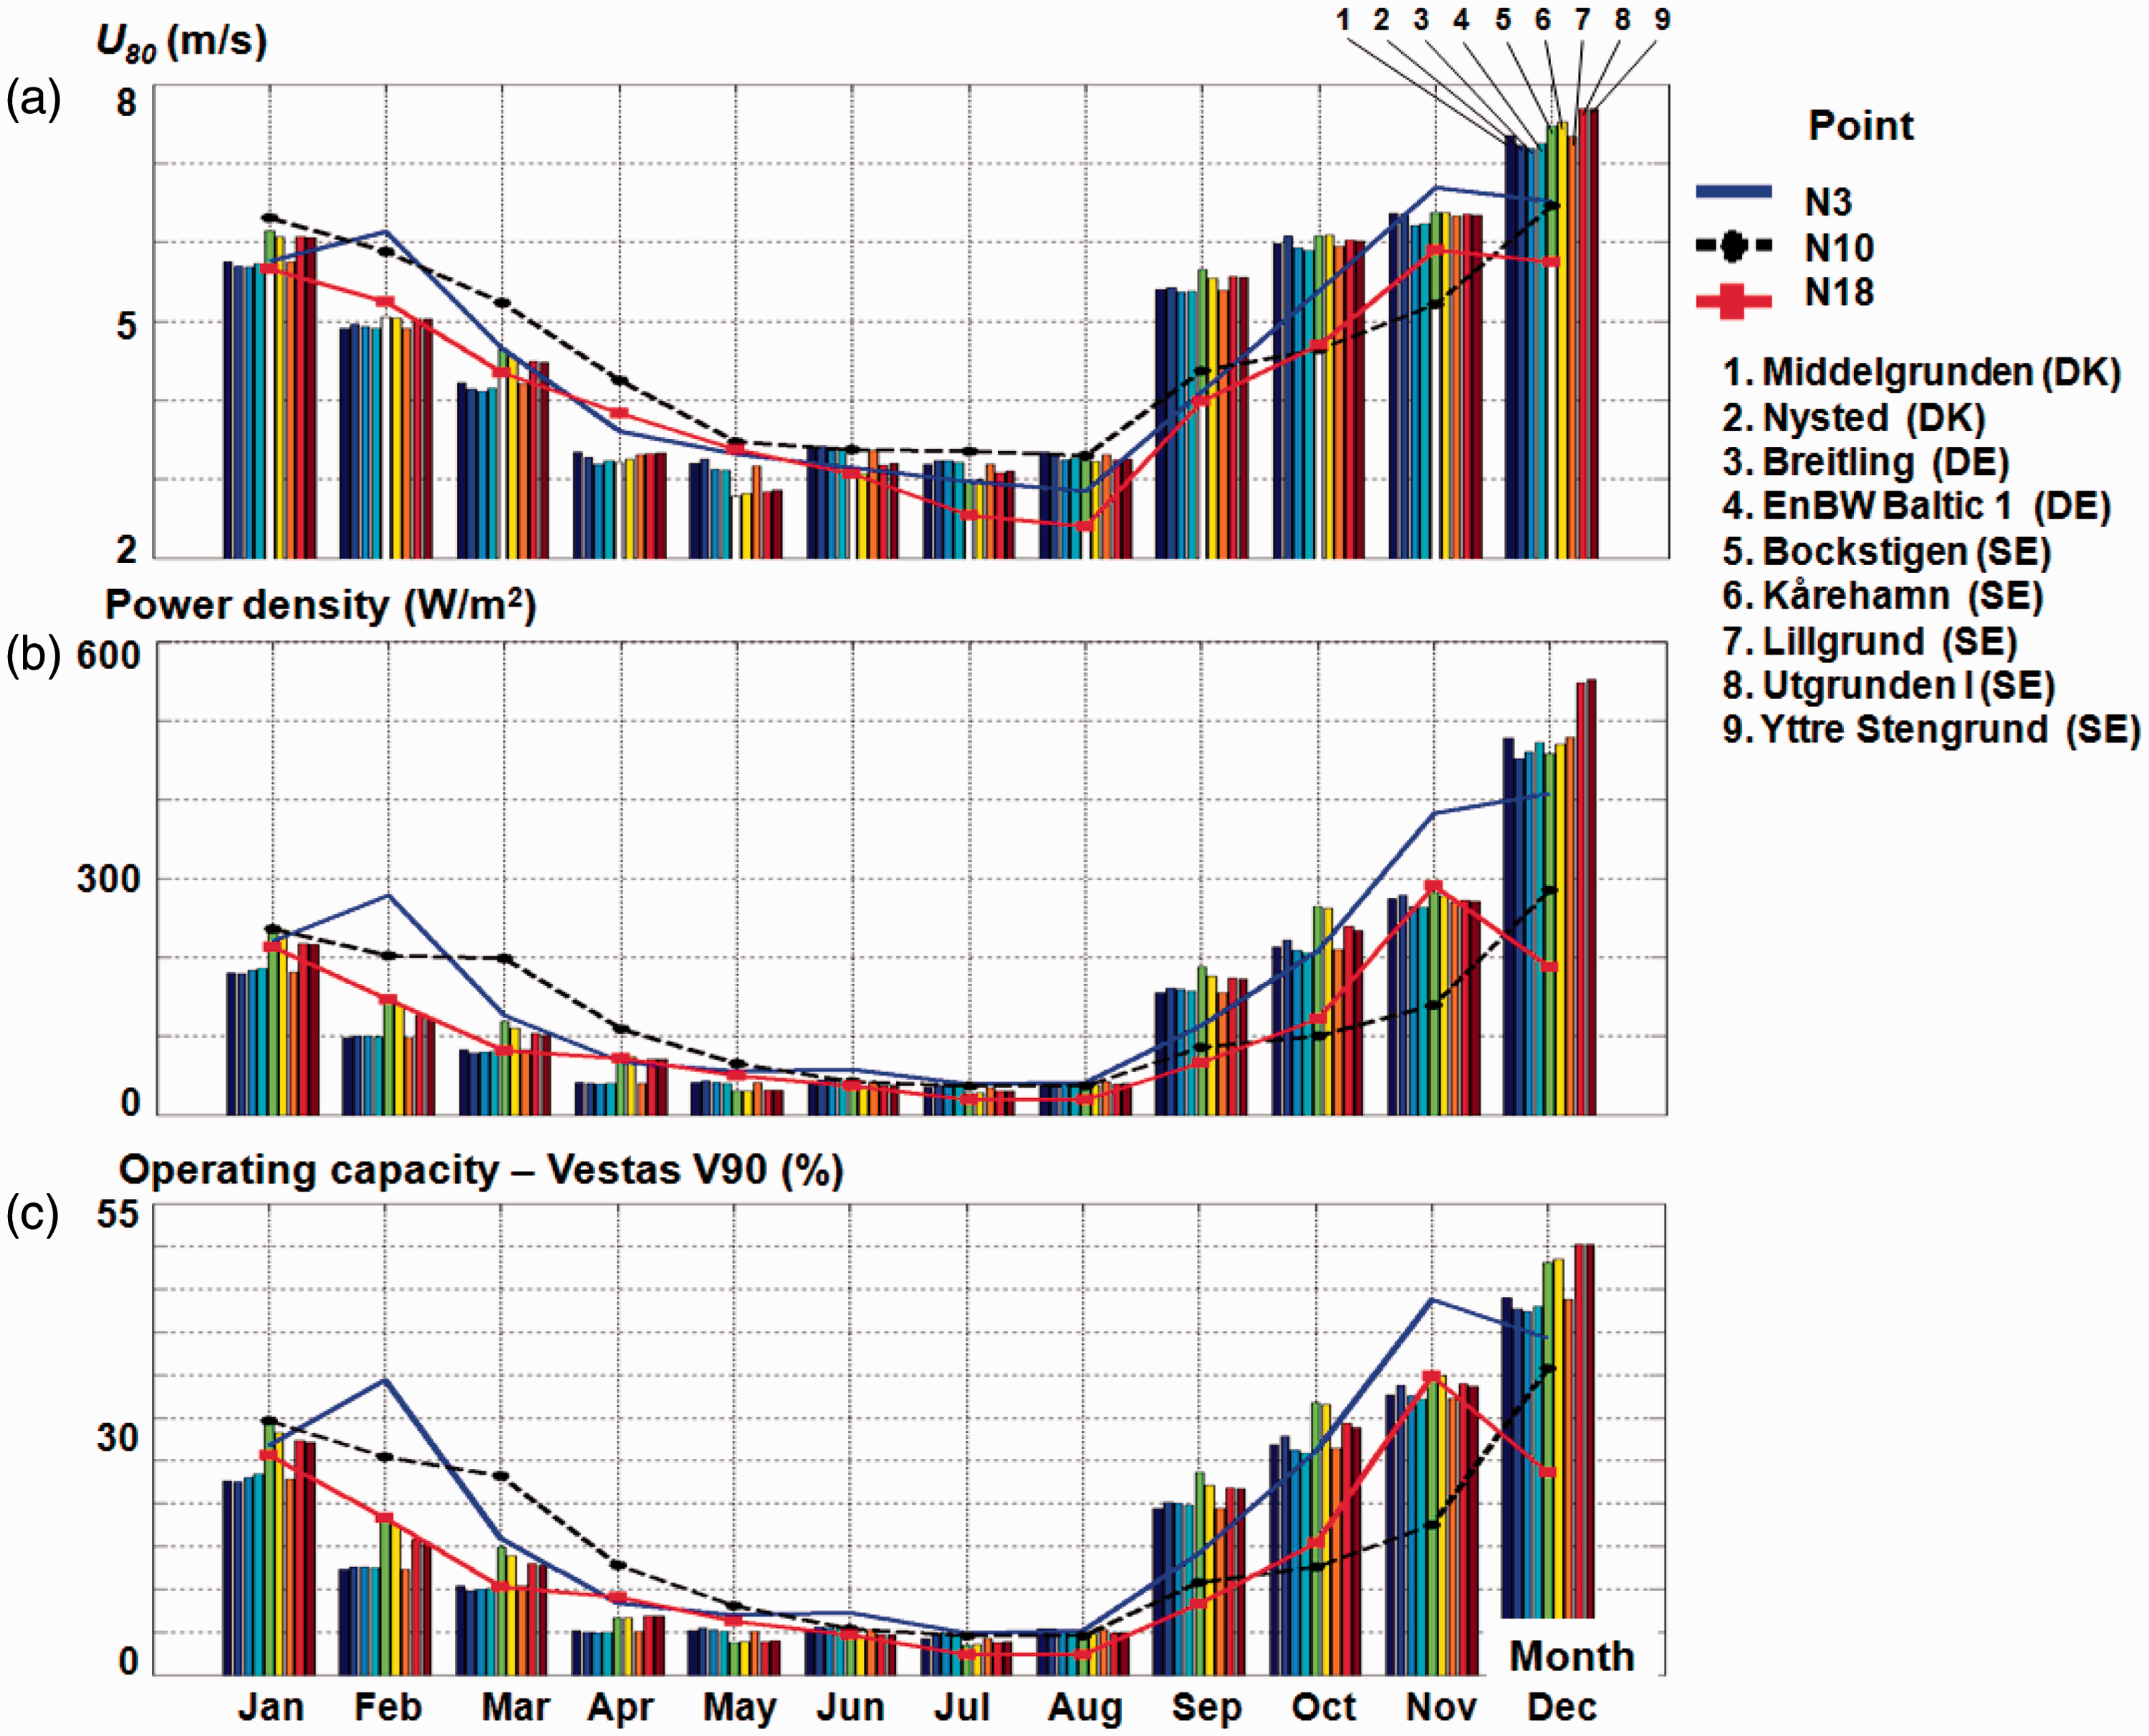
Overall statistics of the remotely sensed data corresponding to the locations of six offshore wind projects approved for implementation close to the European coasts.
Note: The results were structured in total time and winter time and they cover the four-year interval January 2010–December 2013.
In Figure 11, the monthly evolution of the parameters presented in Table 7 is represented, from which it can be noticed a similar evolution with that illustrated in Figure 10 (for the operating projects). During the interval January–May, the N-points present more significant features, while higher wind speed values can be also noticed, especially in the case of the point N3, during November.
Assessment of the wind conditions from the points N3, N10 and N18 and several offshore wind farm projects, which present a consent authorization. The results are based on the satellite data (at 80 m height) and cover the four-year interval (2010–2013): (a) average wind speed; (b) power density; and (c) operating capacity.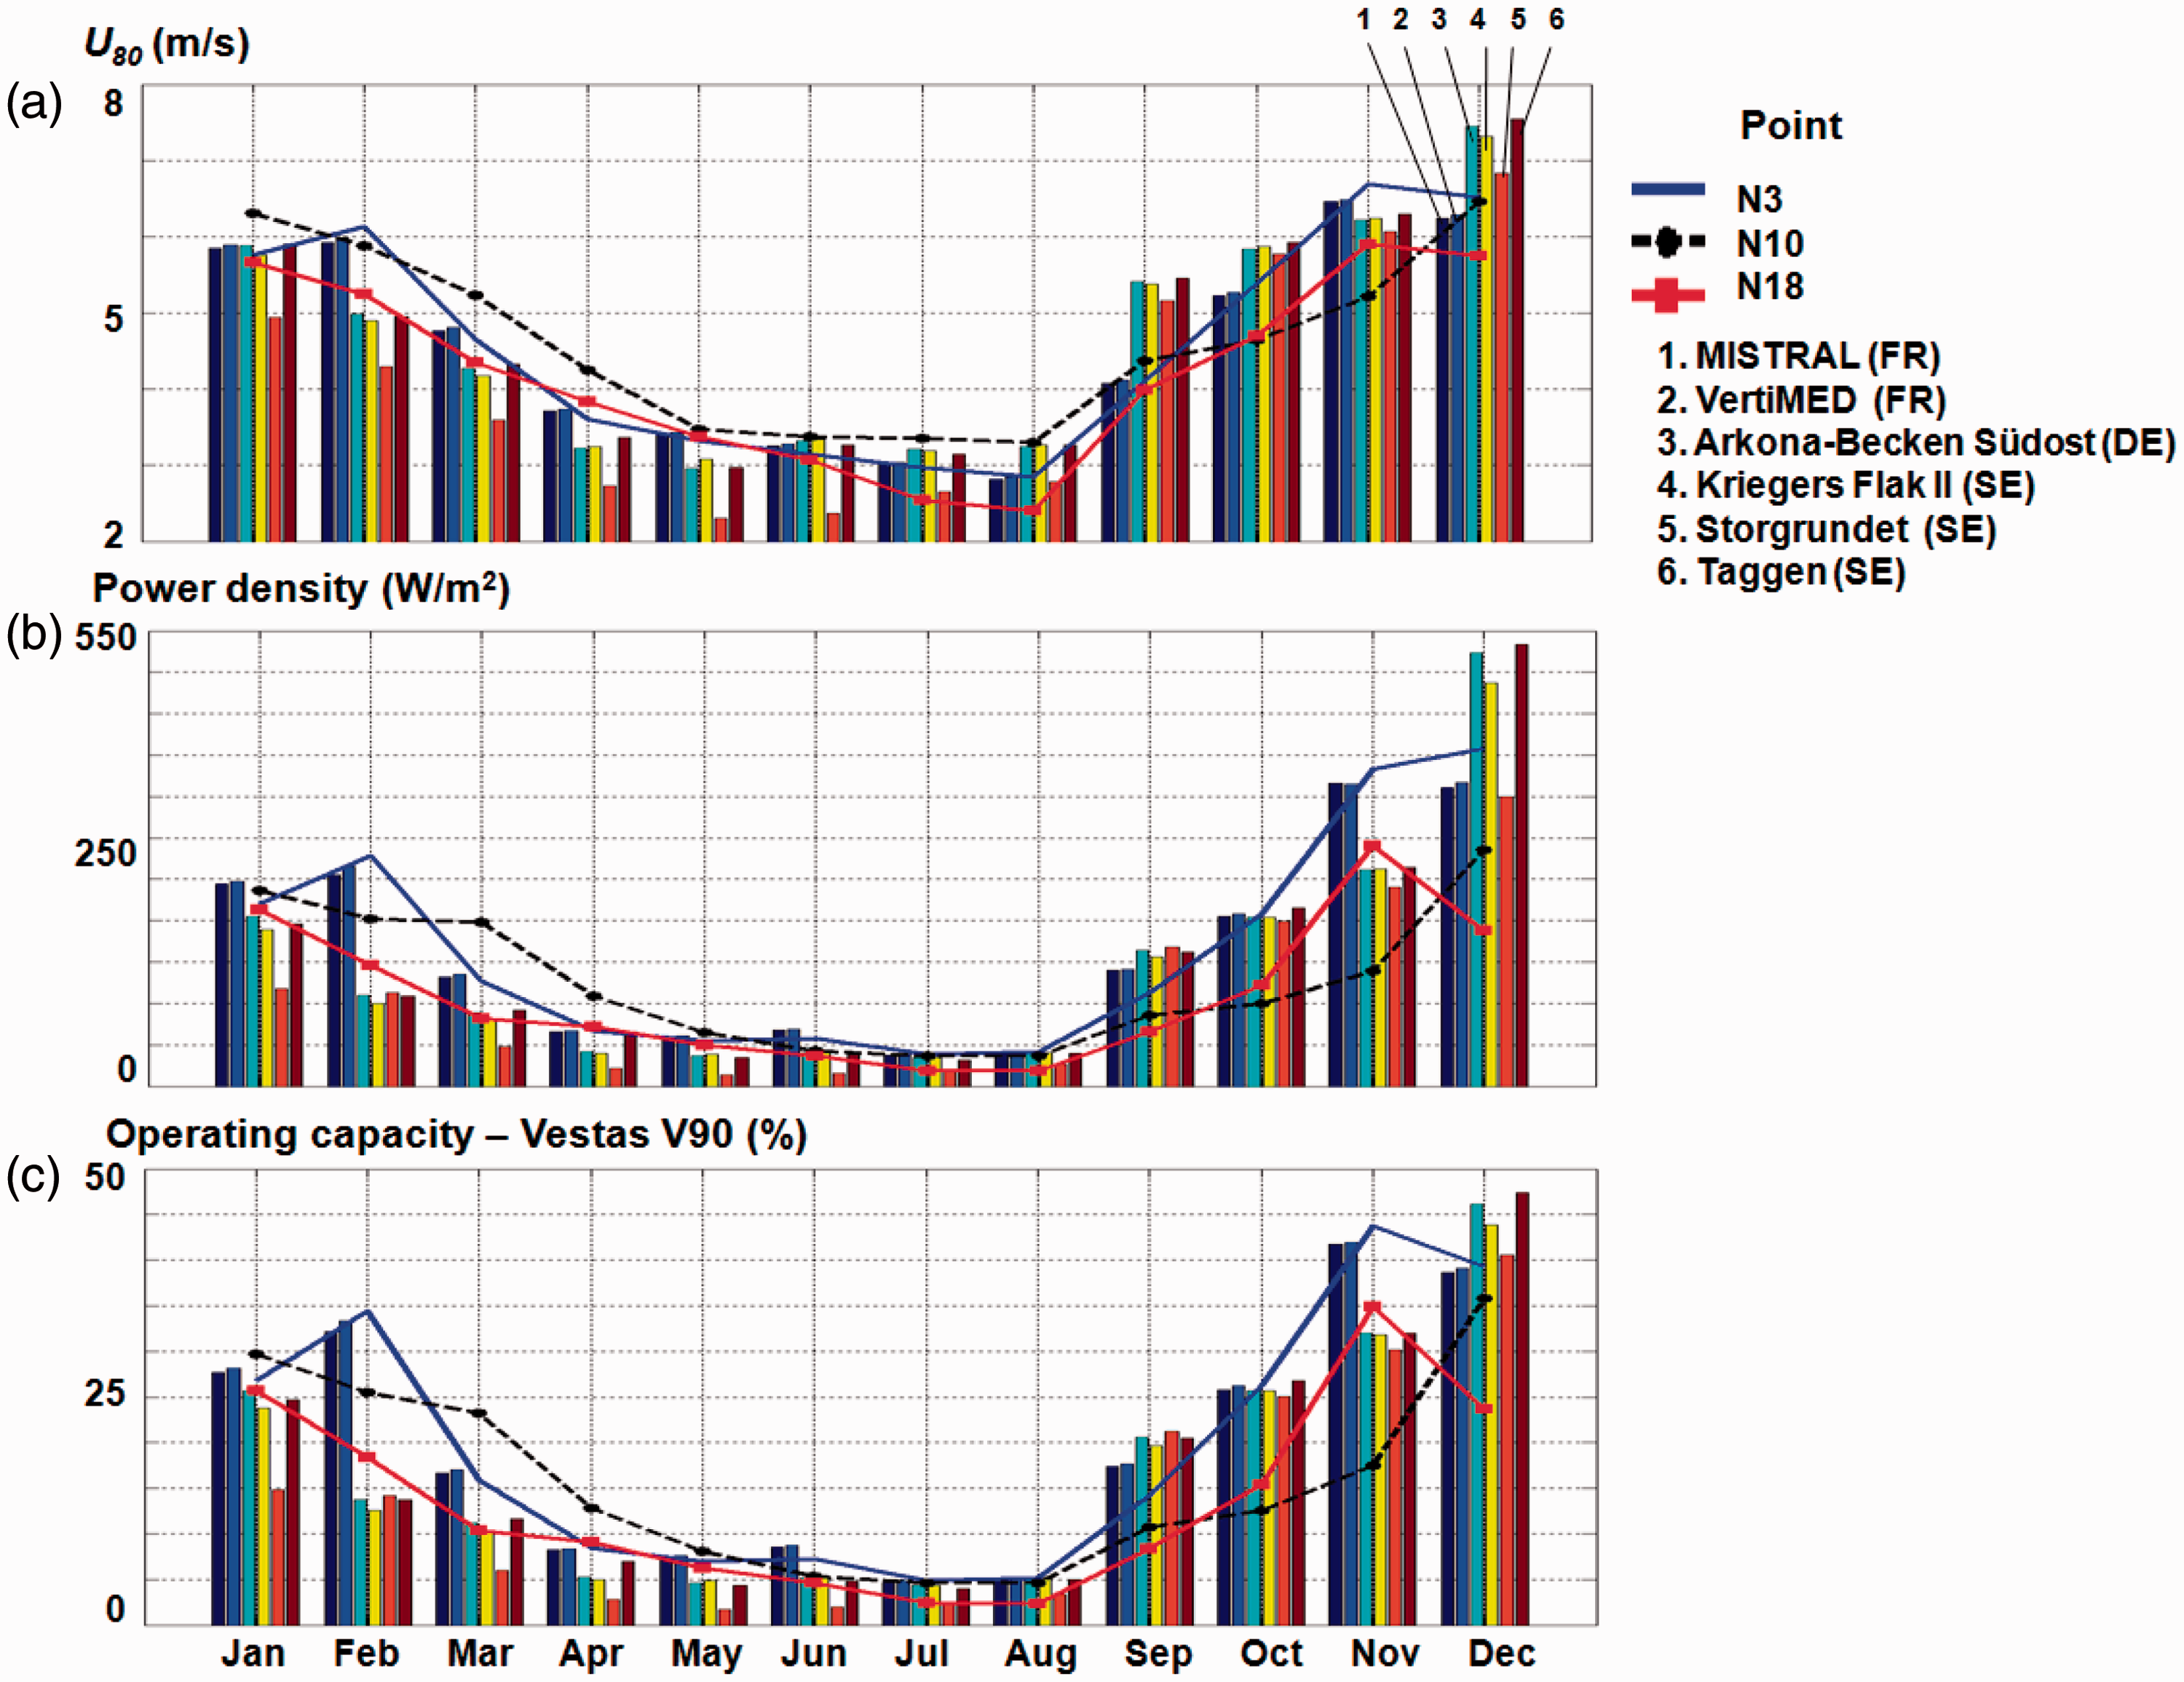
Overall statistics of the remotely sensed data corresponding to the locations of nine offshore wind projects (operational or approved) from the coastal environment of the UK.
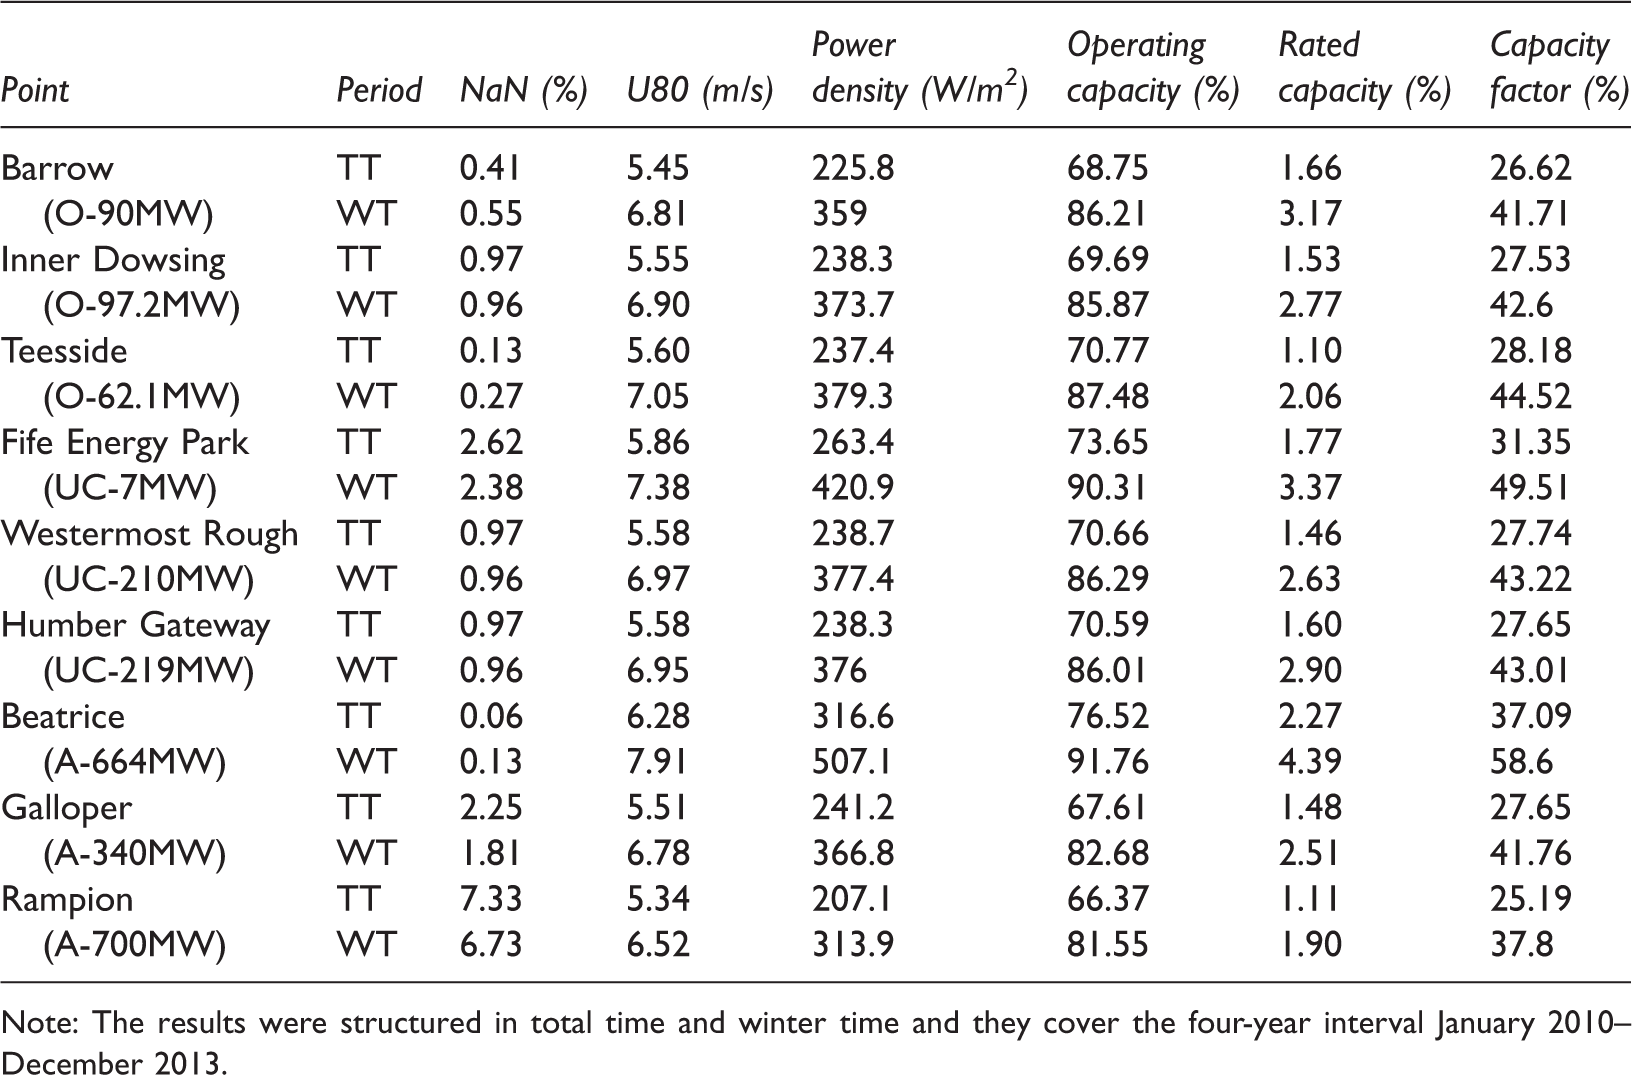
Note: The results were structured in total time and winter time and they cover the four-year interval January 2010–December 2013.
From the monthly evolution of the wind parameters (Figure 12), it can be noticed that the projects Beatrice and Fife Energy Park present much higher values for each month and that significant differences are reported by the N-points for the interval September–December, when there can be encountered maximum values of 9.4 m/s (U80), 855 W/m2 (power density), and 89.7% (operating capacity).
Assessment of the wind conditions in the reference points N3, N10, and N18 and those corresponding to the locations of several offshore wind farms operating in the UK. The results are based on the satellite data (at 80 m height) and cover a four-year interval (2010–2013): (a) average wind speed; (b) power density; and (c) operating capacity.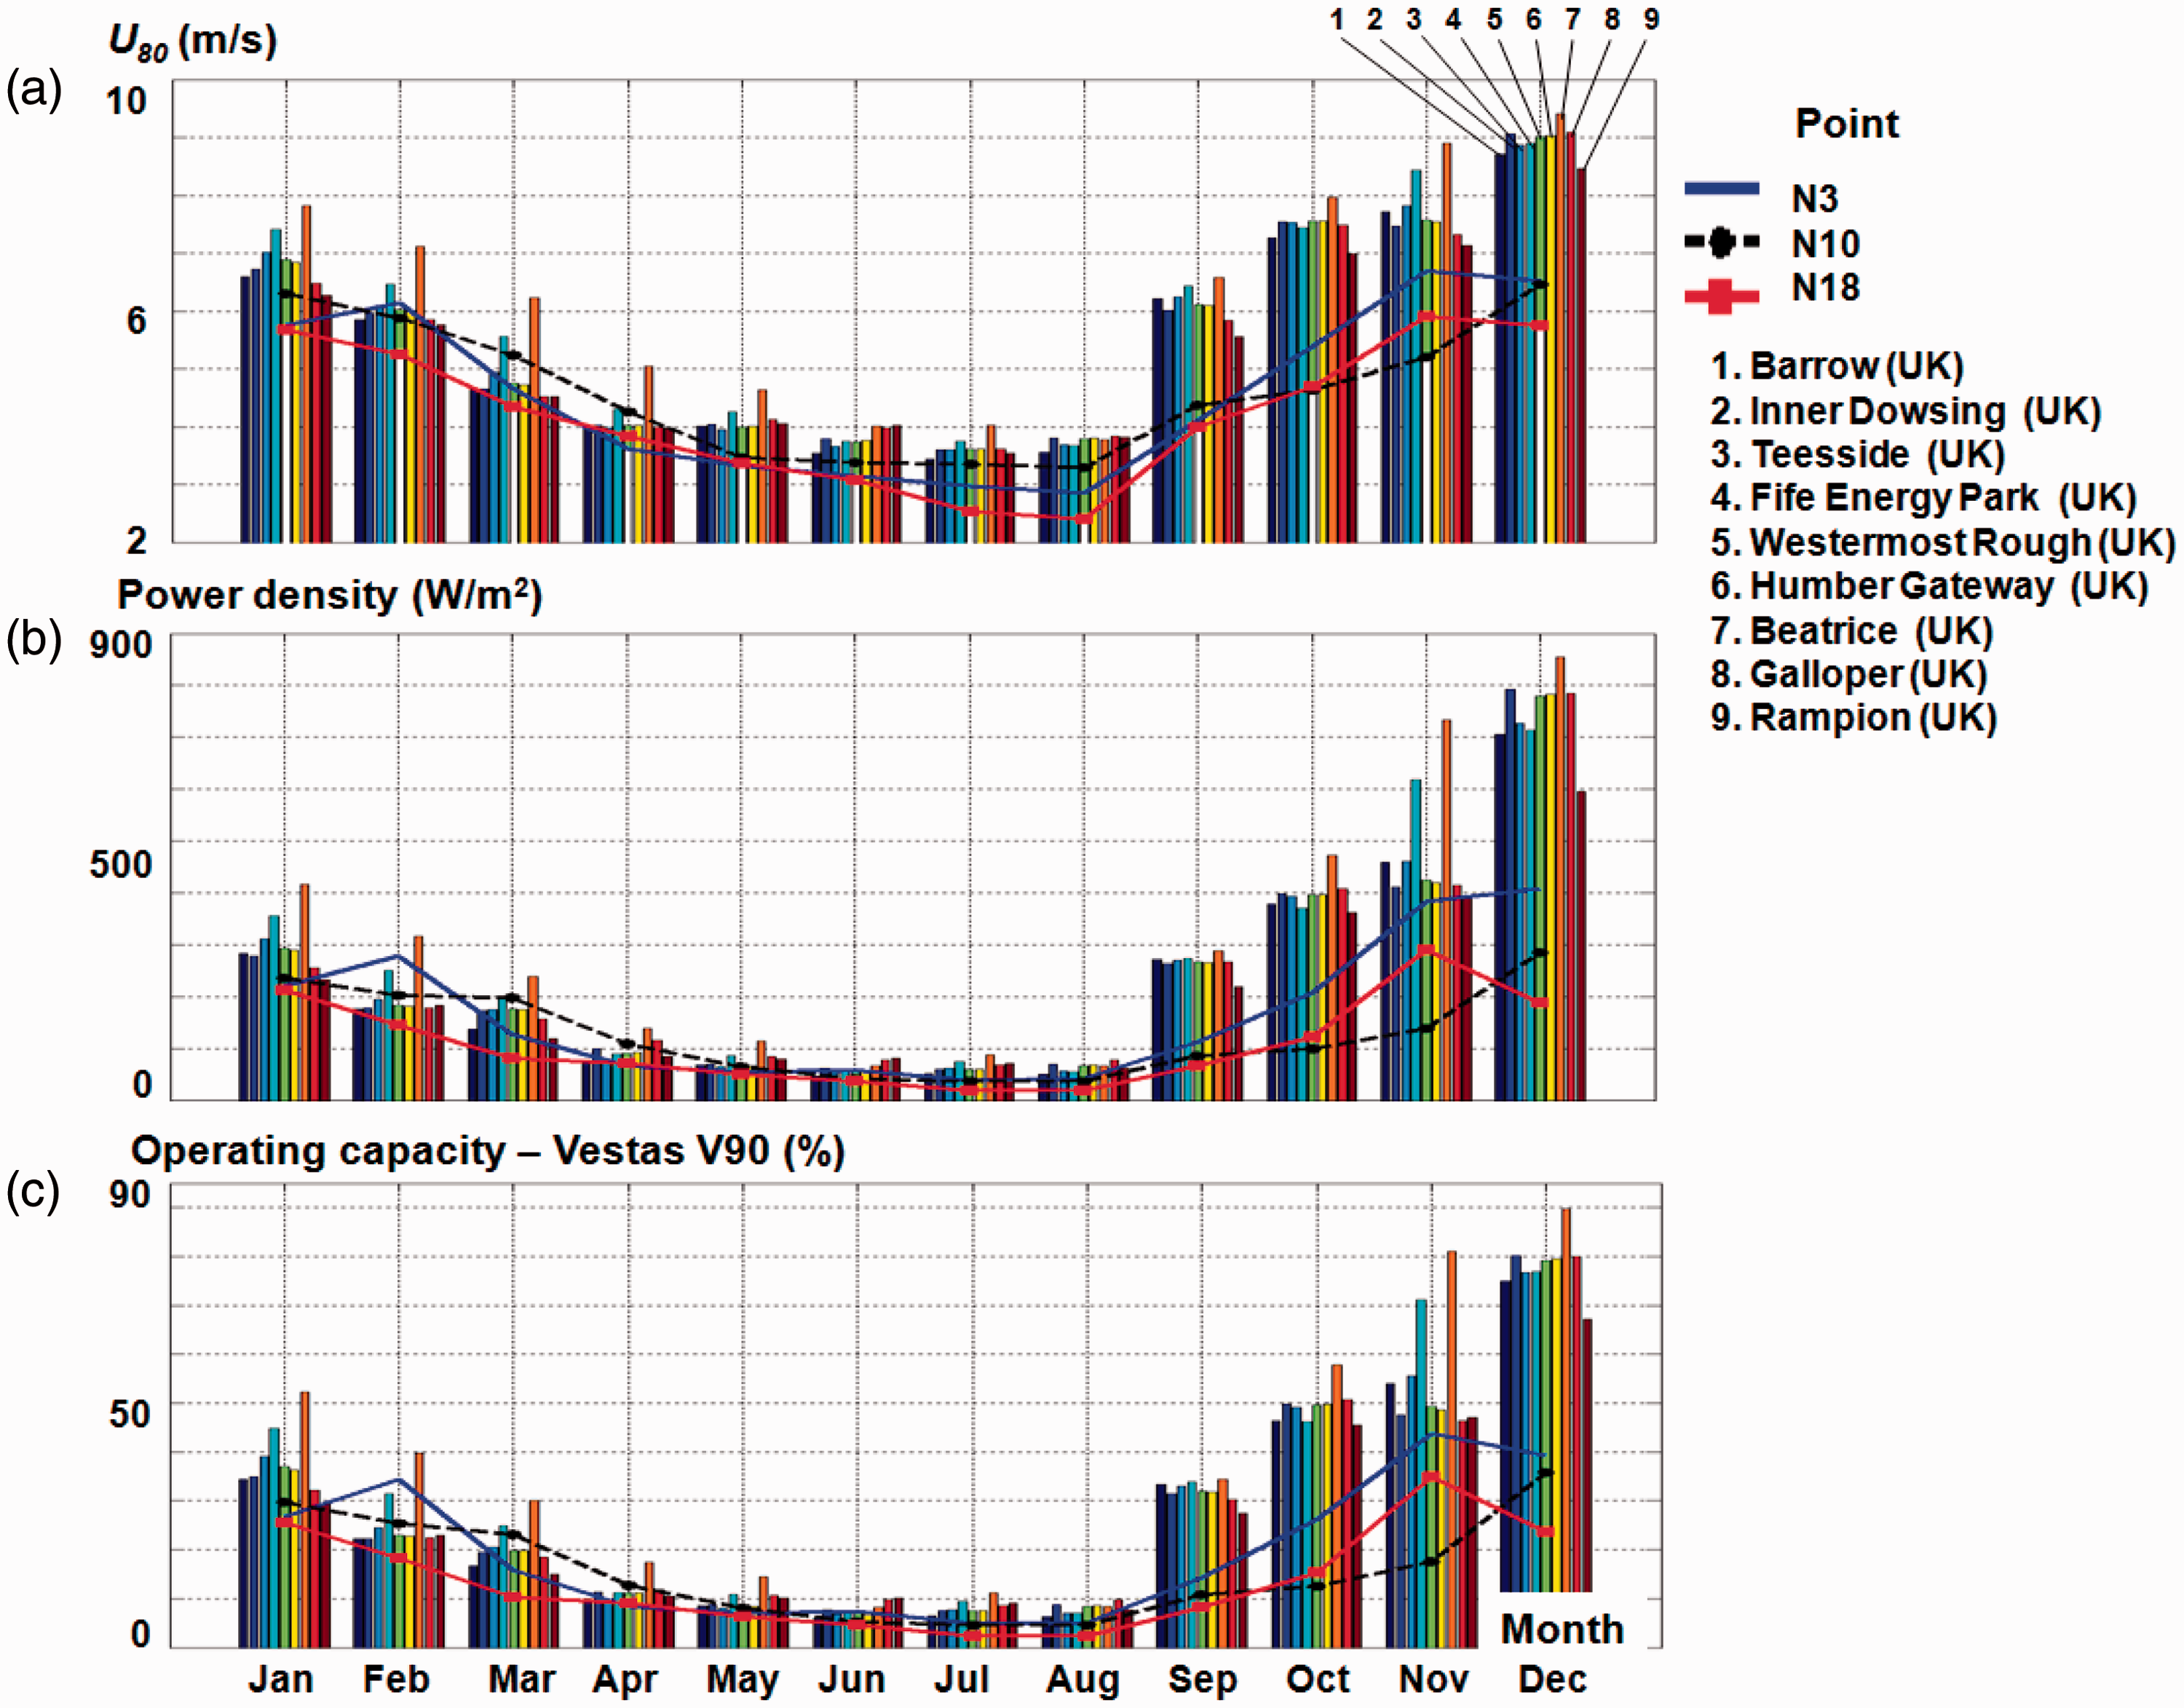
Conclusions
In the present work, a picture of the wind energy potential in the nearshore of the Mediterranean Sea was provided. This is done by considering three different sources of data, which cover almost 15 years. Subsequently, the wind conditions from the most promising locations were compared with those reported in the vicinity of several offshore wind projects from Denmark, Sweden, Germany, and the UK.
As a first step, throughout a logarithmic law, the dataset (reported at 10 m) was translated to 80 m height, where most of the wind turbines operate. From the analysis of the satellite measurements, it was highlighted the large number of missing data (NaN) reported in some parts of the basin (N8, N9, N13, or N14), which has not been taken into account since they exceed 10%, in contrast with the group of points N3–N6, located in the south and central parts of the sea defined by a good accuracy. The results highlighted that the points N3 and N10 seem to be more energetic, the first one being significantly influenced by the Mistral conditions. The technical characteristics of the Vestas V90-3.0 wind turbine were also taken into account in order to establish the performances of such systems in the Mediterranean basin.
Regarding the reanalysis data, the ECMWF dataset indicates the points N4, N7, N10 and N11 as being characterized by more wind energy, while, from this perspective, the NCEP model brings into discussion two groups of points N2–N5 (located in the northwest) and N7–N11 (located in the north). The advantage of these data is that they are available four times per day, which leads to a better understanding of the local condition, with the mention that the NCEP model tends to indicate more energetic features (Table 2). As compared to the satellite data, both models present much higher values for all the parameters analyzed.
In order to provide a better understanding of the wind potential in the Mediterranean Sea, three reference points (N3, N10 and N18) were selected from the entire basin and they were compared to some statistical results computed for 146 offshore wind projects. The analysis was carried out based on the satellite data. They come from a multi-mission project providing global measurements, and the only drawback that can be mentioned is that they are characterized by only one measurement per day. Even so, based on these comparisons, it was possible to identify the seasonal and monthly differences, the main finding being related to the fact that, during the interval January–August, the N-points present similar wind conditions with those from some operating offshore projects.
The results presented in this work can be considered interesting since they reveal that the northwestern and the central parts of the Mediterranean Sea can be considered suitable for the development of the offshore projects. Moreover, such aspects are already taken into account by the manufacturers of some floating turbines, which intend to develop projects in the vicinity of the Sardinia Island. Finally, it can be also underlined that the offshore wind farms, as well as the wave farms or the hybrid wind-wave marine energy farms, can influence the shoreline dynamics and play an active role in the coastal protection (Zanopol et al., 2014a, 2014b).
Footnotes
Declaration of conflicting interests
The author(s) declared no potential conflicts of interest with respect to the research, authorship, and/or publication of this article.
Funding
The author(s) disclosed receipt of the following financial support for the research, authorship, and/or publication of this article: This work was supported by a grant of the Romanian Ministry of National Education, CNCS – UEFISCDI PN-II-ID-PCE-2012-4-0089 (project DAMWAVE). The altimeter products were produced by Ssalto/Duacs and distributed by Aviso with support from Cnes. The altimeter products were produced by Ssalto/Duacs and distributed by Aviso with support from Cnes. The ERA-Interim data used in this study have been obtained from the ECMWF data server.