
Abstract
Whether a coalbed methane well achieves high yield is dominated by various parameters, and the controls of parameters on gas production usually have been analyzed by mathematical methods. However, no related research was conducted in the Xishan coal field. Geological characteristics of the coal reservoir in the B3 area, Xishan coal field, were analyzed. In this study, the B3 area was divided into the west and east subareas according to the different effects of burial depth on gas content. Geological, engineering, and draining parameters were extracted to compare with gas production. The results show that, in both subareas, draining parameters play the most important role in controlling gas production. Among geological parameters, gas content and permeability have much more significant effects on gas production. In shallow buried subarea (the east subarea), the effects of resistivity and the difference of stop pressure and drop pressure (Ps–Pd) on gas production are much notable than other parameters, which reflects permeability is a dominating factor for controlling well productivity. Regions with low resistivity, high Ps–Pd, and high water level are favorable regions for gas development in shallow buried subarea. However, water production and gas content determine the well productivity in deep buried subarea (the west subarea), in which, high gas content and water production, low water level are much helpful for producing gas.
Introduction
Coalbed methane (CBM) production is synthetically controlled by geological conditions (Aminian and Ameri, 2009; Anna, 2003; Xu et al., 2015), engineering measures (Ren et al., 2014; Zhang and Bian, 2015; Zhou et al., 2015), and draining systems (Chen et al., 2014; Ghaedi et al., 2015; Liu et al., 2014; Pan et al., 2010). Numerous studies have qualitatively or quantitatively examined the effects of coal seam thickness, burial depth, gas content, permeability, gas diffusion behavior, gas saturation, cohesion of the coal, reservoir pressure, dewatering rate, total sand volume, well pattern and fracturing, etc. on CBM production (Bachu and Michael, 2003; Cai et al., 2011; Hildenbrand et al., 2006; Kaiser et al., 1994; Lee et al., 2014; Li et al., 2015; Meng et al., 2014a; Tao et al., 2014; Zhao et al., 2015; Ziarani et al., 2011), and the results show that the effects of those parameters on CBM production are usually different among various CBM-producing areas.
Despite the great number of recent papers and reports, important questions about controls on gas production and high-yield CBM wells remain unanswered and the data are often contradictory. Considering a CBM area even basin entirely and ignoring the special relation between burial depth and gas content are two of the most important reasons inducing unsatisfactory results, since different structural forms in a same CBM area have different effects on gas production (Hamilton et al., 2012; Pashin and Groshong, 1998), and burial depth has contrary relationship with gas content between shallow and deep buried regions (Cai et al., 2014; Scott et al., 2007). Moreover, former related researches in China mainly focused on the famous Qinshui and Ordos basins (Cai et al., 2011; Meng et al., 2014a; Tao et al., 2014; Zhao et al., 2015), which is absent but necessary in the other CBM-producing basins in China.
As relatively late development demonstration field of medium rank coal in China, more than 700 CBM development wells have been drilled and gone into production in the Xishan coal field (XCF) since 2011, all which have adopted vertical well fracturing technology. However, the XCF had failed in CBM development with average gas production of about 277 m3/d per well. The most important reasons for this failure in the XCF are (1) the complicate structural condition and (2) the absence of systematical CBM geology research in it. Under this background, conducting pointed researches about CBM geology condition and controls on gas production is urgent to improve the gas production in the XCF.
Herein, the B3 area in the XCF was chosen as an example since its uniform structural form and abundant original data. First, we subdivided the B3 area into two subareas according to the effects of burial depth on gas content of coal. Second, we summarized geological conditions of the No. 8 coal reservoir and the distribution of gas production. Third, critical geological, engineering and draining parameters in CBM wells with various productivities were extracted, and then the controls of these parameters on gas production in each subarea were analyzed by software “Matlab.13.0b” based on the Gray correlation theory.
Geologic setting of the XCF
The XCF (Figure 1), located in the center of Shanxi province, is the most important coking coal-producing base in China. The Taiyuan rift, Jinzhong rift, Lvliang mountain, and Wutai mountain surround on the east, south, west, and north of it, respectively.
Structural sketch of the XCF and the location of the B3 area.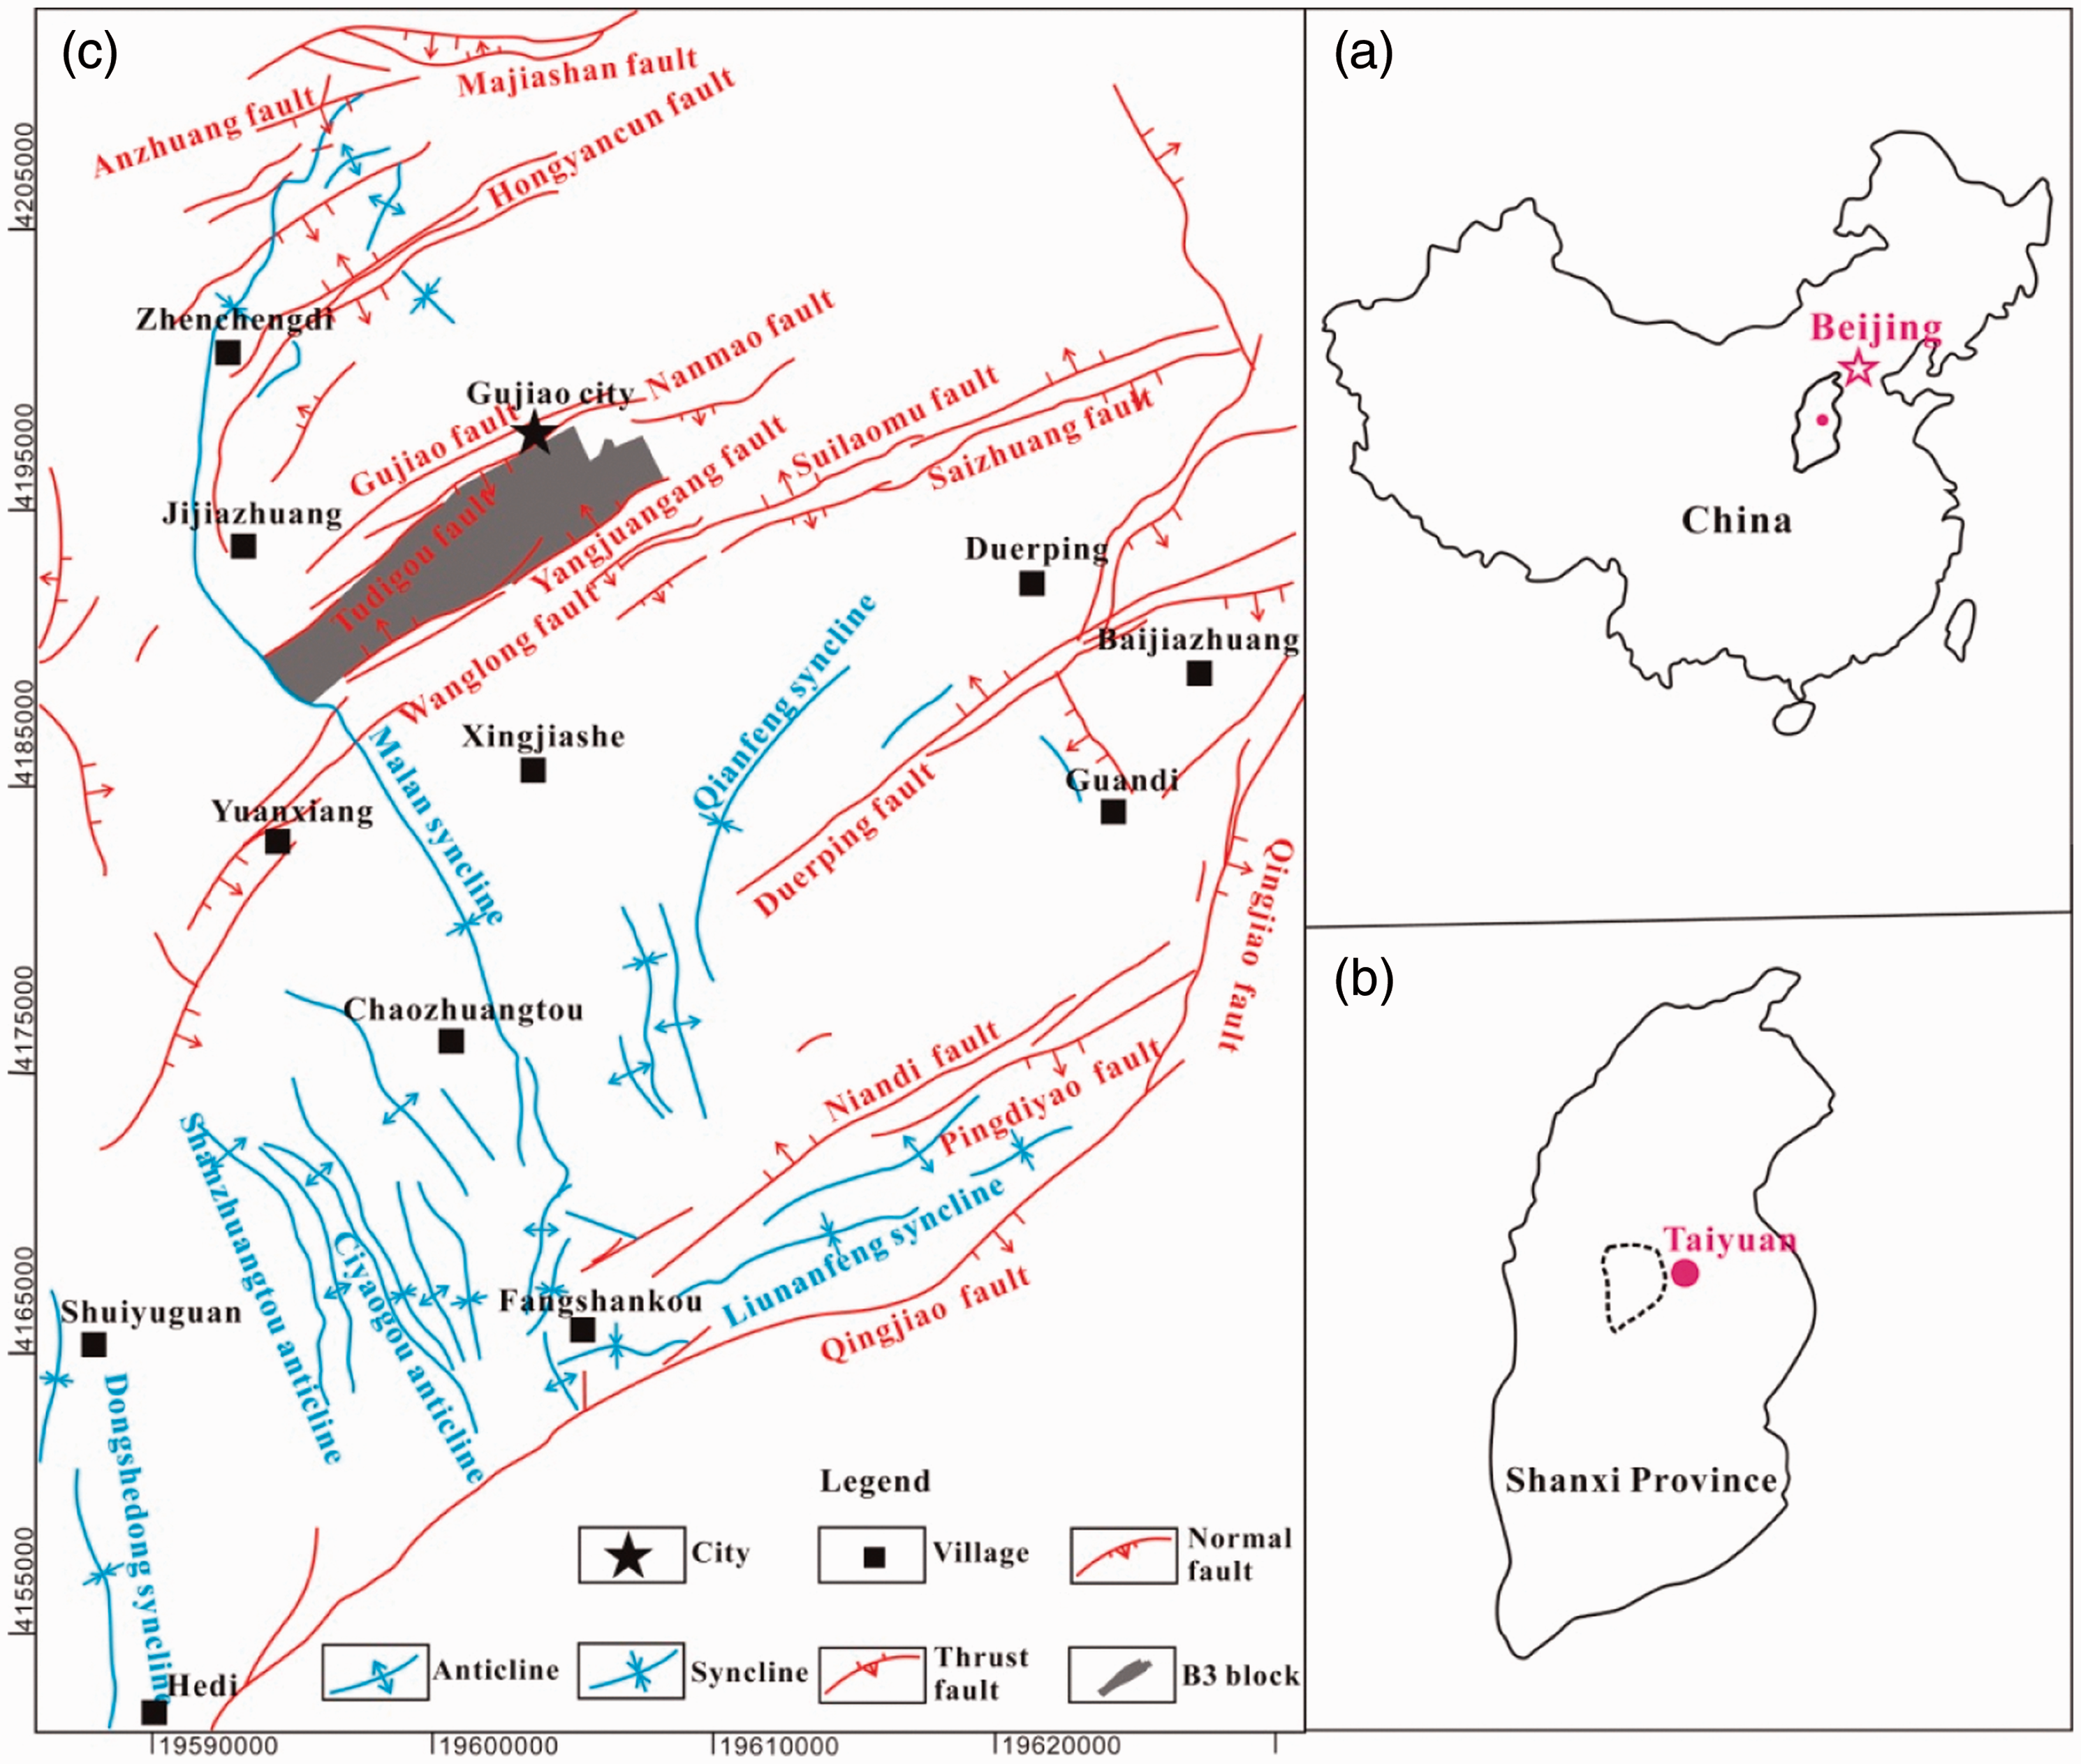
The strata in the XCF include Cambrian, Ordovician, Pennsylvanian, Permian, Triassic, Jurassic, Neogene, and Quaternary units. Taiyuan and Shanxi formations are the main coal-bearing strata (Figure 2). The No. 2, No. 4 in Shanxi formation and the No. 8, No. 9 in Taiyuan formation are main mineable coal seams, among which the No. 8 coal seam is the primary target zone for CBM development. The XCF has been through four orogenies: the Indosinian, Early Yanshanian, Late Yanshanian, and Himalayanian orogenies (Wang et al., 2007). The axial of the Malan syncline has split the XCF into the east and west wings. The west wing is steep and full of secondary folds, and the east wing is a gentle monocline and full of NE axial striking large fault zones (Ao, 1991; Gui, 1986).
Stratigraphic section in the XCF.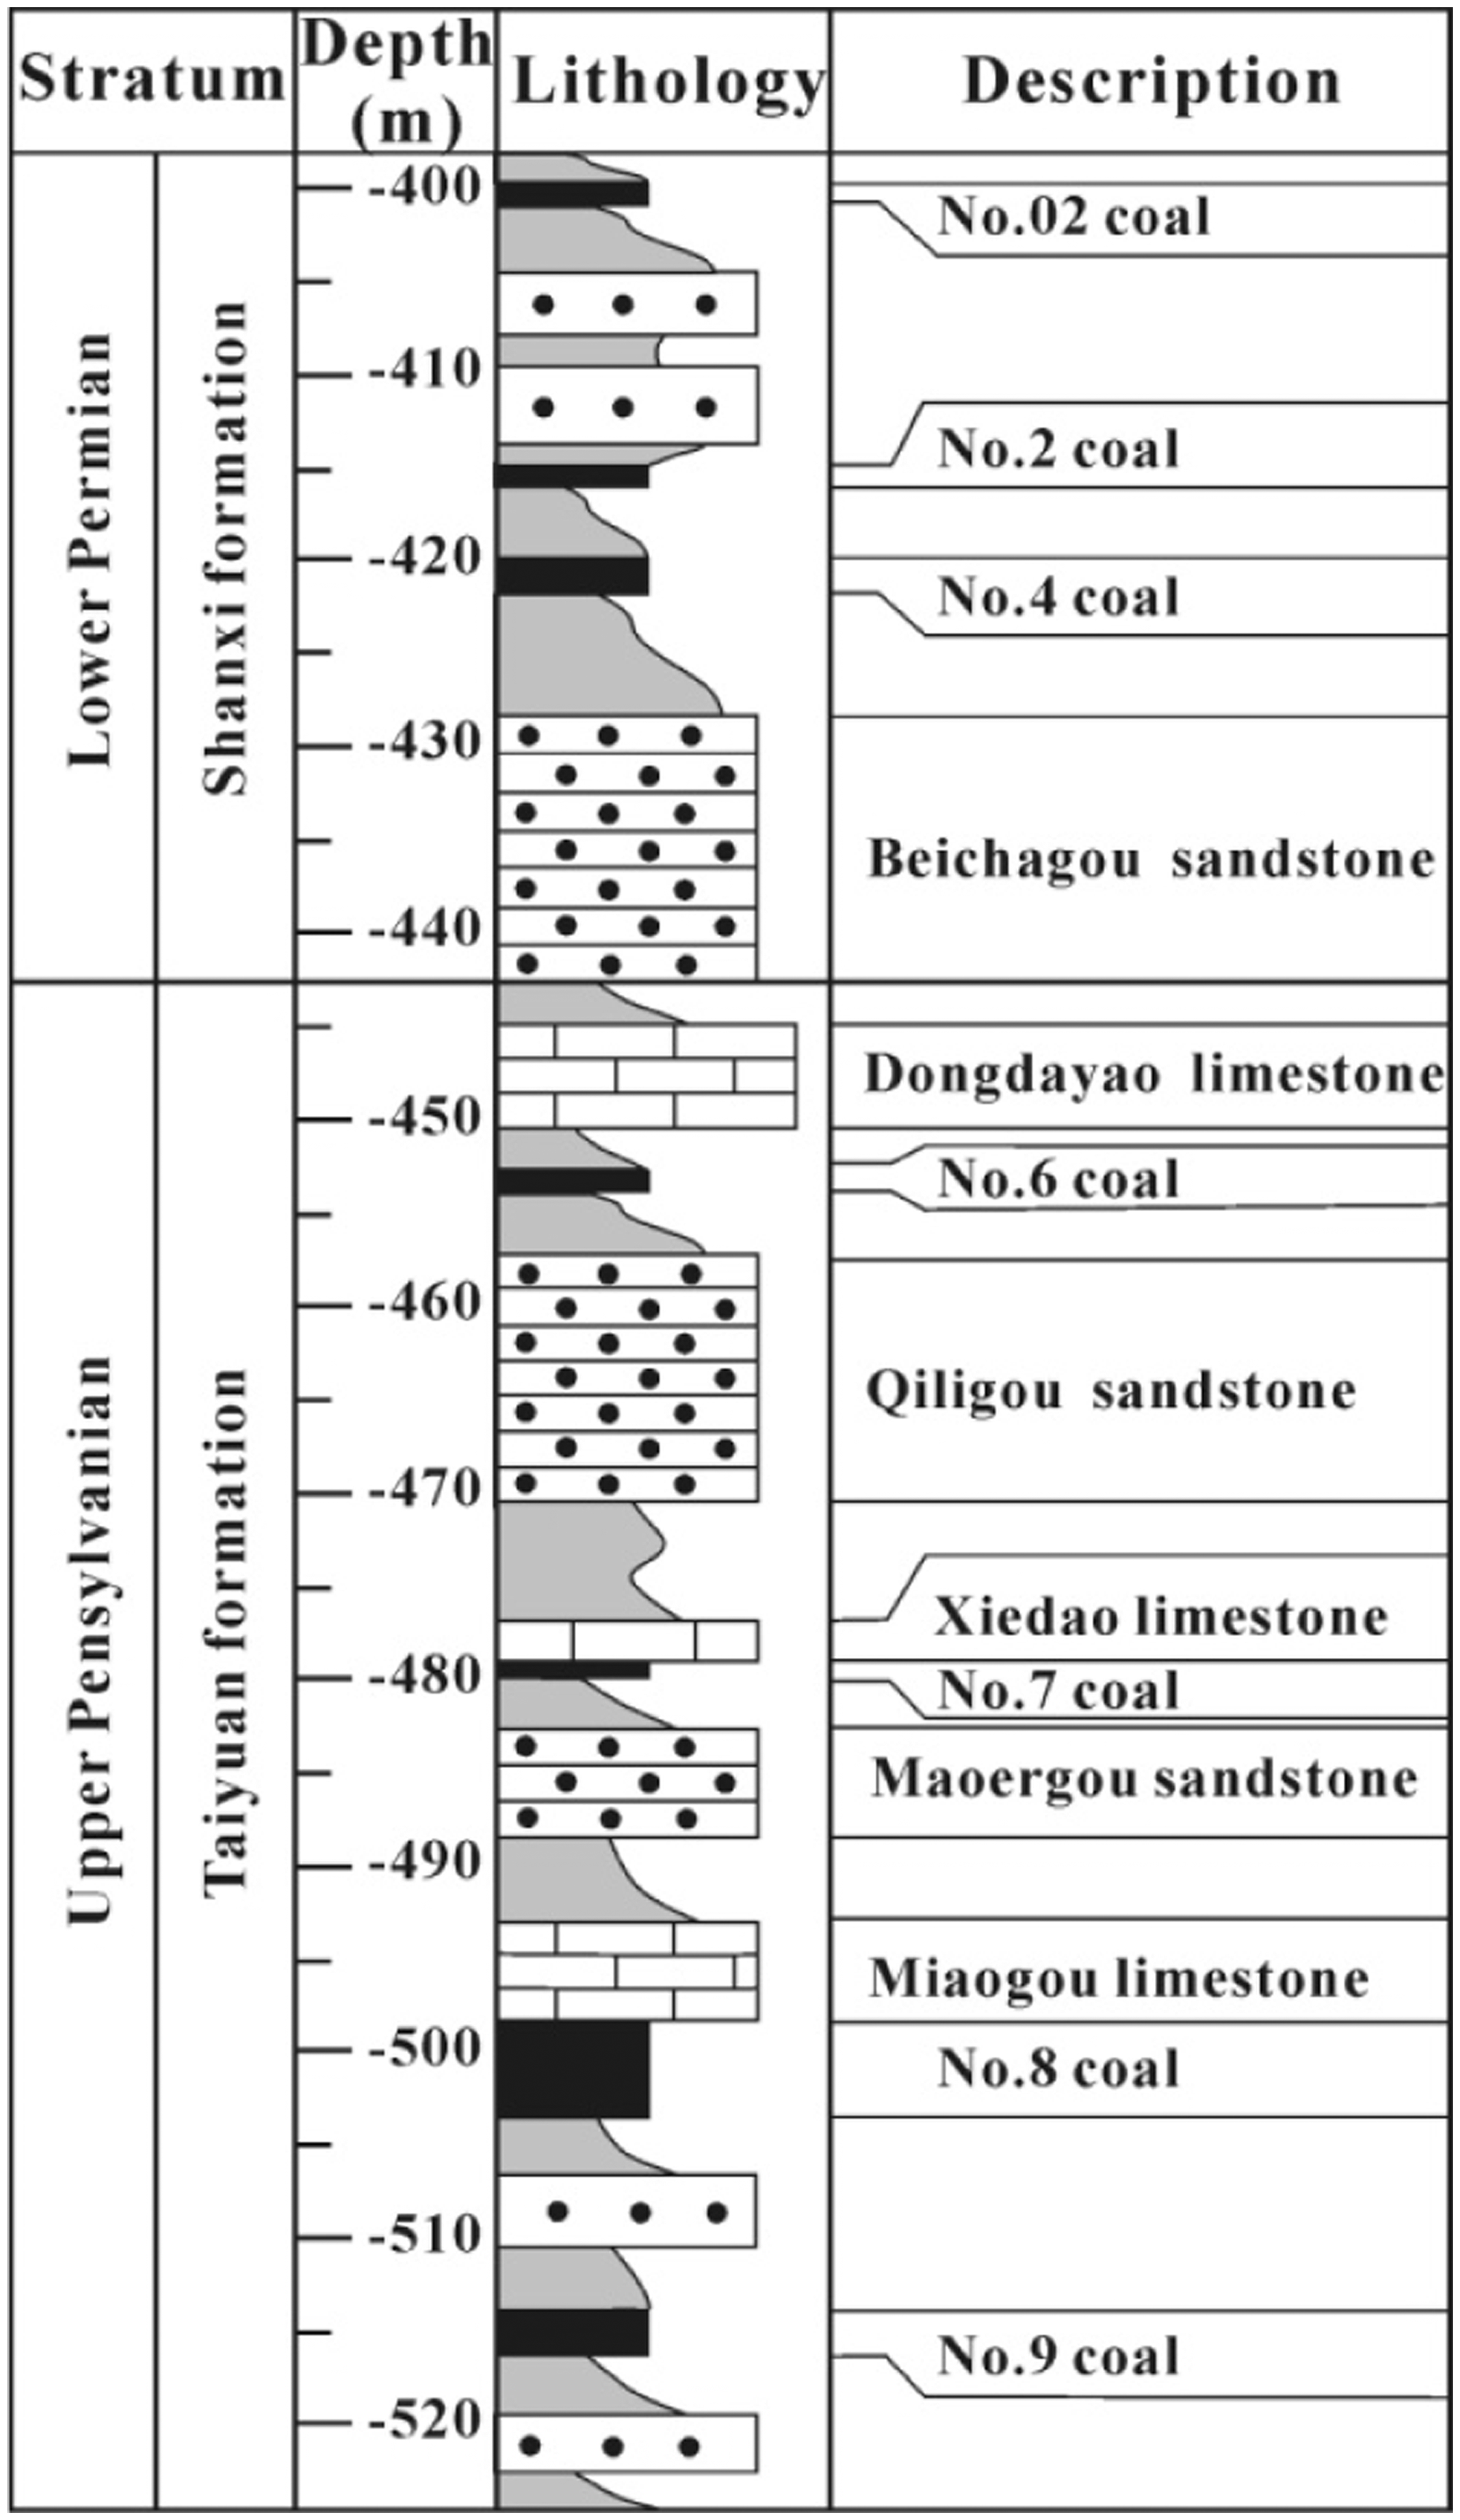
The B3 area, located in the east wing of the Malan syncline with area is 41.5 km2, is a graben between the Tudigou–Nanmao and Wangzhimao–Yangjuangang fault zones, as well as a monocline with SW dip direction (Figure 3). In which the east part is coal-mining region, and the west and center parts are CBM-producing regions.
Structural top of the No. 8 coal seam in the B3 block showing wells productivity.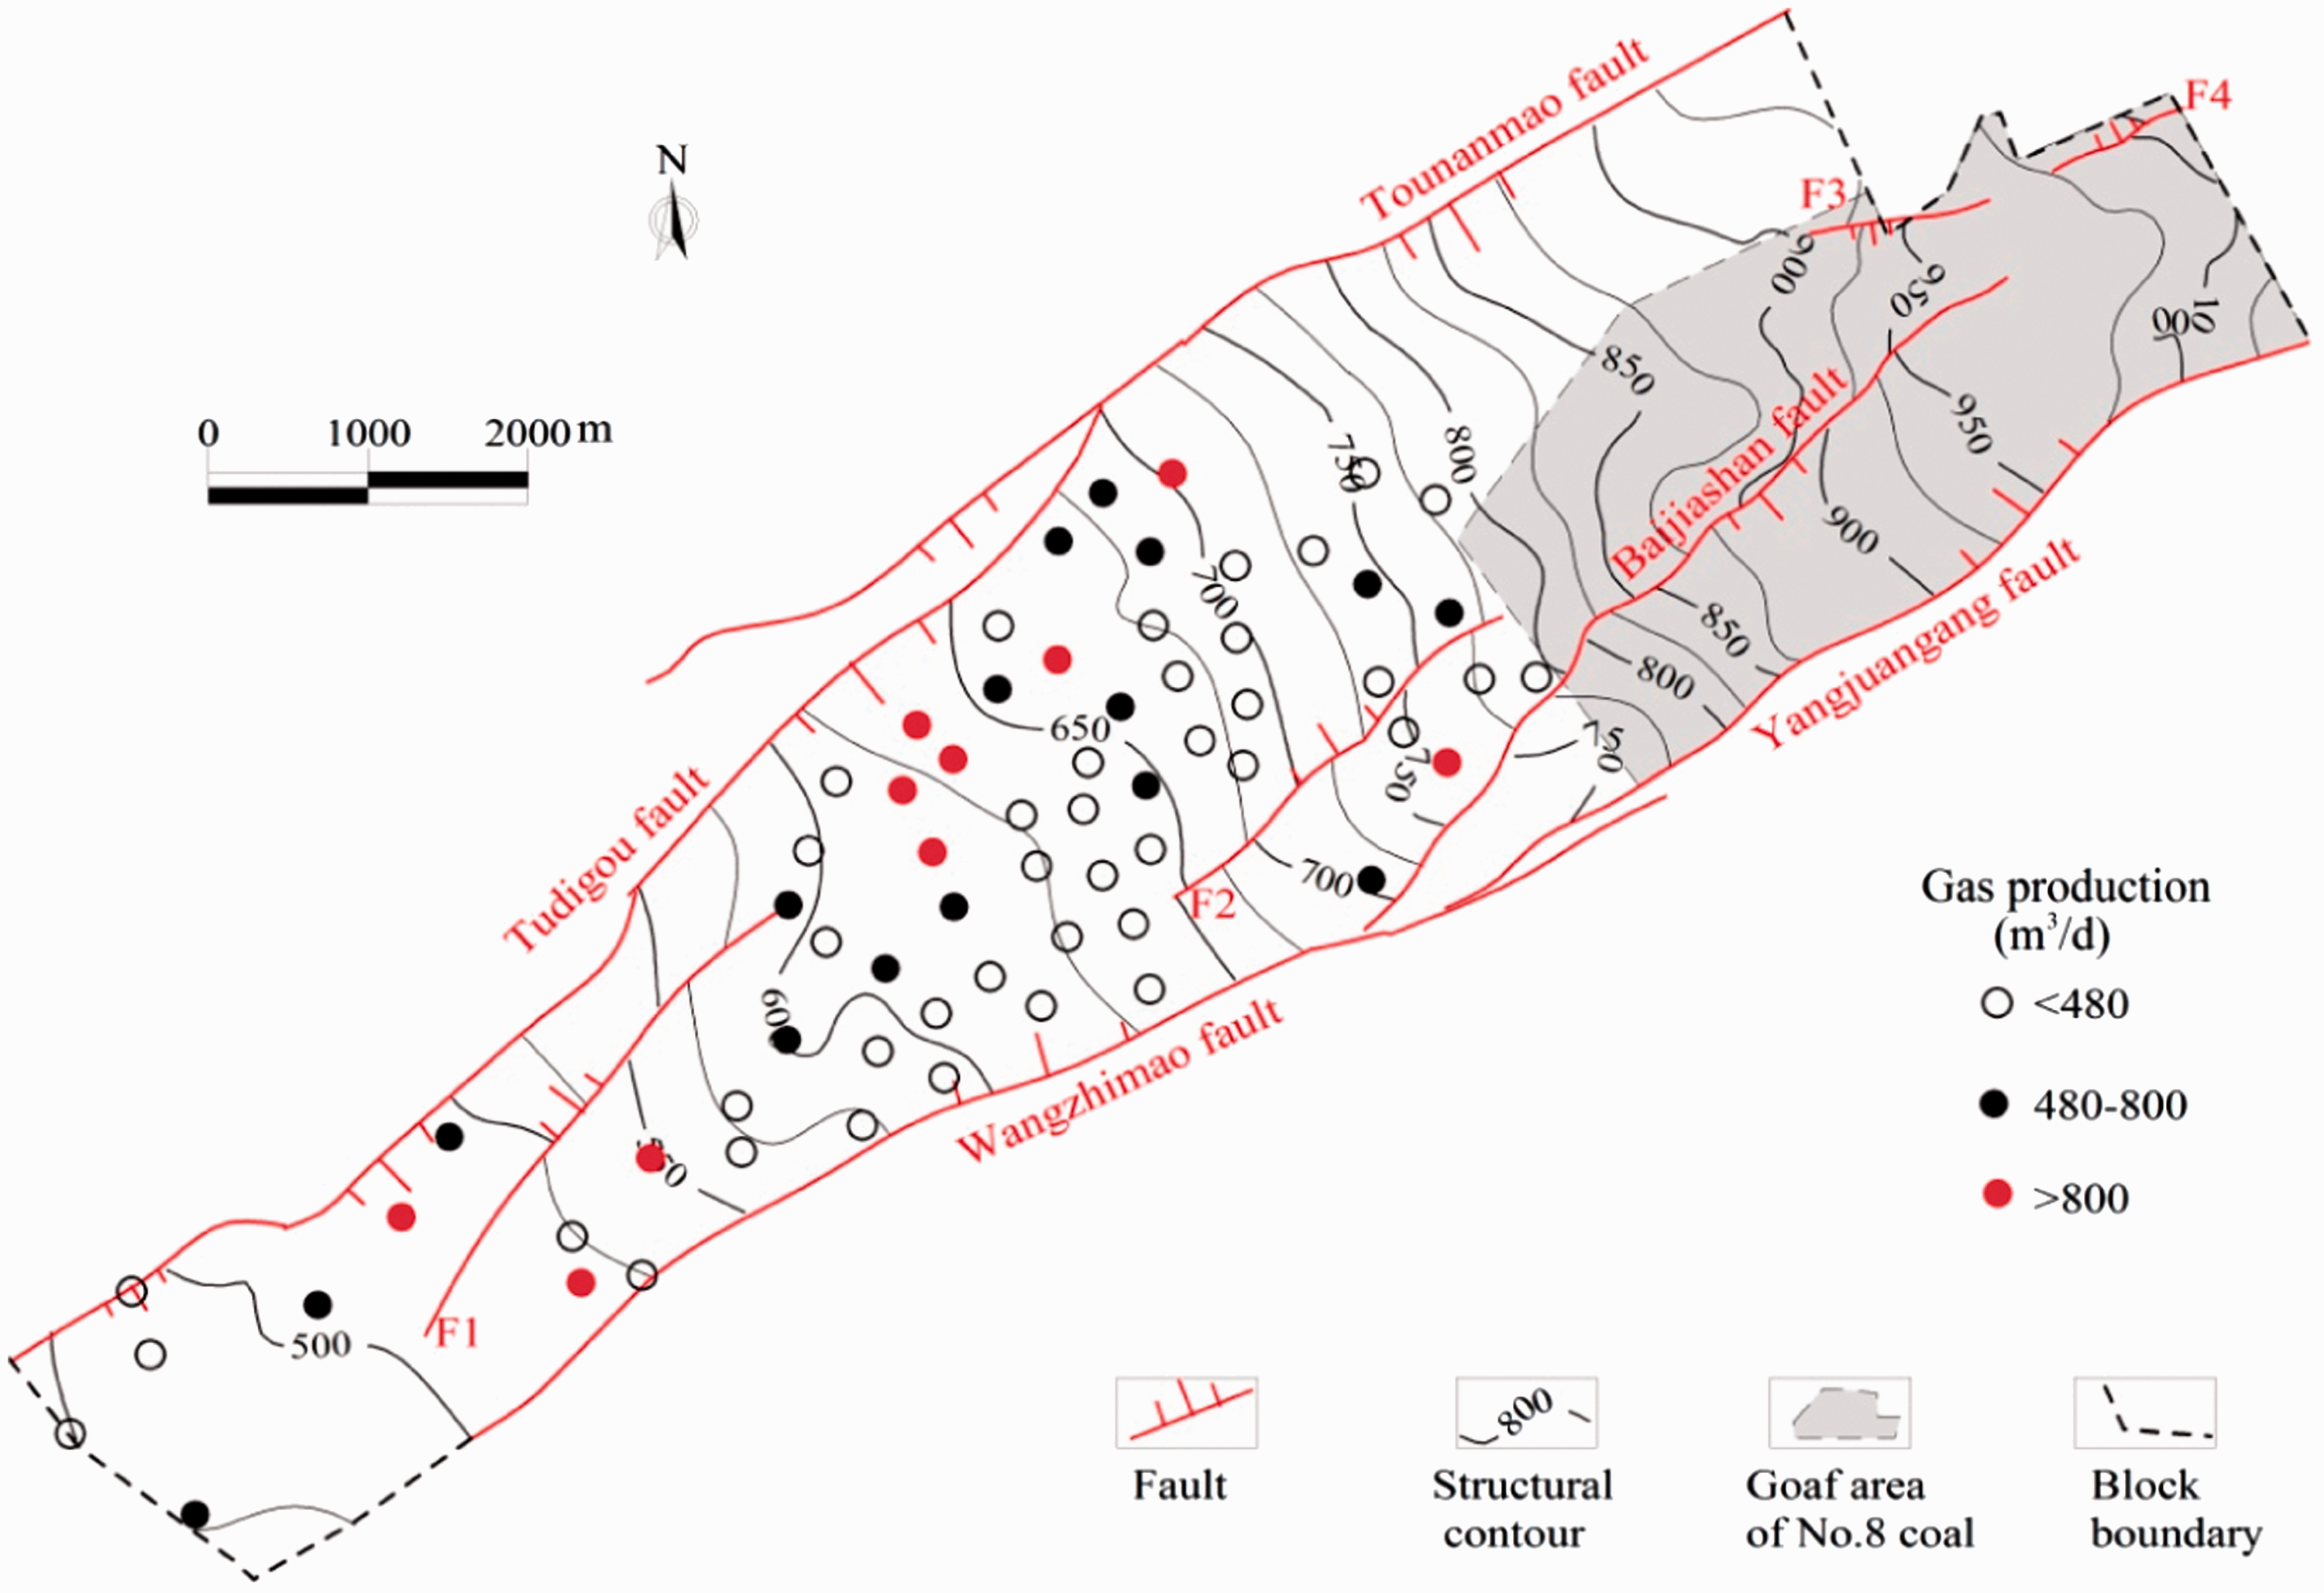
Productivity characteristics of CBM wells in the B3 area
In the B3 area, the stable gas production data of 66 wells were collected and analyzed. The highest gas production is 1955 m3/d, and only five wells have a gas production exceeding 1000 m3/d, 20 wells are between 500 and 1000 m3/d, 21 wells range from 250 to 500 m3/d, 20 wells produce less than 250 m3/d, and four wells have no gas production at all. The average gas production of all 66 wells is 487 m3/d per well, far more than the average production in the XCF (277 m3/d per well). Ten of 66 wells (15%) have a gas production exceeding 800 m3/d, so we chose 480 and 800 m3/d as middle and high yield ambits. There are 10, 16, 40 wells (the low yield ratio is 0.61) that are high, middle, low yield in the B3 area, respectively. However, they have distributed dispersedly (Figure 3) and impossible to find a dominating factor affecting gas production out. This severe situation is common in many CBM-producing areas around the world (Bustin and Clarkson, 1998; Cai et al., 2014; Flores et al., 2008; Gentzis and Bolen, 2008; Zuber, 1998), which reflects the importance and necessity of adopting mathematical analysis methods.
The gas production curves of 66 wells were drawn through software “Grapher.9.0,” which were further divided into four types (Figure 4). There are 8, 17, 24, and 16 wells which are “increasing type,” “single-peak type,” “double-peak type,” and “undulant type,” respectively. All wells with gas production higher than 800 m3/d are increasing type or double-peak type, since both have stable increasing permeability and decreasing reservoir pressure during production stage (Salmachi and Yarmohammadtooski, 2015). However, single-peak type is induced by fractured process, so they have transient time of high gas production during the early stage of gas production. Undulant type always has relatively heavy stress sensitivity, which is harmful for coal reservoir and gas production (Thararoop et al., 2015).
Typical shapes of CBM production curve types in the B3 area: (a) increasing type, from well C143; (b) double-peak type, from well C025; (c) single-peak type, from well C035; and (d) undulant type, from well C058.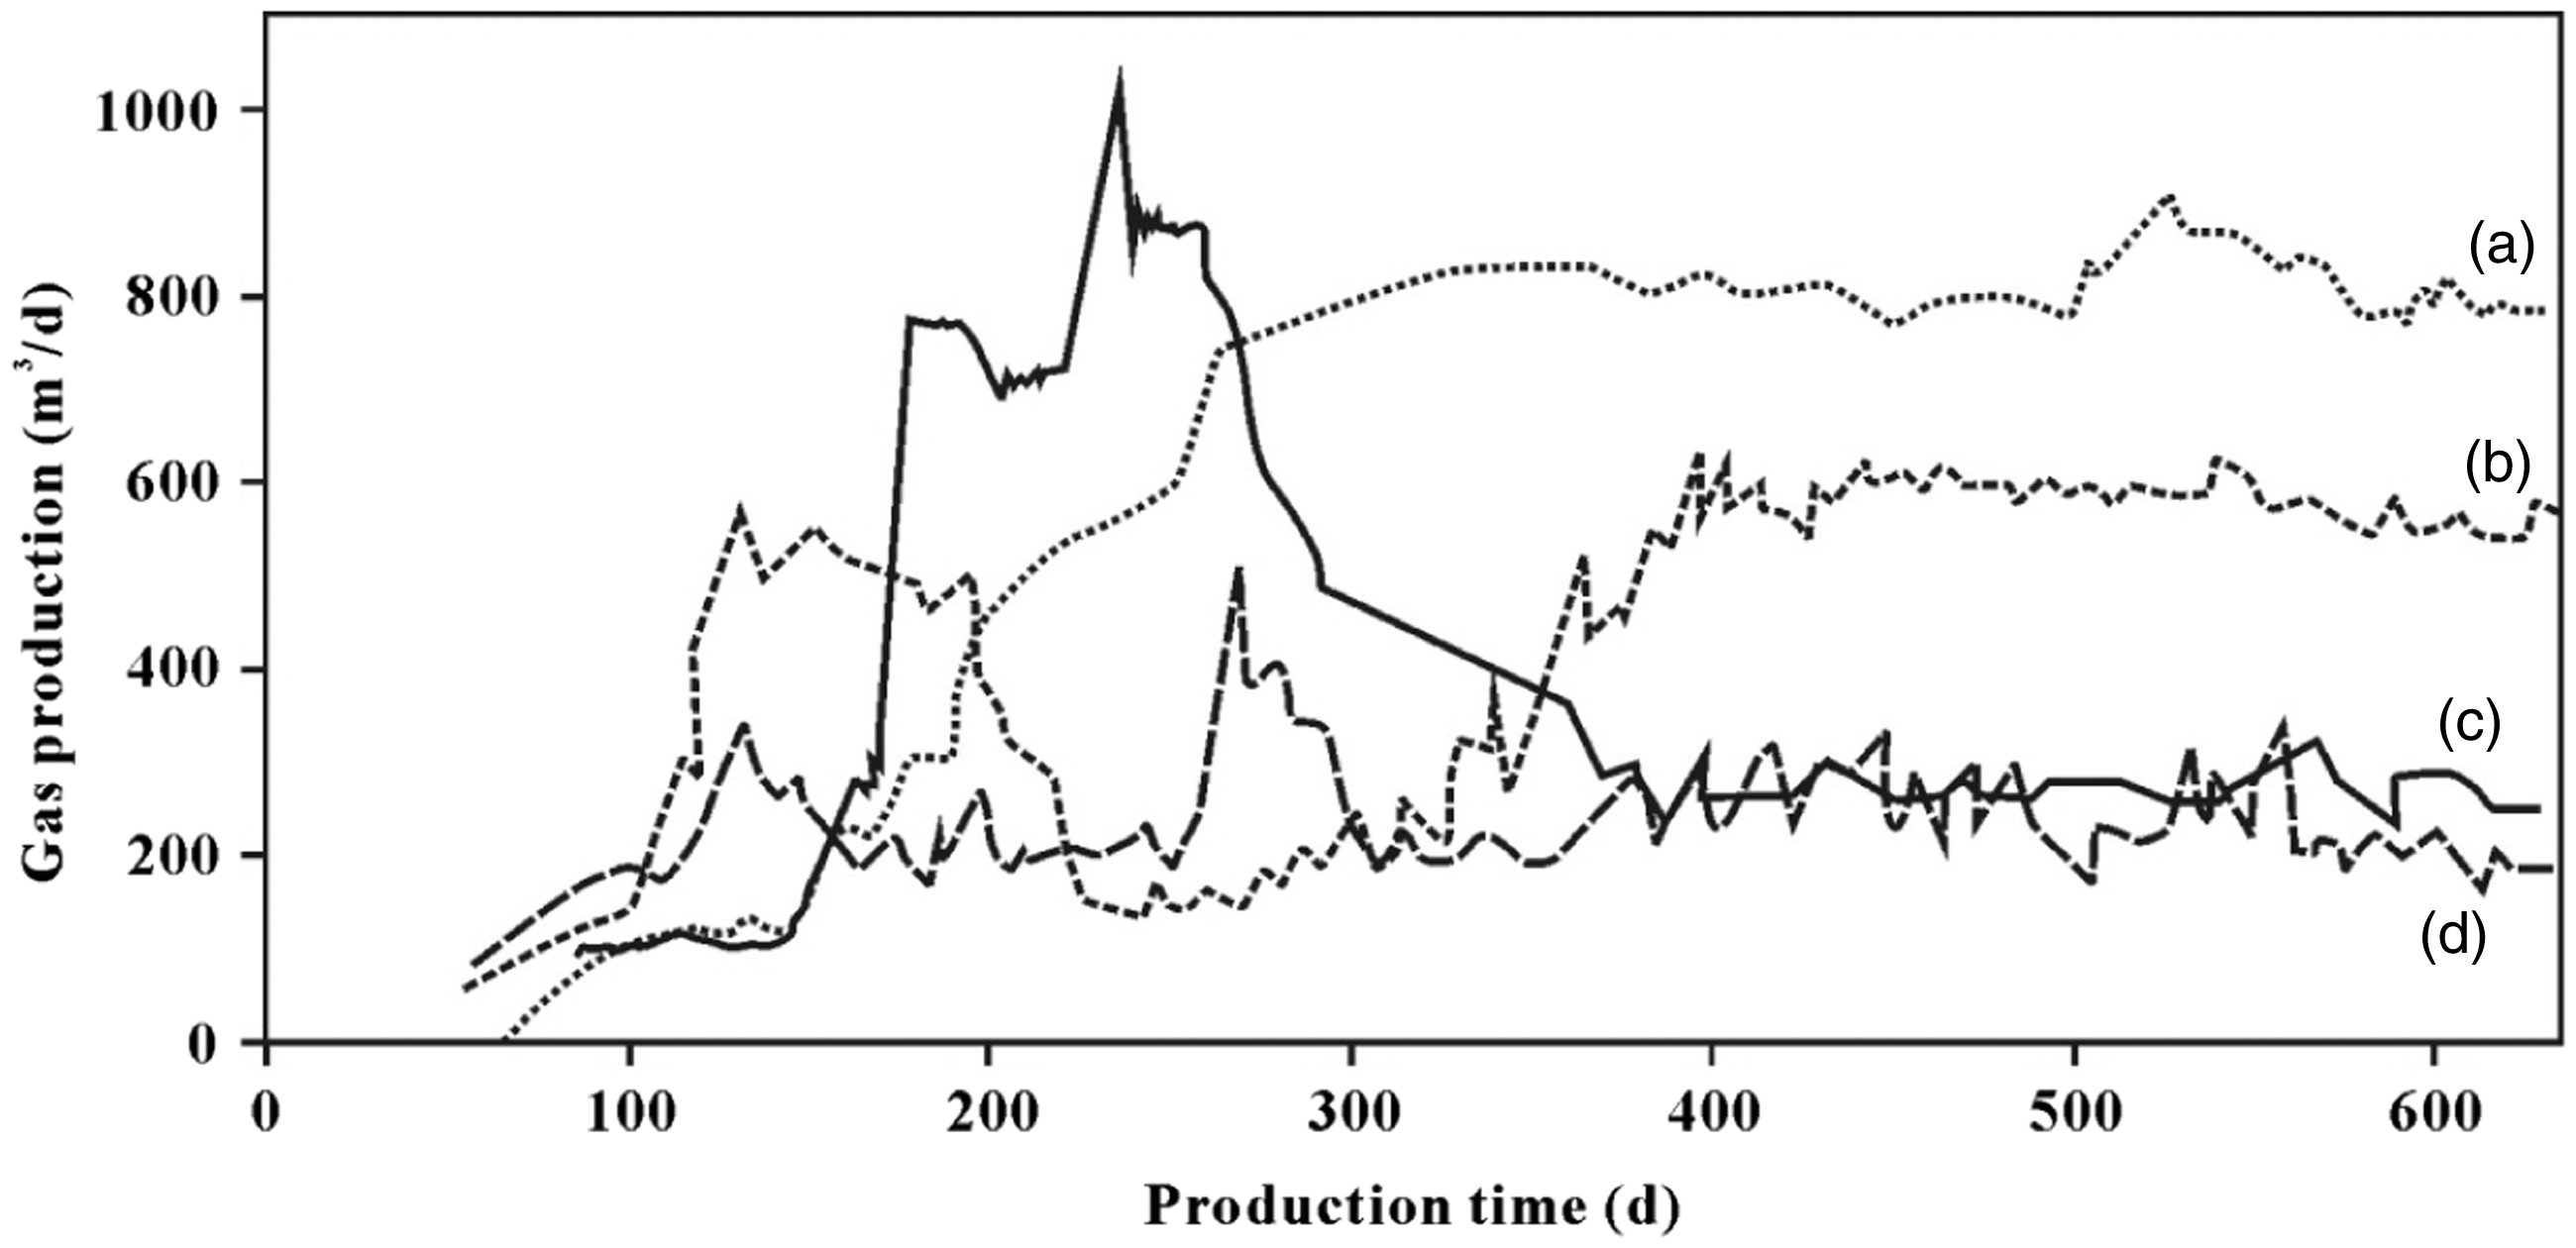
Geological characteristics in the B3 area
Structural characteristics
The B3 area is a gentle monocline with average dip angle of 4.6°, in which the elevation of the top of the No. 8 coal seam is increasing from 475 m in the west to 1025 m in the east (Figure 3). Totally, nine known faults distributed in the B3 area, all which are NE axial striking normal faults. The Tudigou and Tounanmao faults are main constituents of the Tudigou–Tounanmao fault zone with SE dip direction. The Wangzhimao and Yangjuangang faults make up the Wangzhimao–Yangjuangang fault zone with NW dip direction. The Tudigou–Tounanmao and Wangzhimao–Yangjuangang fault zones are the north boundary and south boundary of the B3 area, respectively. Compared with the four boundary faults, the Baijiashan, F1, F2, F3, and F4 faults are relatively minor. The Tounanmao, Yangjuangang, and Baijiashan faults were recognized both in the underground mines and on the ground (Figure 5). The others faults only discriminated in the underground mines since they are too small to stretch to the surface or the surface has been heavily covered by the Quaternary loess.
Field photos of some large faults related to the B3 area. (a) Yangjuangang fault, (b) Baijiashan fault, and (c) Tounanmao fault.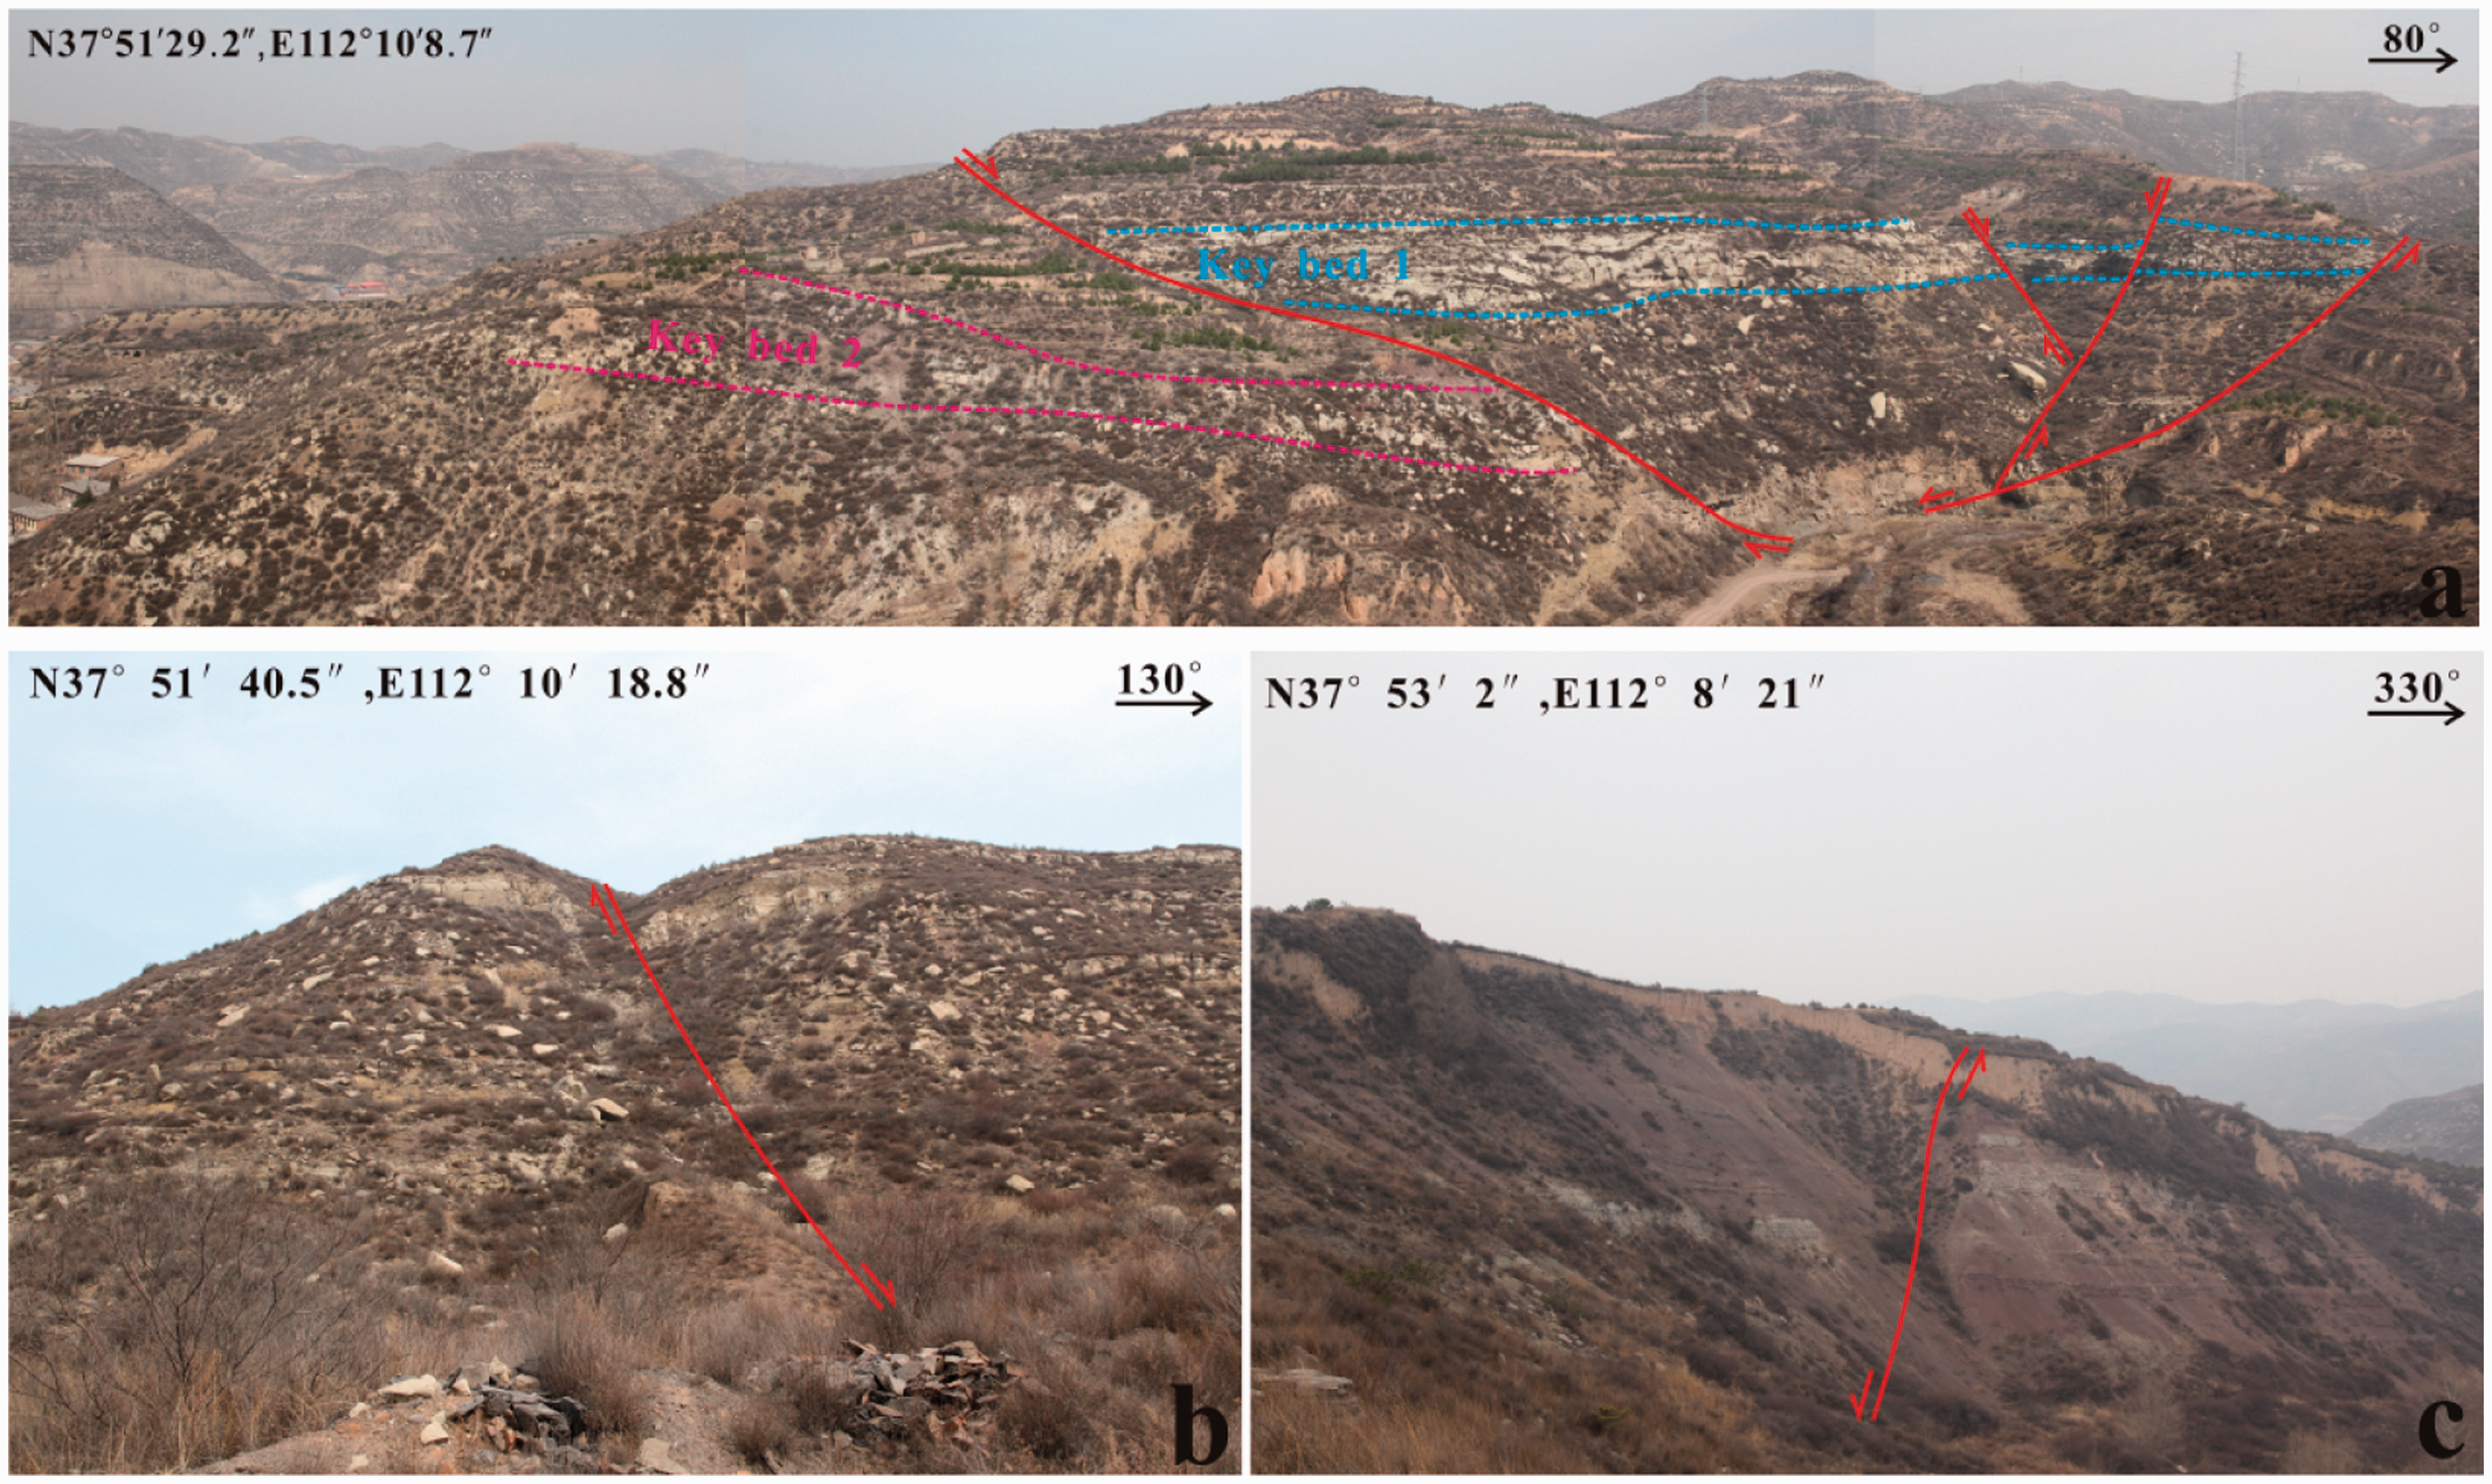
Based on the research of Su et al. (2005), the well logging interpretation data of well C084 and C144 were collected and disposed to analyze geological evolution history of coal-bearing formations in 1D packaged petromod software. Four stages were divided (Figure 6).
Schematic diagram of tectonic evolution of the XCF.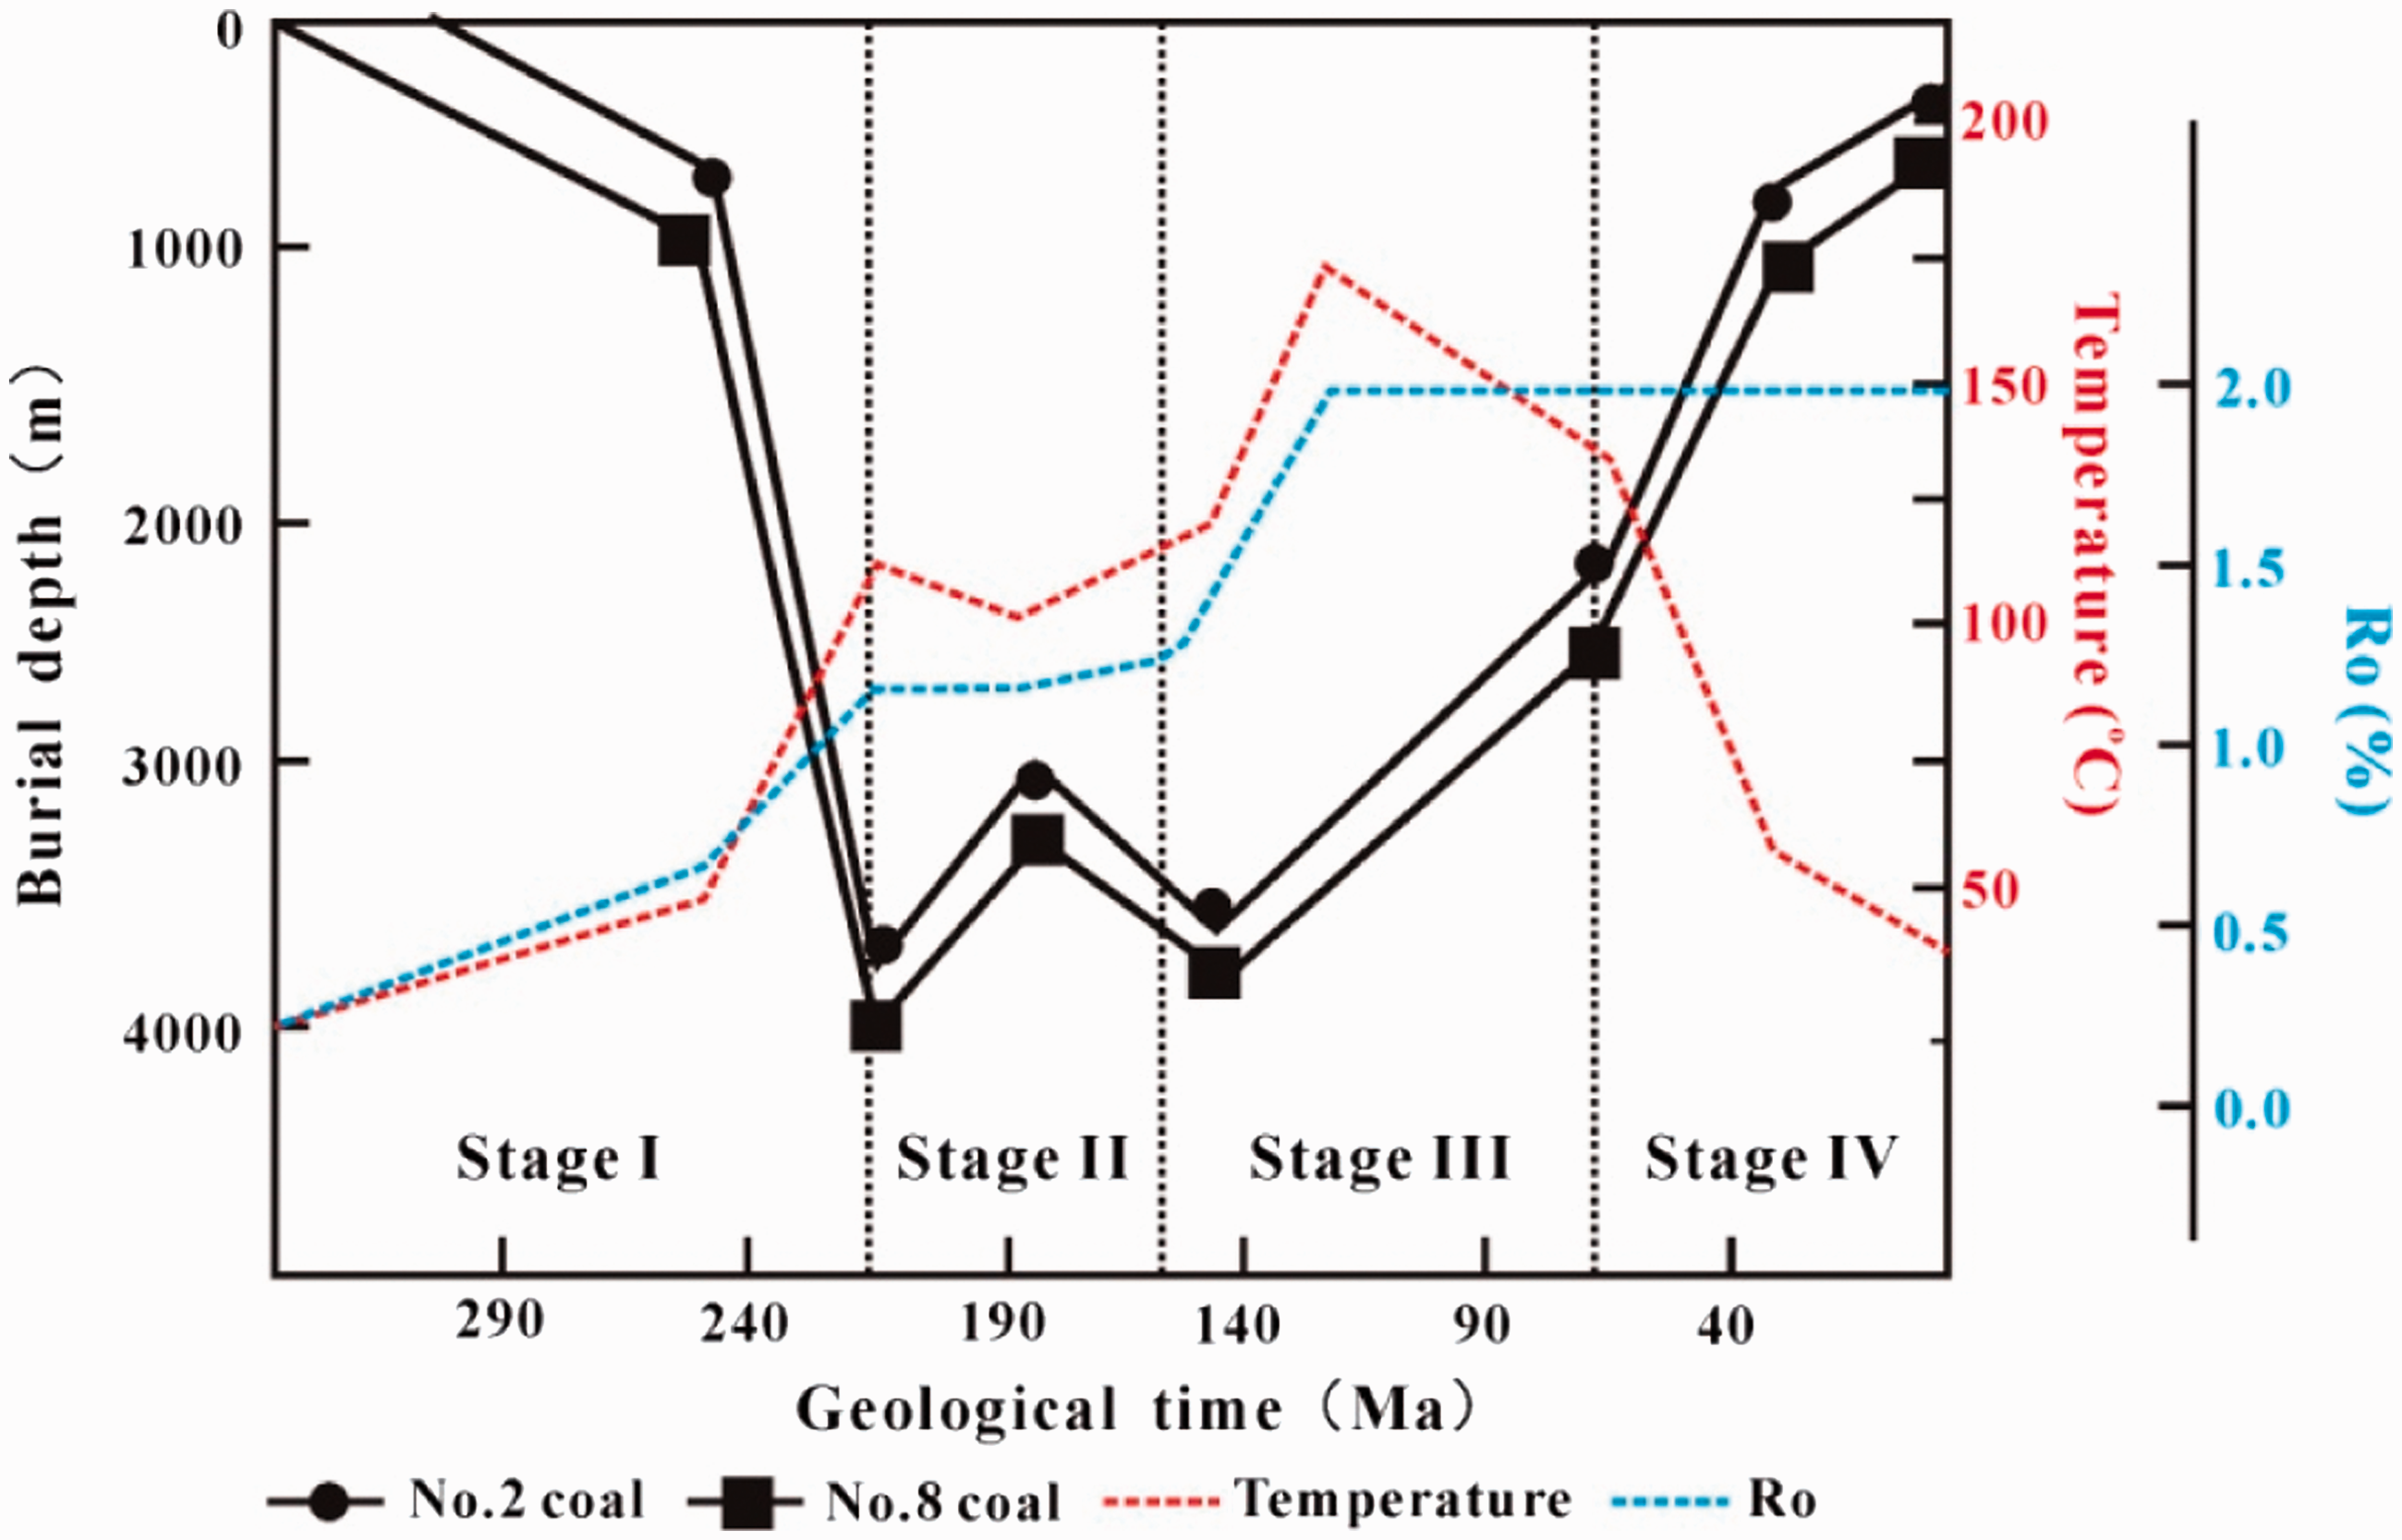
Stage I was the Indosinian stage, a rapid subsidence stage, and first gas generation stage from the late Permian to the Triassic. Stage II was the early Yanshanian stage in the middle Jurassic, which was a slowly fluctuant stage. During this stage, gas content and burial depth of coal seams had no obvious shift. Stage III was the late Yanshanian stage, uplifting slowly stage from the late Jurassic to the early Cretaceous combined with magmatism intrusion, which induced the thermal metamorphism of coal and secondary gas generation. Stage IV is a rapid uplift stage since the Cenozoic, Himalaya stage, during which the burial depth and gas content of coal seams are decreased rapidly.
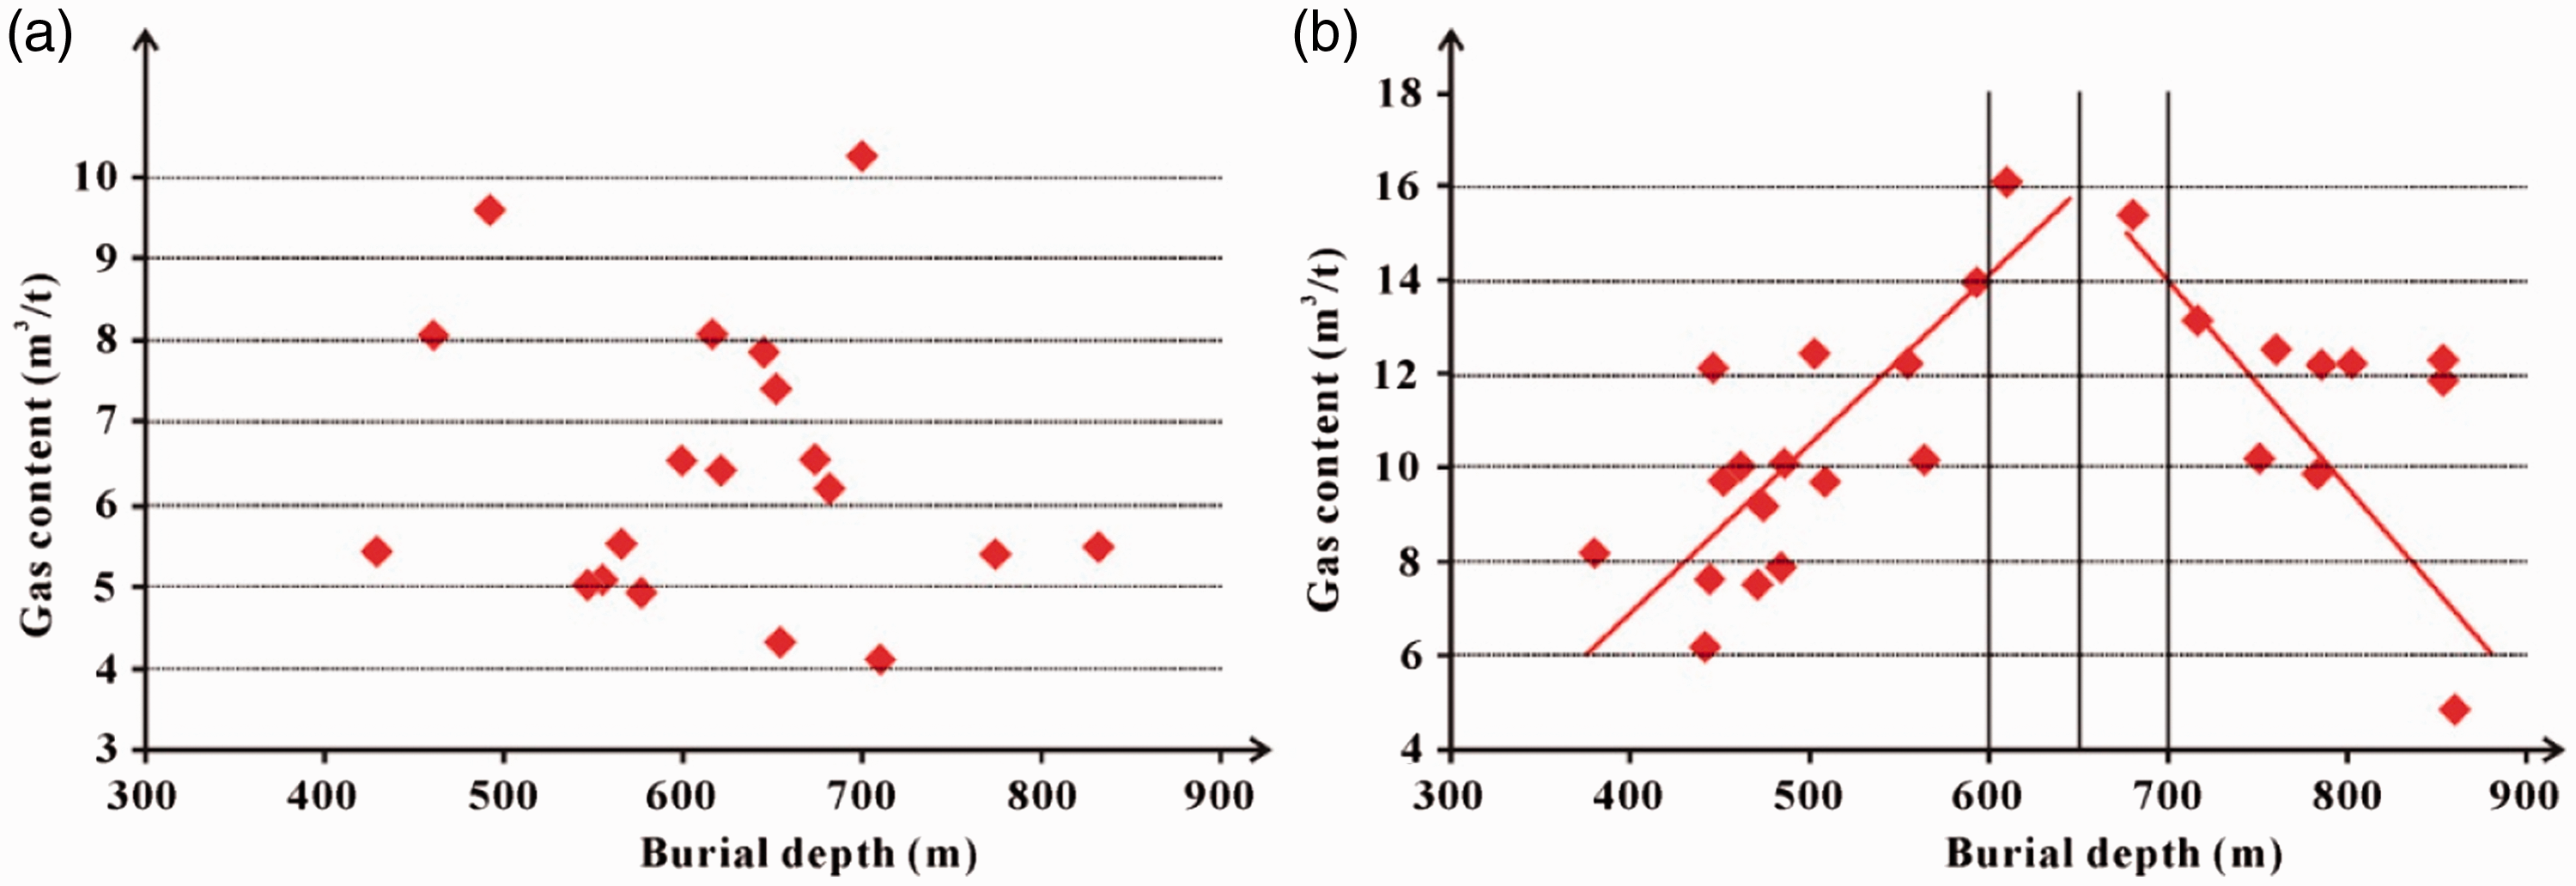
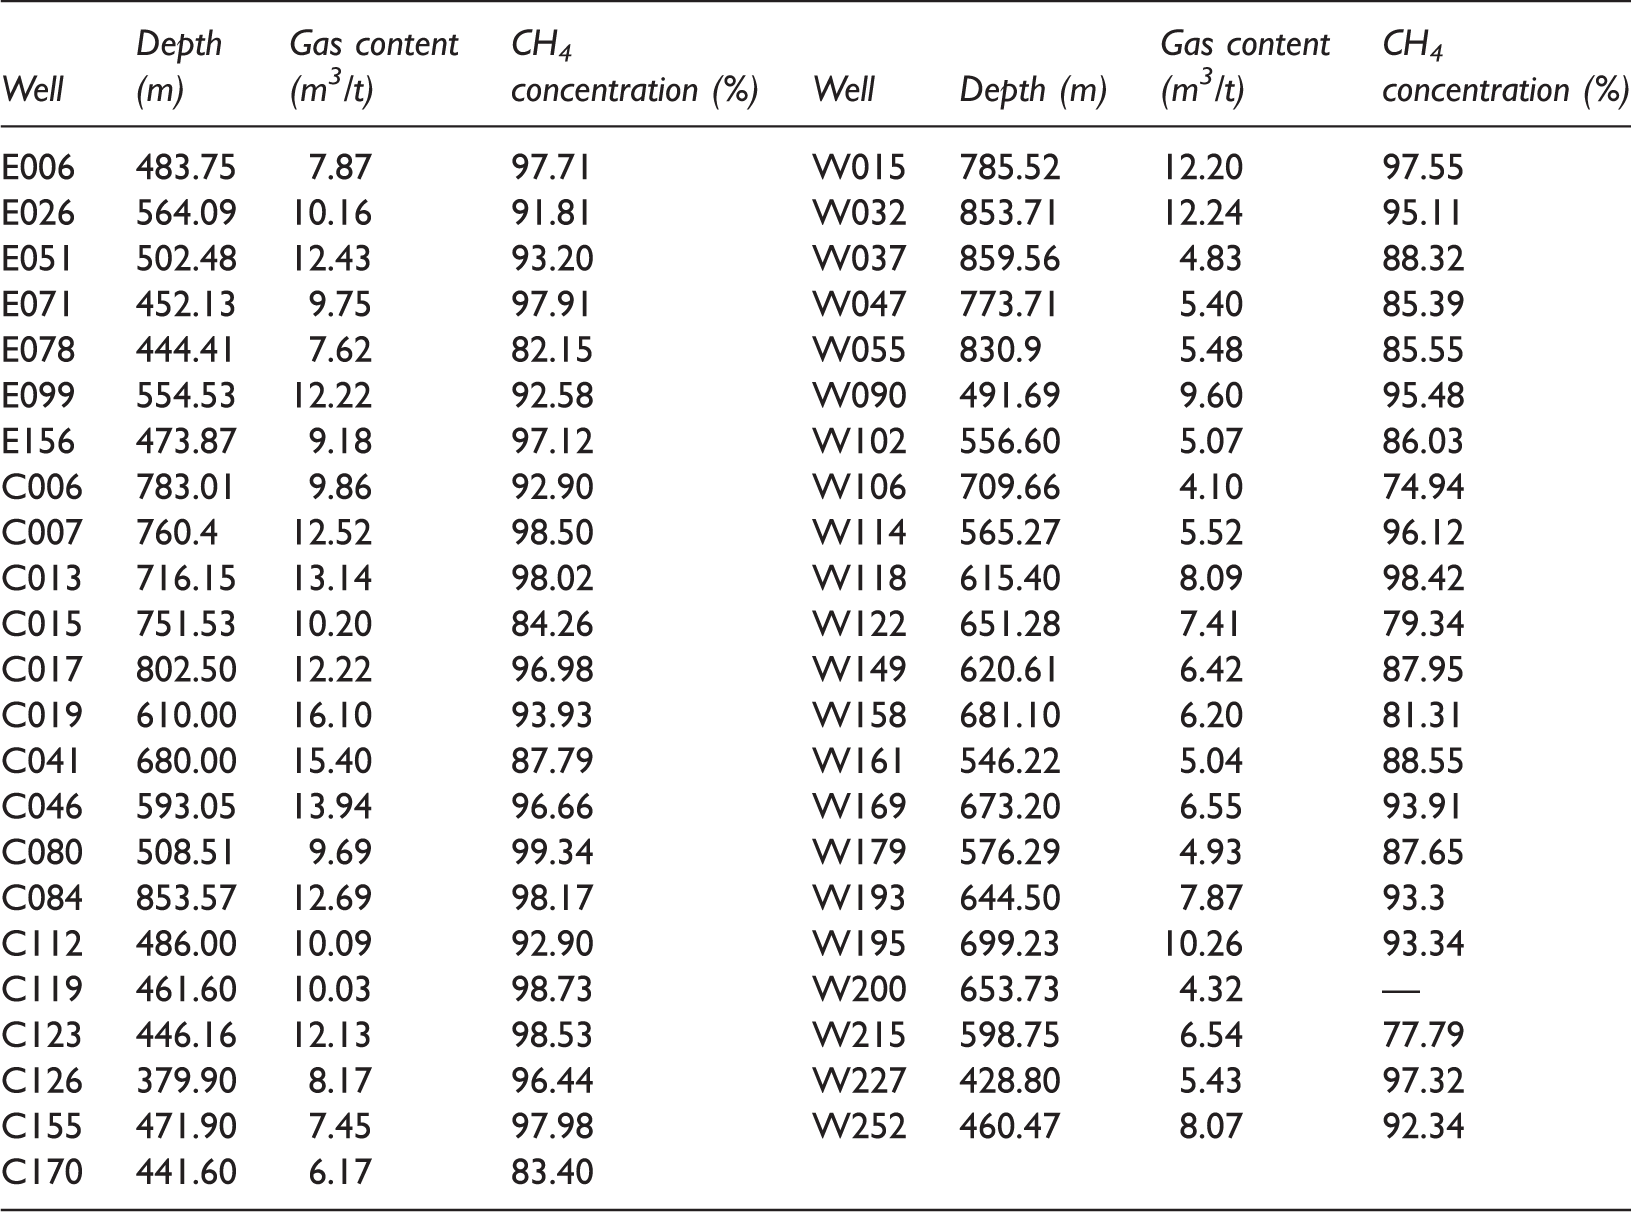
In the B3 area, the burial depth of the No. 8 coal seam ranges from 250 m in the east margin to 850 m in the west margin (Figures 7 and 8). We collected coal core samples from 46 wells (11 in B3) in the XCF and tested their gas content and gas components (Table 1) following Chinese national standards GB/T 19559-2008 and GB/T 13610-2003, respectively. The results show that gas content has close relation with burial depth in the east wing of the Malan syncline. When burial depth is shallower than 650 m, gas content has notable positive correlation with burial depth. They have negative correlation when burial depth is deeper than 650 m (Figure 9). Researches in other CBM-producing basins got the similar relation between gas content and burial depth (Hamilton et al., 2012; Scott et al., 2007). However, in the west wing of the Malan syncline, this relation is weak since the west wing is a compound fold and the east wing is a simple monocline, and structural form and position have superimposed effects on gas content (Cai et al., 2014).
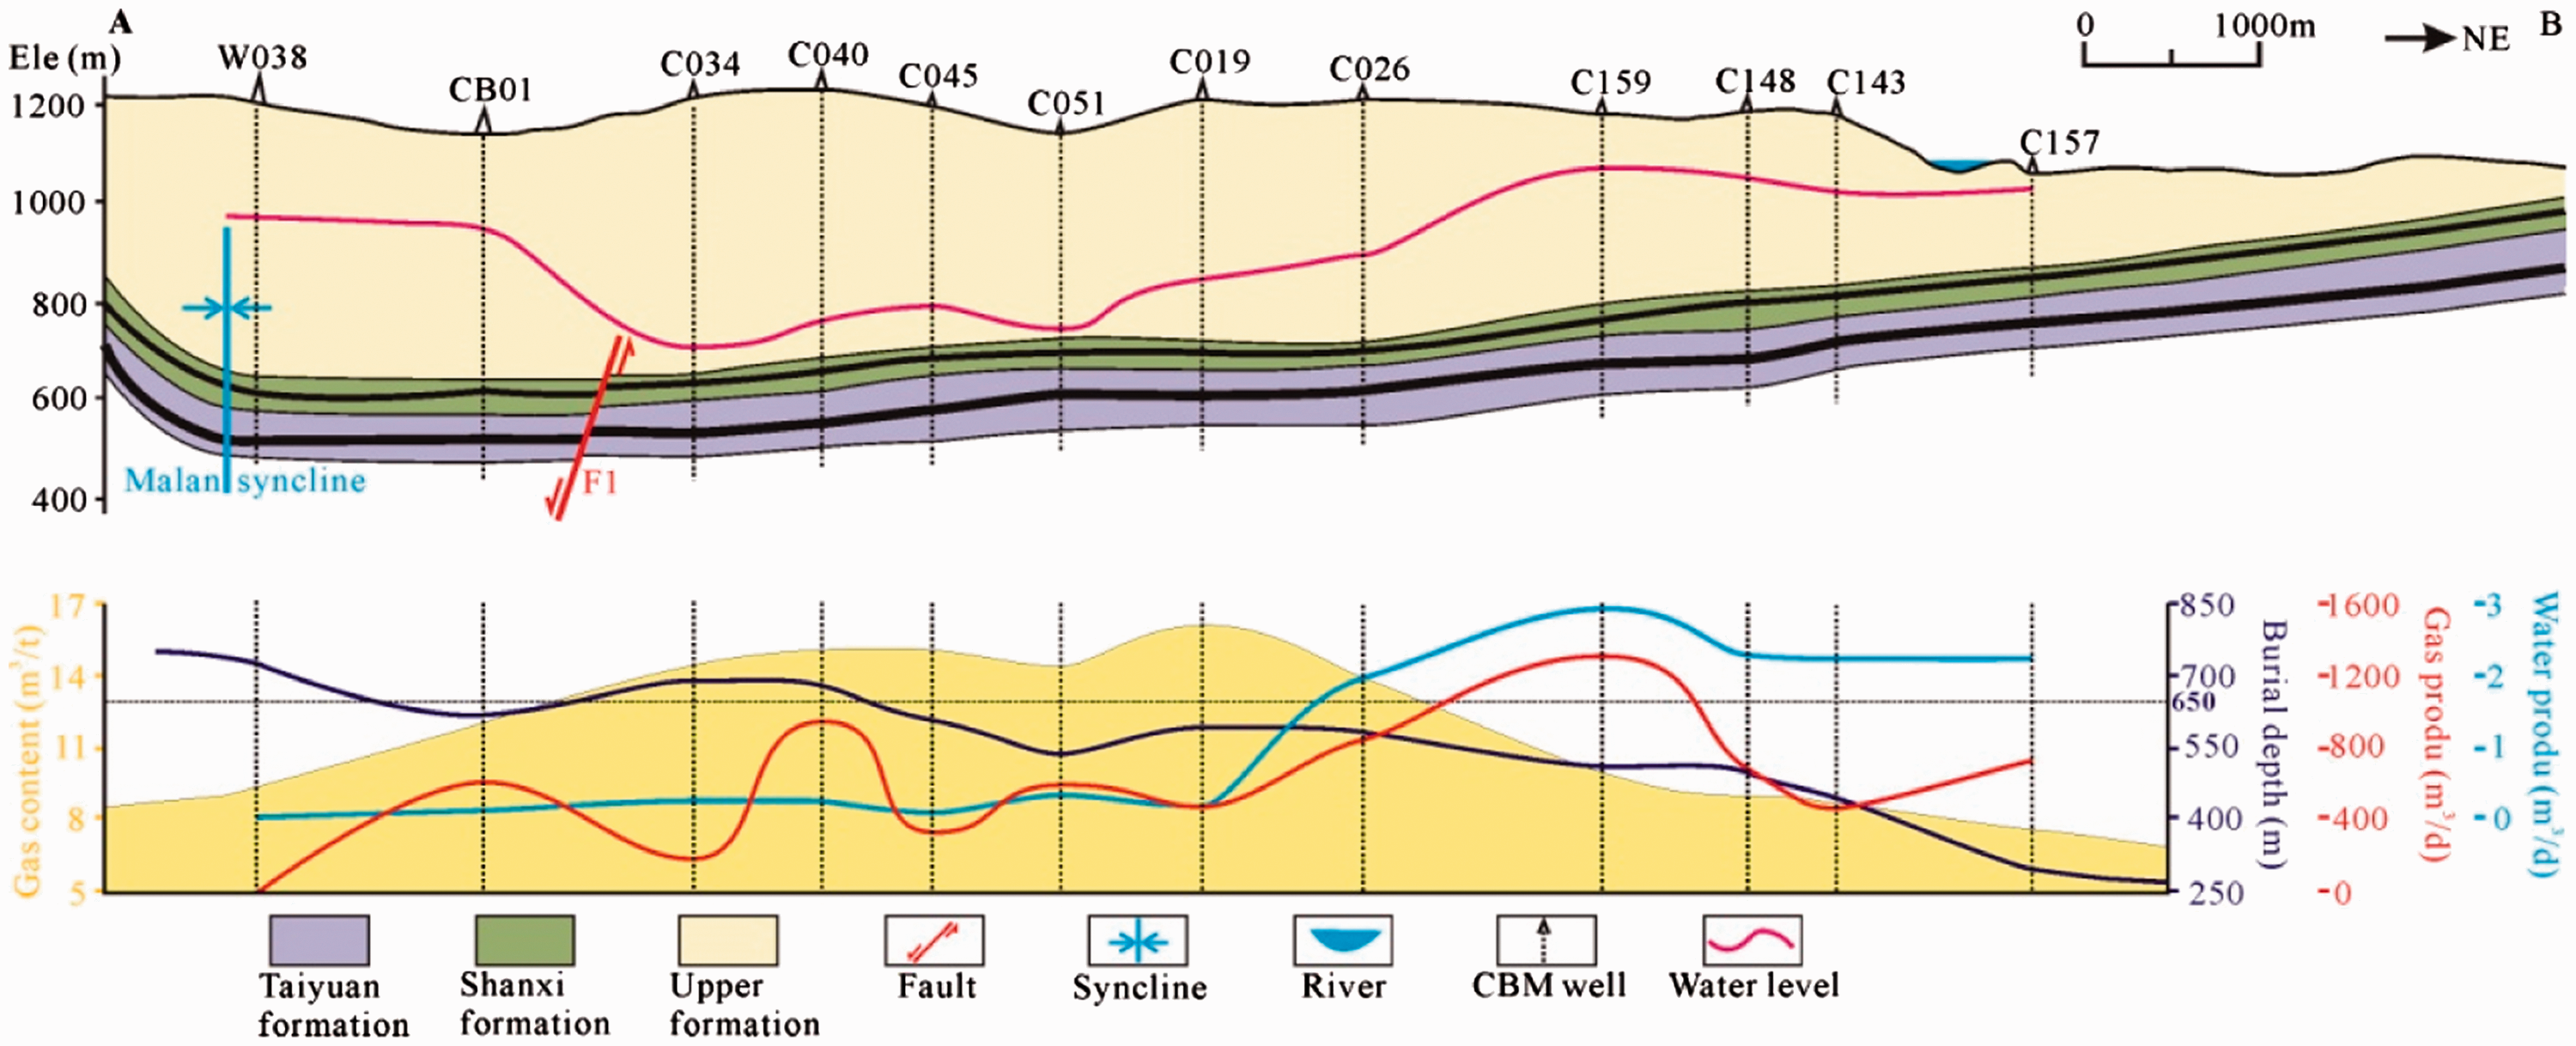
Burial depth map of the No. 8 coal seam in the B3 area. Wells section (AB) in the B3 area. (a) Scatter map of gas content and burial depth in the west wing of the Malan syncline and (b) scatter map of gas content and burial depth in the east wing of the Malan syncline. Testing results of gas content and CH4 concentration of the No. 8 coal seam in the XCF.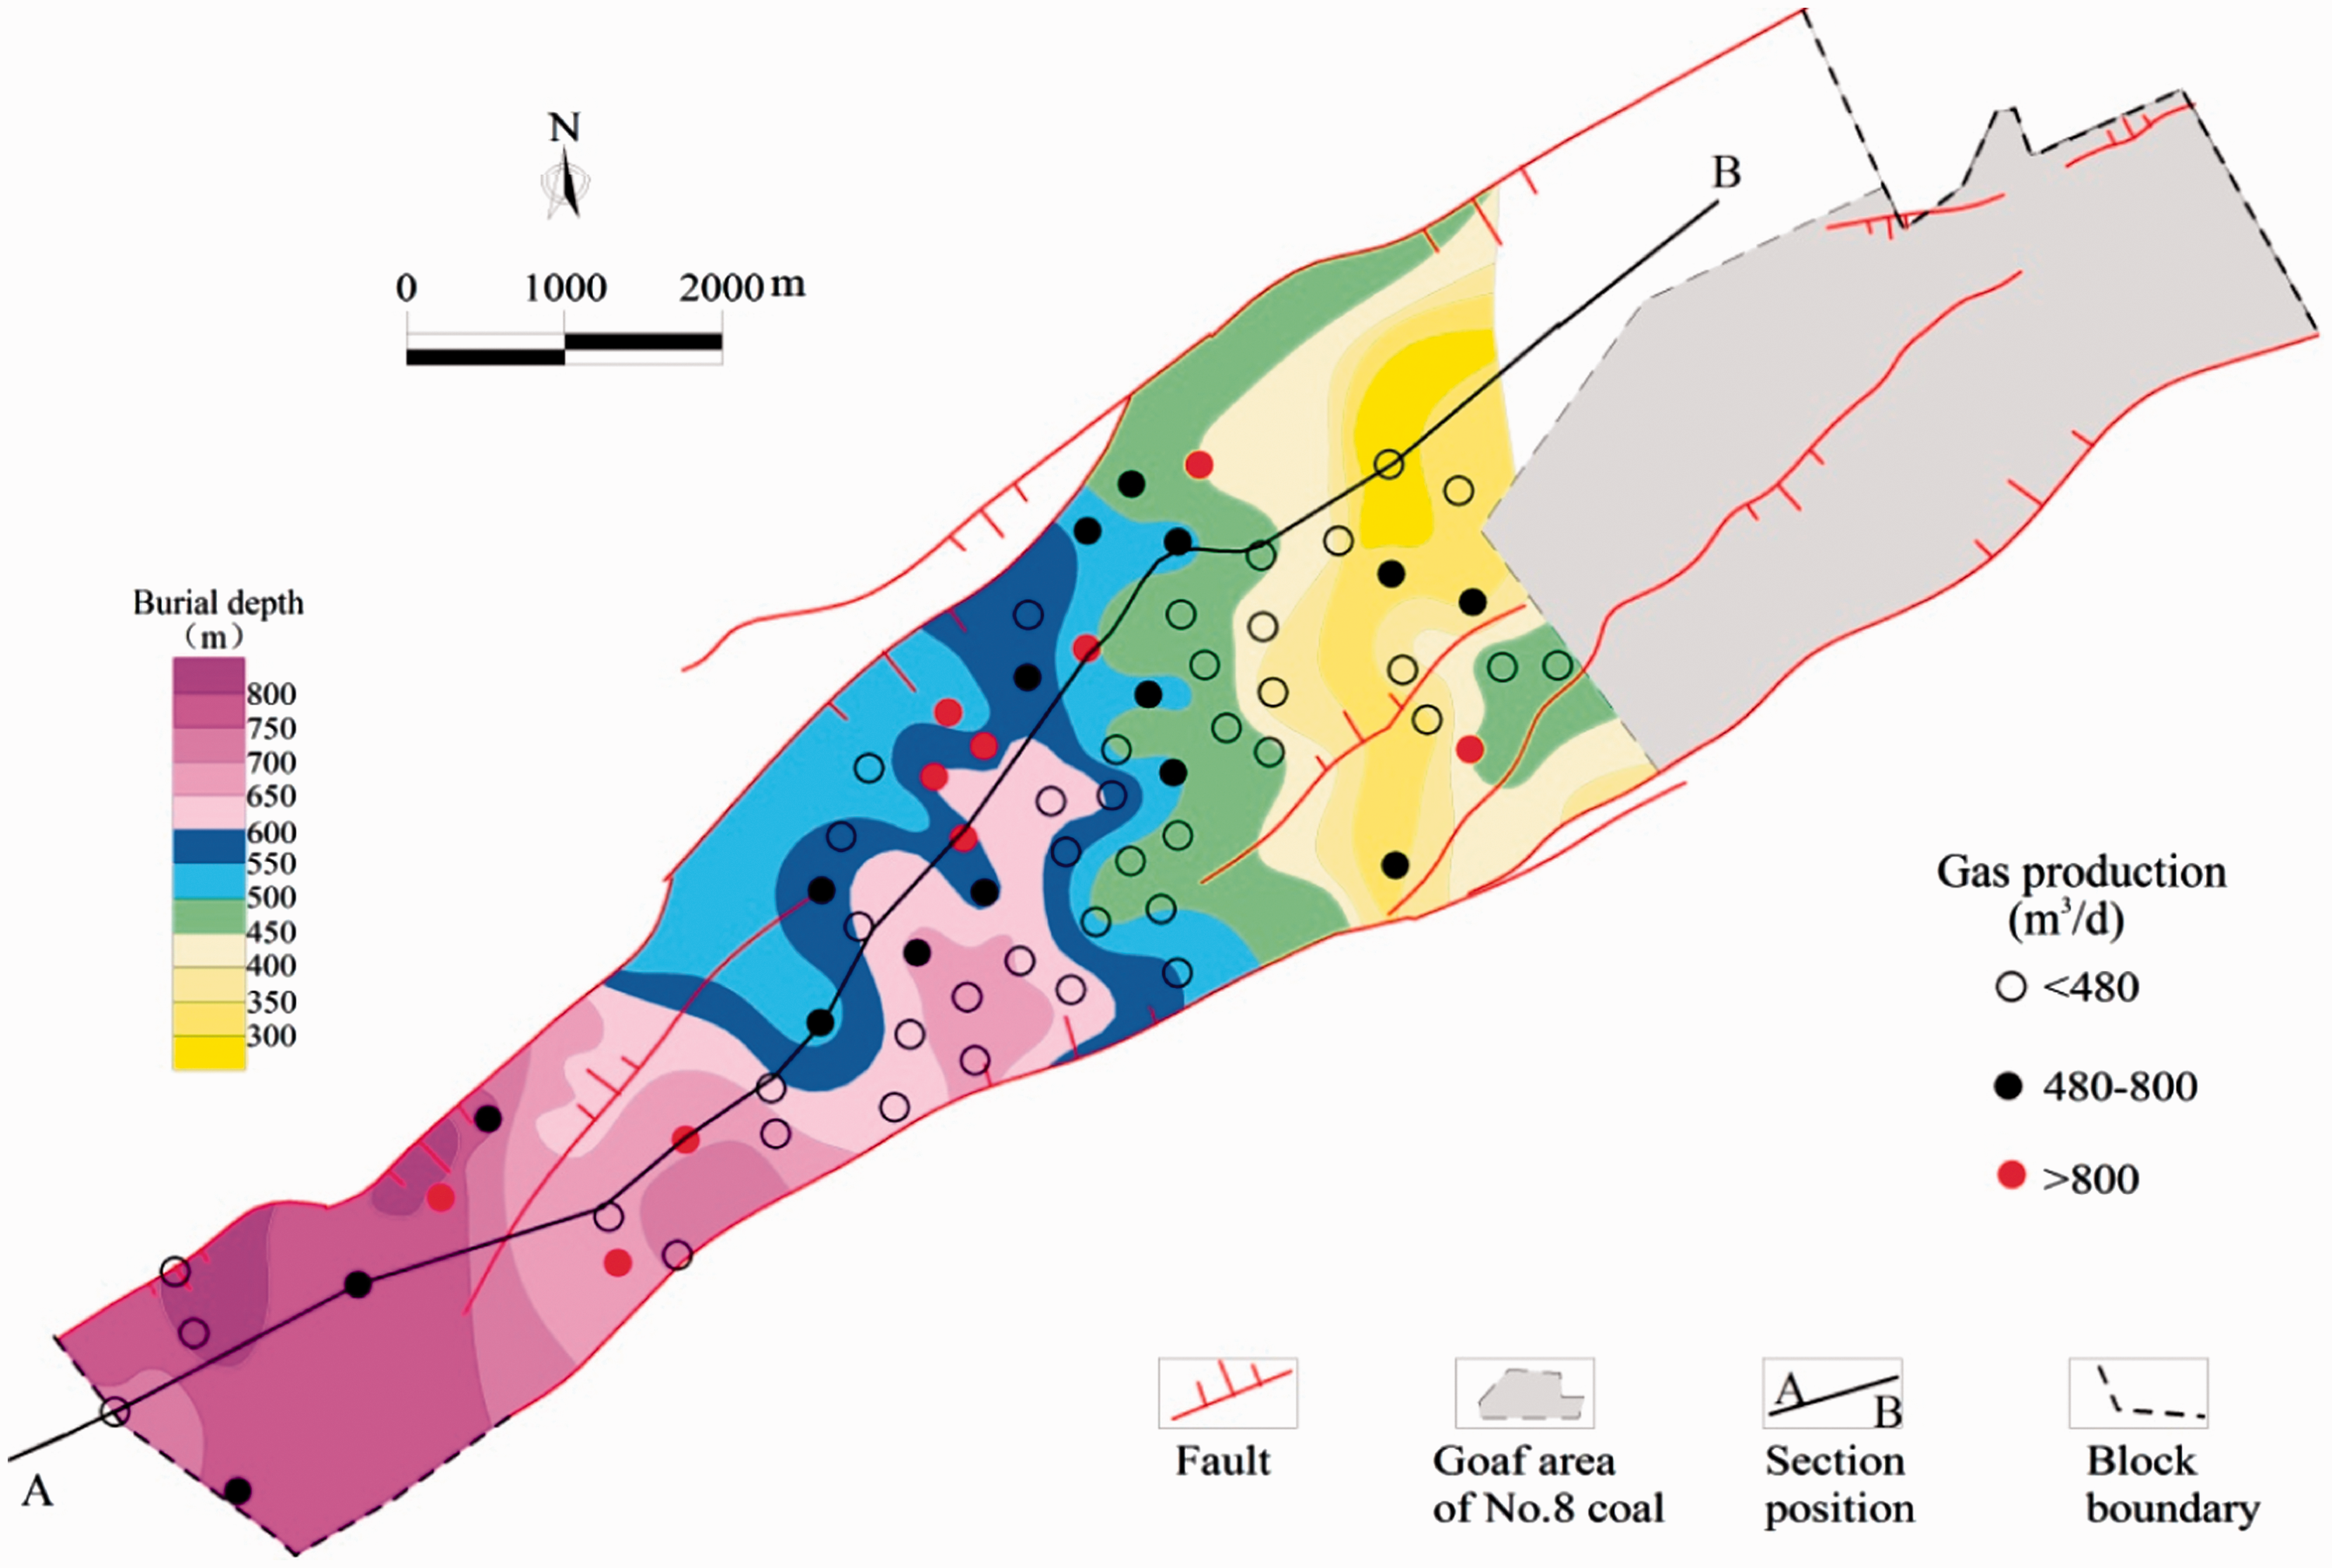
Sedimentary characteristics
In the B3 area, the Taiyuan formation was deposited from lagoon-barrier island environment with thickness of 52.7–159.2 m, and lithology of limestone, mudstone, sandstone, and coal (Wang et al., 2015). The thickness of the No. 8 coal seam ranges from 0.95 to 4.97 m (the average is 2.82 m) (Figure 10(a)). The number and accumulated thickness of gangues in the No. 8 coal seam are ranged in 0–3 layers and 0–1.9 m (Figure 10(b)), respectively. After the accumulation of the No. 8 peat swamp, marine transgression changed the peat swamp into neritic shelf (Pang et al., 2015). The roof of the No. 8 coal seam is Miaogou limestone (Figure 2) with thickness of 0.87–5.95 m, of which the sealing capability is generally high.
(a) Coal thickness map of the No. 8 coal seam in the B3 area and (b) map showing gangue number and accumulated thickness of the No. 8 coal seam.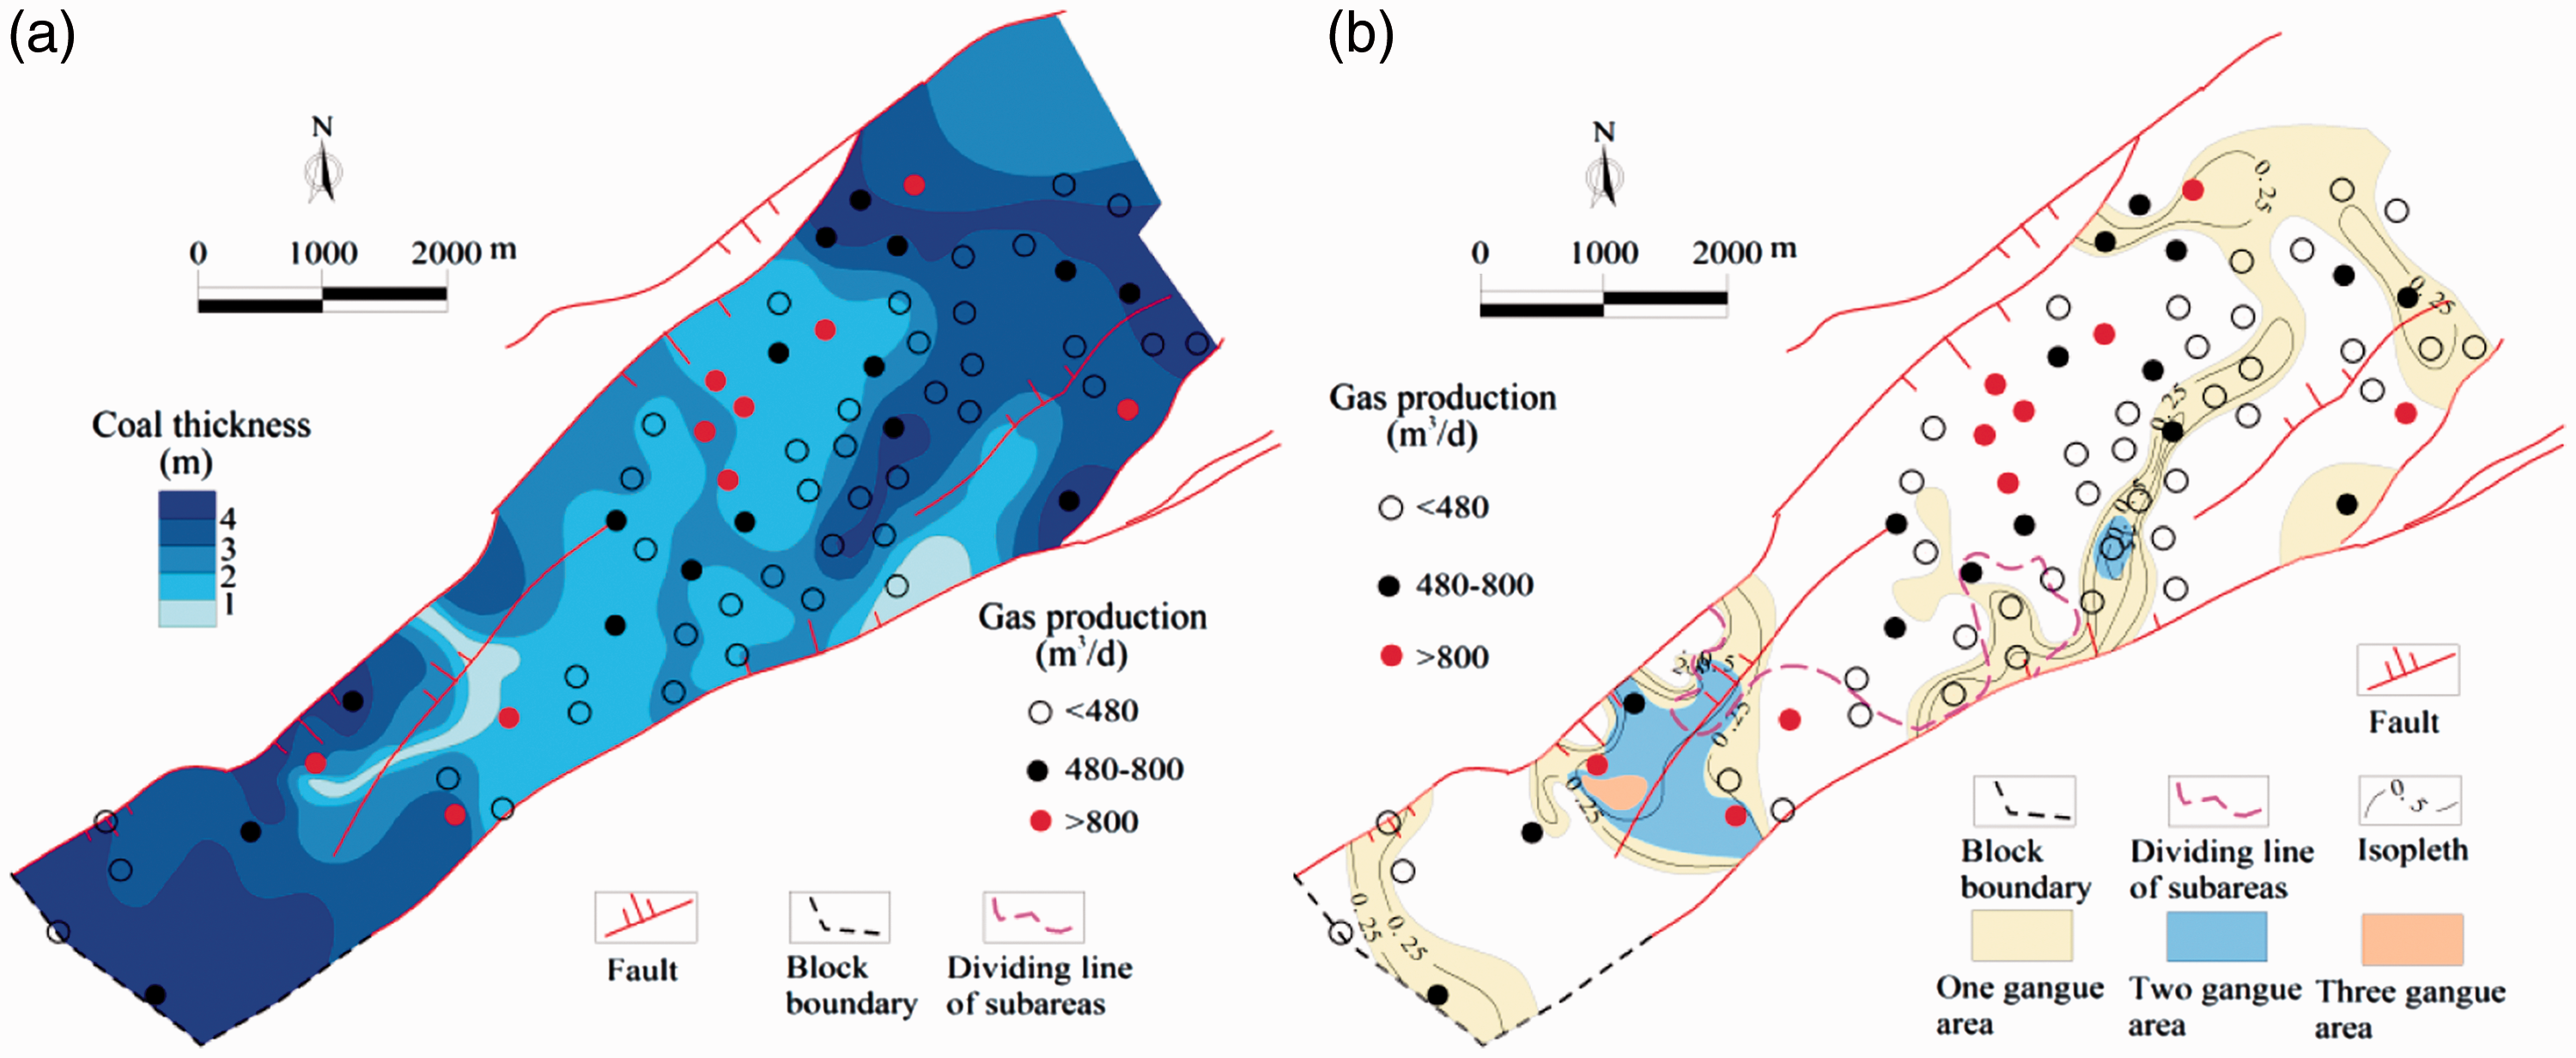
Hydrogeological characteristics
The reduced water level was calculated according to the bottom hole pressure and the water column height in CBM wells, referencing the formula of Wang et al. (2015). In the B3 area, the water level elevation gradually changes from 650 m in the west part to 1150 m in the east part (Figure 11). Hydrodynamic condition has notable effects on gas content and methane concentration. Lower gas content and methane concentration occur in the runoff areas, and relatively higher gas content and methane concentration appear in the stagnant areas (Scott, 2002).
Comprehensive evaluation of reduced water level and well productivity in the B3 area.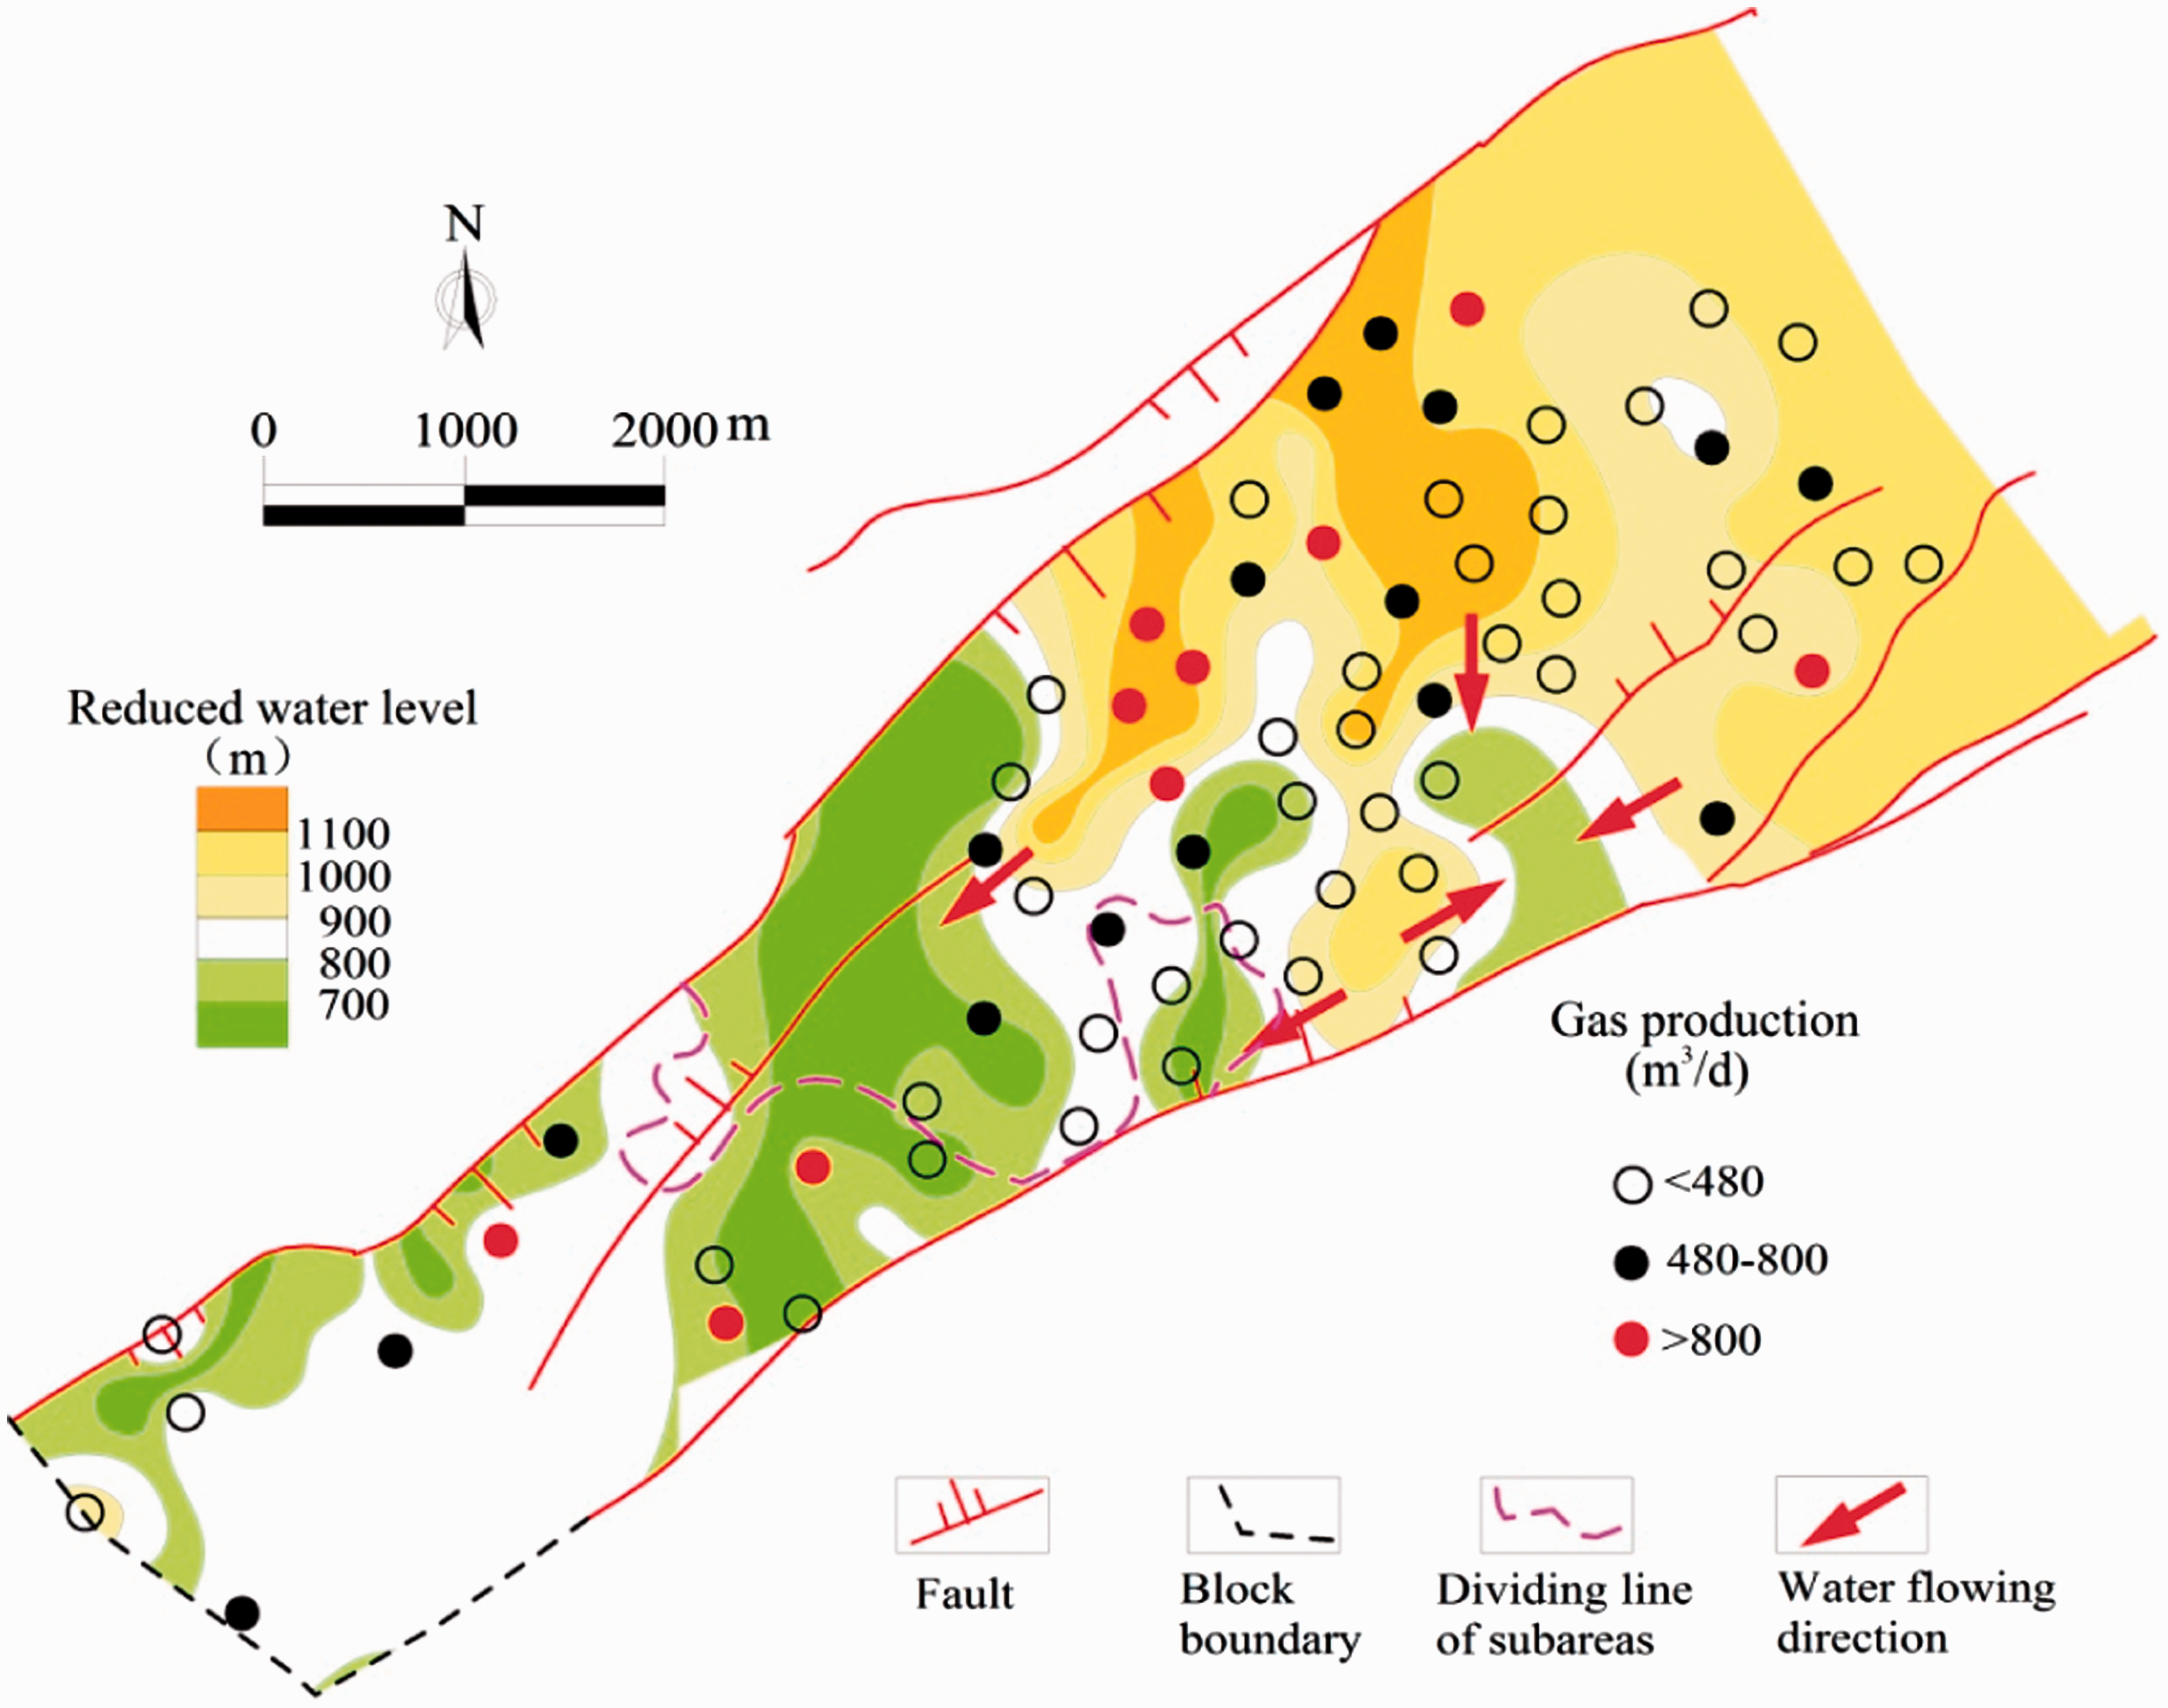
Statistic data of water type in the XCF.
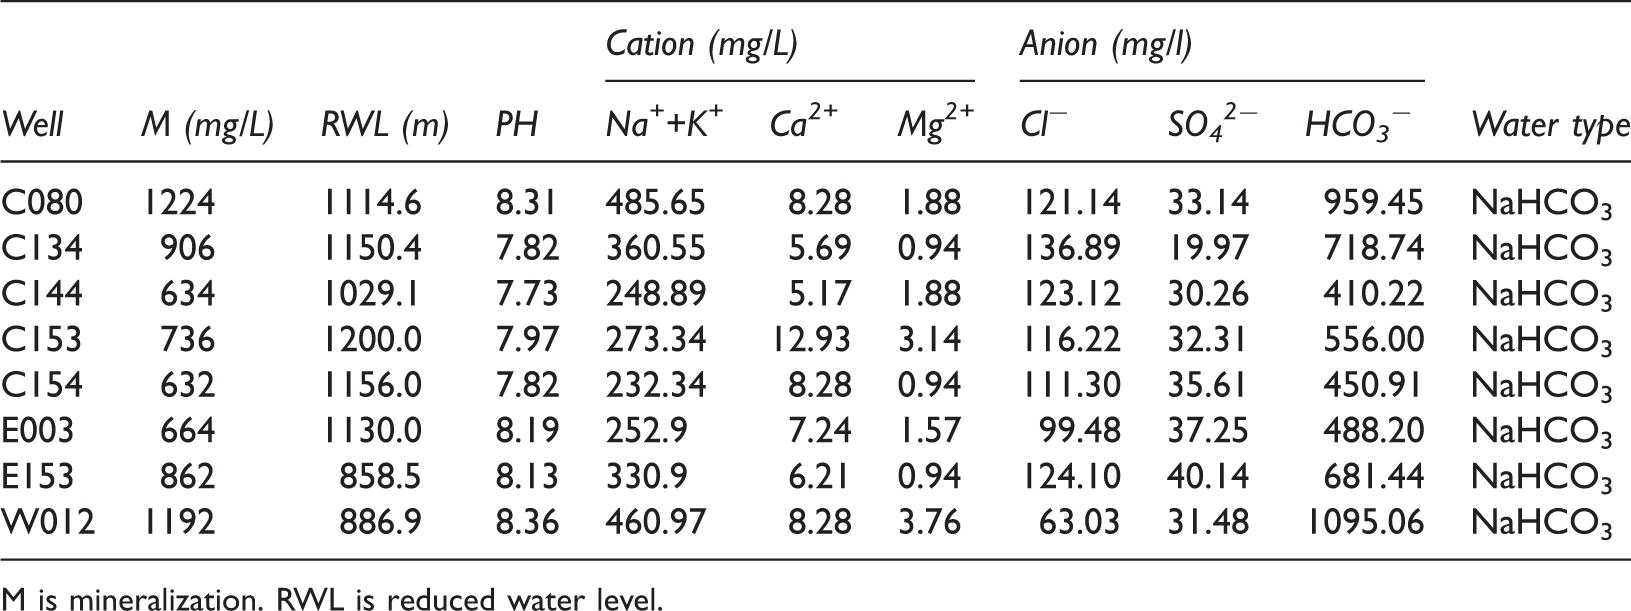
M is mineralization. RWL is reduced water level.
Parameters controlling CBM well productivity
Well drilling, well logging, fracturing, and draining data were collected, from which we extracted three types of parameters (geological, draining, and engineering types). Geological type mainly includes net coal thickness, gas content, burial depth, water level, and reservoir density and resistivity. Draining type consists of water production and flowing well-bottom pressure. Total sand volume, the differences between bursting pressure and stop pressure (Pb–Ps), and stop pressure and drop pressure (Ps–Pd) belong to engineering parameters.
Gas content and permeability of coal seam usually are primary geological parameters affecting gas production, and both have close relation to burial depth (Tao et al., 2014). The relation between gas content and burial depth in the XCF was described in “Structural characteristics” section. Burial depth has totally different effects on gas content between deep and shallow buried subareas, so it is unadvisable to analyze the effects of parameters on gas production in the B3 area as a whole. According to the burial depth of the No. 8 coal seam, we subdivided the B3 area into two subareas (the west and east subareas) with dividing line of 650 m. On this basis, we analyzed the effects of different kinds of parameters on gas production in each subarea.
Unfortunately, no one well in the XCF was tested to date, so the permeability is unavailable directly from collected data. Considering this, we chose reservoir resistivity data to reflect original permeability since (1) well test, experiment of coal sample in laboratory, and reflection of logging data are main ways to get reservoir permeability. However, experiment is not in situ condition, and well-testing process is expensive and fussy. In contrast, well logging data are very valuable in situ data to reflect reservoir properties (Tian et al., 2015); (2) coal matrix and rock grain are always nonconducting, but the water in the fracture and pore of coal and rock is (Wang et al., 2016); (3) water always just flows in fracture as the special structure of coal seam; (4) the mineralization of coal-bearing formation water is low and has litter difference (see “Hydrogeological characteristics” section), of which the effect on resistivity is ignorable (Fu et al., 2009); (5) logging well is conducted immediately when drilling well is finished. Actually, coal seam put into CBM development is fractured generally, which means original permeability is changed. We chose Ps–Pd to reflect reservoir permeability after fracturing process, since the fracturing fluid will back to bole hole, and pressure will drop during the last stage of fracturing process (Zhang and Bian, 2015). The content of backed fracturing fluid and bracing effect can be reflected by Ps–Pd.
Geological parameters
Net coal thickness and gas content
Coal thickness and gas content determine the resource amount as CBM resource evaluation method (equation (1), see Appendix 1). The calculated resource amount of the No. 8 coal seam ranges from 62.8 × 10⁴ to 226.1 × 10⁴ m3 if the influencing radius of CBM well is 100 m, which is enough for CBM development as the high yield ambit is 800 m3/d.
As shown in Figure 12(a), the correlation between net coal thickness and gas production is weak in both the west and east subareas. The net coal thickness of six high yield wells range in 1.4–2.3 m, and the other four high yield wells is 3–4 m, which reflect the resource amount is enough for CBM development, and net coal thickness is necessary condition of gas production even no notable correlation between them.
(a) The relationship between CBM production and net thickness, (b) the relationship between CBM production and gas content, (c) the relationship between CBM production and burial depth, (d) the relationship between CBM production and reduced water level, (e) the relationship between CBM production and resistivity, and (f) the relationship between CBM production and density.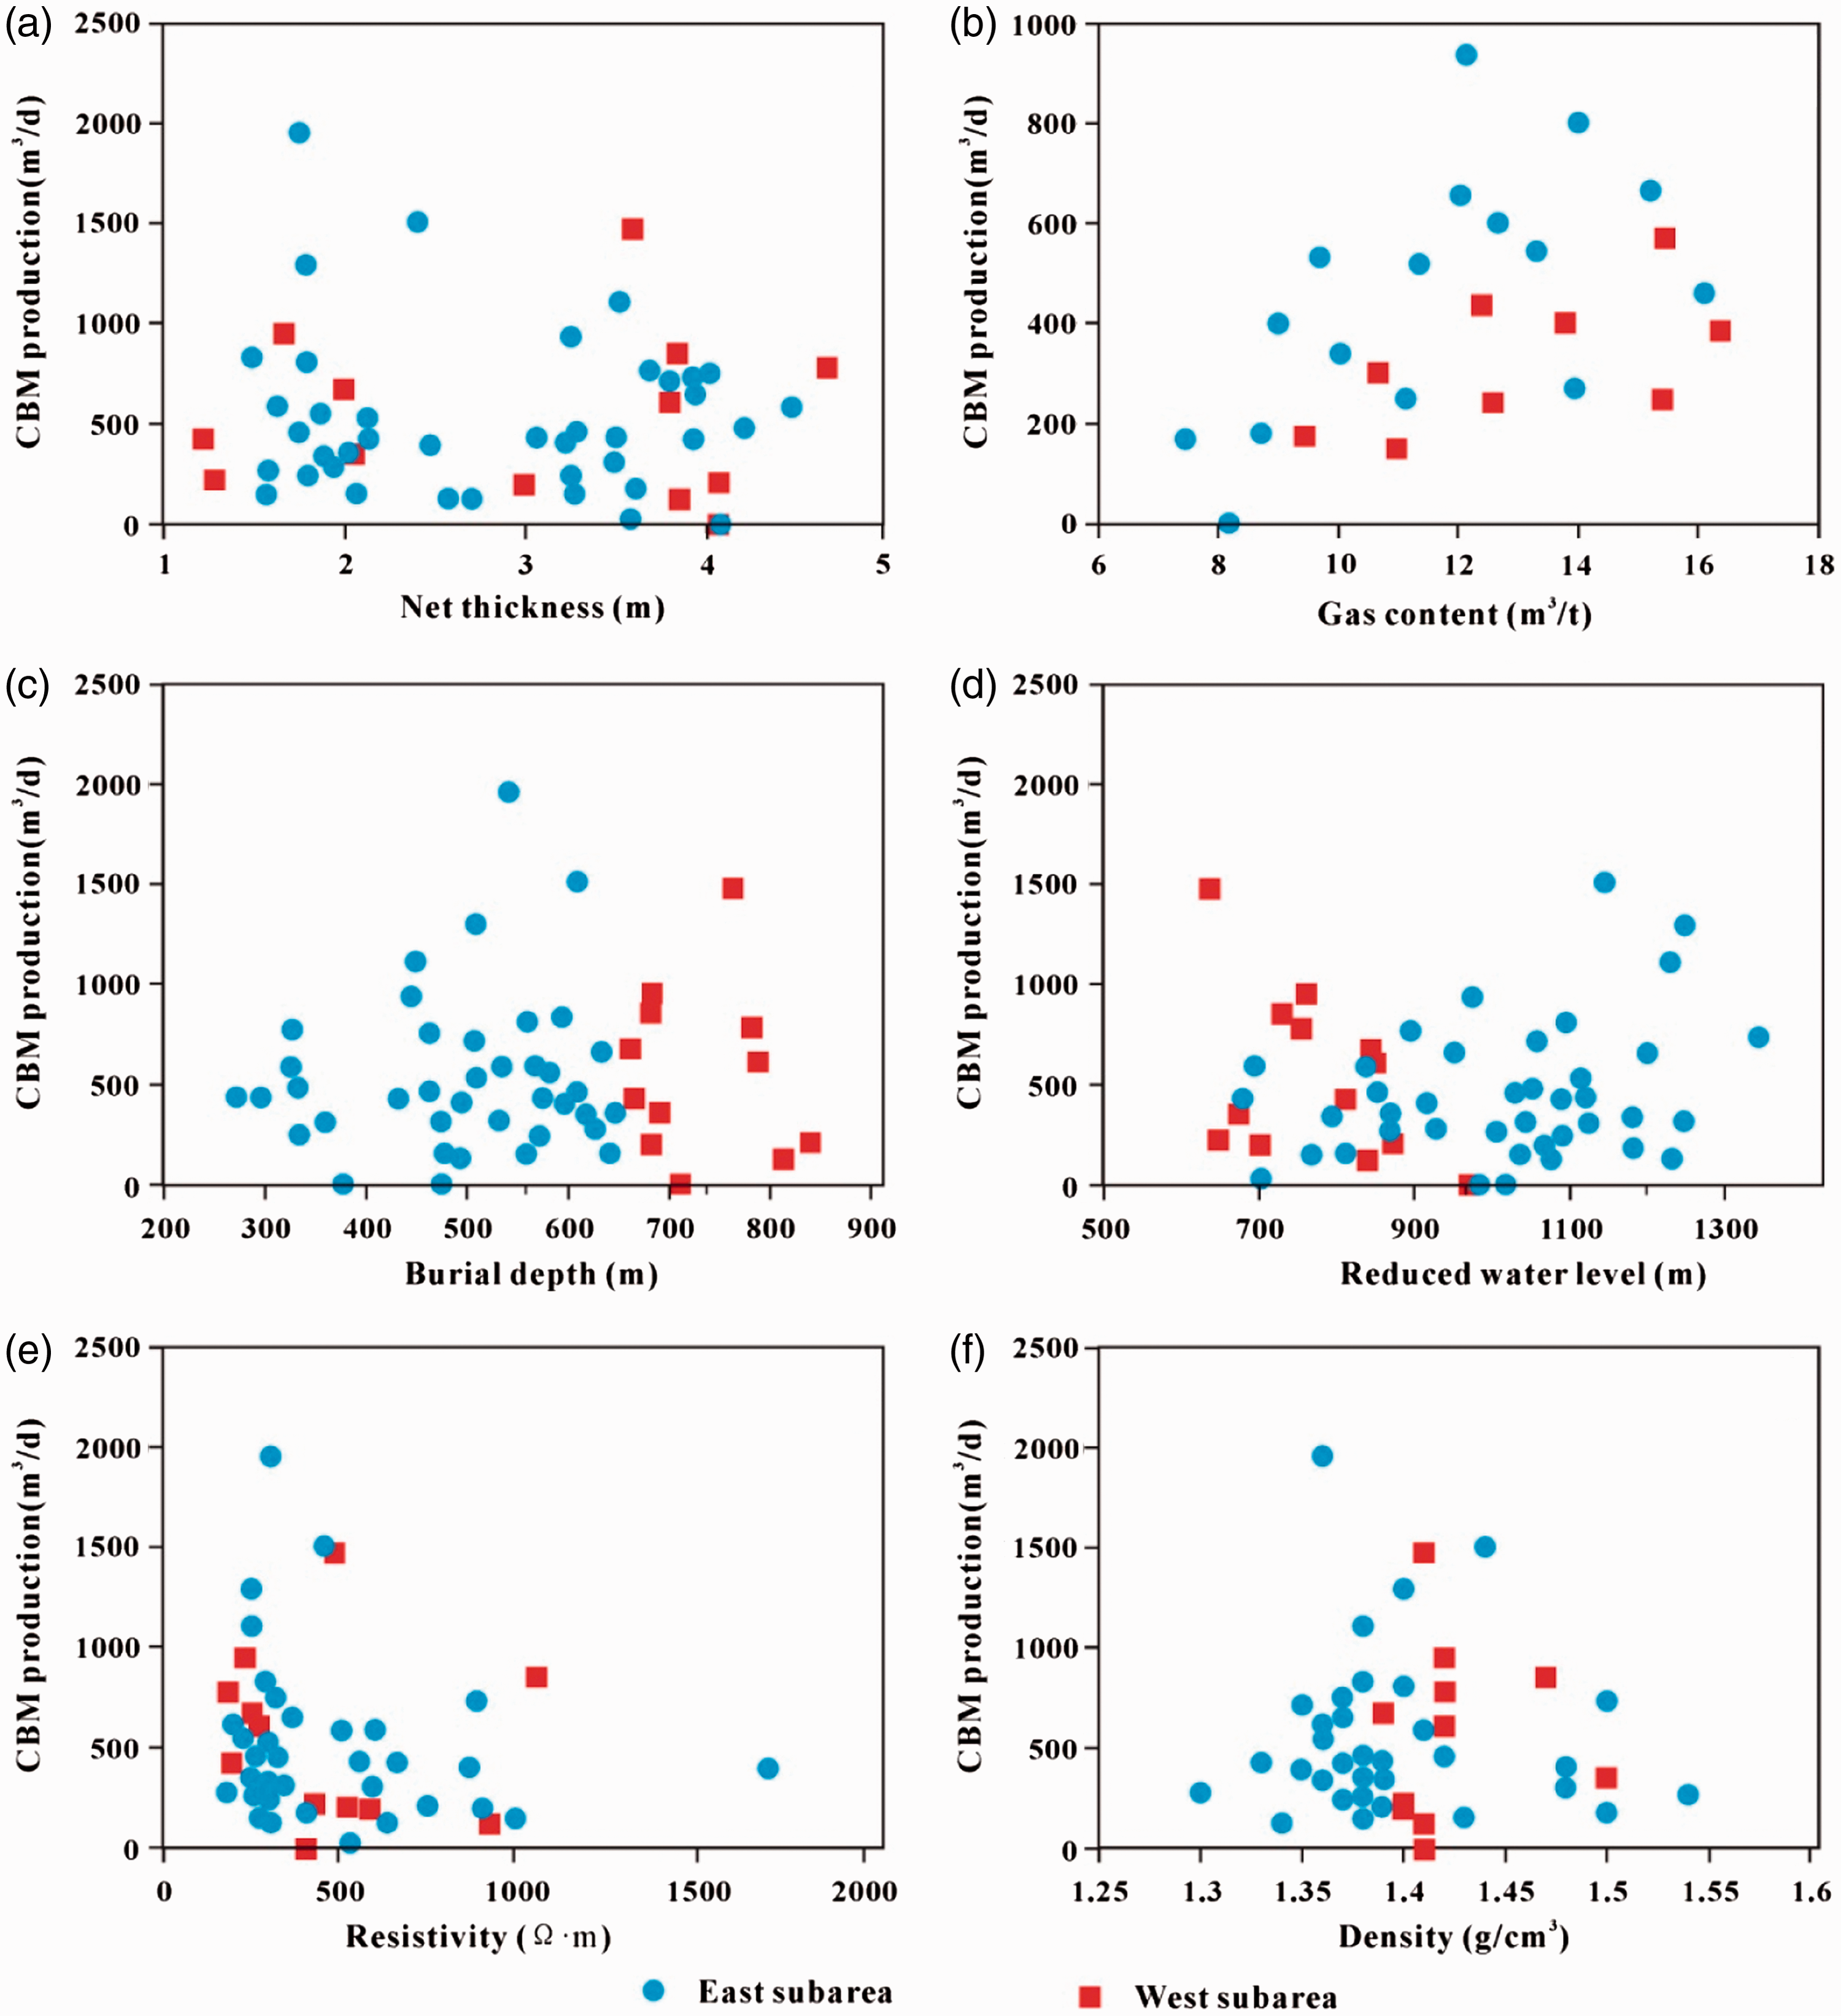
With the data on the petro-physical properties of the coal reservoir and the isothermal adsorption experiments, the gas content of the corresponding CBM wells could be calculated. As seen in Figure 12(b), the gas content of the No. 8 coal seam in the B3 area ranges from 6 to 16 m3/t, which has obvious positive correlation with gas production. The gas content of high and middle CBM yield wells usually no less than 8 m3/t, which means that wells with gas content less than 8 m3/t are tend to be low yield wells.
Burial depth
The burial depth of the No. 8 coal seam in the B3 area varies from 295.7 to 972.8 m based on 66 well data points. Figure 12(c) shows that wells with burial depth from 430 to 760 m (including the deeper section of the east subarea and the shallower section of the west subarea, which still reflects the necessary of subdividing subarea in this paper) tend to have a much greater potential for producing gas, with an average gas production of up to 544 m3/d per well. All 10 high yield wells, 13 middle yield wells, and 26 low yield wells are distributed in this section. The low yield ratio is 0.53, which is much lower than 0.61 in the whole B3 area.
Reduced water level
Reduced water level reflects the underground water level in CBM wells, which relates to coal-bearing formation attitude and flowing direction of water. Usually higher gas content and methane concentration, lower permeability occurs in higher reduced water position (runoff area), and lower gas content and methane concentration, higher permeability appears in lower reduced water position (stagnant area) (Scott, 2002). The B3 area also follows this law (Figure 8).
As shown in Figure 12(d), the relation between reduced water level and gas production in the east and west subareas exhibits opposite trend. The reduced water level in the west subarea ranging from 600 to 1000 m has negative effect on gas production, which is in line with the results of other scholars (Aminian and Ameri, 2009; Ghaedi et al., 2015; Thararoop et al., 2015). However, in the east subarea, most of the high yield wells tend to locate in high reduced water level (average is 1010.7 m) section. This may be related to the burial depth and permeability. Many studies show that the relatively low reduced water level with deep burial depth is helpful for preserving gas, resulting in high gas content (Anna, 2003; Cai et al., 2014). Thus, negative correlation can be found between reduced water level and gas production in the west subarea. In contrast, higher reduced water level and shallower burial depth associated with lower gas content and higher permeability occur in the east subarea. The comprehensive actions of these factors may induce the abnormal relation between reduced water level and gas production in the east subarea.
(a) The relationship between CBM production and water production and (b) the relationship between CBM production and flowing well-bottom pressure.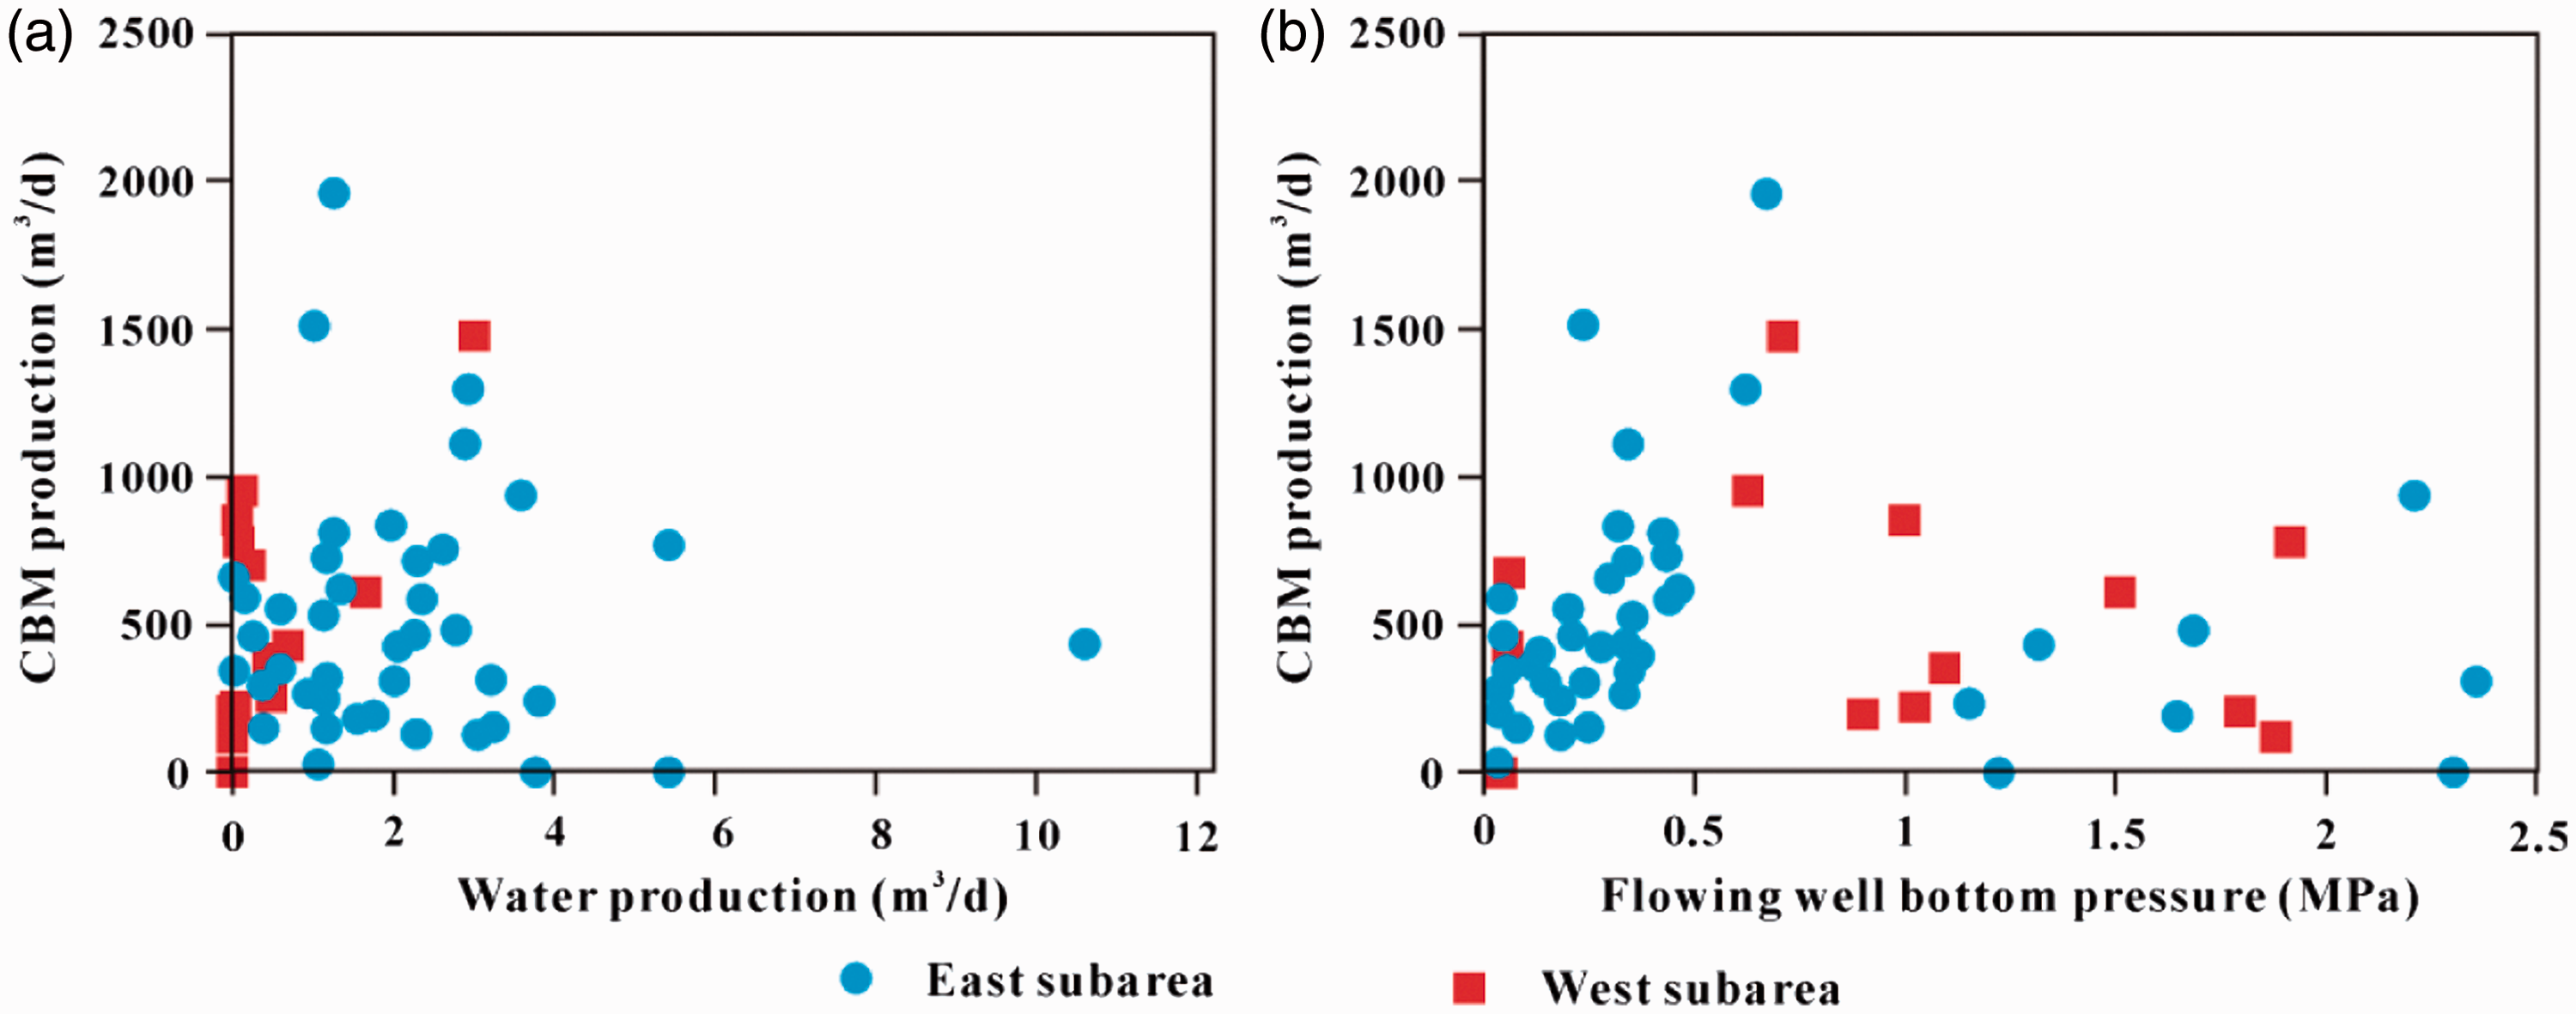
Reservoir resistivity and density
Reservoir resistivity and density are extracted from well logging data, which is much more important to reflect reservoir properties compared with experiment and well-test data, since experimental condition is not in situ and well-test process is much expensive and fussy (Wang et al., 2016).
Higher fracture porosity and permeability are corresponding to higher water content and better electrical conductivity, and bad electrical conductivity means low fracture porosity and permeability (Fu et al., 2009). As presented in Figure 12(e), the reservoir resistivity of 66 CBM wells range in 179–1728 Ω m. The low yield ratio is 0.51 and 0.76 in 179–500 Ω m section and 500–1728 Ω m section, respectively. The average reservoir resistivity of 10 high yield wells, 16 middle yield wells, and 40 low yield wells is 318.4, 372.7, and 498.1 Ω m, respectively.
As shown in Figure 12(f), the density of the No. 8 coal seam in the east and west subareas range from 1.3 to 1.54 g/cm3 (the average is 1.4 g/cm3) and from 1.38 to 1.5 g/cm3 (the average is 1.42 g/cm3), respectively. Figure 12(f) shows that wells with density from 1.35 to 1.45 g/cm3 have greater potential to produce gas, in which the average gas production is 578 m3/d, and the low yield ratio is 0.525.
Draining parameters
Water production
Field engineers control gas flowing rate mainly by controlling water production and flowing bottom hole pressure, to avoid reservoir damage. Usually higher water production is helpful for producing gas since it is a process of dewatering–depressing–desorbing–seeping (Li et al., 2015; Yao et al., 2014; Zhang et al., 2013). The water production dominates depressing degree. CBM will be desorbed from the surface of coal until the coal reservoir pressure is dropped to critical desorption pressure (Meng et al., 2014b).
As seen in Figure 13(a), the water production in the east subarea (0–10.7 m3/d, the average is 1.9 m3/d) is much higher than in the west subarea (0–3 m3/d, the average is 0.47 m3/d). The relation between water production and gas production is totally different between the east and west subareas.
The average water and gas production are 2.47 and 349.35 m3/d in the east subarea, and 0.67 and 599.99 m3/d in the west subarea, during the first half of 2014. Higher water production in the east subarea induced the gas production increasing from 349.35 m3/d in first half of 2014 to 432.19 m3/d in second half of 2014. However, gas production decreases from 599.99 m3/d in first half of 2014 to 513 m3/d in second half of 2014 in the west subarea, since low water production and ineffective dewater. To first half of 2015, the average gas production in the east subarea (552.08 m3/d) exceeds the west (452.25 m3/d) (Figures 14(a), 15(b), and 15(c)), which reflects the notable effect of water production on gas production and the totally different relations of water and gas production between the east and west subareas. However, the gas production of some wells with higher water production is also low because the large normal faults have great effect on water production (Pushin, 1998; Tao et al., 2014).
(a) Average water production during the first half of 2014, (b) average water production during the second half of 2014, (c) average water production during the first half of 2015, and (d) average flowing well-bottom pressure map showing well productivity.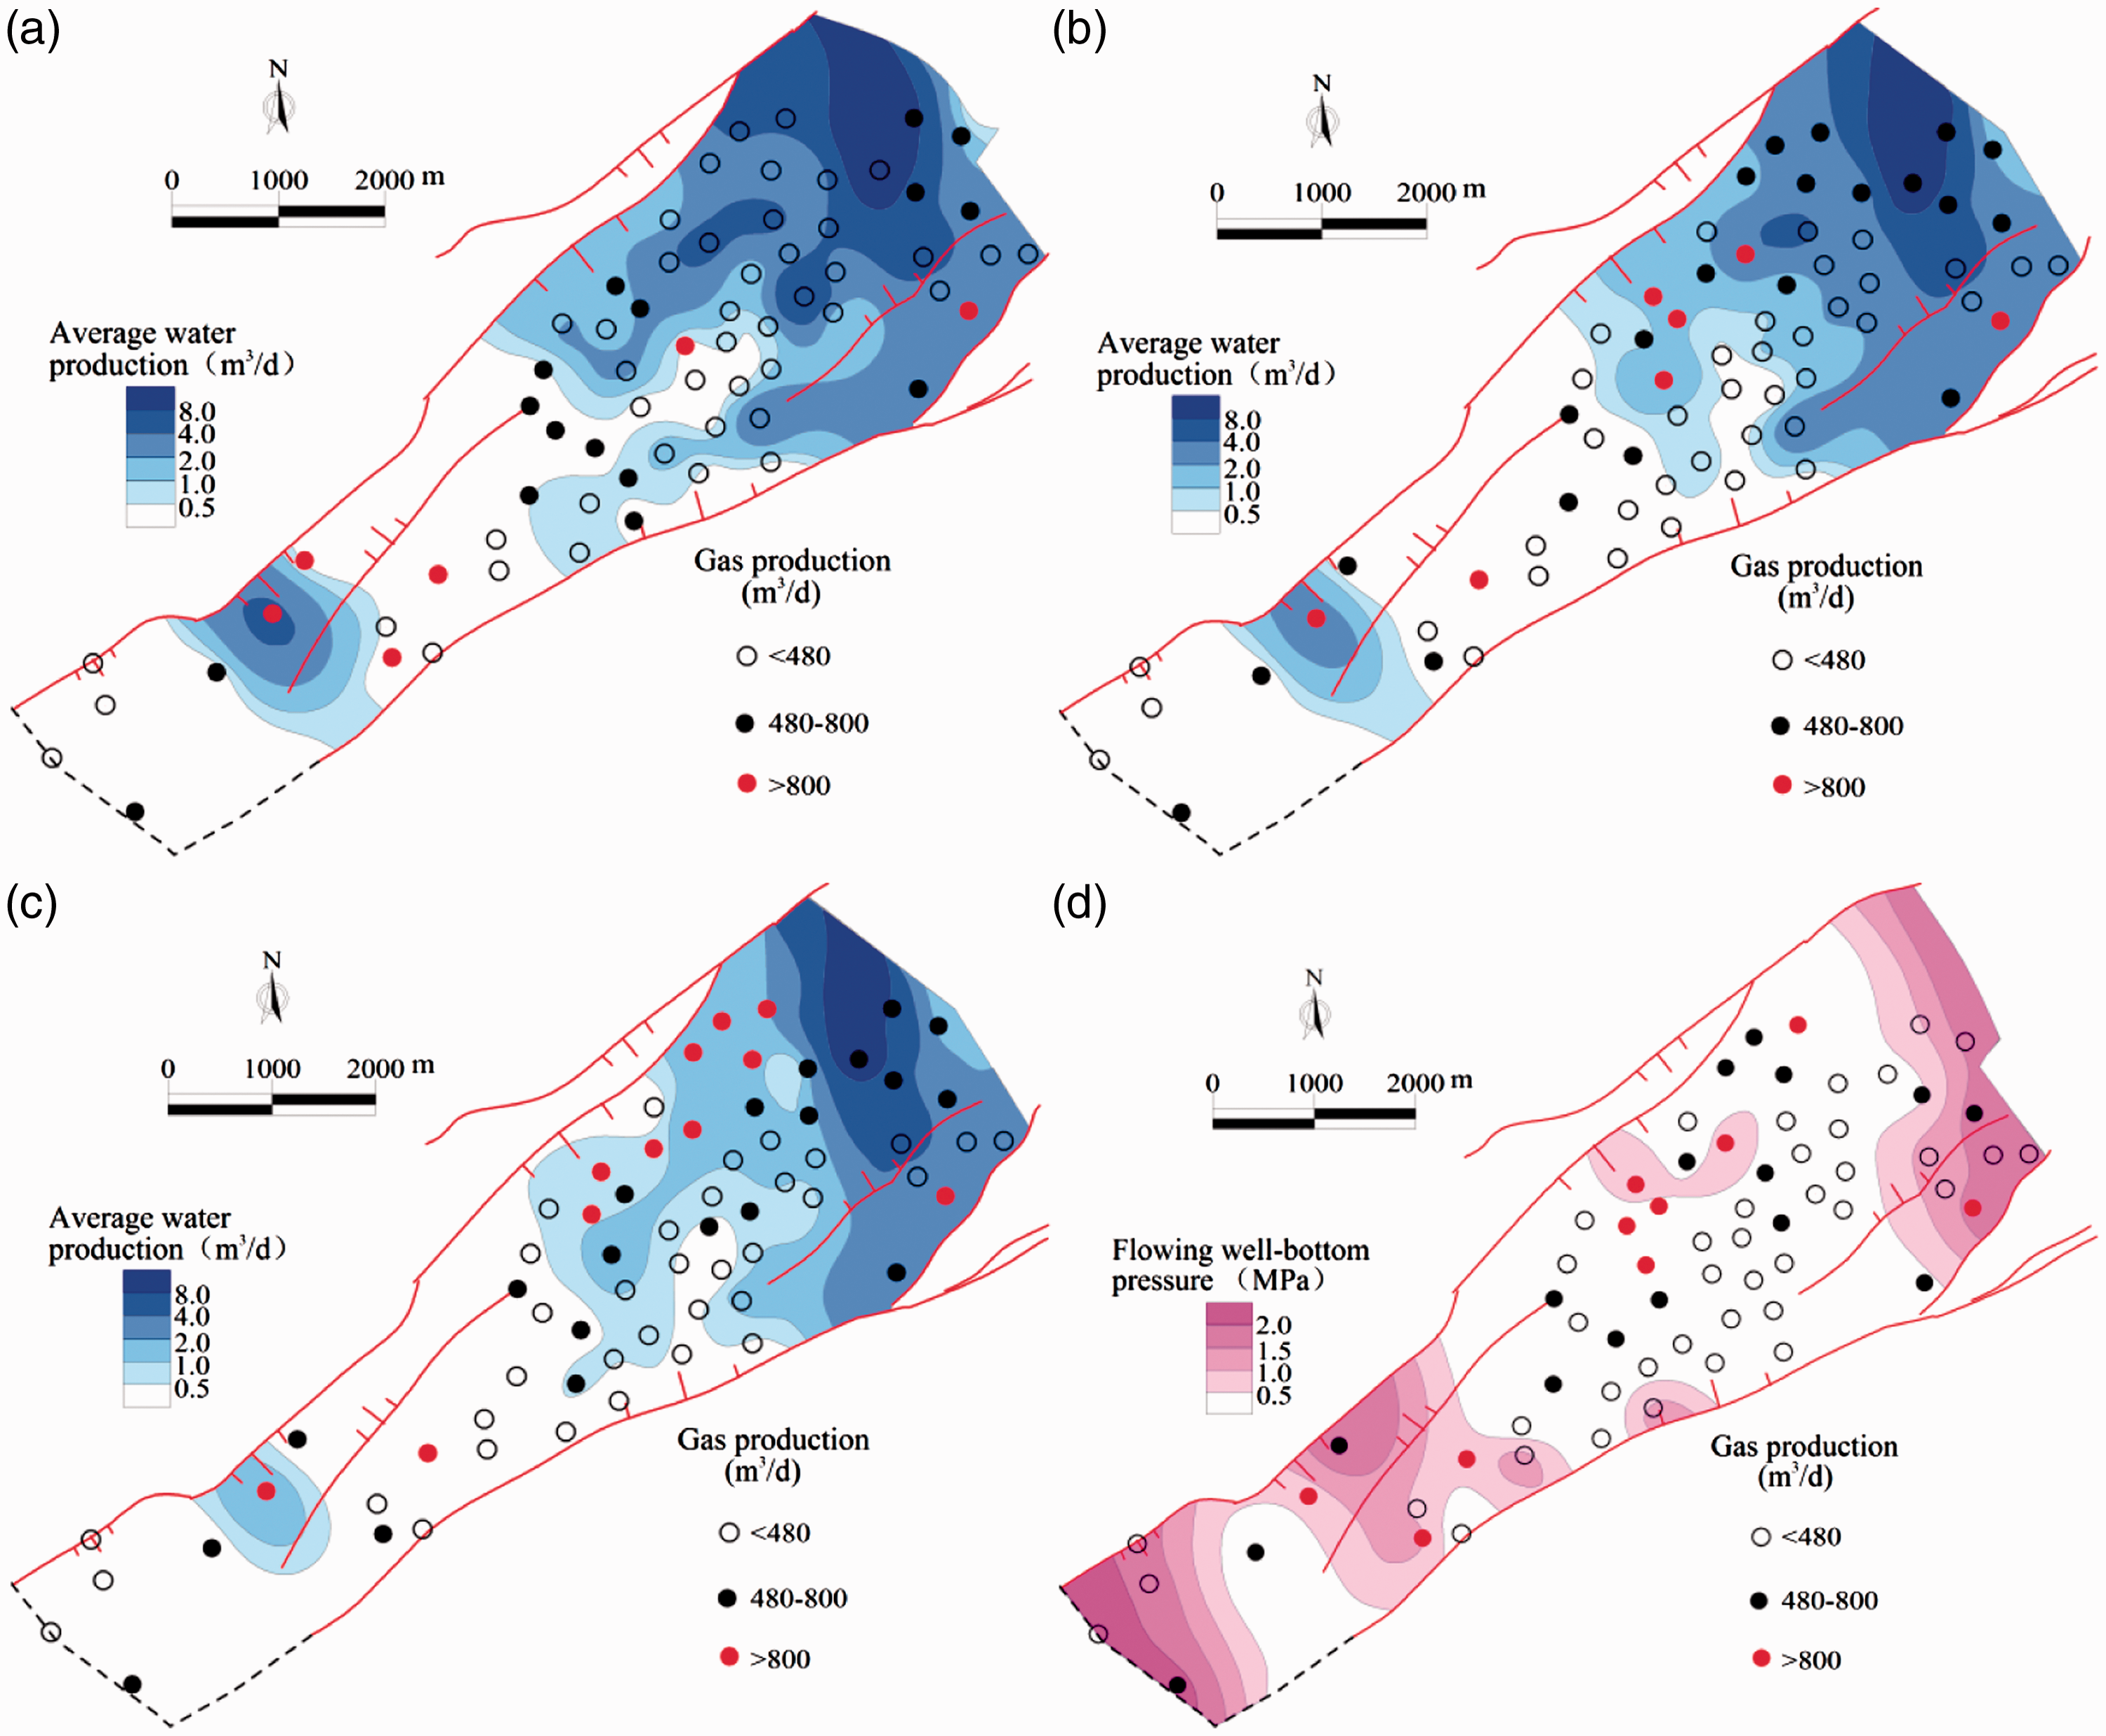
Flowing well-bottom pressure
Flowing well-bottom pressure is the sum of casing pressure and fluid column pressure. Producing pressure differential is the difference of coal reservoir pressure and flowing well-bottom pressure. Lower flowing well-bottom pressure is corresponding to higher producing pressure differential when reservoir pressure is stable (Tao et al., 2014).
As presented in Figure 13(b) and 14(d), gas production tends to decrease as the flowing well-bottom pressure over 0.5 MPa. This is consistent with other’s findings (Lv et al., 2012; Zhao et al., 2015). While the relation between gas production and flowing well-bottom pressure (<0.5 MPa) is complex which may be related to tubing performance and water–gas two-phase flow (Palmer, 2009). However, the concrete flowing mechanism of water–gas two-phase flow in the coal reservoir and bole hole is unavailable directly by current technology (Chen et al., 2014). We will analyze indirectly the relation of water–gas two-phase flow and gas production through some experimental and numerical simulating methods in the future work.
Engineering parameters
Total sand volume
The total sand volume during fracturing process is a proxy for characterizing the fracture scale. Theoretically, the increment in sand volume is conducive to increase the fracture length and width, which in turn releases stress in a large extent and then increases the desorption radius of CBM wells to improve gas production (Kurlenya et al., 2012). However, in the B3 area, this theory is inapplicable any more.
As shown in Figure 15(a), the total sand volume in the B3 area includes 25, 30, 35, and 40 m3 types. The average gas productions from wells of those types are 678, 302, 479, and 509 m3/d, respectively. No notable correlation between gas production and total sand volume.
(a) The relationship between CBM production and total sand volume, (b) the relationship between CBM production and Pb–Ps, and (c) the relationship between CBM production and Ps–Pd.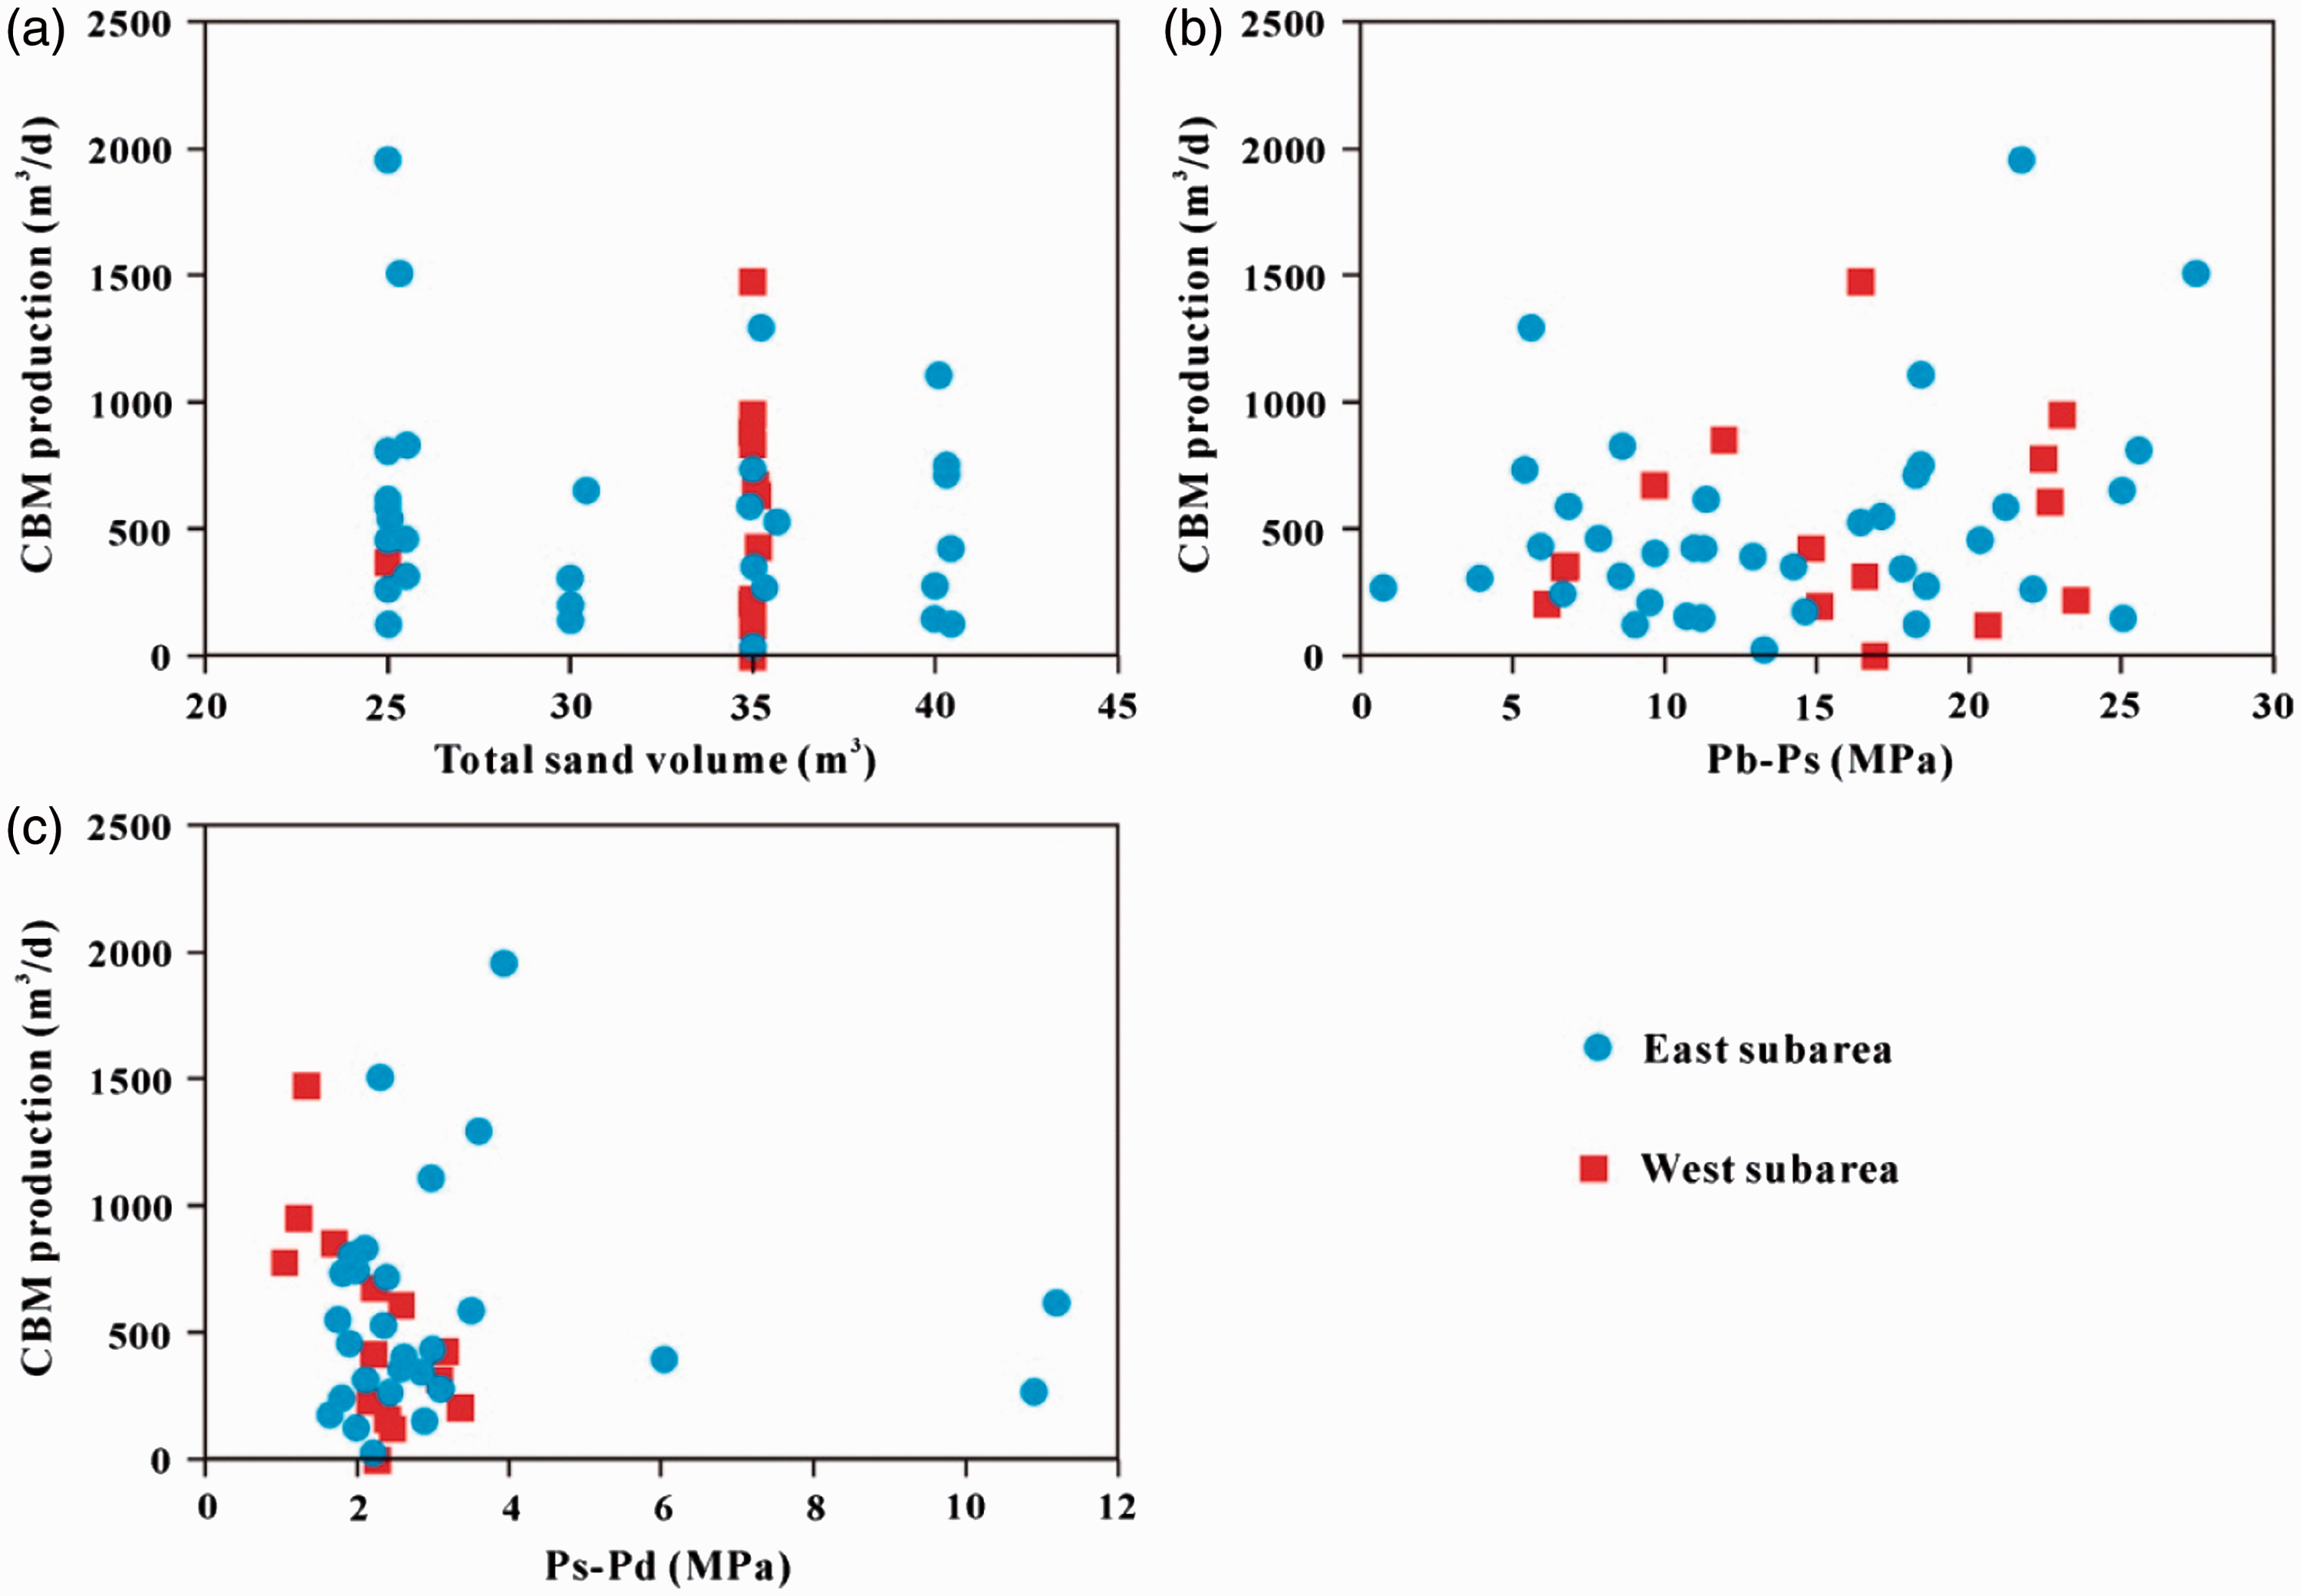
Pb–Ps and Ps–Pd
The bursting pressure, stop pressure, and drop pressure are very important data in fracturing process, which are valuable in situ data as well-logging data. Bursting pressure is approximately equal to minimum principle stress (Zhang and Bian, 2015). Stop pressure and fluid column height reflect well-bottom pressure during fracturing process. Drop pressure is roughly equal to reservoir pressure. In this study, we chose Pb–Ps and Ps–Pd as engineering factors and analyzed their effects on gas production. Pressure will drop heavily after the coal seam was fractured if natural fractures are frequent in coal seam, which means higher Pb–Ps corresponding to larger natural fracture volume (Zhou et al., 2015). The fracturing fluid will flow back to bole hole and pressure will drop during the last stage of fracturing process. The content of backed fracturing fluid and bracing effect can be reflected by Ps–Pd. We use reservoir resistivity to reflect reservoir permeability before it was fractured. Ps–Pd can reflect reservoir permeability after it was fractured.
As presented in Figure 15(b), the Pb–Ps of wells in B3 ranges from 0 to 27.48 MPa with an average of 13.31 MPa. Wells with Pb–Ps larger than 15 MPa tend to have much more potential to produce gas with average gas production of 608 m3/d, however, which is only 392 m3/d of the wells with Pb–Ps less than 15 MPa.
The Ps–Pd of more than 95% wells in the B3 area change from 0.91 to 4 MPa (Figure 15(c)). The correlation of gas production and Ps–Pd is weak in the east subarea and notable in the west. In the west subarea, the gas production has notable negative relation with the Ps–Pd.
Gray correlation analysis
The Gray method is a quantitative and rank-multiple analysis which determines the correlation between various parameters in the system and has been widely used in various fields of science and engineering since its advantage in correlation analyzing, parameter choosing, and decision-making (Deng, 1989; Lin et al., 2007; Liu et al., 2010; Lv et al., 2012; Zhao et al., 2015). The analysis in this paper includes two computations: computing the correlation coefficient and computing the correlation degree.
For the B3 area, the reference array consists of the gas production data of all CBM wells, while the comparative arrays are grouped from the various influencing parameters derived from the corresponding well sites. Based on the above analyses of relationship between gas production and some geological, engineering, draining parameters, burial depth, gas content, water level, and reservoir resistivity are chosen as geological parameters; water production and flowing well-bottom pressure are chosen as draining parameters; Pb–Ps and Ps–Pd are chosen as engineering parameters. Figure 16 shows the workflow of quantitative correlative analysis in this work. In order to further illustrate the calculating process, the analyses of burial depth and gas production in the east subarea were chosen as an example (Table 3): (1) the reference array {a0(n)} and comparative array {a1(n)} are the gas production and the burial depth, respectively; (2) the reference array {a0(n)} and the comparative array {a1(n)} are calculated to nondimensional arrays through dividing by the maximum values in the corresponding arrays; (3) the absolute difference Δoi(k) between the reference array {a0(n)} and comparative array {a1(n)} and the correlation coefficient ɛoi(k) are computed with equations (2) and (3); (4) the correlation degree value roi (0.50000) is computed by equation (4).
Workflow of Gray correlation analysis (revised from Deng (1989)). Gray correlation analysis between the burial depth and gas production in the east subarea (as an example to reflect calculating process).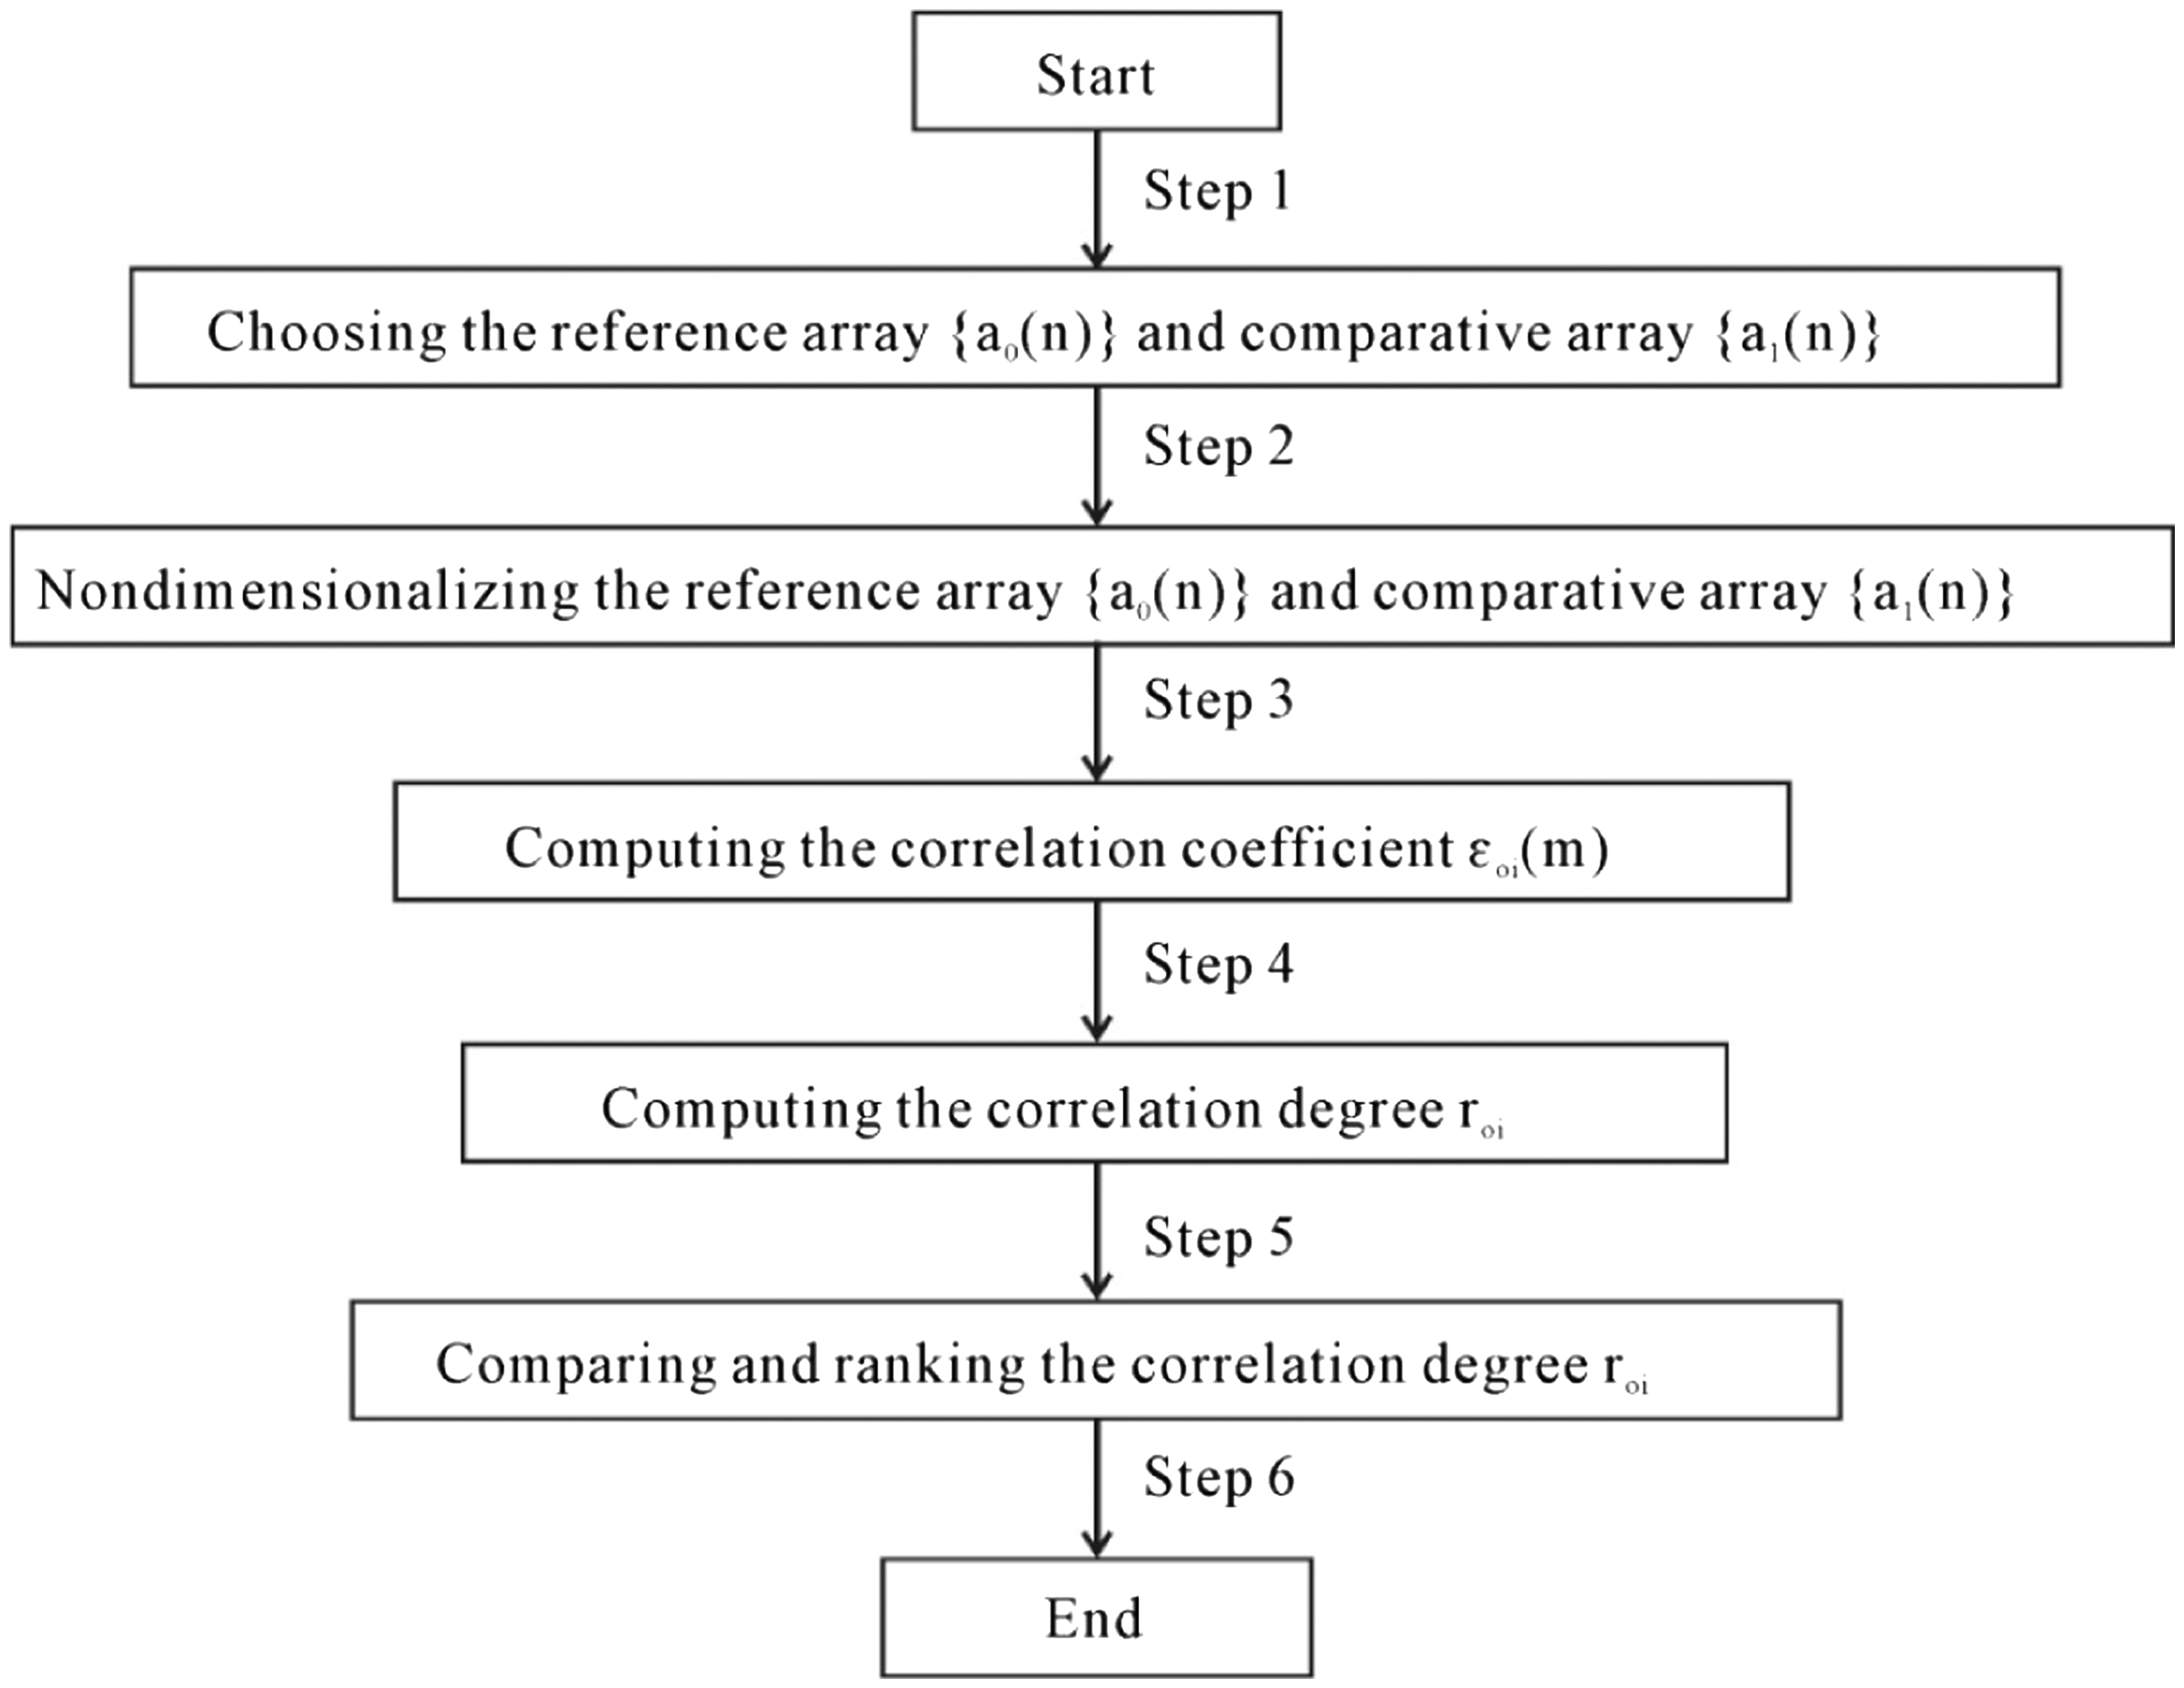

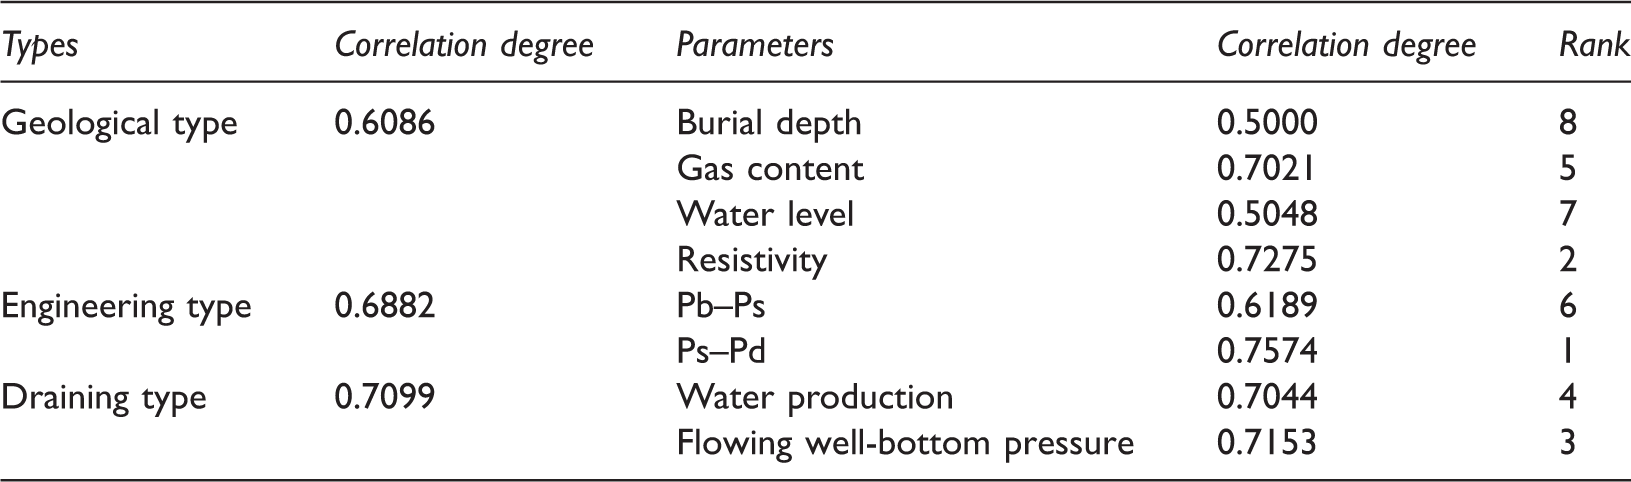
Correlation degree between gas production and parameters in the east subarea.
Correlation degree between gas production and parameters in the west subarea.
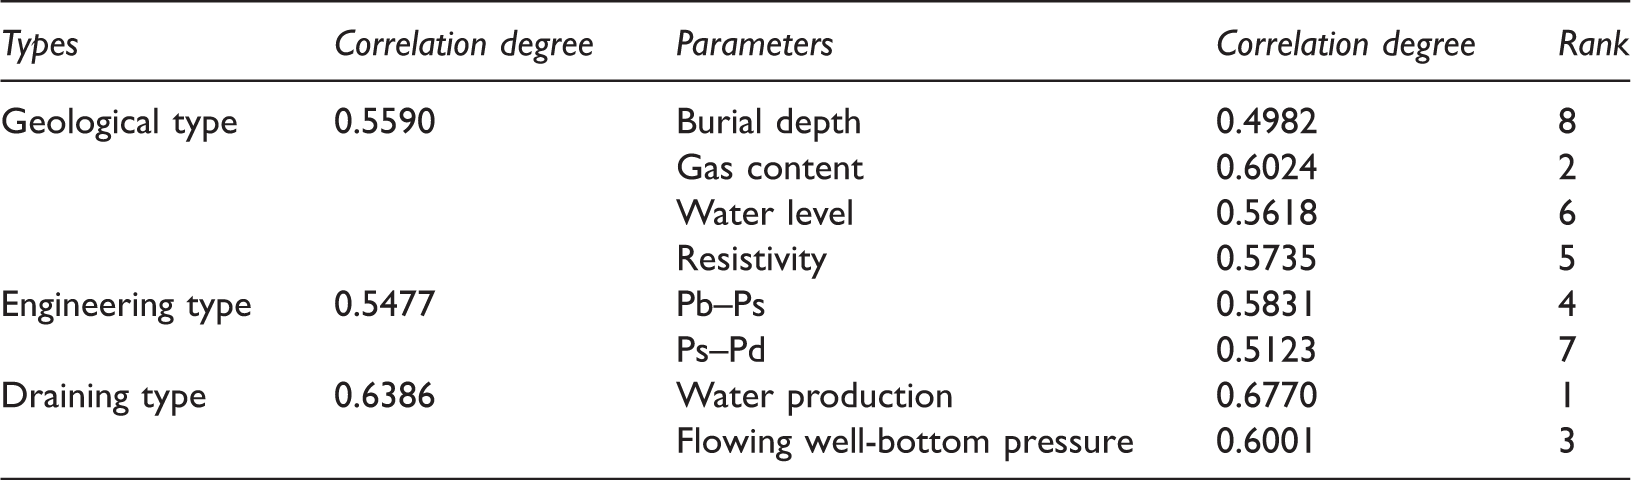
Among geological parameters, gas content and reservoir resistivity are the primary parameters for controlling gas production, which means that gas content and permeability of coal reservoir are the most important factors affecting CBM well productivity. Engineering factors have relative significant effects on gas production in the east subarea and weak effects in the west subarea.
In sum, in subarea with shallower burial depth, the effects of resistivity and Ps–Pd are much notable than other factors, which reflects that permeability is a dominating factor for controlling well productivity. However, water production and gas content determine the well productivity in subarea with relative deeper burial depth.
Conclusions
Burial depth has different effects on gas content. The transition point of the effect of burial depth on gas content is near 650 m in the B3 area. Accordingly, we subdivided it into the west (deeper than 650 m) and east subareas (shallower than 650 m) for more reliable analysis and calculation. On this basis, geological, draining, and engineering parameters were extracted to compare with gas production of CBM wells in each subarea.
In both subareas, draining parameters play the most important roles to control gas production. Among geological parameters, gas content and reservoir resistivity have much more notable effects on gas production. Ps–Pd is the most important single parameter affecting gas production in the east subarea. However, the effect of Ps–Pd on gas production is weak in the west subarea, since the hydrofracturing process is much difficult in areas with deeper burial depth.
In shallow buried subarea, the effects of resistivity and Ps–Pd on gas production are much notable than other factors, which reflects permeability is a dominating factor for controlling well productivity. Regions with low resistivity, high Ps–Pd, and high water level are favorable regions for gas development in shallow buried subarea. However, water production and gas content determine the well productivity in deep buried subarea, in which, high gas content and water production, low water level are much helpful for producing gas.
Footnotes
Acknowledgements
We would like to thank the Xishan Lanyan CBM Company Limited and Xishan Coal Electricity Group Company Limited for providing CBM well data and coal mine data. The authors also grateful to the anonymous reviewers, Drs Wei Li, Yanjun Meng, and Ms Sarah Enslow at Taiyuan University of technology, and Dr Dengfeng Zhang at Kunming University of Science and Technology for their assistance in the revision of the manuscript.
Declaration of conflicting interests
The author(s) declared no potential conflicts of interest with respect to the research, authorship, and/or publication of this article.
Funding
The author(s) disclosed receipt of the following financial support for the research, authorship, and/or publication of this article: This work is supported by Key Project of Coal-based Science and Technology in Shanxi Province (Grant No. MQ2014-01) and National Natural Science General Program (Grant No. 41372165).