
Abstract
In this paper, microscopic visualization devices and image processing techniques were used to conduct microscopic water flooding experiments. A novel classification criterion for residual oil during the water flooding process was established as follows: contiguous type, branched type, oil film type, columnar type, and droplet type. Correlations between the five types of residual oil saturation and water-cut were established. Also, the recovery improving potential for different production strategies have been investigated by water flooding experiments. The relationship between various types of residual oil saturation and injection velocity were obtained, with the former residual oil saturation decreasing to 16.09% during the injection process when the velocity was increased from 0.05 mL/min to 0.5 mL/min. However, with an increase in injection velocity, the saturation of contiguous residual oil type decreased first and then stabilized. The saturation of branched oil type monotonically decreased, but saturation of droplet oil type monotonically increased. Residual oil saturations were 22.62% and 9.69% before and after altering injection direction, respectively, which means residual oil recovery was increased by 12.93%. Some places were considered to be “dead oil regions” before altering injection direction with most of the contiguous and branched type residual oil in these areas been displaced out by altering injection direction. Altering the injection direction is a more effective method of enhancing oil recovery than improving injection velocity when the same volume of water is injected. The proposed method and prediction correlations were presented in this paper to provide a novel means to predict oil recovery and residual oil saturation types for water flooding reservoirs, which have strong plane and weak vertical heterogeneity.
Keywords
Introduction
Water flooding seems to be an old topic, but most of the previous studies were focused on enhanced oil recovery by different methods (Singhal, 2009; Wade, 1971). As we all know, there is still much residual oil in reservoirs after entering into a high water-cut stage. It is of great significance in knowing what forms and where the residual oil is located after flooding. However, only a few works study how to classify residual oil in a quantitative way and how to develop this residual oil after entering into a high water-cut stage. The research on improving recovery at high water-cut for water flooding reservoir is sparse and research at a high water-cut stage is still necessary.
Since the first accidental discovery in the late 1800s, the benefits of injecting water into reservoirs to improve flooding recovery has been an effective method for use in the recovery process Gruy (1962). Laboratory scaled models were paramount in simulating the behavior of the water flooding process before the advent of numerical simulation, and various water flooding experiments have been employed to explore its mechanisms as an enhanced oil recovery technique. The results indicated that water flooding performance heavily depends on pattern geometry and viscous forces. Areal sweep efficiency is remarkably dependent on mobility ratio. Areal sweep efficiency is greater at lower values of the mobility ratio and reduced at higher values of the mobility ratio (Aronofsky, 1952; Slobod and Caudle, 1952). A correlation for predicting production performance was presented (Dykstra and Parsons, 1950), which does not only include the effect of mobility ratio, but also includes the effect of heterogeneity. A graphical technique was developed to estimate the performance of water flooding based on the Dykstra–Parsons correlation and it pointed out that reservoir heterogeneity has a strong negative impact on oil recovery (Johnson, 1956). In general, water flooding has been regarded as an effective technology only applicable to light oil reservoirs. However, some studies indicated that water flooding is the most effective method to develop oil reservoir in which the oil viscosity is less than 30 cp (Satter et al., 2008).
Comparison of microscopic analysis techniques.
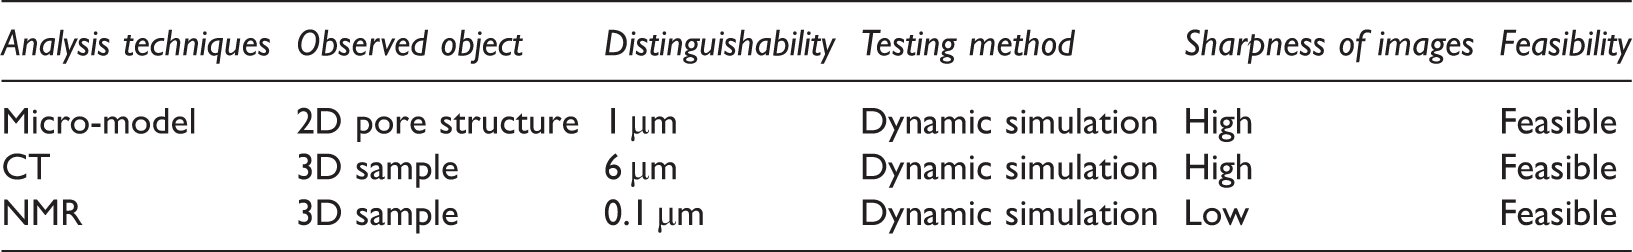
Numerous studies of micro-physical simulation results show that residual oil in micro-models can be divided into four types as follow: the blind side oil type, oil film, oil spots on the surface of pores, and the oil unswept (Jia et al., 2002; Zhao et al., 2002; Zhu, 2010). The relationship between microscopic pore structure and displacement efficiency was analyzed and its influence on micro-residual oil distribution was investigated. It was suggested that microscopic residual oil could be described as oil in tiny pores that is perpendicular to injection direction, oil film type in large pores, and oil in blind pores (Xu et al., 2005). The classification method of residual oil provided a reference based on observation. However, previous classification methods were just based on the shape of residual oil and quantitative classification criterion for residual oil has never been reported before.
Furthermore, as water flooding oilfield enters into a high water-cut stage, subsequent strategies for developing residual oil have become more and more important. The distribution of residual oil becomes more complex with an increase in water-cut. For light oil reservoirs, intensive water flooding, polymer flooding, converting producers, and even CO2 flooding may be used for follow-up development. The development adjustments of the Daqing oilfield at a late period of high water-cut stage was investigated and the results suggested that using separate layer water injection can still improve oil recovery significantly (Liu and Wan, 1995). Some studies have pointed out that the strategy for further development of oil reservoirs should be established respectively with the consideration of the main contradictions and problems for various reservoirs and current production technique (Shi et al., 2006). The method of converting producers was applied in Shahejie formation of Weicheng oilfield and the results suggested that the recovery improved by 1.45% and the recoverable reserves increased by 10.5 × 10⁴ t (Cheng et al., 2011). Although oil recovery can be enhanced by these strategies, it is still unknown which part of residual oil was displaced and where the remaining part of oil is stored.
The aims of this article are (1) A novel and quantitative classification criterion of residual oil at high water-cut based on water flooding experiments with etched-glass micro-model and image processing. (2) Establish relationships between water-cut and proportion of each residual oil type at different water-cut stage. (3) Saturation prediction correlations between types of residual oil saturation and water-cut during flooding process. (4) Microscopic investigation of the recovery improving potential for different production strategies.
Experimental section and methodology
Micro-model and fluids
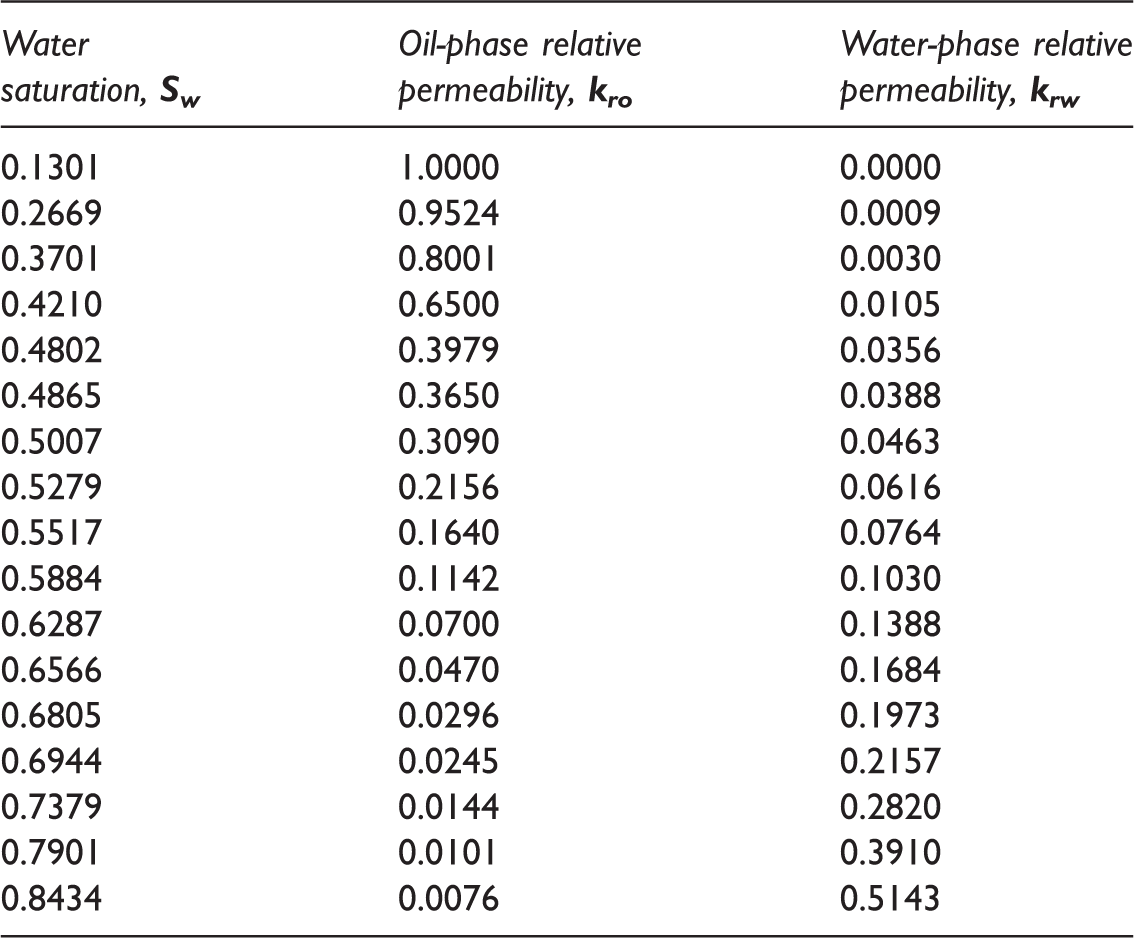
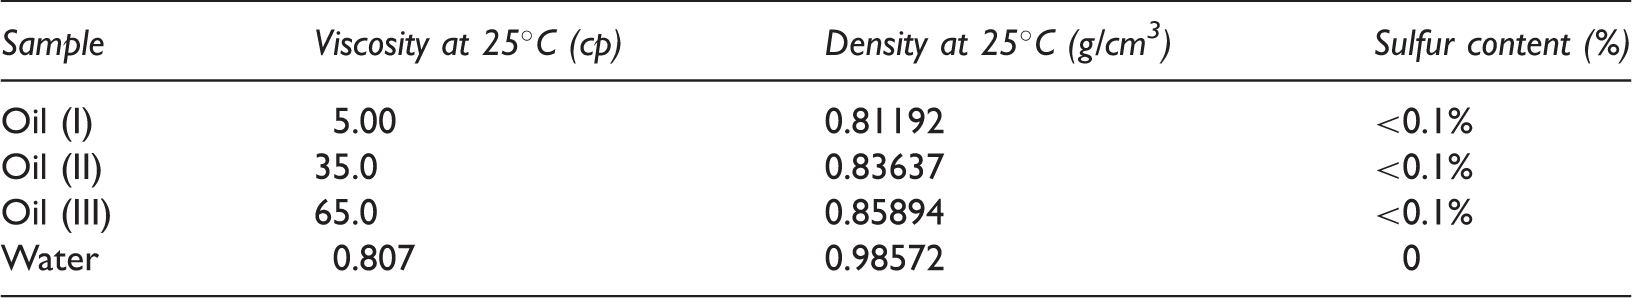
The micro-model is a two-dimensional glass plate with throats and pores made by using the photochemical method. It is often used to simulate reservoirs with a strong plane and weak vertical heterogeneity. In this study, an etched-glass micro-model was used to investigate the characteristics of residual oil and microscopic flooding mechanisms. The whole process of flooding and the distribution of residual oil can be observed with microscopic visualization devices for translucent characteristics of the micro-model. Figure 1 shows a micro-model saturated with oil whose saturation is 87.45%. The micro-model is in the shape of a square with an area of 625 mm2 while the groove’s depth is 0.5 mm. The porosity of the micro-model is 0.38, and the relative permeability data is shown in Table 2. Pore structures of the micro-model were made according to the pore structures of a real reservoir core. Water is used as a displacement agent and the camera captures once every second during the experiments. Basic properties of oil samples and water samples were analyzed and the results are shown in Table 3.
Image of micro-model saturated with oil. Relative permeability data. Basic properties of oil and water samples.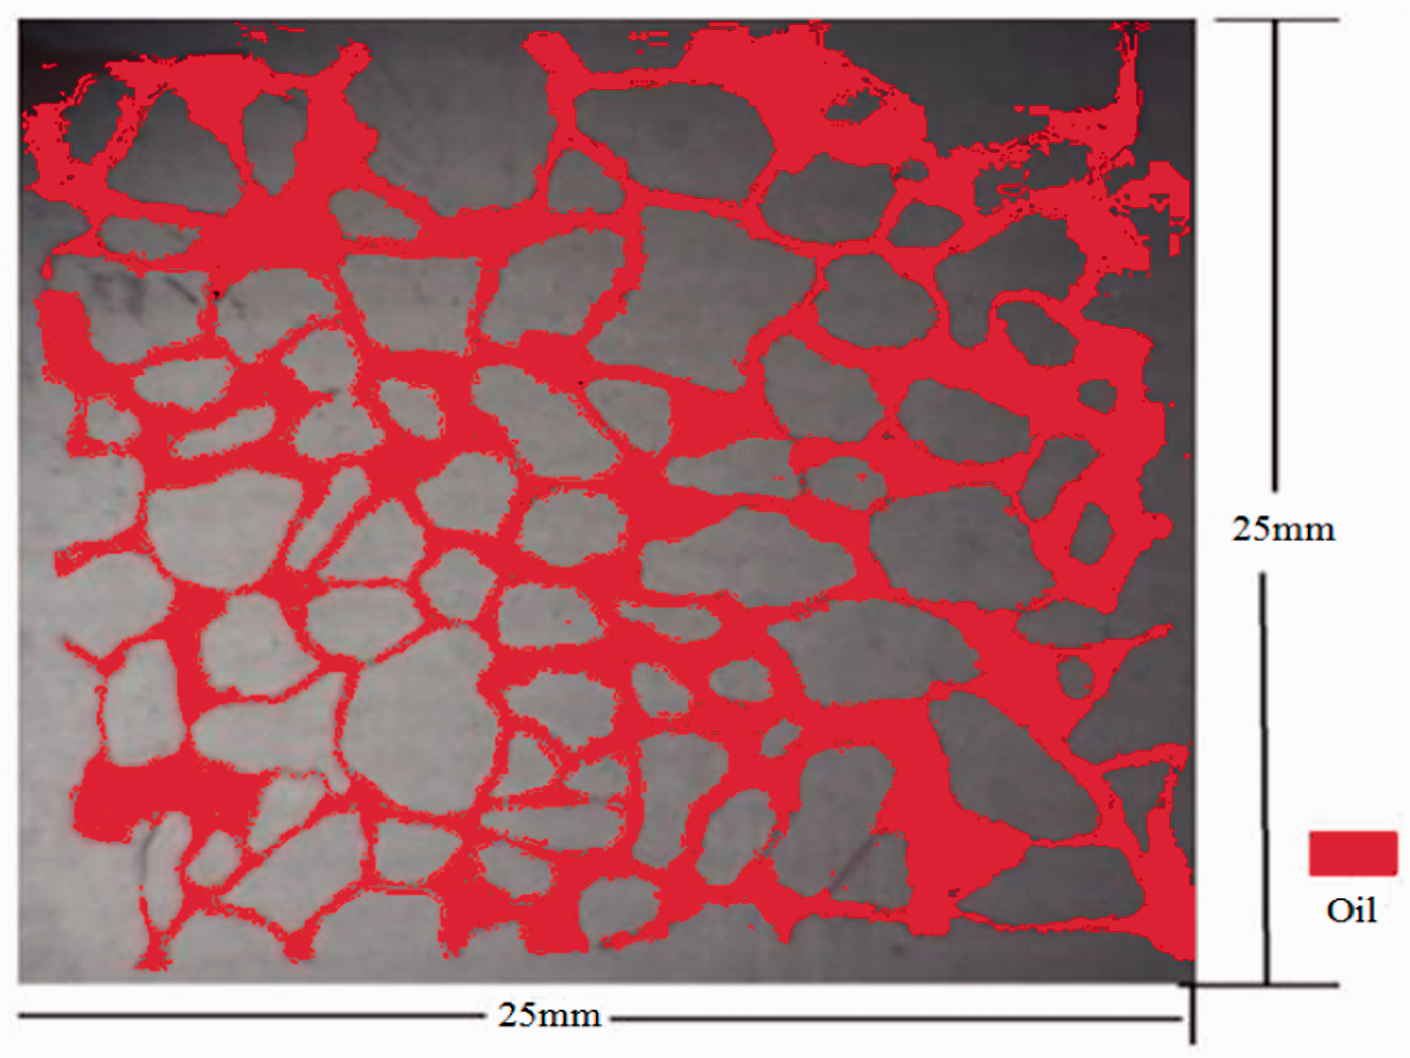
Experimental setup and procedure
Figure 2 shows the schematic diagram of a microscopic water flooding experimental setup with experimental methods and procedures as follows:
Assemble the experimental devices as shown in Figure 2 with the etched-glass micro-model loaded into the visualization holder. Apply a confining pressure to vacuumize the etched-glass micro-model and then saturate it with an oil (I) sample until the oil cannot be injected into the etched-glass micro-model. After that, wait for a period of time until an image obtained in the computer device is stabilized. Start mini-syringe pump to inject water with viscosity of 0.5 cp, and set the injection velocity to 0.05 mL/min. When no more oil is displaced from the outlet and the image obtained in the computer is stabilized, record time, water volume and save images for calculation. Increase the injection velocity for displacement to continue the experiment (set injection velocity to 0.1, 0.2, 0.3, 0.4 and 0.5 mL / min.), repeat steps 3 and 4, respectively, for each injection velocity. Repeat step 2 by altering the injection direction with 0.05 mL/min and continue the experiment until no oil is displaced from the outlet and repeat step 4 again. Change the viscosity of crude oil to 35 mPa.s and 65 mPa.s and repeat steps 3 and 4 to complete the displacement experiments. Schematic diagram of microscopic water flooding experimental setup.
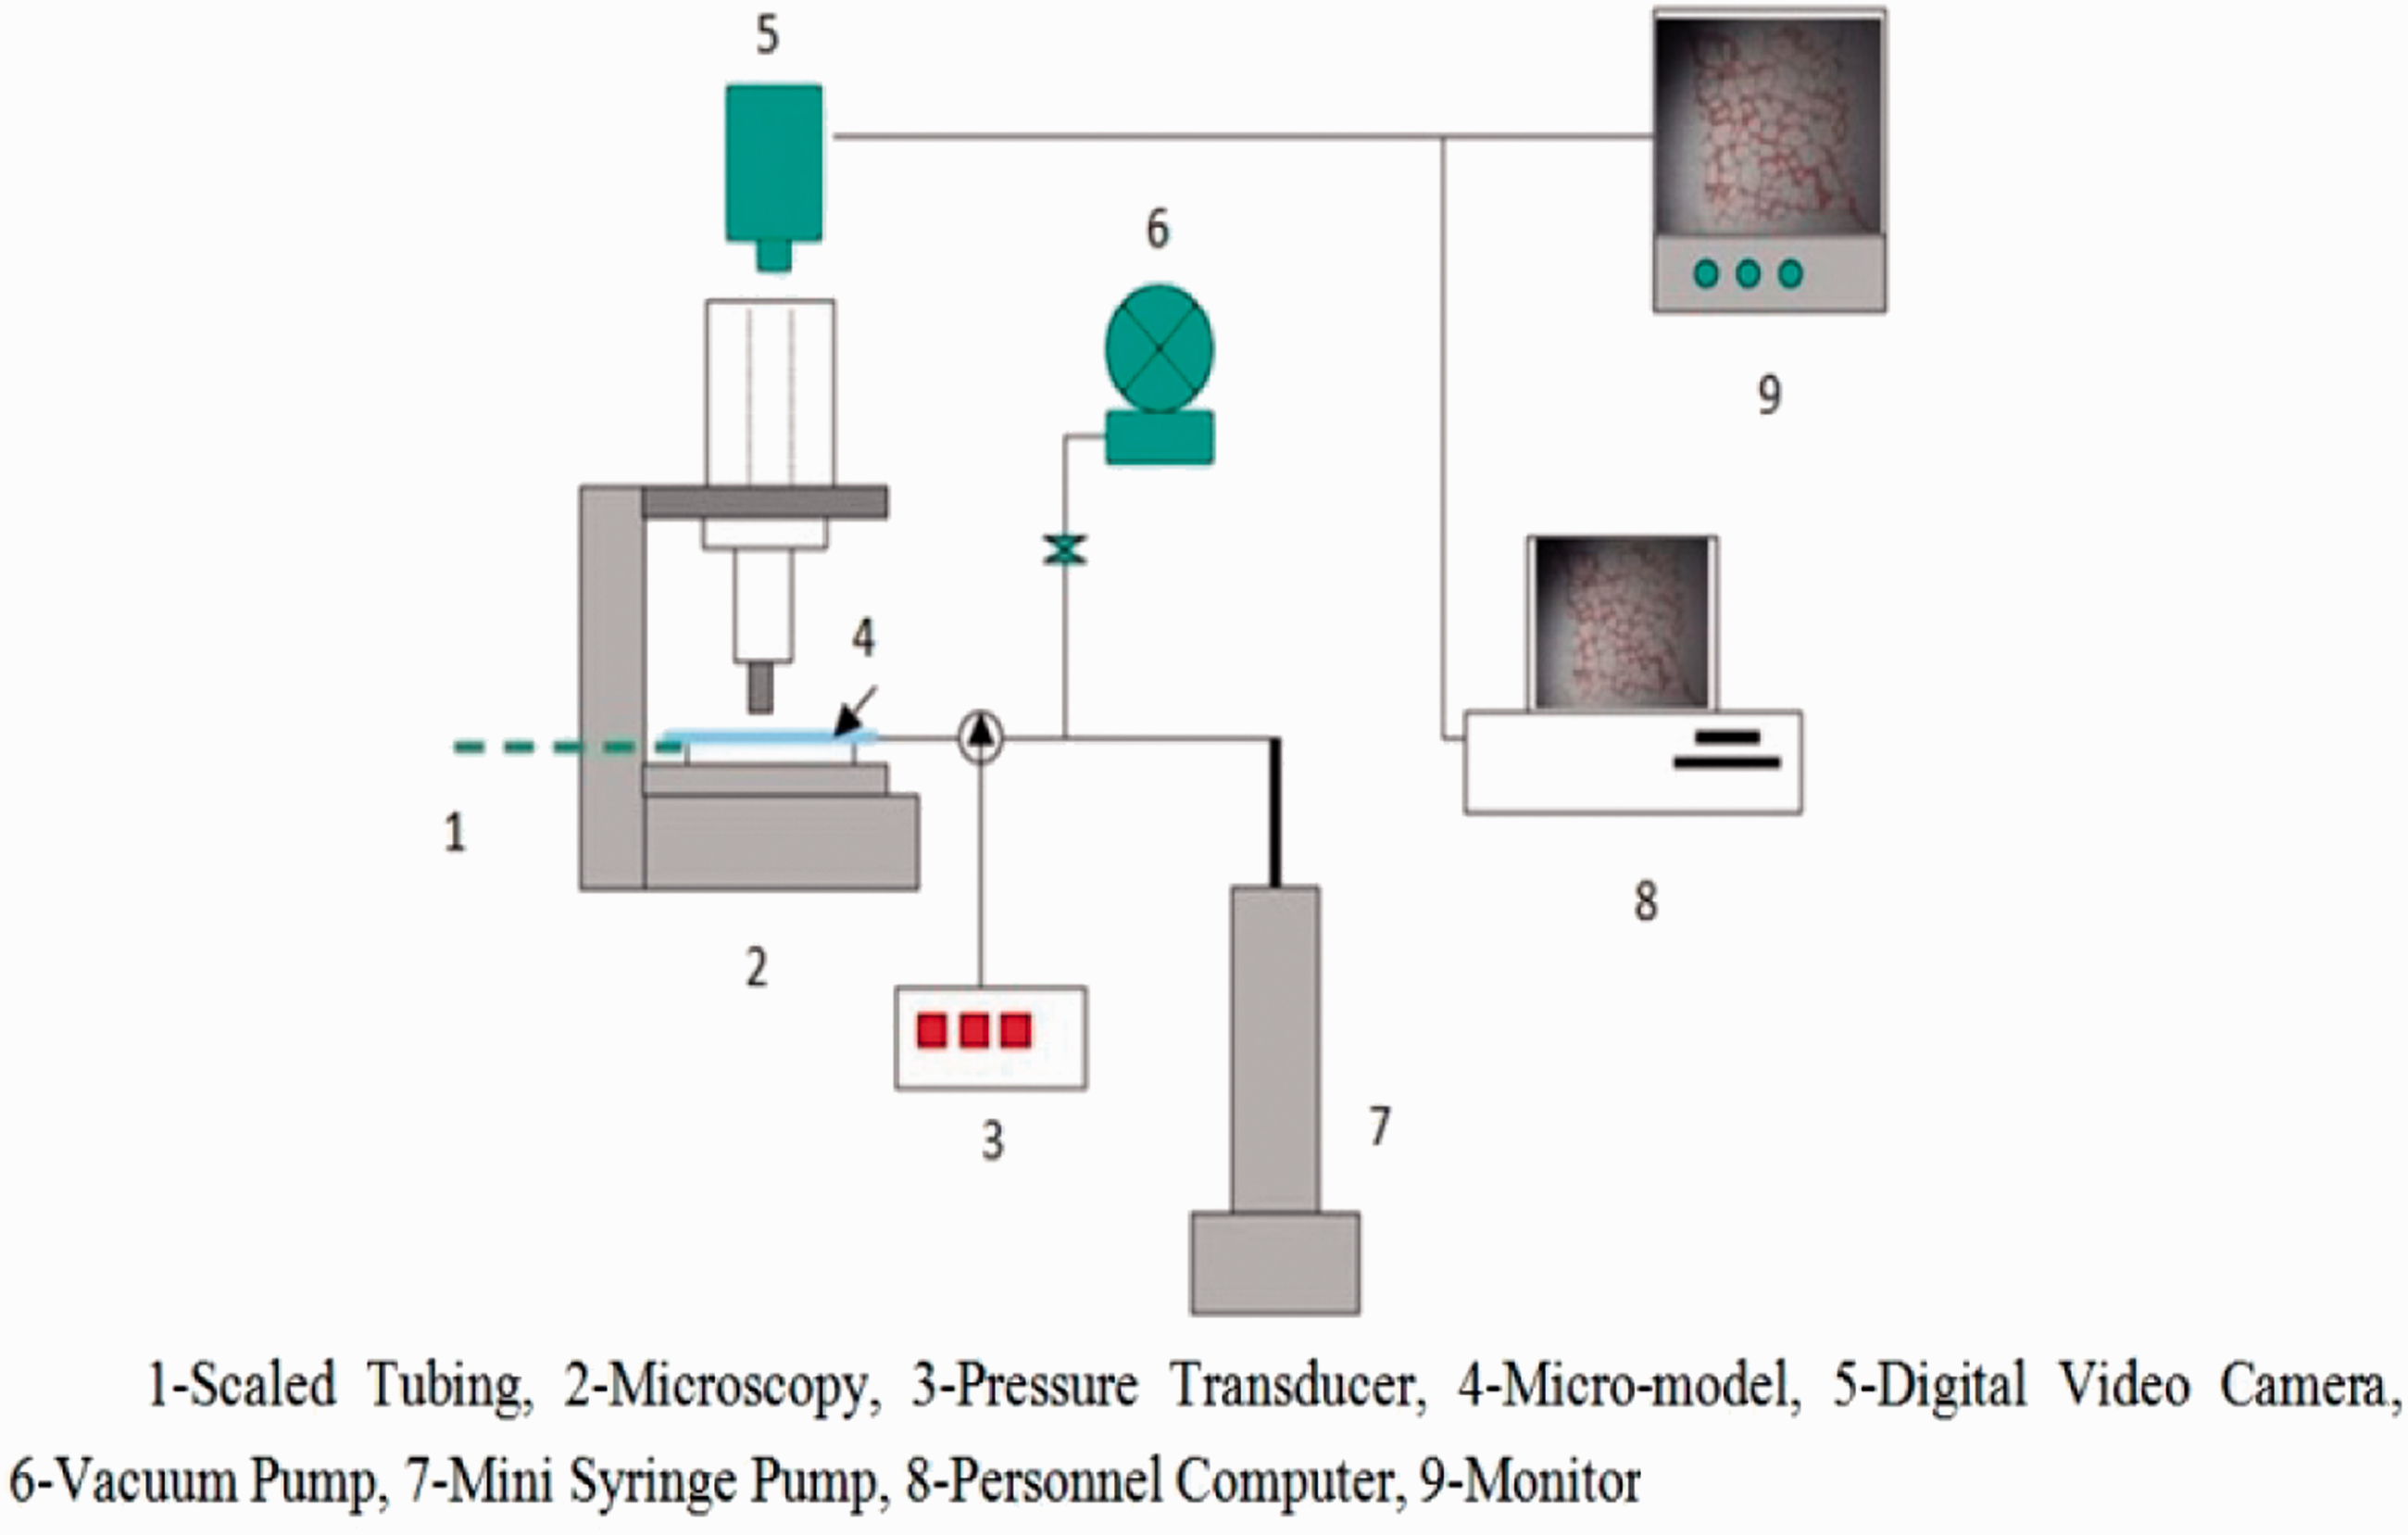
Mini-syringe pump was used to control the injection velocity and digital video camera was used to film the micro-model at each second, and the images were collected using a personal computer.
Data and image processing techniques for oil blocks
An accurate image processing software named Image-Pro-Plus6.0 was used to display the images, and then characterize the dispersion degree and saturation of residual oil by measuring the length, width and area pixels, and other parameters of the oil blocks. The image processing technology principle can be simply described as follows: (1) marking and numbering oil blocks with the same color. (2) Calculating and accumulating the total number of oil blocks pixels. (3) After that, the areas of oil blocks can be obtained by multiplying areas that are occupied by a unit pixel. Data processing produce is shown in Figure 3, and the relative error of the calculation method is 1.474%. Therefore, this method can be used to calculate residual oil saturations at any time of the water flooding process by displaying images, and it provides a simple and quick experimental method to calculate residual oil saturation.
Schematic diagram of image and data processing method.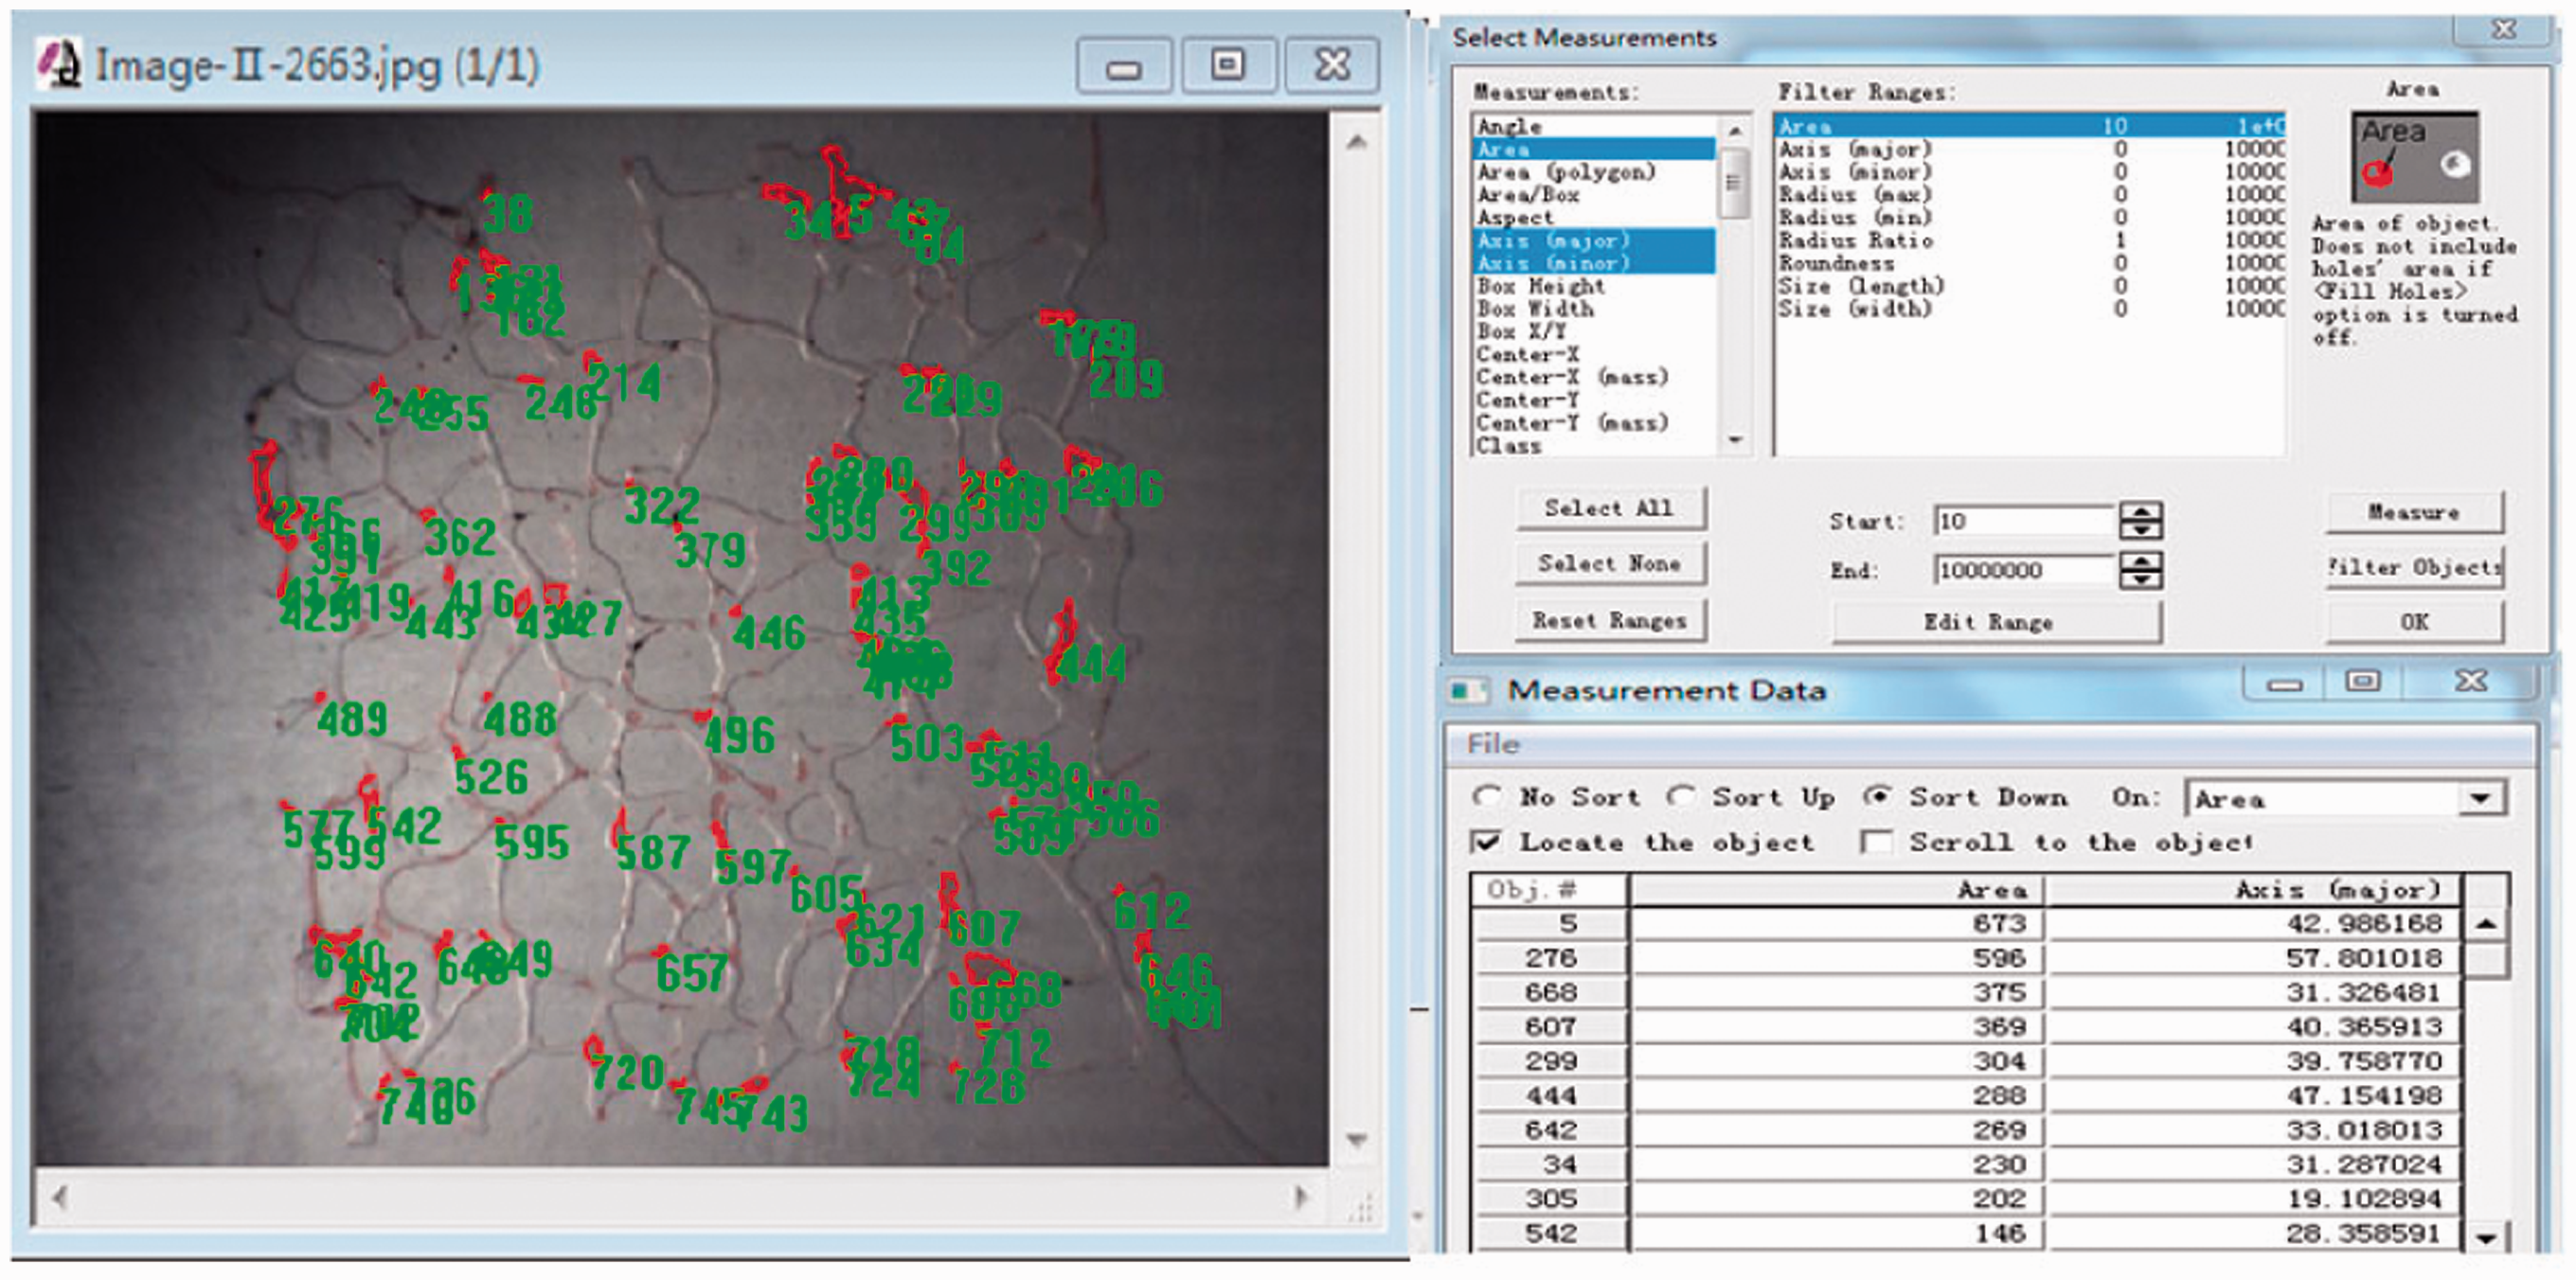
Results and discussion
Results of classification for residual oil
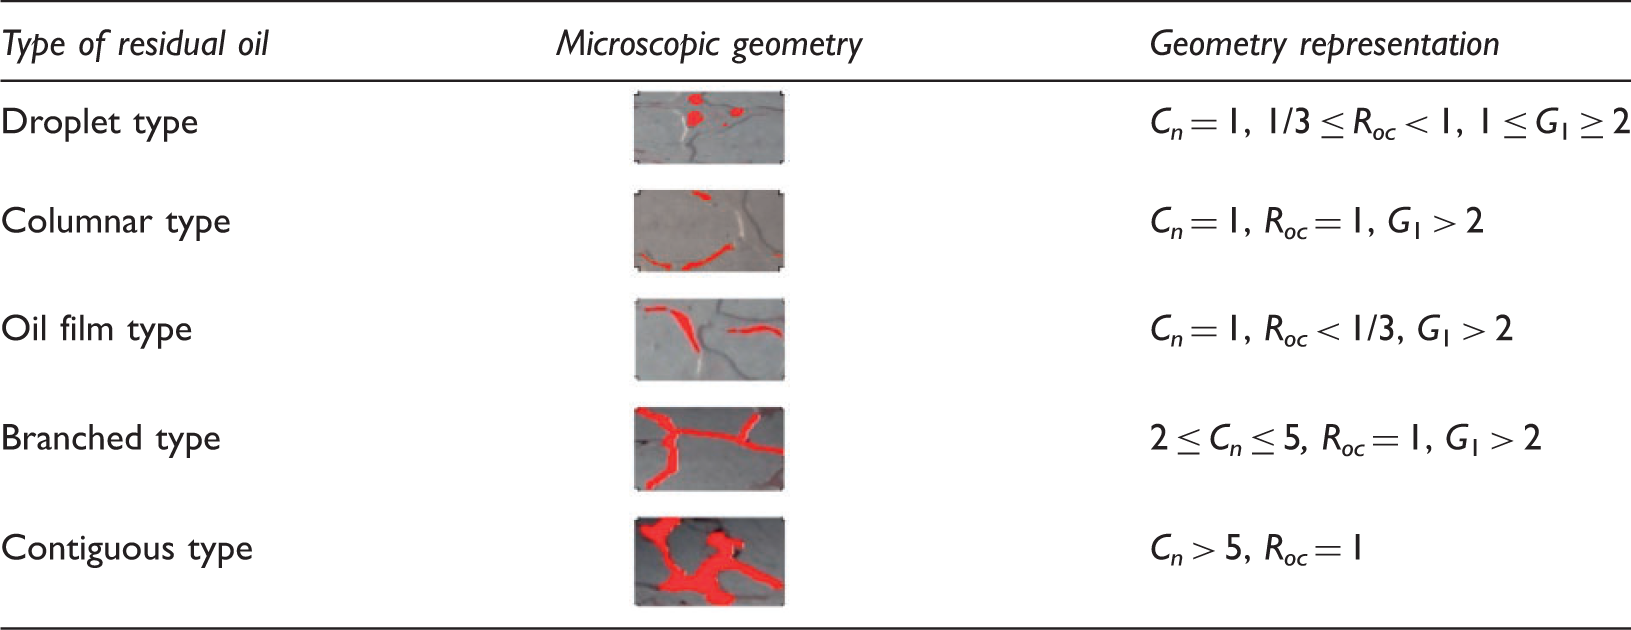
Different types of residual oil saturations were formed in the pores from the beginning of flooding to the high water-cut stage. In order to establish a microscopic quantitative classification criterion for residual oil saturation, interconnected pores coefficient, aperture ratio of oil, and shape factor were introduced to describe microscopic residual oil. The parameters are defined as follows:
Interconnected pores coefficient (Cn): it is the number of interconnected pores that were filled with residual oil.
Aperture ratio of oil (Roc): it is the ratio of equivalent radius of residual oil and equivalent radius of pores. The equation can be expressed as:

Shape factor (G1): it is the ratio of major axis and minor axis of residual oil. The equation can be defined as:

The microscopic shapes of residual oil are shown in Figure 4 with various residual oil shape factors been significantly different. With the same area, the bigger the shape factor is, the greater variation degree in surface irregularities will be.
Microscopic shapes of different type of residual oil under microscopy. (a) Cn = 7, (b) Roc = 4, (c) G1 = 1.5.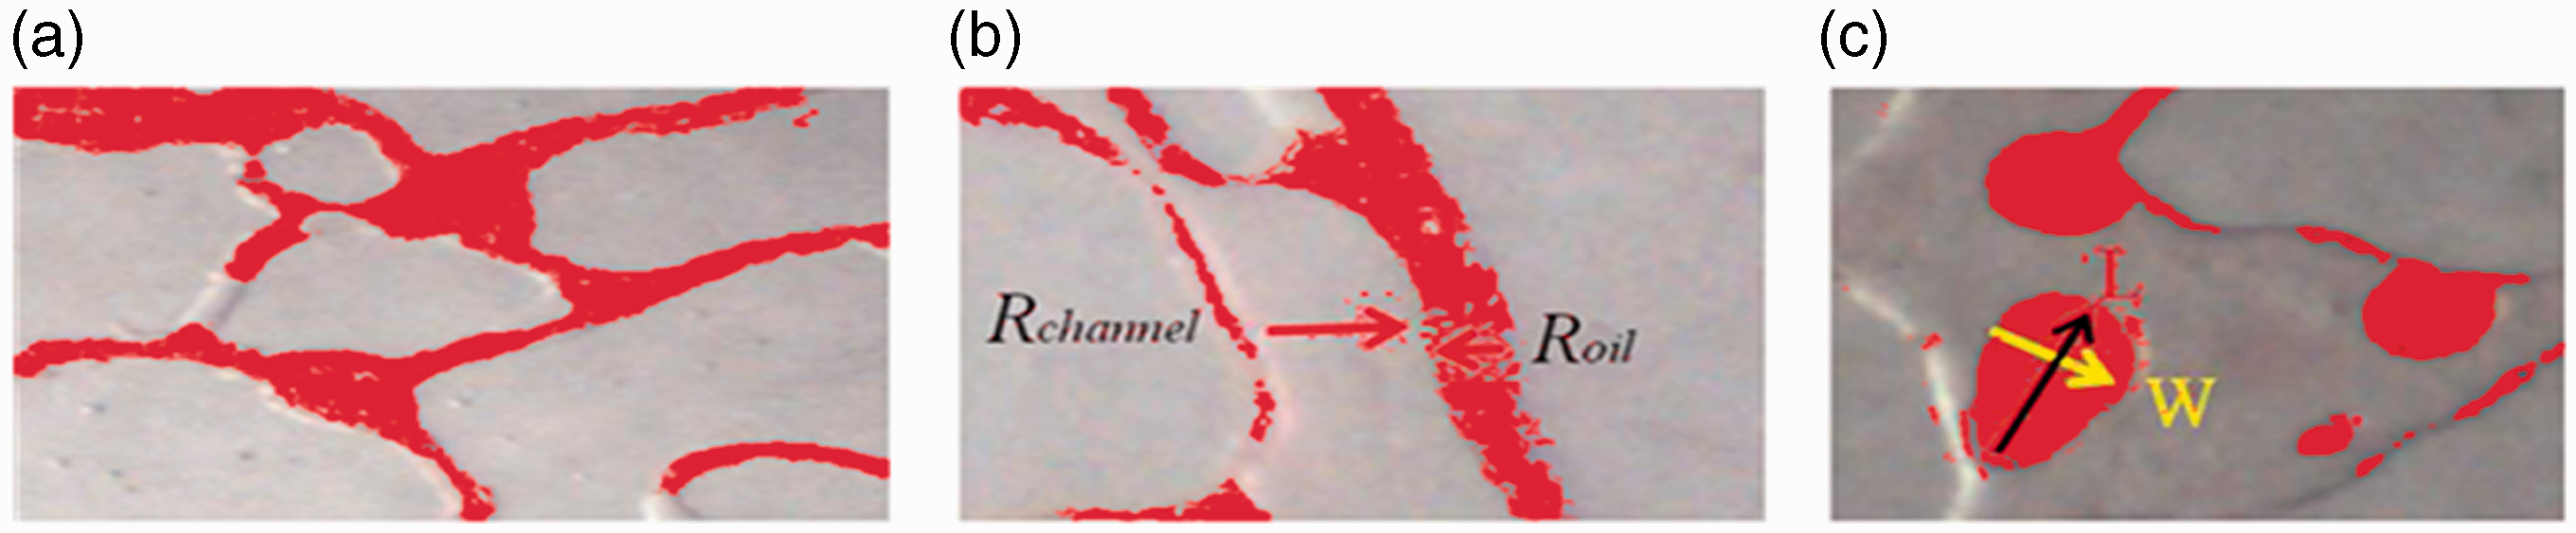
Classification of microscopic residual oil.
Distribution of residual type oil in high water-cut period for different oil viscosity samples
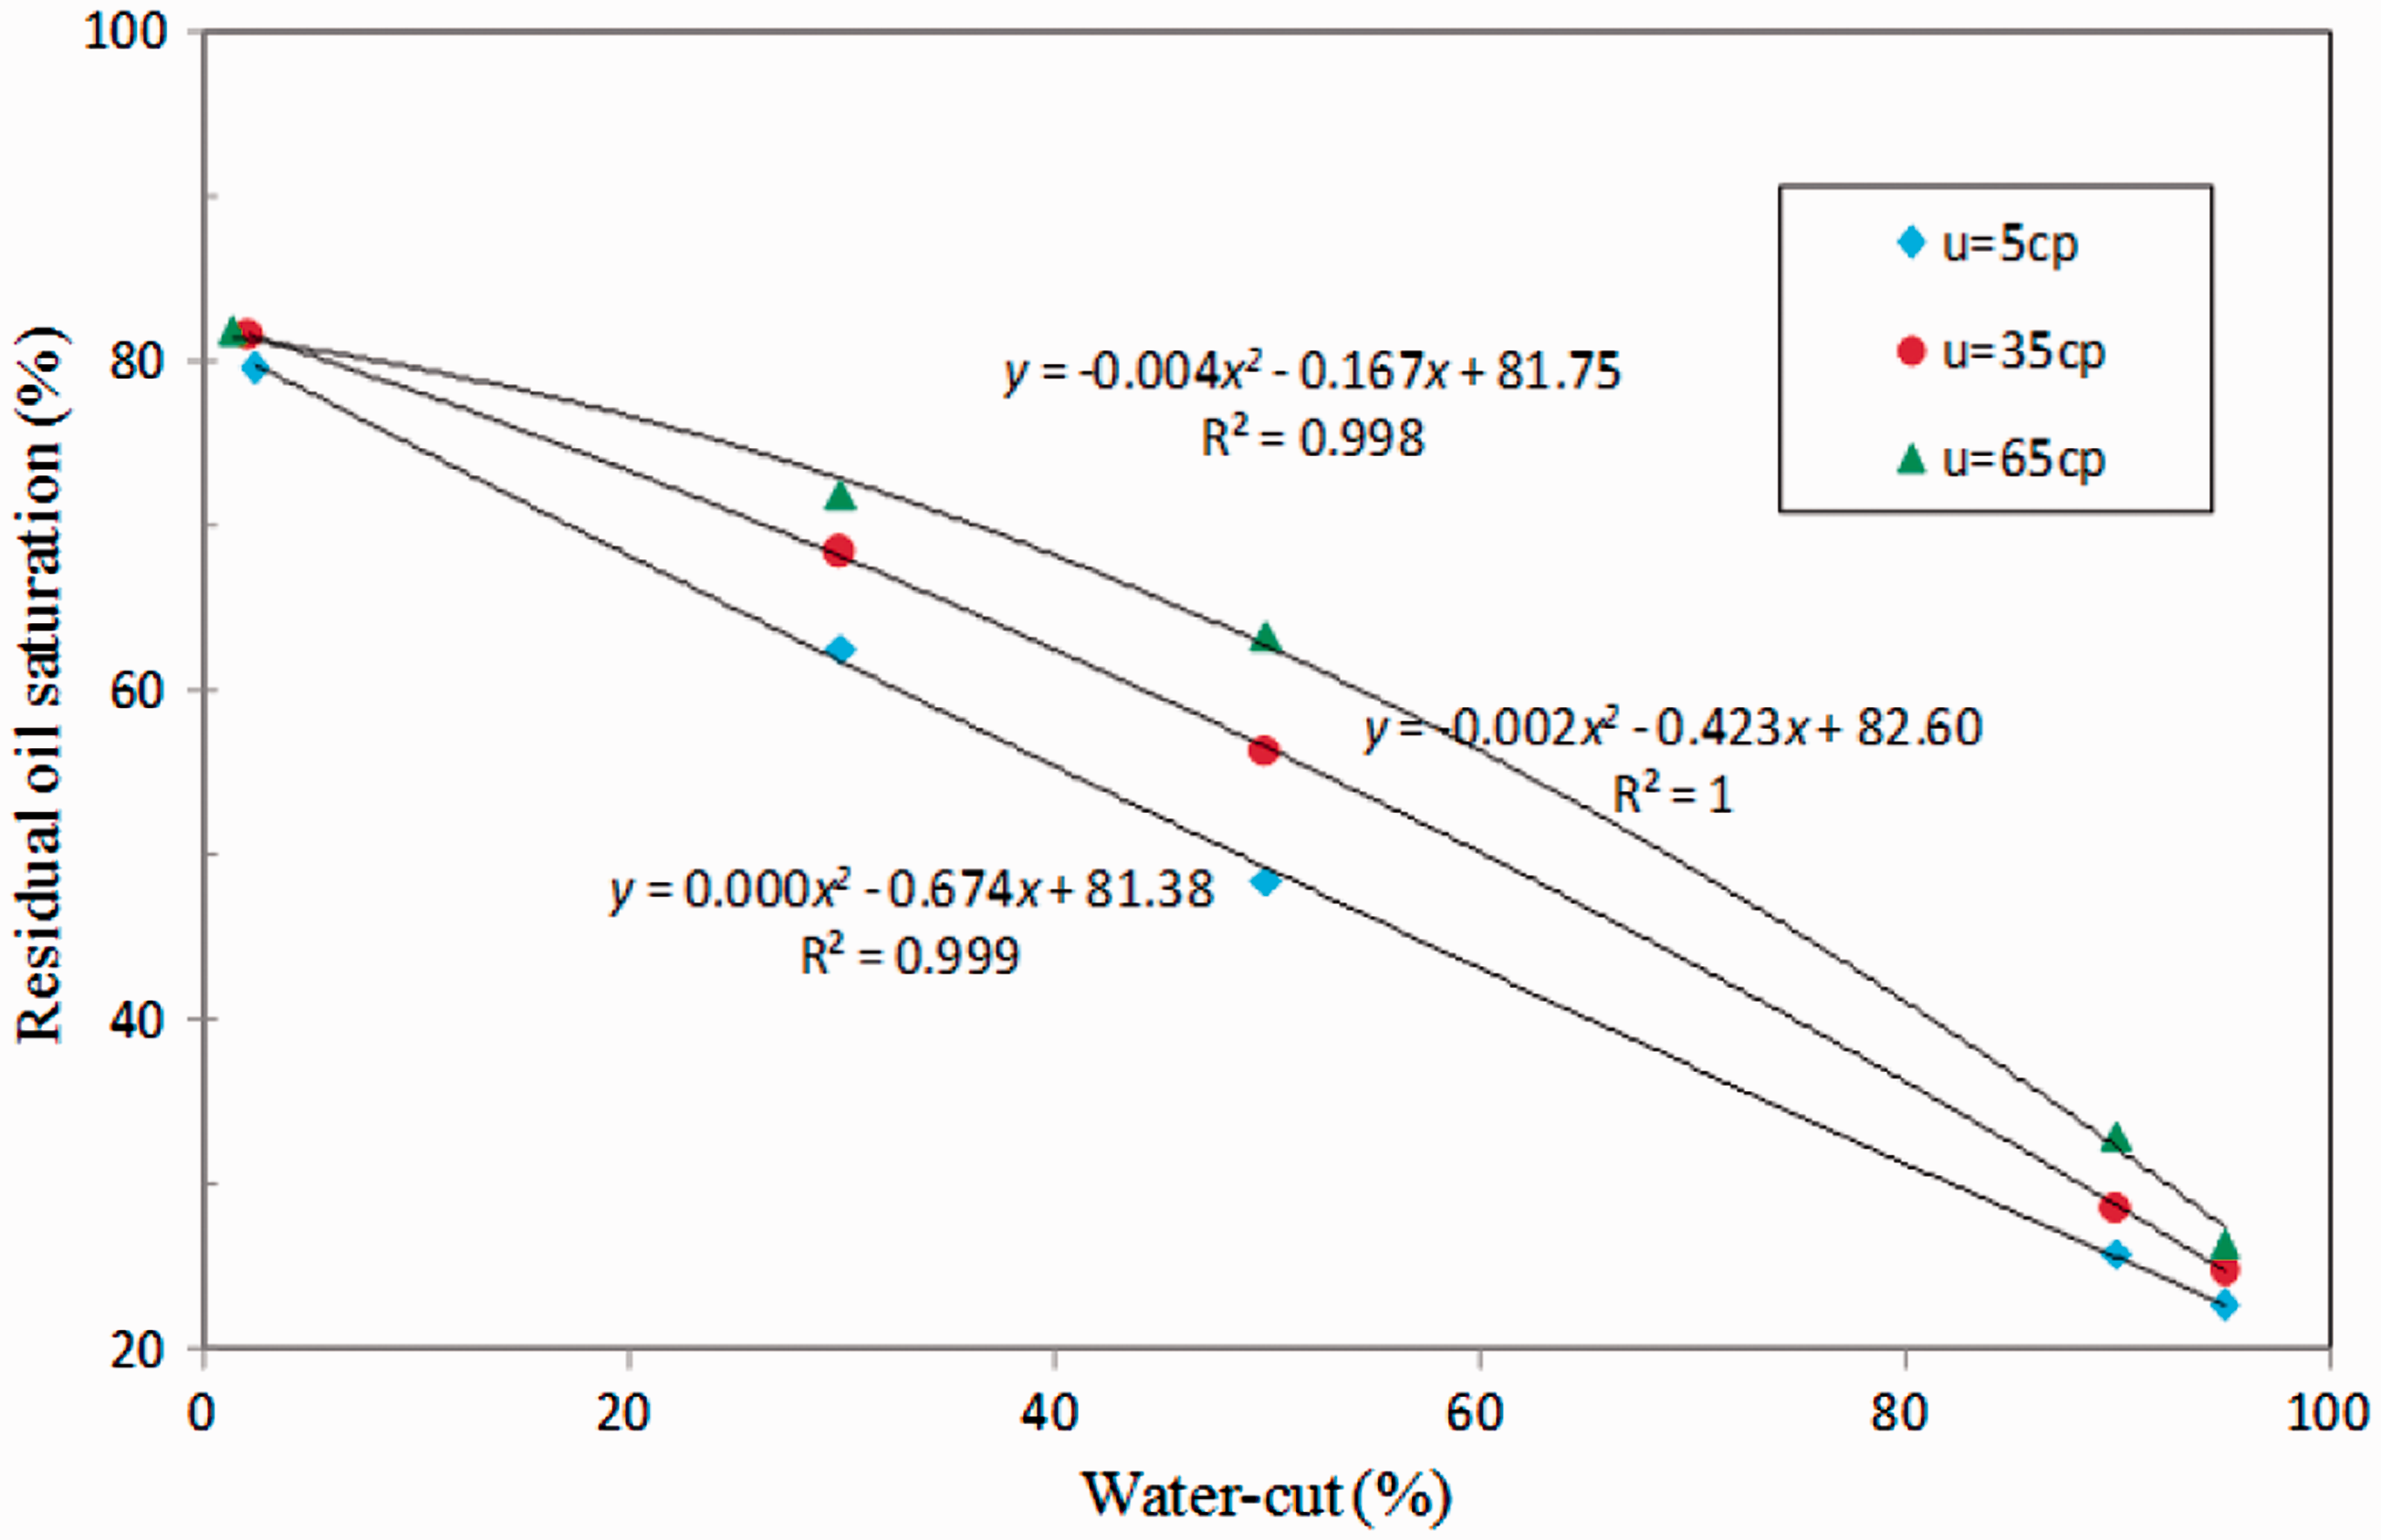
After water flooding, the distributions of residual oil in samples are shown in Figure 5. The relationships between water-cut and residual oil saturation for different viscosity of oil are shown in Figure 6. Most contiguous oil type and branched oil type is distributed at the edge against the main diagonal of micro-model and the majority of the other three types of residual oil is distributed in the middle of the micro-model. The residual oil saturations of the three oil samples were 22.62%, 24.70%, and 26.46%, respectively. The calculated recoveries from these three oil samples are shown in Figure 5, which were 64.83%, 62.75%, and 60.99%, respectively. As is the same case in other parameters, the lower the oil viscosity, the higher the oil recovery will be.
End of flooding 15.0 PV water injected with three oil samples. (a) End of flooding, 15 PV water injected (uo = 5 cp), (b) End of flooding, 15 PV water injected (uo = 35 cp) and (c) End of flooding, 15 PV water injected (uo = 65 cp). Relationship between water-cut and residual oil saturation for different viscosity oil.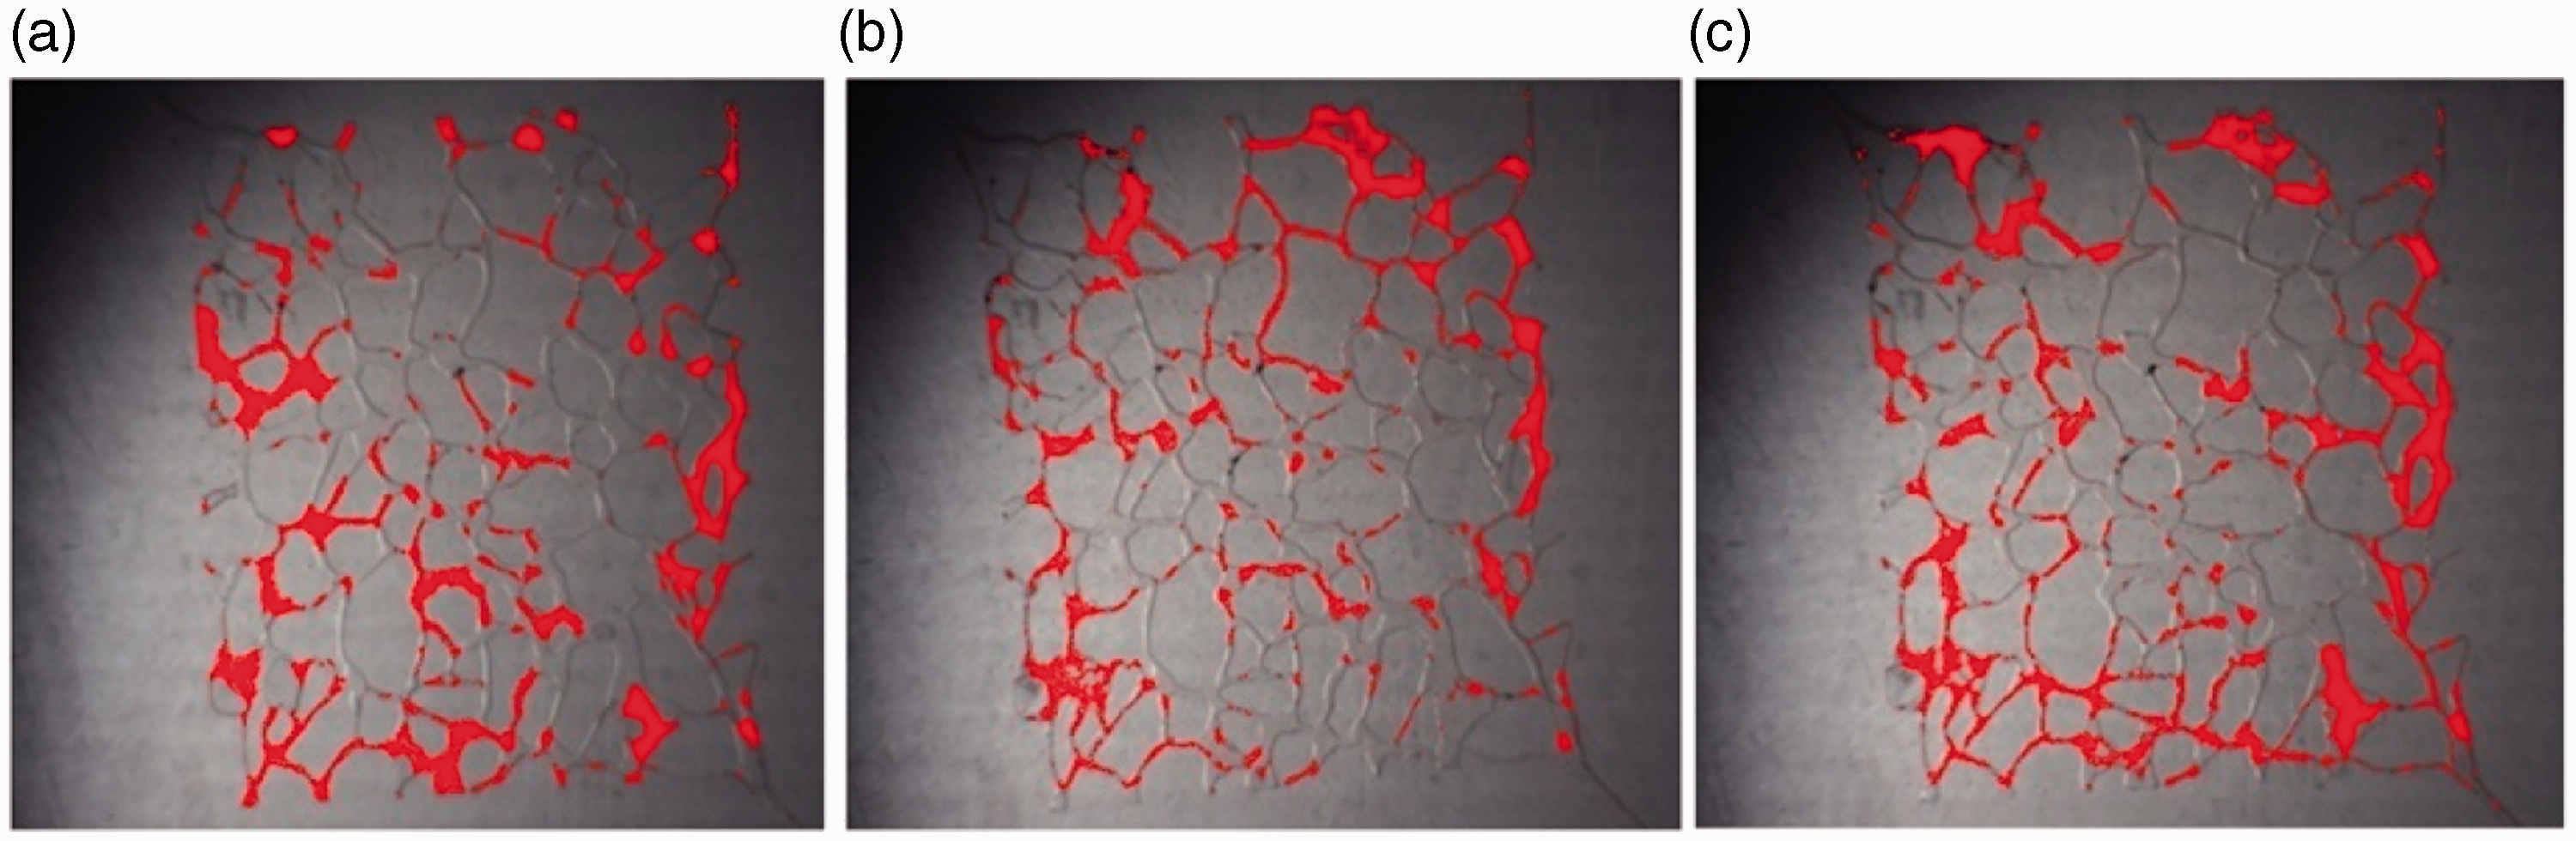
To investigate the relationships between the five types of residual oil saturation and water-cut during the water flooding process, saturations of the five types of residual oil were calculated at different water flooding periods, and the results are shown in Figure 7. Figure 7(a–c) indicates that an increase in water-cut results significantly reduced contiguous oil type saturation, but saturation of the other types of residual oil increased first before decreasing. For various oil viscosities at high water-cut stage, an increase in the viscosity of oil does not only lead to reduction in saturation of columnar oil type, but also results in an increment in saturation of contiguous and branched oil type. However, saturation of droplet oil type and oil film oil type does not change significantly.
Relationships between water-cut and types of residual oil saturation for the three oil samples. (a) uo = 5 cp, (b) uo = 35 cp and (c) uo = 65 cp.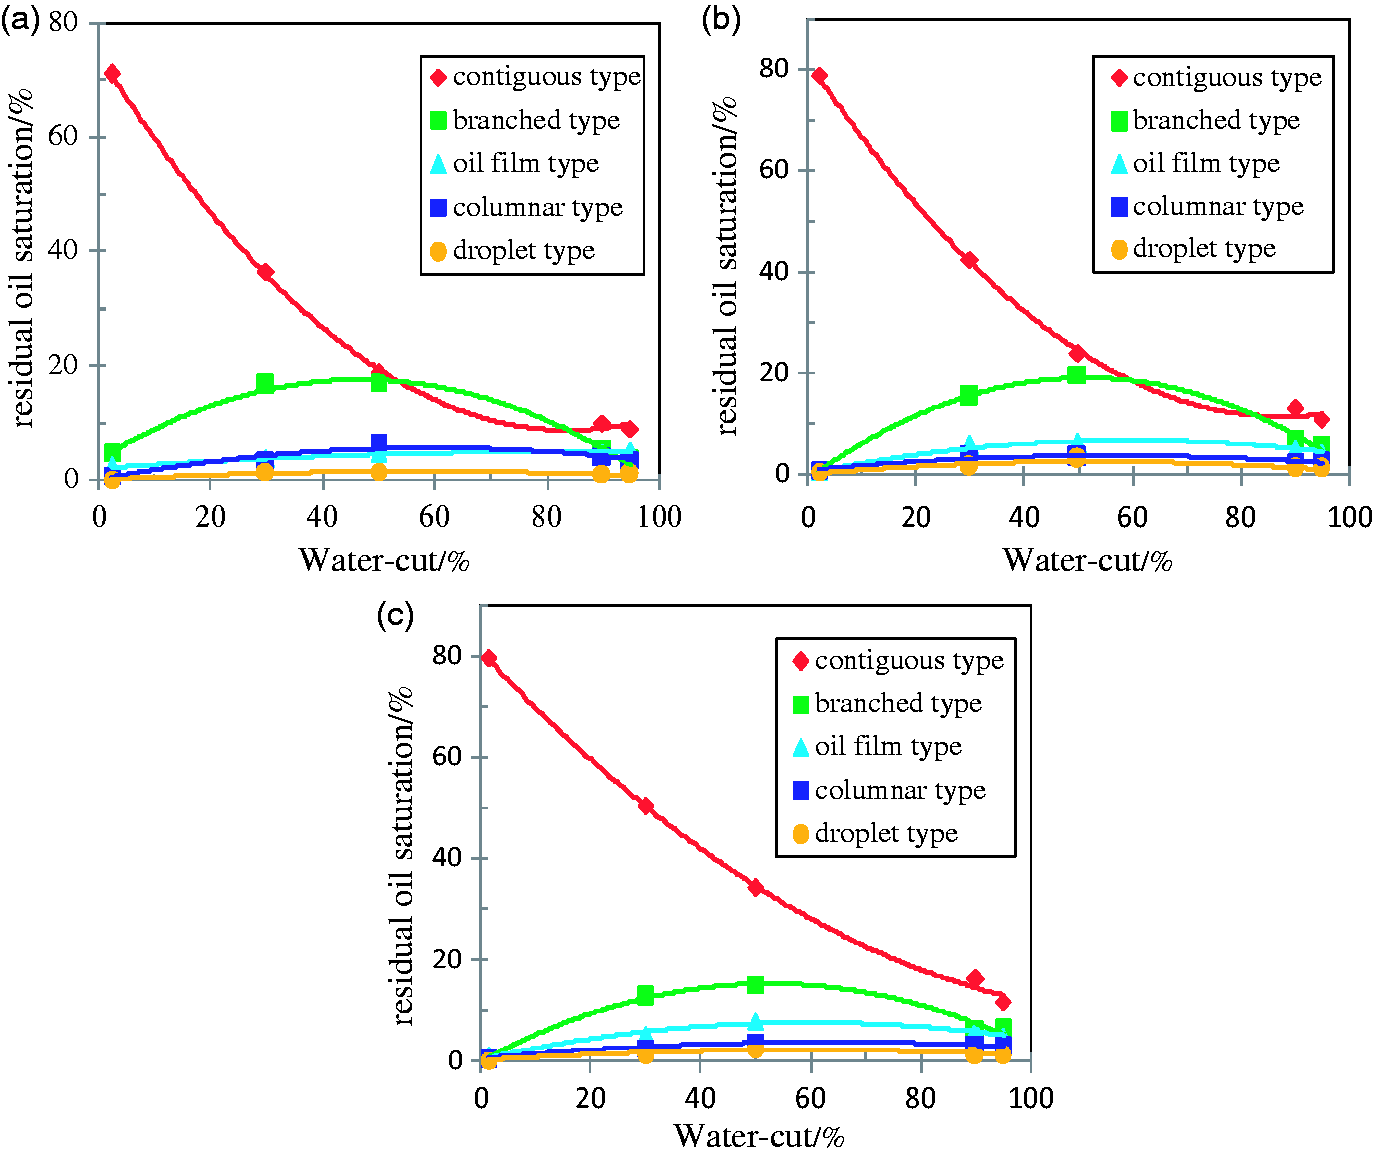
Prediction of correlations for different types of oil saturation
Image and data processing techniques helped to calculate types of residual oil saturation for oil samples with various viscosities at any water-cut period. According to the results of experiments, Figure 7 indicates the relationships between the types of residual oil saturations and water-cut for various oil viscosity samples and the general formula can be stated as follow:

As the relationship equations are different for various viscosity oil samples, we take viscosities into consideration and define the dimensionless viscosity as 
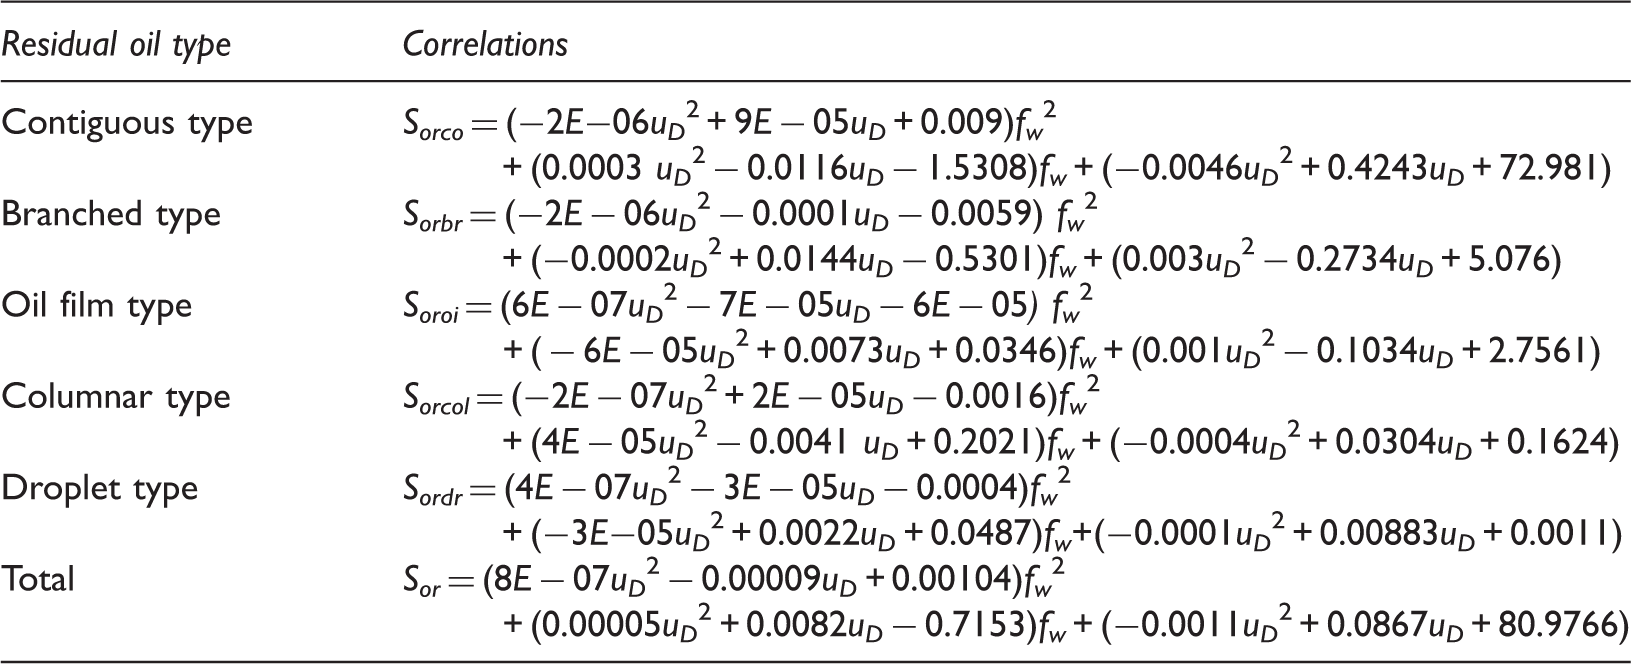
Then, the general formulas for various types of residual saturations are stated as follows:


Prediction correlations for residual oil saturation types.
Microscopic investigation of the recovery improving potential for different production strategies
When water-cut exceeds 90% quickly at an injection velocity of 0.05 mL/min, the residual oil saturation was still much higher at this moment. In order to enhance recovery, the enhance oil recovery (EOR) methods of increasing injection velocity and altering primary flow channels were introduced in this study.
EOR for residual oil with an increasing injection velocity
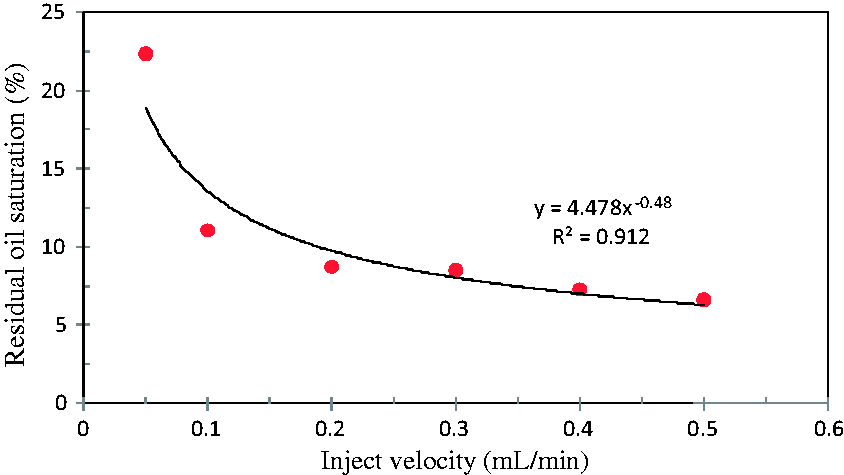
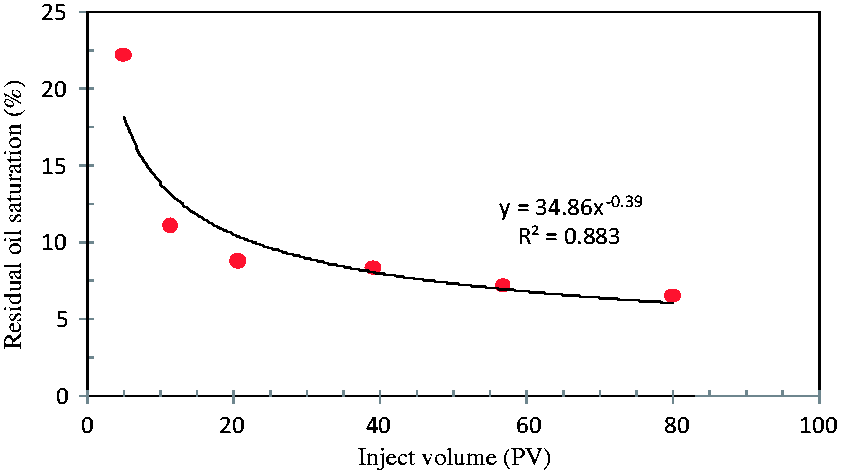
Figures 8 and 9 indicate that recovery can be significantly improved by increasing injection velocity. Total residual oil saturation decreased from 22.62% to 6.53% during the whole flooding process, which means total residual oil saturation decreased by 16.09%. The total residual oil saturation decreased most significantly when injection velocity was switched to 0.1 mL/min. The decline of total residual oil saturation became smaller with higher injection velocity when the injection velocities exceeded 0.1 mL/min. Figure 10 shows the reduction of total residual oil saturation declining insignificantly with more water injected after injection volume exceeds 20 PV.
Distribution of residual oil at different injection velocity. (a) End of 0.05 mL/min, So = 21.22%, (b) End of 0.10 mL/min, So = 11.05%,(c) End of 0.20 mL/min, So = 8.73%, (d) End of 0.30 mL/min, So = 8.39%, (e) End of 0.40 mL/min, So = 7.26%, (f) End of 0.50 mL/min, So = 6.53%. Relationship between total residual oil saturation and injection velocity. Relationship between total residual oil saturation and injection volume.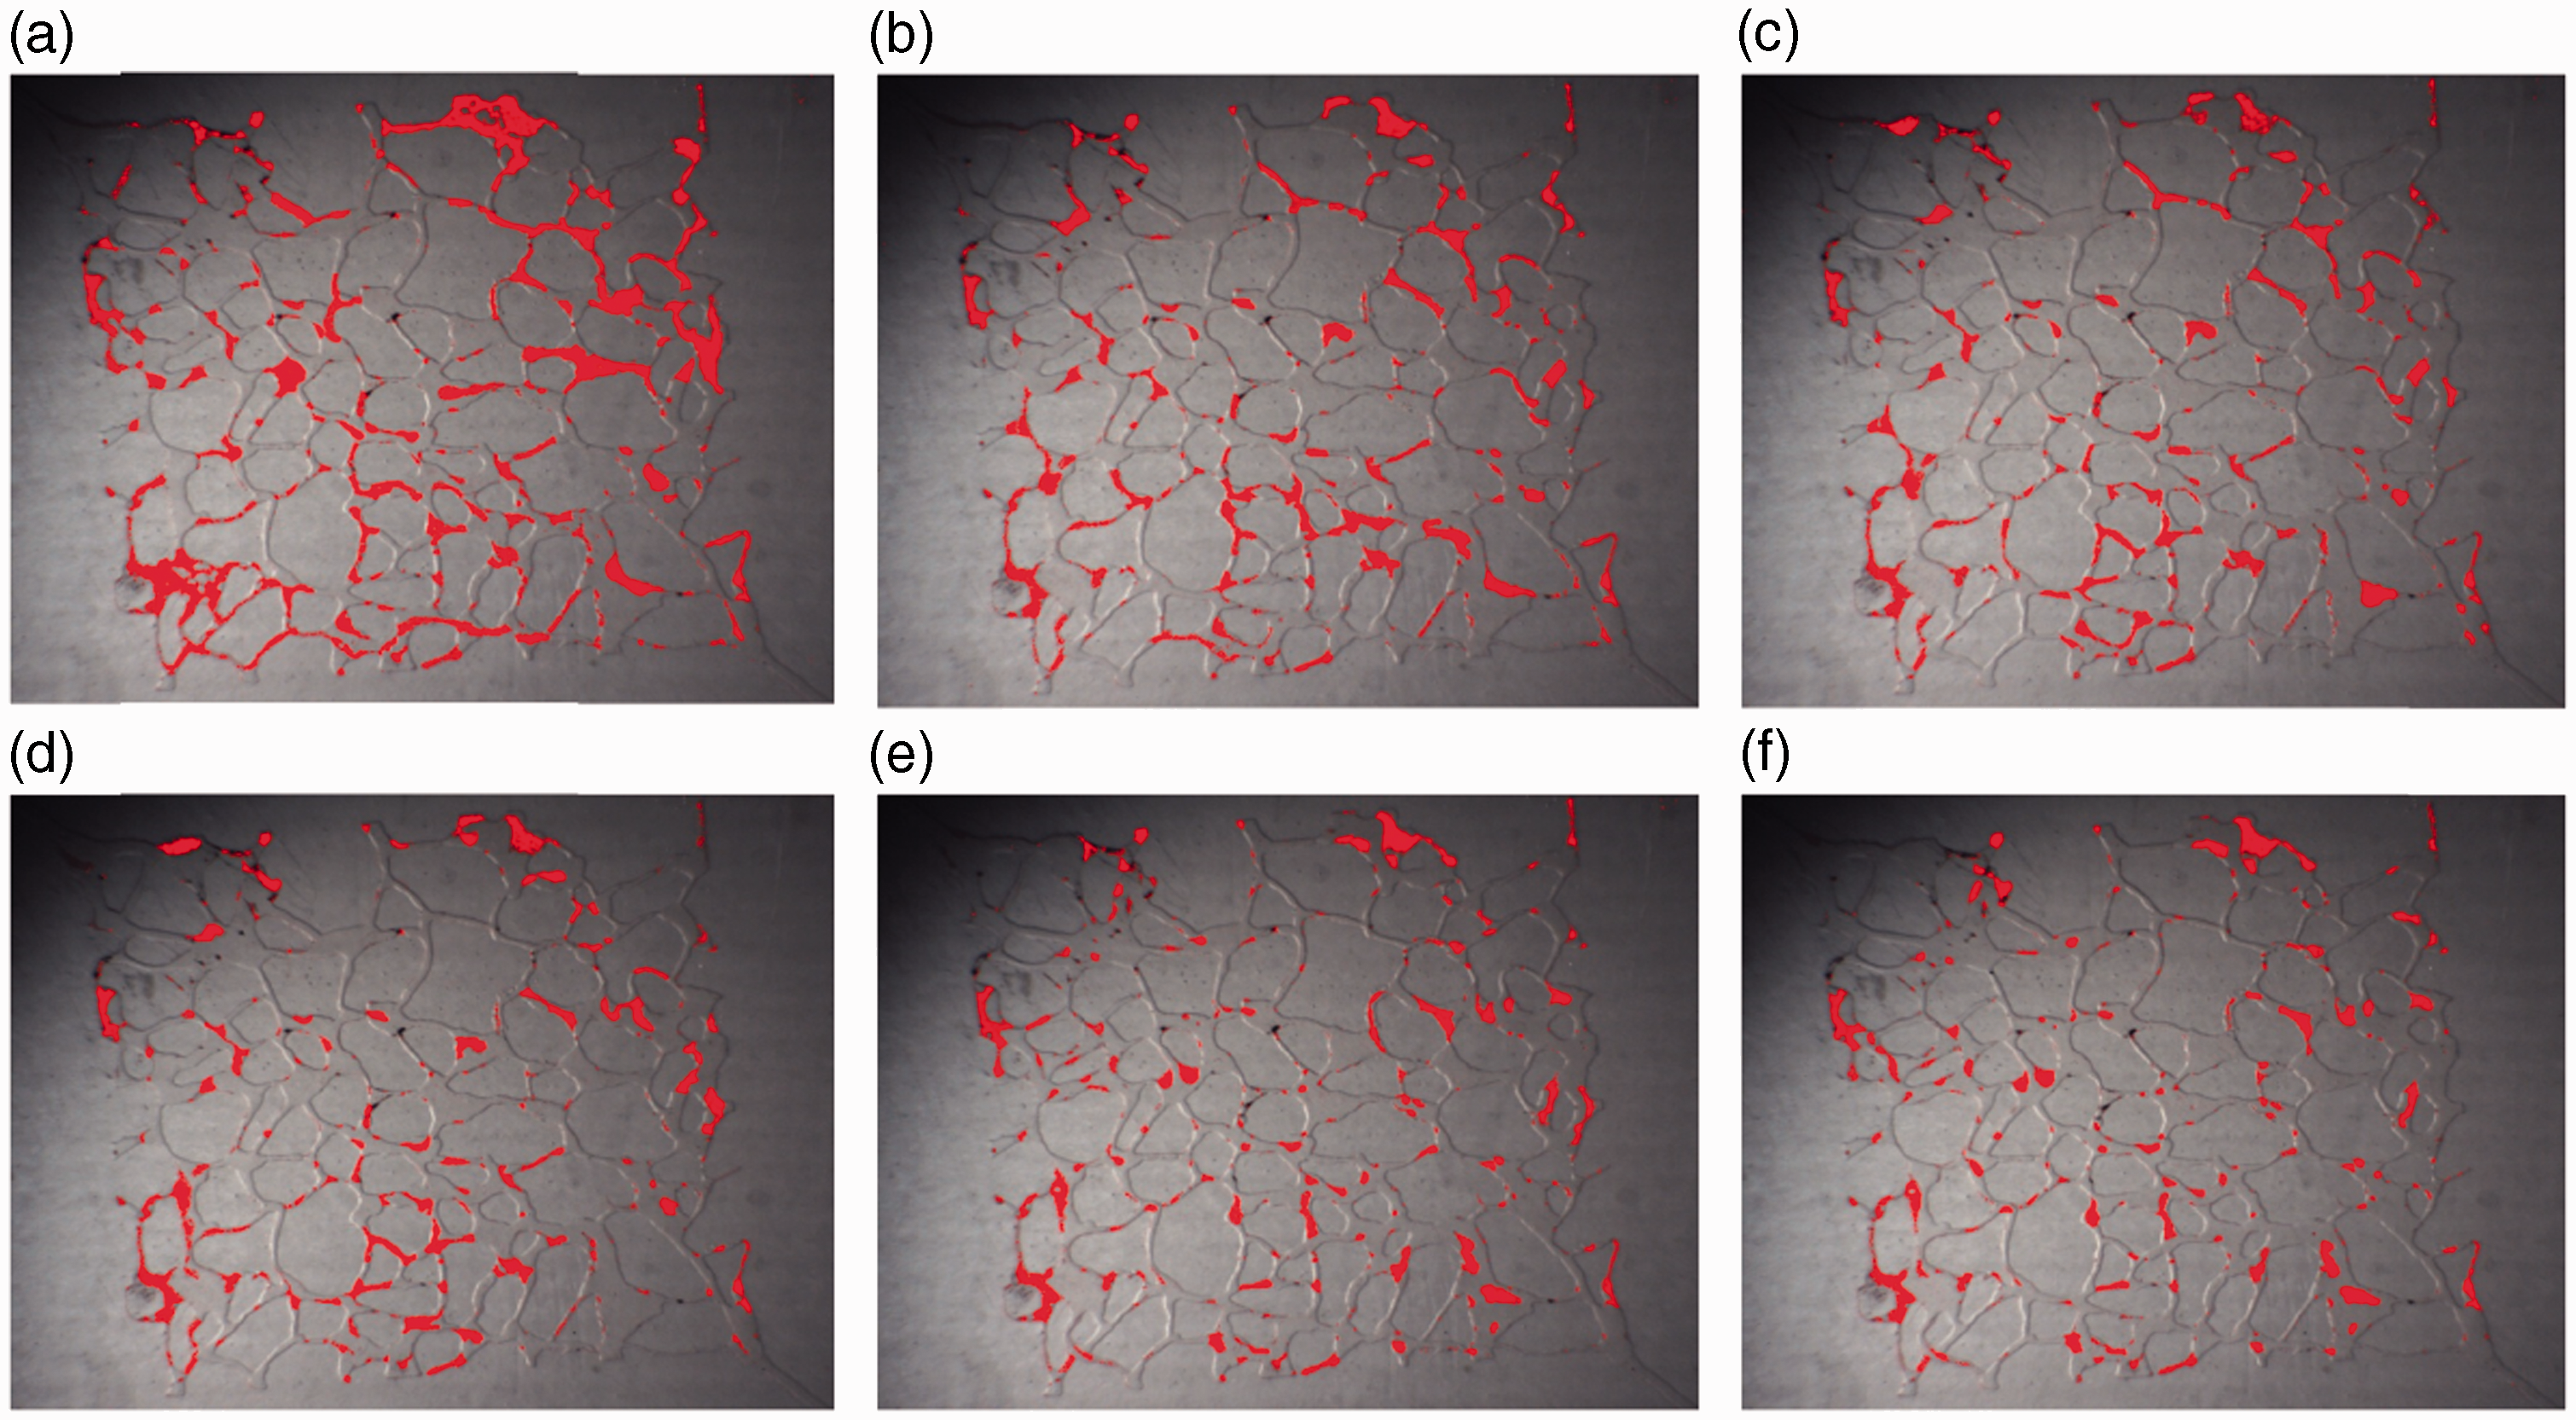
Variations of different types of residual oil in particular locations under conditions of various injection velocities were shown in Figure 11. Displacement efficiency of different types of residual oil was obviously improved by increasing injection velocity. Besides, part of contiguous type, branched type, and oil film type residual oil transformed into columnar type and droplets type residual oil with an increment in injection velocity. Figure 12 shows different percentages of various types of residual oil at different injection velocities. The higher the injection velocity, the lower the percentage of branched type residual oil will be, while the percentage of contiguous residual oil type decreased first and then increased to attain stability. However, percentages of oil film type and columnar type residual oil increased first and then decreased.
Changes in different types of residual oil in a particular location at different injection velocities. Percentages of residual oil types at different injection velocities.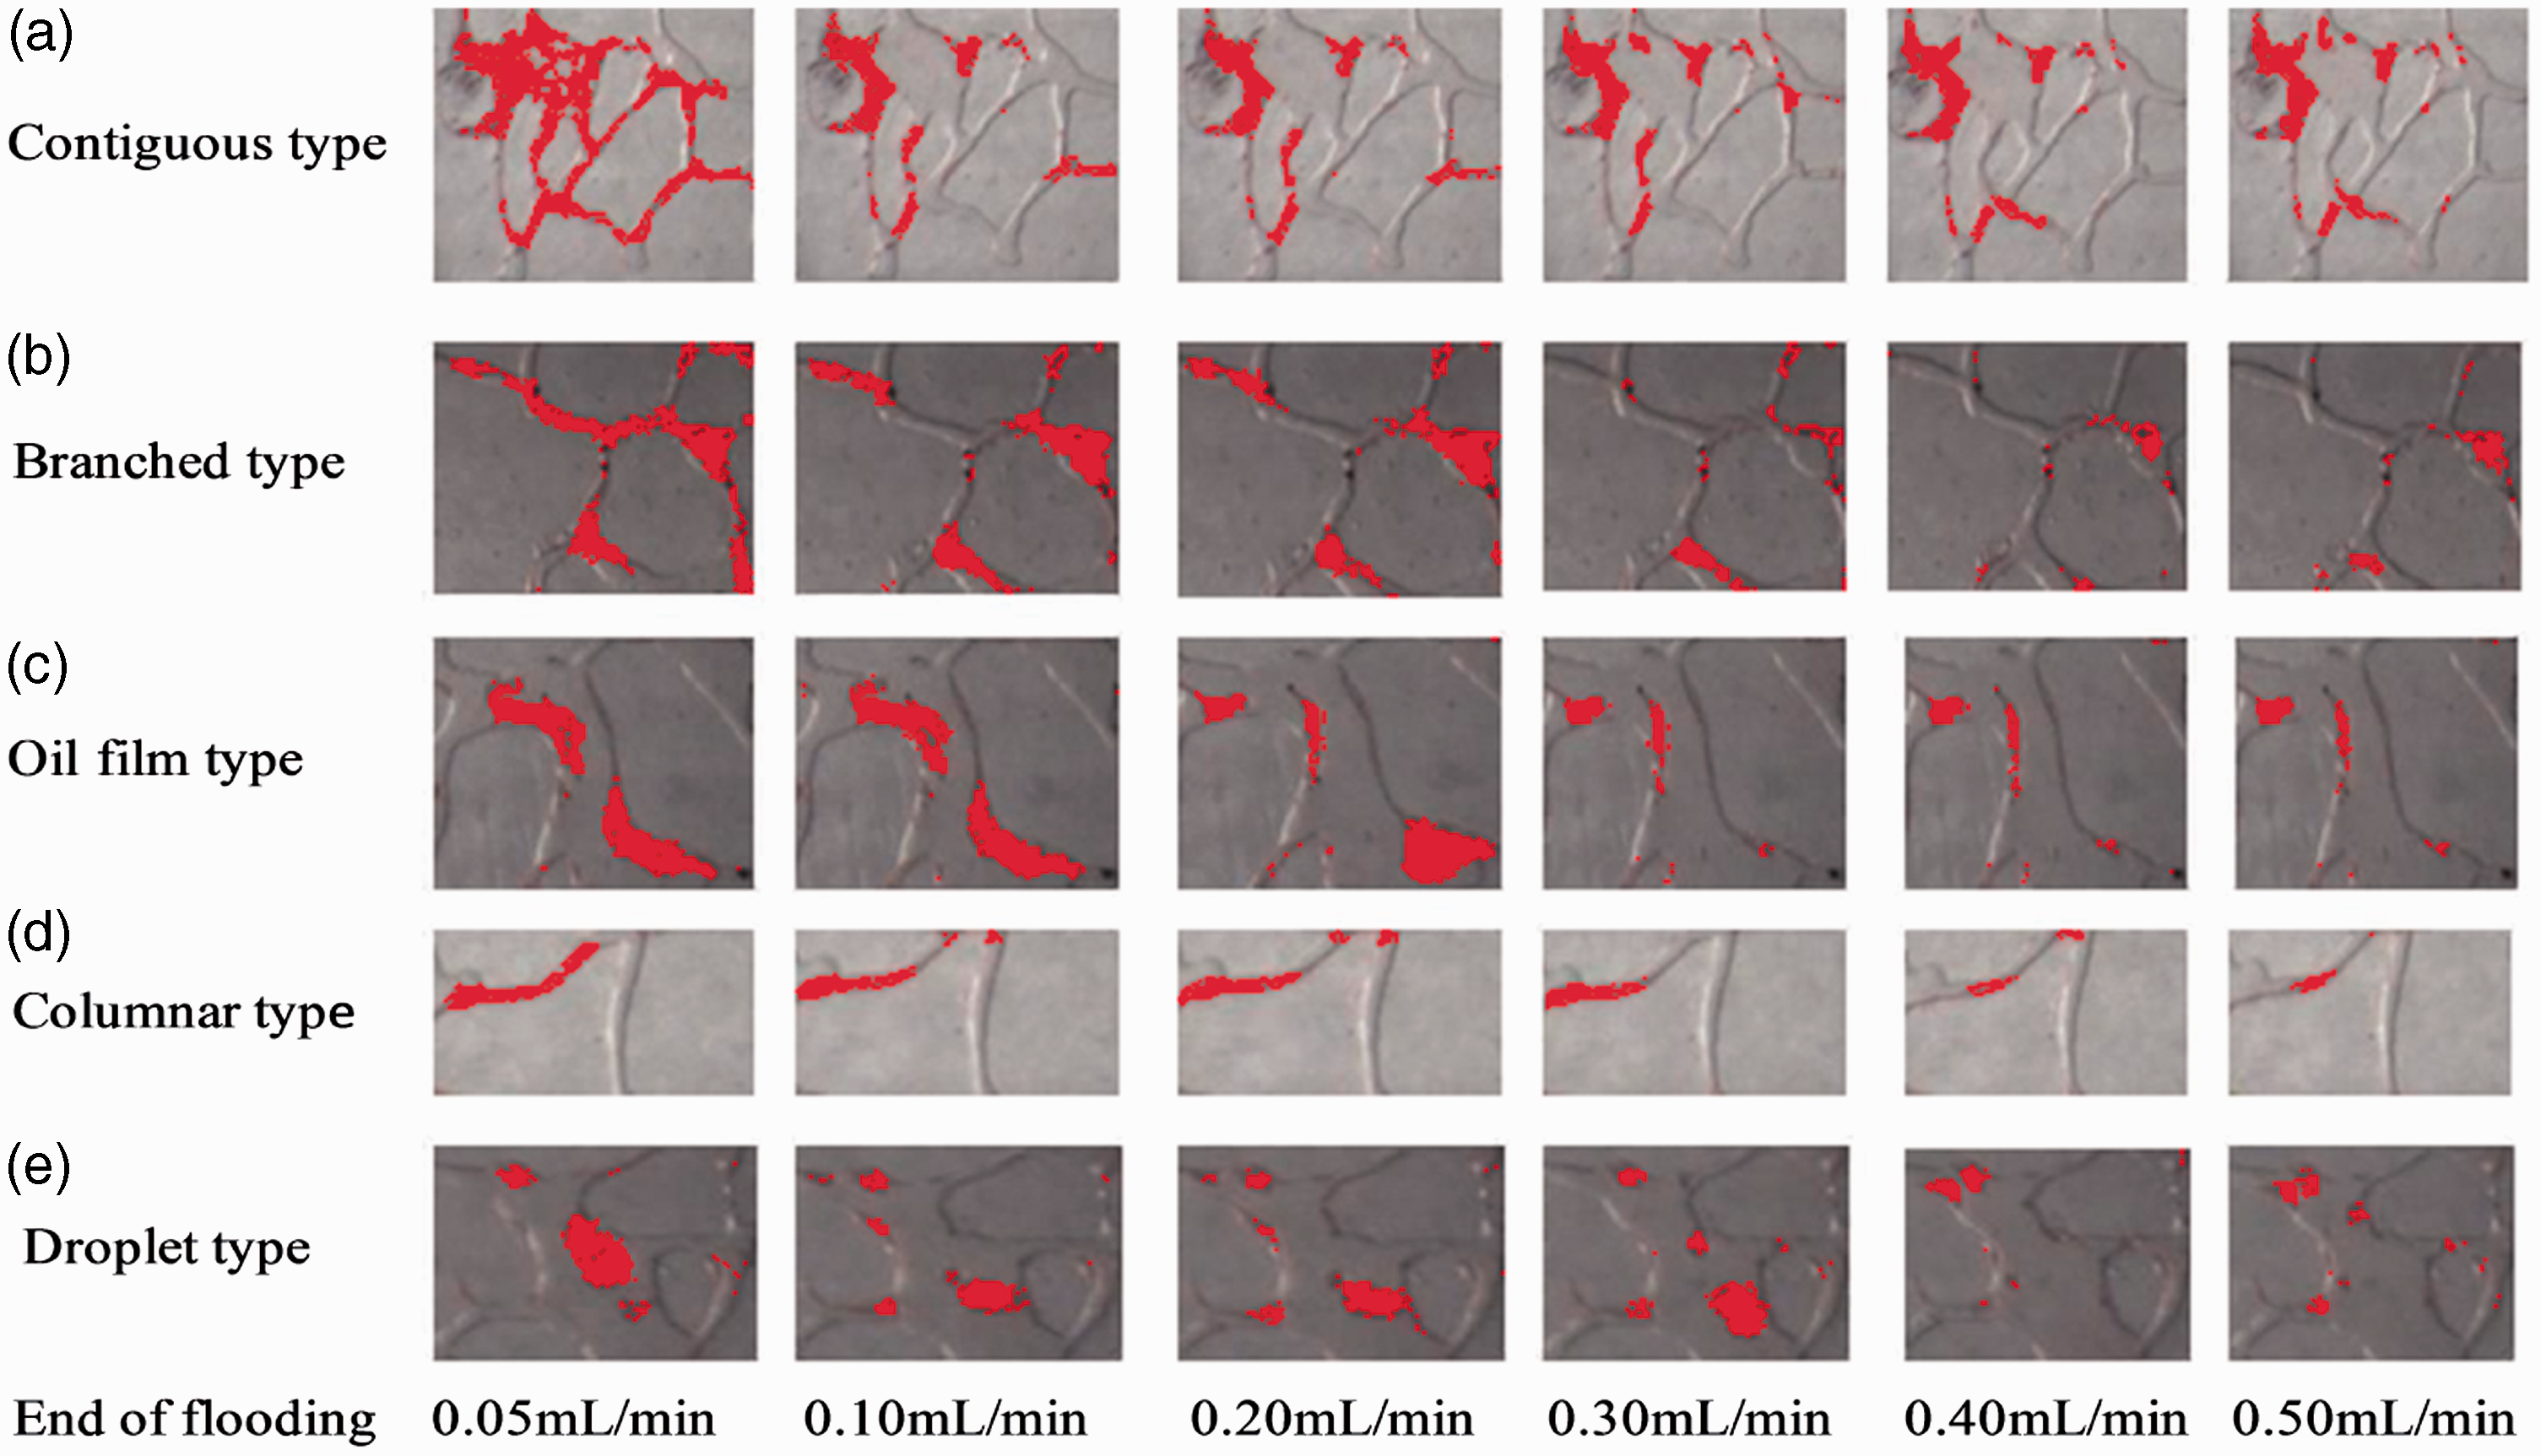
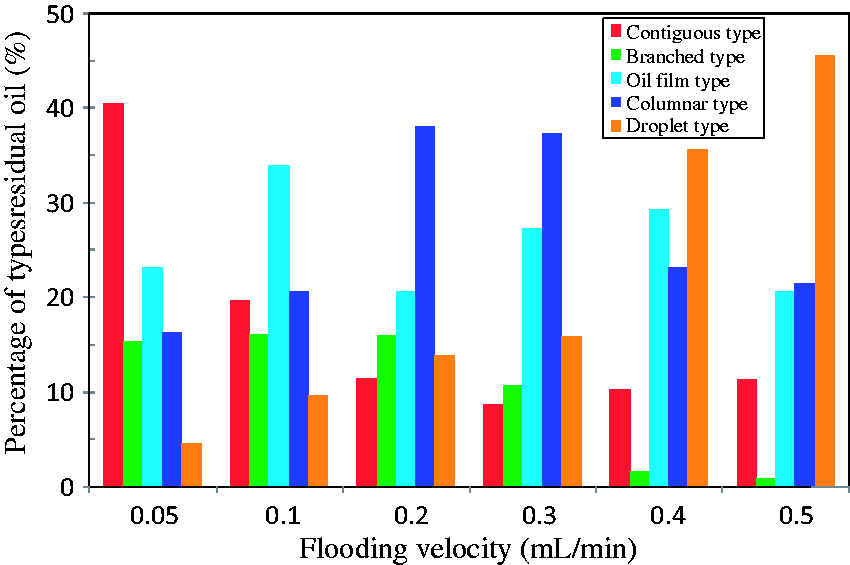
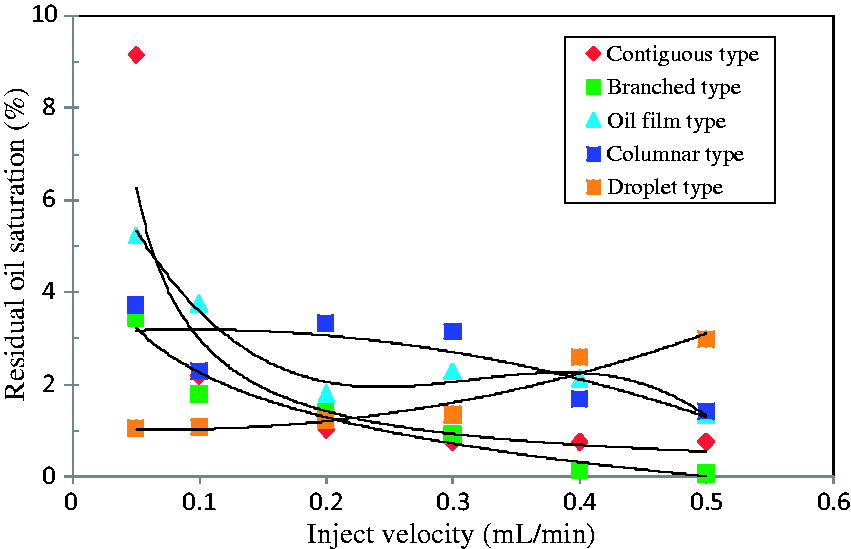
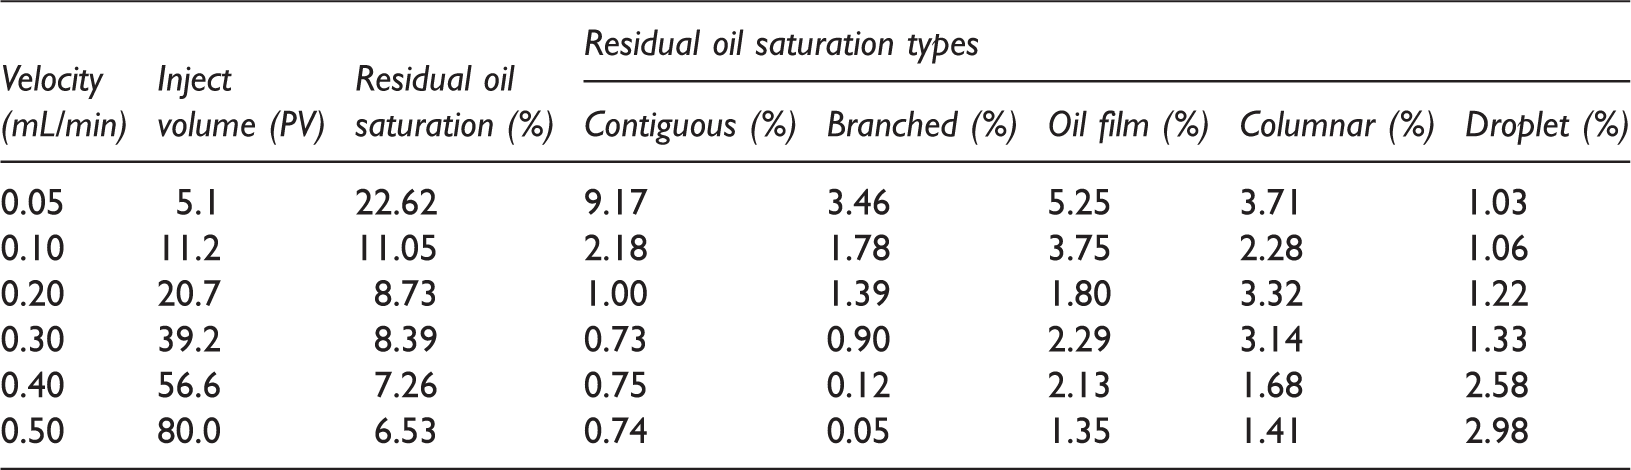
Table 6 and Figure 13 show quantitative relationships between various types of residual oil saturation and injection velocity. An increase in injection velocity and injection volume results in significant reduction of total residual oil saturation. In addition to droplet residual oil type, residual oil saturations of the other four types of residual oil decreased significantly at the end of the flooding process. However, the variations in residual oil saturation types were not the same during the flooding process. The saturation of contiguous residual oil type increases first before decreasing to stabilize. However, saturation of branched type residual oil decreases monotonically while saturation of oil film type and columnar residual oil type first decrease and then increase before finally stably reducing. Meanwhile, saturation of droplet type residual oil increases monotonically with an increase in injection velocity. Therefore, the main reason for this situation is that part of contiguous type and branched type residual oil transform into other residual oil types. The quantitative relationships between various types of residual oil saturation and injection velocity are as follows:
Relationship between various types residual oil saturation and injection velocity. Relationship between various types of residual oil saturation and injection velocity.


EOR of residual oil by altering primary flow channels
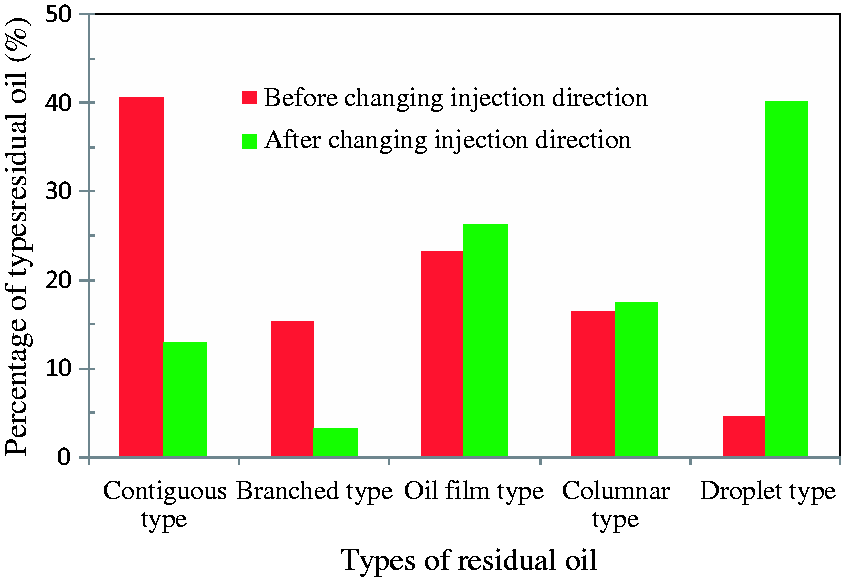
Figure 14 indicates the displacement efficiency of residual oil before and after altering injection direction. Residual oil saturations were 22.62% and 9.69% before and after the injection direction changed, respectively, which means that the oil displacement efficiency increased by 12.93% by altering primary flow channels. The percentages of each type of residual oil before and after changing injection direction are shown in Figure 15. Percentages of contiguous residual oil type decline larger than that of branched residual oil type by altering primary flow channels with most of the contiguous type and branched type residual oil displaced out during the flooding process. Also, part of contiguous type and branched residual oil type transforms into oil film type, columnar type, and droplet residual oil type.
Displacement efficiency of residual oil before and after changing injection direction. (a) Before changing injection direction, End of 0.05 mL/min, So = 22.62% and (b) After changing injection direction, End of 0.05 mL/min, So = 9.69%. Percentages of each type of residual oil before and after changing injection direction.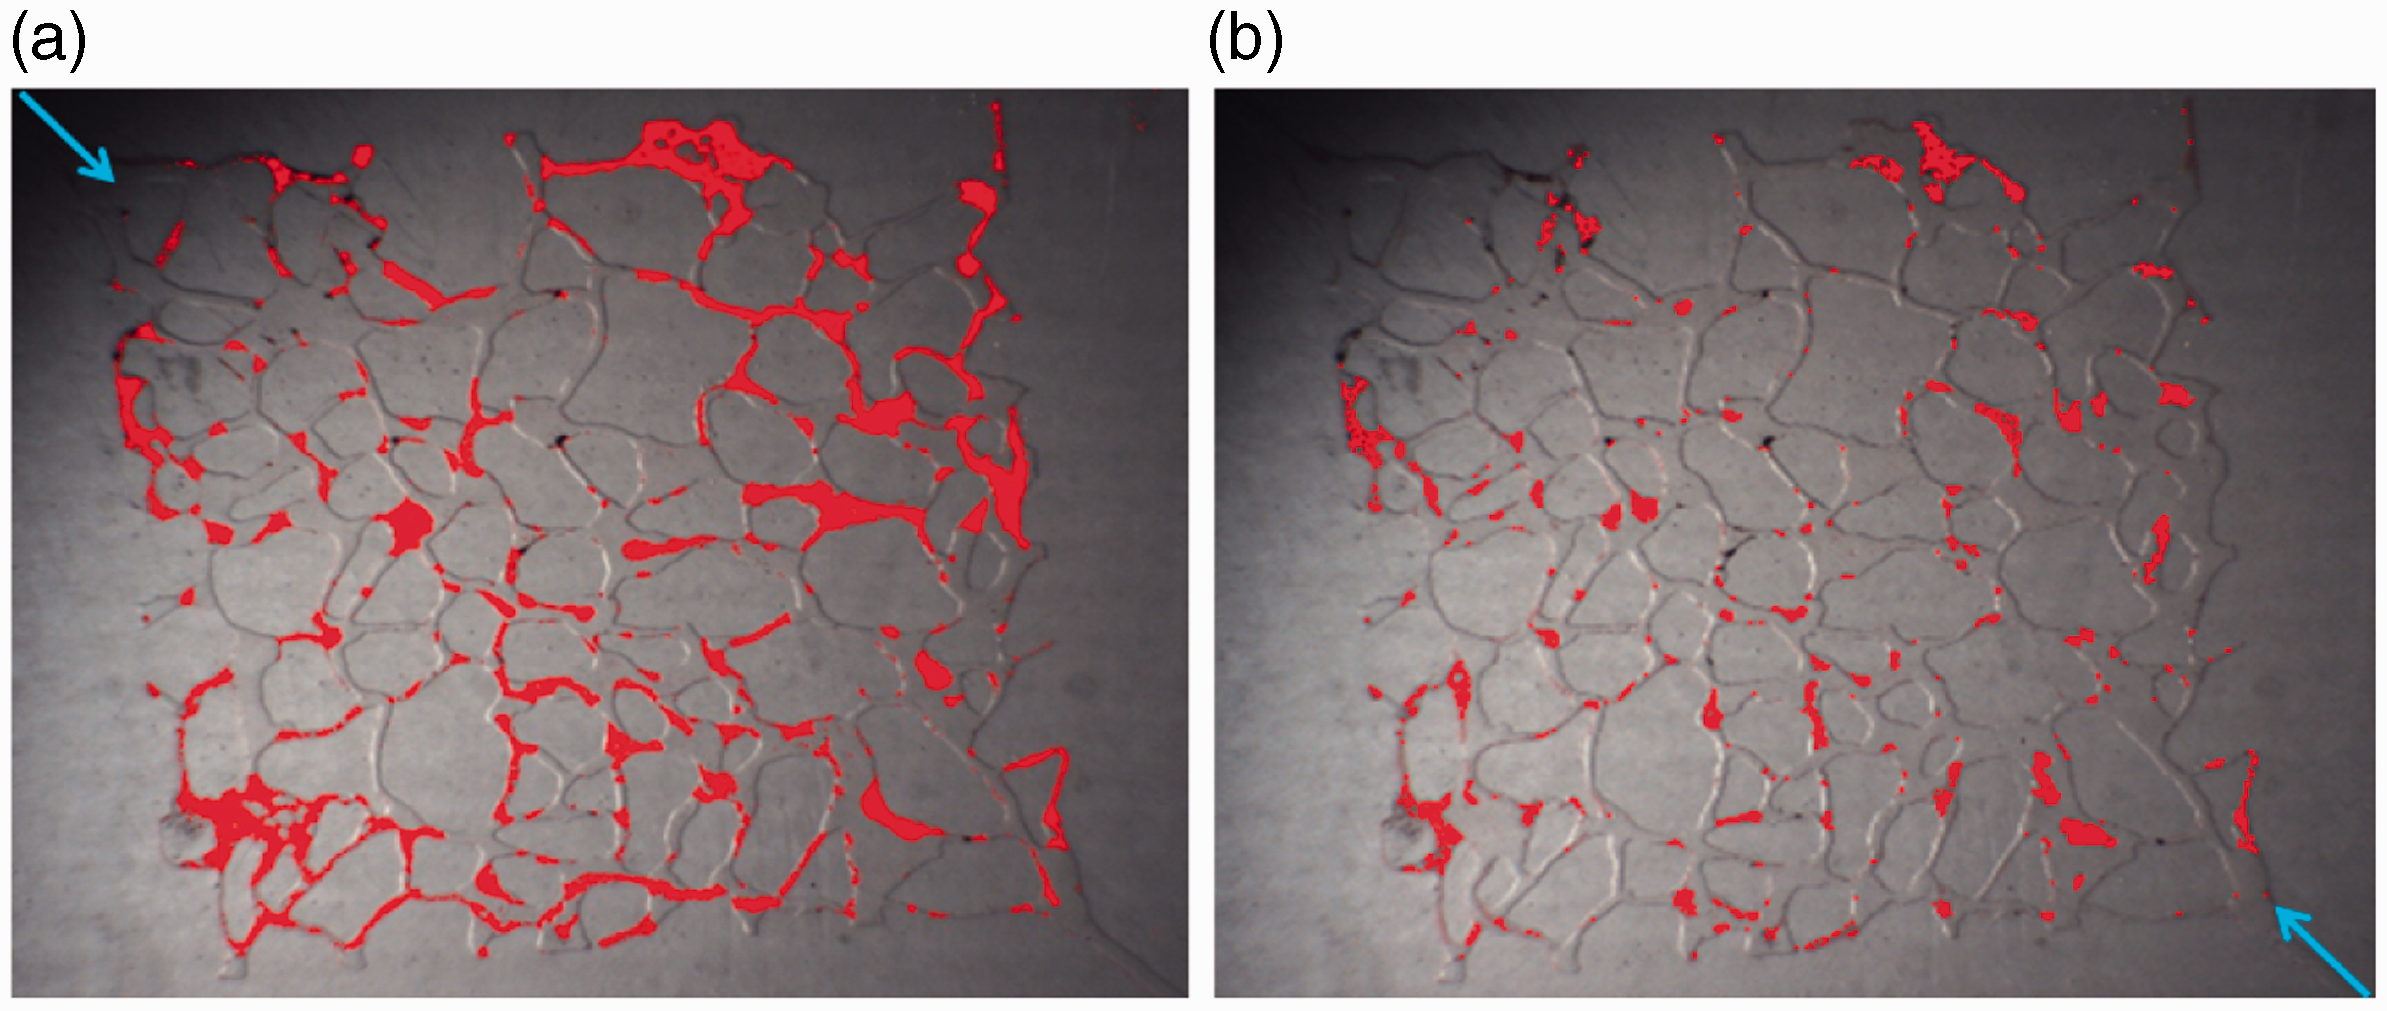
As can be seen from Figure 16, the percentages of each types of residual oil were much different at various oil saturation stages. The lower the residual oil saturation, the lower the percentages of contiguous type and branched type residual oil will be, and the higher the percentage of droplet type residual oil will be. In addition, the percentage of oil film type and columnar type residual oil first increases and then reduces with a decrease in residual oil saturation.
Percentages of each types of residual oil at different saturation stages.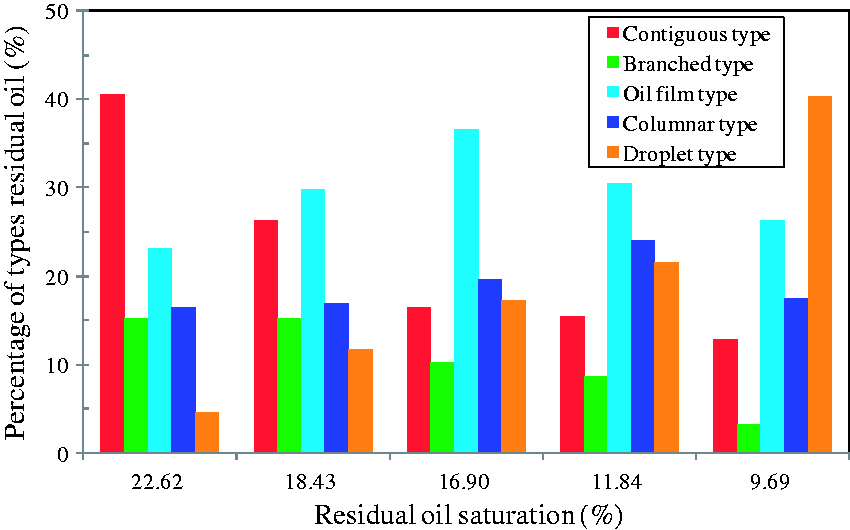
Table 7 and Figure 17 indicate the quantitative relationships between various types of residual oil saturation and injection volume after altering injection direction. The total residual oil saturation decreased significantly with an increase in injection volume, and the final residual saturation was 9.69%. The variation of residual oil saturation types were not the same after altering primary flow channels. Moreover, with an increase in injection volume, saturation of contiguous type and branched type residual oil decreases monotonically while saturation of oil film residual oil type first increases and then decreases. The saturation of columnar residual oil type changes awfully while the saturation of droplet residual oil increases monotonically.
Relationship between various types of residual oil saturation and injection velocity after altering injection direction. Relationships between various types of residual oil saturation and inject volume.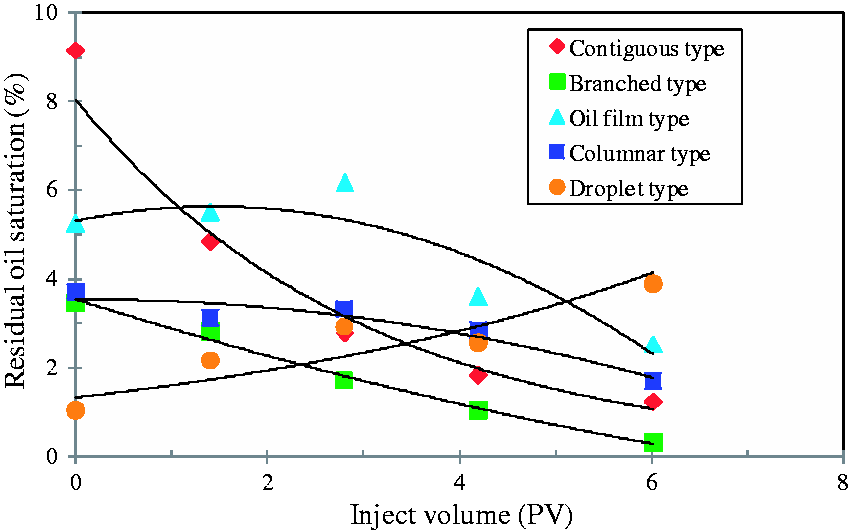
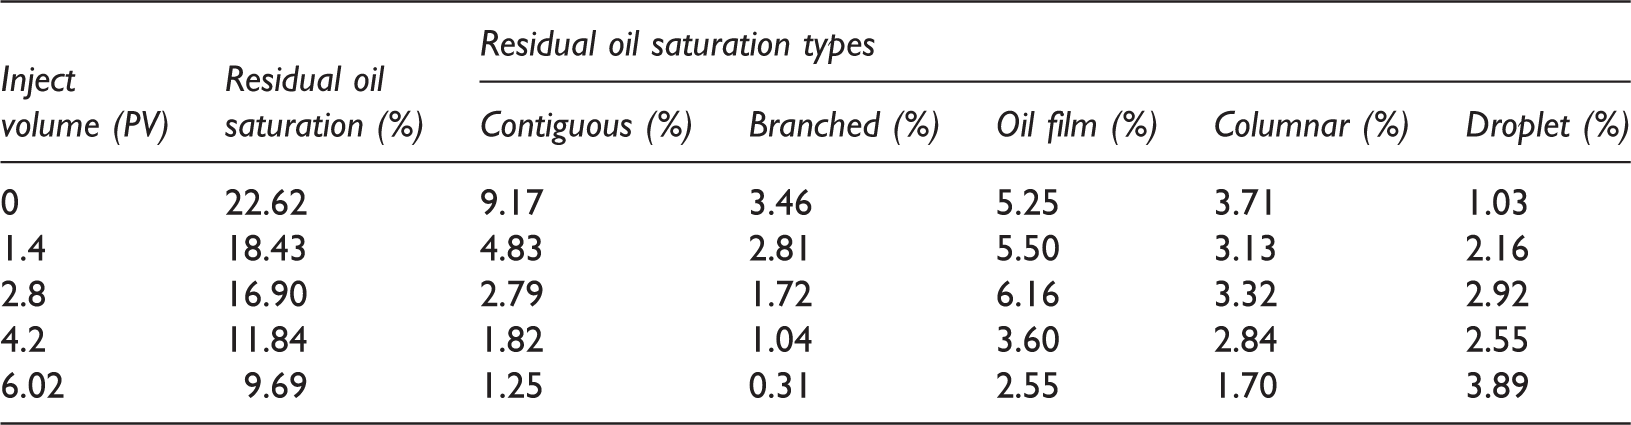
The quantitative relationships between various types of residual oil saturation and injection volume after altering primary flow channels are as follows:


Variations of residual oil saturation types at different stages of saturation.
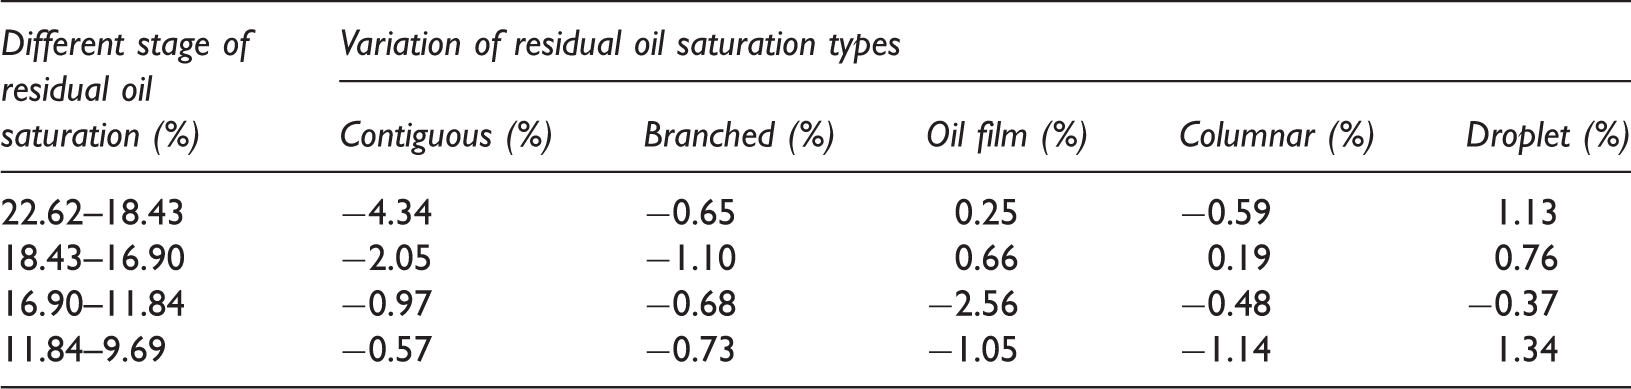
During the stage of total residual oil saturation between 18.43% and 16.90%, contiguous type and branched type residual oil were mainly displaced while saturation of the other three types of residual oil increases.
At the stage where total residual oil saturation was between 16.90% and 11.84%, oil film type residual oil was mainly displaced followed by contiguous type. Branched type and columnar type residual oil with droplet type were the least displaced.
Finally, when total residual oil saturation was between 11.84% and 9.69%, saturation of droplet residual oil type increases significantly while oil film type and columnar residual oil type were mainly displaced.
Comparative analysis
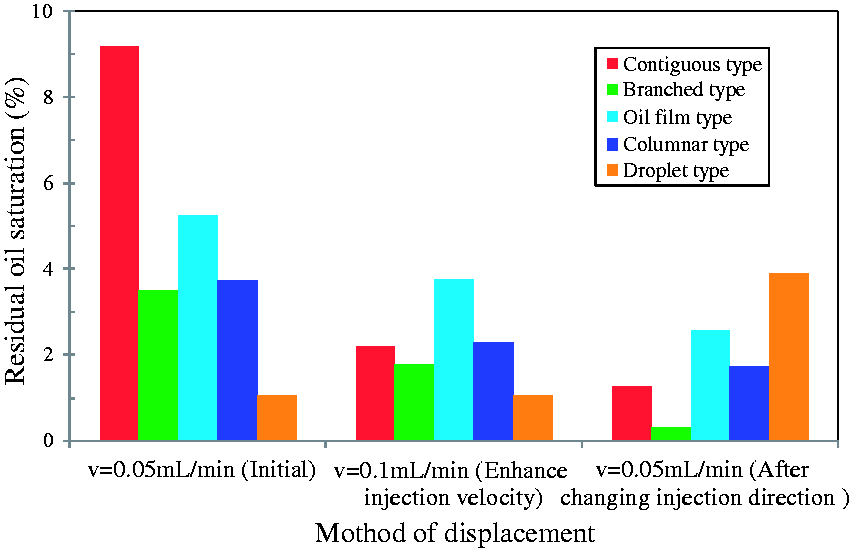
The methods of enhancing injection velocity and alternating injection direction were used to continue conducting flooding experiments after entering into high water-cut period at an injection velocity of 0.05 mL/min. The experimental results show that the residual oil saturation of altered injection direction was much lower than that of enhanced injection velocity under the condition of injecting the same volume of water. The final residual oil saturations were 11.05% and 9.69% for enhanced injection velocity and alternating injection direction, respectively. As can be seen in Figure 18, residual oil saturation decreases significantly at the beginning of enhanced injection velocity, and then declines gradually. Moreover, the residual oil saturation reduces gently during the whole process of altering injection direction. Figure 19 shows distribution of saturation for various types of residual oil under different injection methods. The displacement efficiency of contiguous type, branched type, oil film type oil, and columnar type residual oil by altering injection direction were much better than that of enhanced injection velocity. In general, some places were considered to be “dead oil region” before altering inject direction with most of contiguous and branched residual oil type in these areas can be displaced out by altering injection direction.
Contrast of displacement efficiency for different injection methods. Distribution of saturation for various types of residual oil under different injection methods.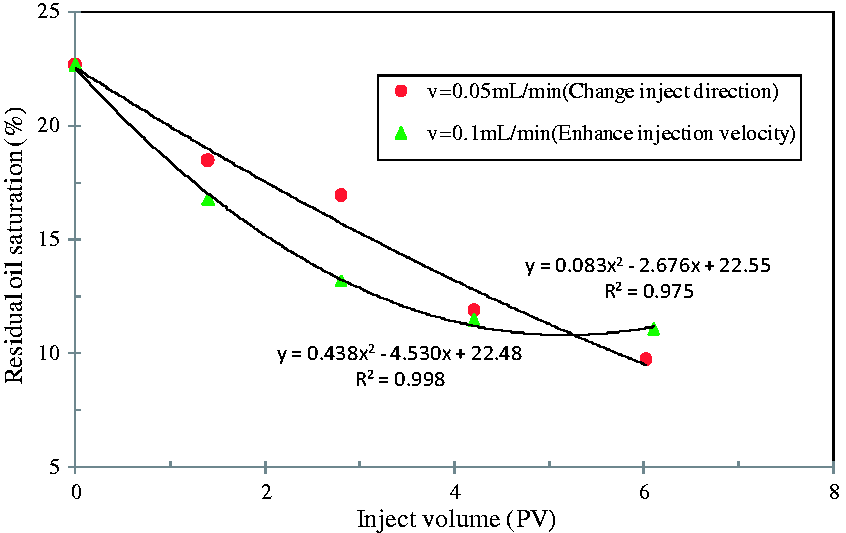
Conclusions
The various types of residual oil formation were observed under an etched-glass micro-model and quantitative classification criterion of residual oil was established. The residual oil was classified into droplet oil type, columnar oil type, oil film oil type, branched oil type, and contiguous oil type. Correlations between types of residual oil saturation and water-cut were established. The proposed methods and correlations established presented in this paper provide a novel means of predicting oil recovery and residual oil saturation types for water flooding reservoirs which have strong plane and weak vertical heterogeneity. Residual oil saturation decreased to 16.09% during the process of injection when injection velocity increased from 0.05 mL/min to 0.5 mL/min. However, with an increase in injection velocity, saturation of contiguous oil type first decreased and then stabilized. The branched oil saturation type monotonically decreased, but saturation of droplet oil monotonically increased. Residual oil saturation was 22.62% and 9.69% before and after the injection direction changed, respectively, which means that the displacement efficiency increased by 12.93% after altering the primary injection direction. The displacement efficiency of contiguous, branched, oil film, and columnar residual oil type by altering injection direction was much better than that of enhanced injection velocity. Some places were considered to be “dead oil region” before altering inject direction with most of contiguous and branched type residual oil in these areas can be displaced out by altering injection direction.
Footnotes
Acknowledgment
We would like to thank all editors and anonymous reviewers for their comments and suggestions.
Declaration of conflicting interests
The author(s) declared no potential conflicts of interest with respect to the research, authorship, and/or publication of this article.
Funding
The author(s) disclosed receipt of the following financial support for the research, authorship, and/or publication of this article: Parts of this work were supported by the Fundamental Research Funds for the Central Universities (2652015142), National Science and Technology Major Projects (2016ZX05009–006) and supports from Research Institute of Petroleum Exploration and Development, SINOPEC Shengli Oilfield.