
Abstract
Can the Nordic wage-setting model, where social partners decide wages through collective agreements, counteract a growing low-paid sector? This article tests four definitions of low-paid jobs to analyze whether this sector has grown for the period 2005–2020 in Sweden. Despite policy changes pointing towards growth, all definitions show a slight decrease in low-paid jobs over time. The authors argue that the industrial relations system, with the aim of keeping the industry wage increases in check to aid export competitiveness, also sets a uniform level wage that limits low-paid jobs. It is also found that low pay in the Swedish setting is partly a result of working less than full-time or having unstable employment, and service workers and those with low education are becoming increasingly common in this position.
Introduction
The Swedish labor market is often considered to be a prime example of the Nordic model, where social partners, without government involvement, decide the wages through collective agreements, resulting in high wage increases and a compressed wage structure. Looking at the general wage development, this model seems to function well. For example, Swedish real wages increased by an average of 2.1% yearly throughout the 2000s and 1.4% during the 2010s, compared to increases of 0.24% and 0.42%, respectively, in the Eurozone (Leering, 2022; Swedish National Mediation Office, 2022). However, since the Swedish labor market model does not include any statutory minimum wages and no clear definitions of low-paid employment exist in the Swedish public discourse, the prevalence of the phenomenon is unclear. Moreover, several factors point in the direction of an increase of low-paid employment in Sweden, including the driving force of technological changes, decreasing unionization and institutional changes such as subsidies to jobs in the low-paid sector.
The purpose of this article is to develop and test four definitions of low-paid employment to study changes in the prevalence for the period 2005–2020. We also investigate changes in the distribution of different social categories in the low-paid group.
The remainder of the article is structured as follows. We start by discussing factors that may counteract or reinforce an increase of low-paid employment in Sweden. This is followed by a section on previous research that has focused on drivers of changes in earnings and wage composition in the labor market. We then propose four different definitions of measuring low payment, followed by a method section, where we present the datasets used and the methodological consequences of each of the definitions. Then the empirical results are presented, and the article ends with a concluding discussion.
Counteracting and reinforcing factors on the expansion of low-paid employment in Sweden
Several factors in the Swedish case could have led both to a decrease and an expansion of low-paid employment. Firstly, there are factors related to technological change that could either push out low-paid occupations from the labor market or increase the demand for those jobs. Secondly, political priorities and institutional changes in the Swedish labor market model could also affect the potential demand for low-paid employment. Below, we briefly discuss factors that could either counteract or reinforce low-paid employment in Sweden.
Counteracting factors
Until recently, the impact of technological changes on occupational structure has been regarded as having an upgrading effect on jobs and occupations (Katz and Murphy, 1992). Upgrading refers to changes in the occupational structure where mainly jobs with high qualification requirements, and usually high wages, are growing in numbers, while jobs with low requirements are less demanded in the labor market. This tendency has been visible in many Western economies, including the Swedish one. However, it is not particularly clear why technology would have this effect on the occupational structure, and the mechanism is sometimes described as more or less a black box (Spitz-Oener, 2006). Some researchers have proposed that the cause is found in educational expansions rather than in the technology per se; that is, it is the supply of well-educated employees that moves technological progress forward and further increases the demand for the well-educated (Acemoglu, 2002). Thus, the effect of technological advancements, in combination with educational expansion, is believed to reduce the number of low-paid jobs over time. However, a side-effect is that people who do not have the right educational requirements risk structural unemployment. Consequently, this development could increase income inequality when some find reduced possibilities for wage incomes from the labor market. Still, the main trend of the labor market is fewer low-paid positions and the expansion of highly qualified jobs.
In the Swedish context, the above technological factor has interacted with the so-called Solidaristic Wage Policy (SWP), which was mainly in operation between the 1950s and the 1980s and aimed for ‘equal wage for equal work’. This led to wage equalization between industries and sectors, but wage differences between occupations were preserved. Consequently, the SWP squeezed low-productive sectors of the economy as low wage flexibility decreased those companies’ profits and investment capacities, while high-productive firms benefited as wage equalization decreased potential wage costs (Erixon, 2010). As a consequence, the SWP aided an upgrading of the occupational structure and gave less room for the expansion of a low-paid sector in the economy.
Several authors (e.g., Baccaro and Howell, 2017) have argued that SWP and its central cornerstone of central bargaining was dissolved during the 1990s. In 1997, however, a new model of negotiations – the Industrial Agreement (IA) – was launched by employers and unions within manufacturing and export industries. The IA wanted to set a benchmark for general wage increases in the labor market. This has largely become a reality, with the Swedish Trade Union Confederation (LO) coordinating wage demands of the different industry-level unions with the IA as a benchmark, while the state has enforced the wage-setting regime through the introduction of the Swedish National Mediation Office. Overall, the IA seems to counteract increasing wage inequalities between jobs. For example, Marginson and Dølvik (2020) showed that wage differences have not increased in Sweden since 2000, but have remained relatively stable (see also Berglund and Esser, 2014).
Overall, the continued technological advancements, combined with the wage-setting regime of the IA, which seems to retain some solidaristic features (coordination and counteracted wage inequality), lead us to conclude that fundamental mechanisms that counteract the expansion of low-paid employment are still present, leading to an upgrading of the labor market.
Reinforcing factors
Recently, however, research on the labor market effects of technological change has contradicted the conclusions of an ongoing upgrading. According to influential research, the introduction of digital devices in production replaces jobs with standardized and routine work tasks, such as assemblers and different clerical positions (Autor et al., 2003; Goos and Manning, 2007). On the other hand, the digital technology does not (yet) replace non-routine jobs. Several of those jobs require high skills, problem-solving ability and creativity, and include occupations such as technicians, managers and other professionals. Moreover, the digital technology even augments high-skilled workers’ productivity and increases their demand. Beside high-level occupations, however, several non-routine jobs are rather low-skilled and often found in services, such as child care workers and personnel in hotels and restaurants. These jobs are not replaced and do not gain augmented productivity through digital technology, while they are affected by general demand for those services in the economy (Autor, 2015). Thus, the effects of these mechanisms are a declining middle of rather well-paid routine jobs, an increase of high-qualified jobs, and a relative increase of low-paid manual and service sector jobs; this pattern has been termed labor market polarization (Goos and Manning, 2007). Empirically, polarization has been found in the United States (Autor et al., 2006) and several European countries (Fernández-Macías, 2012). In the Swedish case, several researchers have also detected polarization (Åberg, 2015; Adermon and Gustavsson, 2015), although others have disputed it (Oesch and Piccitto, 2019; Tåhlin, 2019).
However, the routine-biased technological change theory (RBTC) described above is not particularly clear regarding why employment in low-paid service sector jobs should increase besides in a relative sense (due to a declining middle). Those jobs are generally exposed to the so-called Baumol’s cost disease (Baumol, 1967), which implies limited growth due to low productivity as long as wages in those jobs follow general wage increases; for example, the IA benchmark. One possible explanation for the expansion is growing inequality, which increases the consumption of those services by the expanding high-skilled categories (Mazzolari and Ragusa, 2013). As discussed above, however, wage inequality seems to have not increased in Sweden. Nevertheless, general income inequality has increased during the period, and there are alternative ways of increased consumption, such as by expanding private lending due to low interest rates (Erixon and Pontusson, 2022).
Beside increased inequality, governmental policies may also affect the size of the low-paid sector. Since the banking crisis in the 1990s, a priority for Swedish governments has been to decrease unemployment, which has been stuck on a much higher level than before the crisis. However, after tying themselves to a finance policy regime of cutting public debt, the previous way of decreasing unemployment by expanding public employment was closed (Berglund and Esser, 2014). Instead, governments have tried to expand low-skilled and low-paid jobs. This aim was particularly distinct in the politics of the center-right coalition that were in power between 2006 and 2014. We have identified three different types of reforms that could have increased the low-paid sector.
Firstly, the center-right government implemented several changes that could subsidize jobs in the low-paid sector in different ways. In 2007, a tax deduction called RUT was implemented with the purpose of making it cheaper to buy household services, such as cleaning, and in 2012 the VAT for restaurants was reduced from 24 to 12%. Moreover, a cut in the pay-roll tax when employing people aged between 19 and 25 was introduced in 2007, though removed in 2015 by the newly elected Social Democratic government.
Secondly, the center-right government introduced several reforms that may have indirectly affected the wage level of employees, especially among categories with a high risk of unemployment. In 2007 there was a large change to the Swedish Ghent system of unemployment insurance (Lindellee and Berglund, 2022). Among other things, the government decided that the fund fees should be connected to the unemployment level of the specific insurance fund, meaning higher fees in branches with higher unemployment. The purpose was to put pressure on the unions to temper their wage demands as overly high demands would risk increasing unemployment within their branch, and thereby the fees to the fund (Kjellberg, 2009). After the introduction, the fees were raised dramatically – for some workers, they were six times higher than before. This was done in combination with stricter qualification requirements (Bengtsson and Berglund, 2012; Lindellee and Berglund, 2022), with the aim of lowering the reservation wage of the unemployed. As a result, many workers left both the insurance funds and unions altogether. Since then, the fees have been lowered and the differentiation between branches more or less been taken away, but membership in unemployment funds and unions has not recovered. These changes are of interest as there is empirical evidence that higher union membership levels increase wages (Addison et al., 2023) and that drops in unemployment insurance membership are related to wage decreases (von Buxhoeveden, 2019).
Another change that may indirectly affect the size of the low-wage group was a general tax reduction on labor that was introduced in 2007. It was presumed that the after-tax income increases would make employees accept lower wage increases over a short and medium timespan than without the reform. A further reason was to increase the income difference between unemployed and employed persons. With greater differences, the incentives to accept jobs with lower wages were expected to increase.
Thirdly, several changes in the employment protection legislation (EPL) may have had implications for low-paid employment. Since 1996, EPL concerning temporary employment has gone through several deregulations. The biggest change happened in 2007 when a new form of temporary contract, the General Temporary Employment (GTE), was introduced. During the 1990s, the share of temporary employees increased from constituting around 10% of employees in 1992 to 15% in 2000. Since then, the share has fluctuated between 15 and 17%. Moreover, it led to a strong increase of the group with the highest level of precarity: the on-demand employees who work by the hour (Alfonsson, 2020).
In sum, several factors seem to reinforce the growth of low-paid employment. Firstly, the theory of RBTC predicts that low-skilled non-routine jobs are not replaced by digital technological change and may even increase due to increased inequality. In the Swedish case, these tendencies may be hampered due to strong unions and coordinated bargaining both keeping down high wages and compressing the wage formation, thus reducing wage inequalities. On the other hand, since the 1990s crisis, governments have been preoccupied with reducing unemployment by creating conditions for the expansion of ‘simple jobs’. These include subsidies, increasing the economic consequences of unemployment, and decreasing job security. All these factors point in the direction of an expansion of low-paid employment.
Low-paid employment in previous research
There is no consensus on how low-paid employment in the economy has developed. Part of this disagreement is explained by the variation in definitions of low-paid employment and low-wage jobs that can be found in the previous research. One definition, used by Åberg (2015), focuses on the median full-time wage that a job renders. This definition focuses on occupations and not on the individuals’ actual wage earnings. Åberg’s analyses show a clear increase of the lowest-paid quintile of occupations during the period 2008–2012. Using a similar definition, Heyman (2016) found clear polarization with growth at both ends of the occupational distribution for the period 1996–2013. A study by Berglund et al. (2020) for the period 2000–2015, which operationalized the occupational wage structure similarly, found that the lowest-paid quintile neither grew nor decreased. Adermon and Gustavsson (2015) found growth in both high- and low-wage jobs for the period 1975–2005, but found weaker support for low-wage growth when looking specifically at the period 1990–2005. Oesch and Piccitto (2019) found an unequivocal upgrading for the period 1997–2015, with decreases in low-paid jobs and increases in the number of employed in high-paid occupations.
Several studies have used average or median full-time wages for a job or occupation to define the job structure. However, a weakness of this method is that the actual earnings of individuals working in specific occupations are not reflected in these definitions, which also is a function of working hours and the stability of the job. As discussed above, Sweden has seen great changes in EPL, which has increased the number of precarious workers with few working hours. When focusing on full-time wages to define the job structure, this aspect is lost. Thus, temporary or part-time work affects workers’ total earnings of paid work and needs to be considered when trying to measure the incidence of low-paid employment in Sweden.
In the recent EU directive on minimum wages, two arguments are crucial (EU Directive, 2022). The wage should be fair in relation to the wage distribution, but also provide a decent standard of living. Decent wage earnings have also been called ‘living wages’ (Alsos et al., 2019; Hirsh and Valadez-Martinez, 2017; Hurley et al., 2018). The first criterion reflects the relation towards other wages, while the second relates to the living standard. The directive states that wages should be at least 60% of the median wage or 50% of the average wage in order to meet both of these criteria. Ilsøe (2016) suggested that instead of focusing on living wages and full-time wages, we should concentrate on ‘living hours’, with the purpose of capturing the combination of hourly wages and working hours.
To our knowledge, no studies of the development of low-paid employment (defined as receiving 60% or less than the median wage) that also take working hours into account have been conducted in Sweden. Hällberg and Kjellström (2020) calculated the share of employees below 60% of the average median wage to be 0.9% in 2018, but this is based on full-time equivalents only. A recent study (Broström and Jansson, 2023) examined the concept of ‘in-work poor’, defined as individuals who work at least seven months a year but have a household income below 60% of the median income. That study found that, in the late 1980s, 1.4% of the working population (those earning at least 60% of their income from wages) fell into this category. This figure declined to 0.7% in the early 1990s before gradually rising back to 1.4% in 2016 (Broström and Jansson, 2023).
Four definitions of low-paid employment
The purpose of the current study is to track the prevalence and change in low-paid employment on the Swedish labor market. However, the previous overview shows that various definitions may result in very different pictures. Using the previous research as a starting point, it is possible to develop definitions that also are sensitive to institutional and policy changes over time. Firstly, we differentiate between wages and earnings, where the former refer to standard full-time wages, while the latter refer to actual payments (that is, wages) but also take into account variation in working hours and periods of unemployment over a distinct period (such as a year). Pay or low-paid position is used as a general term, when the difference in distinctions of wages and earnings is not in focus. Secondly, we differentiate between the occupational and the individual level of analyses. Thus, the full-time criteria mainly relate to the outcome of the Swedish negotiating system, while relaxing these criteria by focusing on earnings also takes into account other institutional changes over time, such as increases in temporary employment. The distinction between occupations and individuals makes it possible to use two different lenses on the prevalence of the phenomenon; that is, the numbers found in jobs that can be classified as low-paid, or the number of individuals across jobs that are in a low-paid position, taking within-jobs variation into account. These distinctions hopefully provide a more comprehensive understanding of the changes of the phenomenon over time. Definitions 1a and 1b will focus on the occupation, while Definitions 2a and 2b on the individual.
Definition 1a takes its starting point in wages (full-time wages) of different occupations (Autor et al., 2006; Goos and Manning, 2007). Depending on the average wage, occupations are divided into five different groups (quintiles), where the first includes occupations with the lowest wages and the fifth group has occupations with the highest wages. Thus, the low-wage group is defined as individuals working in occupations in the first quintile. We then follow the development of the quintiles over time. Definition 1b follows the same logic as 1a, but focuses on earnings in occupations and not on full-time wages. As discussed above, the earnings for many employees often fall short of a full-time monthly wage due to part-time work and unstable temporary employment (Schulten and Müller, 2019). This definition shows whether these tendencies also translate into the occupational structure; that is, if some occupations are more exposed to earnings that generally do not reach the full-time earning potential.
Since individuals can have several different jobs, or irregular weekly or monthly schedules, there are good reasons to also investigate the individual’s earnings on a yearly basis. Definitions 2a and 2b both focus on individuals’ yearly earnings, but the criteria for being in a low-paid position differ. For Definition 2a, the criterion for being in a low-paid position is 60% of the yearly median wages, based on full-time work (35–45 hours a week). Definition 2b is 60% of the yearly median earnings; that is, full- or part-time, or having been unemployed parts of the year. The contrast can be used to discern the relevance of the ‘living hours’ argument (cf. Ilsøe, 2016). On the one hand, 2b will lower the threshold of being outside the low-paid group; on the other, it can be argued to show an intentionally reduced low-paid sector if the full-time criterion is a more valid way of defining the threshold.
Method
This article focuses on measuring low-wage occupations and low-paid individuals, with the distribution of the latter group by the following social categories: gender, age, level of education, country or region of birth (divided into Sweden, the EU-28 region, Europe outside of the EU, outside of Europe), working time, employment position, socio-economic position (based on SEI), union membership (LO being the main trade union confederation for blue-collar workers, TCO for professionals, and SACO, professionals with a university degree) and sector of employment. The article is limited to measuring wage income only, as we are primarily interested in the occurrence of low wages and low-paid employment in the labor market. As a result, other sources of income, such as pensions and paternal leave benefits, are outside the scope of this article.
We use two different data sources to be able to construct these indicators. The first is the Swedish Labor Force Survey (LFS) for the period 2005–2020. These data are used to infer overall changes on the Swedish labor market. Moreover, the LFS includes detailed information about employed persons’ labor market situation, such as the type of contract and working time. Secondly, we use register data from the Longitudinal Integrated Database for Health Insurance and Labor Market Studies (LISA) for information on individuals’ incomes, and their type of earnings (wage incomes, pensions, etc.). Generally, we are interested in individuals’ earnings during the year, unlike other datasets where only monthly or hourly wage are presented, and based on a single measurement during the year that will not capture changes in working hours or employment. The LFS does not include non-residents, a group that is likely to be overrepresented among low-paid employees. Ultimately, we decided that the possibility to measure full and actual yearly wages outweighs this limitation, but the risk of underreporting the share of low-paid employees will be discussed. All analyses are based on weighted LFS data, weighting observations to population parameters, and adjusting for underrepresented categories as well as dependence between observations.
LFS and LISA data are not fully compatible and are therefore not easy to merge. In the LFS, every individual is measured eight times in subsequent yearly quarters (that is, panels of nearly two years). Those panels have a rotating system with one-eighth of the panel replaced each quarter, which means that an individual can start or be replaced in the middle of a year (that is, for some years, an individual is not measured for all quarters). Moreover, the same individual can be included in up to three different years (that is, starting in the last quarter of Year t, and for the last time included in Quarter 3, Year t+2). However, the LISA data relate to yearly figures, which cannot be broken down into months or quarters. Generally, we base our estimation of incomes (from LISA) on yearly panels in the LFS which we can follow over four subsequent quarters. Of course, this is not a perfect way of solving the different time-frames of the data sources, as we discuss further below.
Operationalization 1a: Occupational quintiles based on full-time wages
The first operationalization of low-paid employment focuses on full-time average wages and ranks employment in occupational categories from the lowest to the highest paid (see, e.g., Åberg, 2015; Berglund et al., 2020). In a second step, the ranking is divided into quintiles (that is, fifths) for the first year in a time series. The occupations included in each quintile are held constant over time, which makes it possible to recalculate the number employed in each quintile (of the first year) for later years in the series. Moreover, this method of conducting the analysis is reasonable assuming that the rankings of occupations are stable over time, which seems to be the case (see Berglund et al., 2020). ISCO-08 on the three-digit level is used in the present analysis for the period 2011–2020, as previous periods are not available due to a change in Swedish classification of occupations.
To estimate full-time wages, LISA data were merged into LFS data, restricted to only those individuals that in the LFS were defined as full-time employed (between 35 and 45 hours of usual working time a week) over four subsequent quarters. The mean full-time wage per occupation (on the three-digit level) was then calculated and ranked from the lowest to the occupation with the highest wage. This was done separately per year from 2011 to 2018 (currently the last year with full LISA data). We then continued by calculating the mean ranking of the occupations from 2011 to 2018. In a final step, this mean ranking was imputed to the LFS data before we calculated the quintiles for 2011.
Operationalization 1b: Occupational quintiles based on earnings
The second way of defining the wage ranking was to relax the full-time and the full-year of employment criteria, instead including everyone that at least at one occasion during the year had been measured to have an occupation. Consequently, we used the full sample (weighted) for the estimations. The full-year wage-incomes were then used to rank the occupations. The implication of this definition is that the individual’s wages are dependent on how stable employment is and how many working hours the individual is able to achieve during a year.
Operationalization 2a: Individual’s earnings less than 60% of median full-time wage
The second pair of definitions focuses on the individual’s earnings over the year. For 2a, a low-paid position is defined as having earnings less than 60% of the median wage (that is, full-time) of a given year, which is a commonly used definition in international research for low wage.
Operationalization 2b: Individual’s earnings less than 60% of median earnings
Here, the cut-off point is based on earnings; that is, based on all working hours. This way, we expect the cut-off point for low-paid positions to be at a lower median value, with a lower share being in a low-paid position compared to 2a.
Empirical findings
Development of the Swedish earnings structure
The overall Swedish earnings structure is described in Figure 1, which shows the median annual earnings of all individuals with yearly earnings above zero SEK and divided into earning-deciles; for example, Decile 1 shows the median yearly wage earnings of the lowest tenth. Since 2005, general wage earnings have increased in Sweden. With prices adjusted for inflation the annual earnings for the lowest-earning decile (1) have increased from 7000 to 12,000 SEK, while they have increased from 554,700 to 712,400 SEK for the highest-earning decile (10). The four lowest deciles have increased their wage earnings by 71, 61, 49 and 43%, respectively, while the other deciles have increased by on average 30–35%. Still, comparing Deciles 1 and 2 with Decile 10 shows that median earnings are 70 and 60 times higher in the highest earning group. Decile 10 has also been calculated with the mean, resulting in even higher earnings due to outliers. The pattern over time is similar to the median calculation, but takes the very highest earners into account. For the other deciles, the difference between mean and median is negligible. The general pattern over time shows little change in the earnings structure.
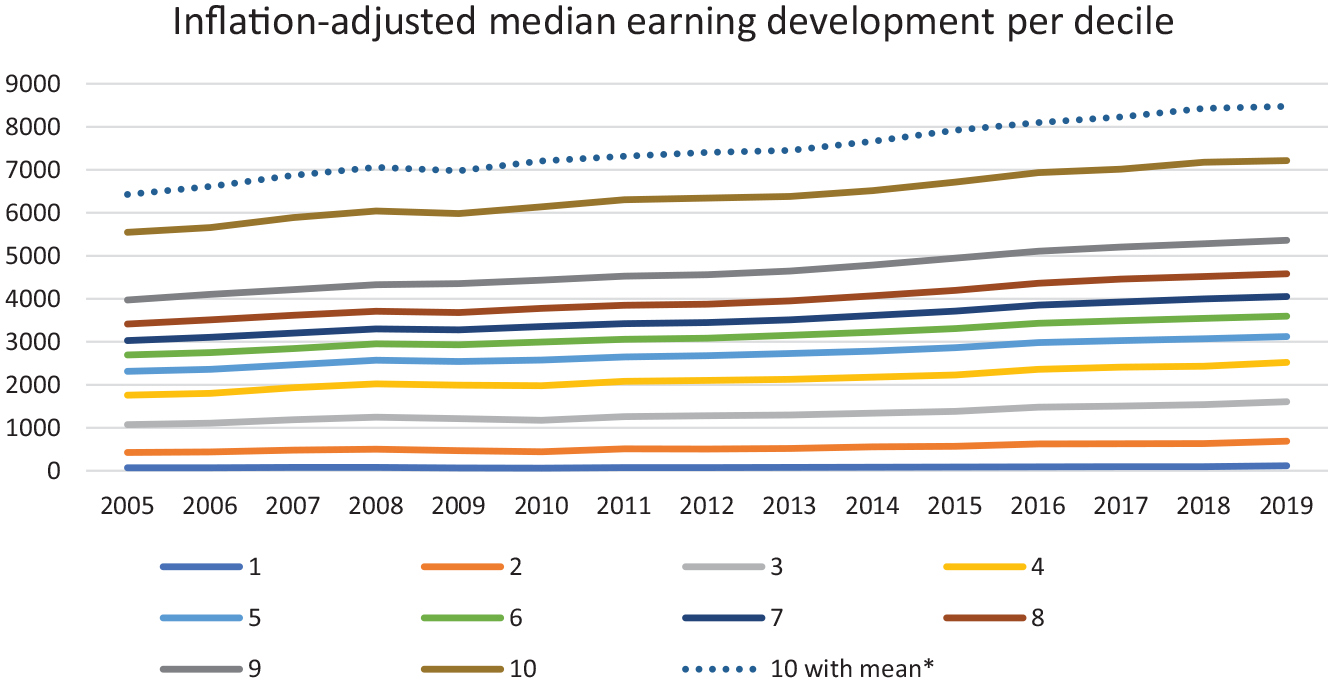
The diagram shows the earnings structure divided into deciles, 2005–2019. The vertical axis expresses yearly median earnings for each decile in steps of 100 SEK, adjusted for inflation. Everyone in the LFS that had earnings during the year is included. Weighted LFS data.
Definition 1a: Wage quintiles defined by full-time wages
In Figure 2 the first definition of wage quintiles is shown for the period 2011–2020. The x axis represents the five wage quintiles (Q). In 2011, the mean monthly wage (on occupational level) in Q1 was estimated to be approximately 20,000 SEK, 27,000 SEK in Q3, and 43,000 SEK in Q5. The bars indicate percentage change of the number of employed within quintiles between the year in focus and the first year (2011). As several studies have shown, the numbers employed in the higher paid occupational quintiles increase strongly (cf. Oesch and Piccitto, 2019).
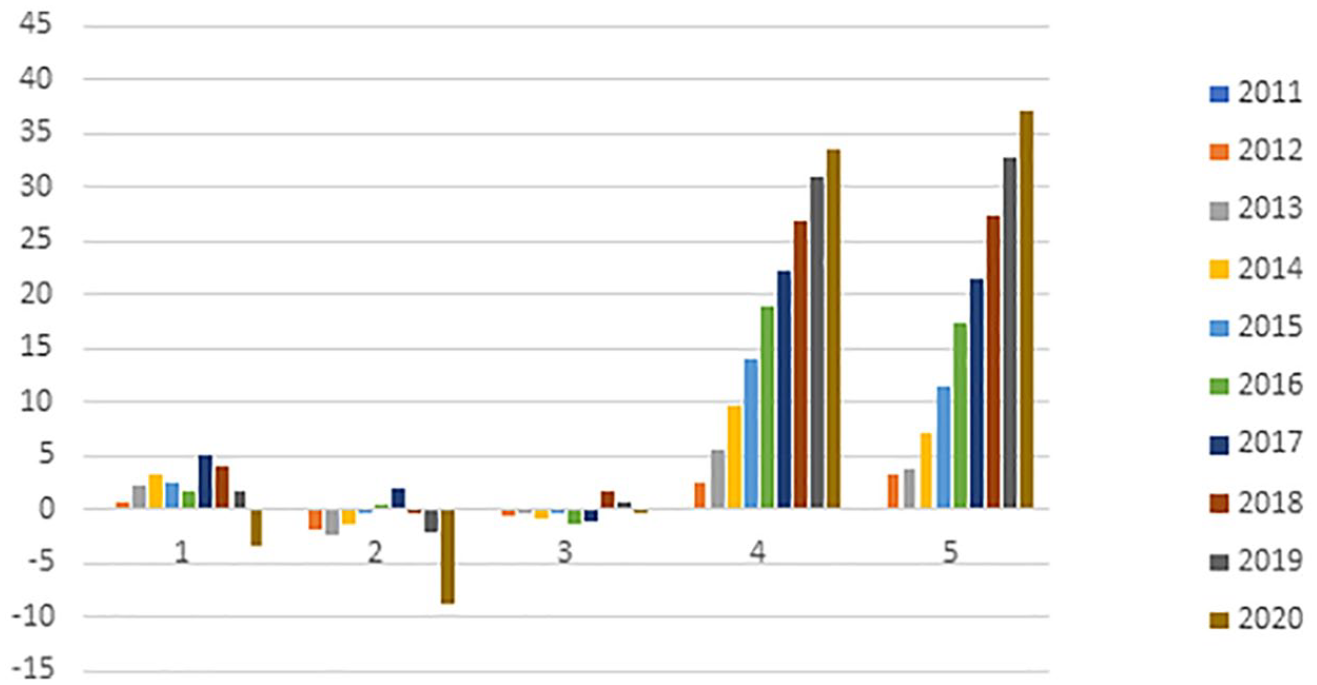
Occupational wage structure, 2011–2020. Percentage change of quintiles compared to first year. Weighted LFS data.
The number of employed in the lowest-paid occupational quintile increased somewhat over the time period. In 2017, the increase reached over 5%, although in the years after the numbers dropped, and increasingly so in 2020 (–3.4%).
The largest occupational categories in the lowest-paid quintile are ISCO 532: Personal Care Workers in Health Services, who in 2011 constituted about 42%; ISCO 531: Child Care Workers and Teachers’ Aide (9%); and ISCO 911: Domestic, Hotel and Office Cleaners and Helpers (9%). Both personal care workers and cleaners decreased slightly in number comparing 2011 with the peak year 2017 of Q1, and with an intensified decline between 2017 and 2020 (–6.5 and −12%). However, the child care workers increased in numbers until 2017 (25%) but declined −7% into the pandemic (2020).
Besides the increase of child care workers until 2017, other categories increased as well. The largest are found in ISCO 342: Sports and Fitness Workers, with an increase of 69% 2011–2017, and among ISCO 513: Waiters and Bartenders (31%) and ISCO 512: Cooks (18%). However, the latter two categories were hit hard by the pandemic and decreased between 2017 and 2020 by 33% and 18%, respectively, while fitness workers declined by 7%.
The mean earnings for individuals within the quintiles – that is, the mean earnings from wages of everyone with earnings above 0 in 2011 – were 16,400 SEK per month in Quintile 1, 24,500 in Quintile 3 and 41,700 in Quintile 5. These figures deviate significantly from the full-time mean on occupational level. In particular, the mean level deviates greatly for individuals in the lowest-paid quintile, where the actual level is only 82% of the full-time mean level, while it is 97% in Quintile 5. This deviation depends, among other things, on how many working hours a year are typical within an occupation; this is the focus of the next section.
Definition 1b: Occupational quintiles based on earnings
The change of the quintiles based on Definition 1b is presented in Figure 3. The mean monthly earnings on occupational level for 2011 are now 13,900 SEK in Q1, 23,300 SEK in Q3 and 40,700 SEK in Q5. For Q1, with no restriction on full-time employment, the mean earnings are only 70% of full-time wages, compared to 86% for Q3 and 95% for Q5. Moreover, if we compare occupational earnings differences between Q5 and Q1, the ratio is 2.9, but only 2.2 if restricted to full-time wages. If we instead focus on the mean earnings in 2011 for individuals within the quintiles – that is, the mean earnings of all individuals with earnings above 0 SEK – it was 16,000 SEK per month in Q1, 24,200 in Q3 and 41,300 in Q5.
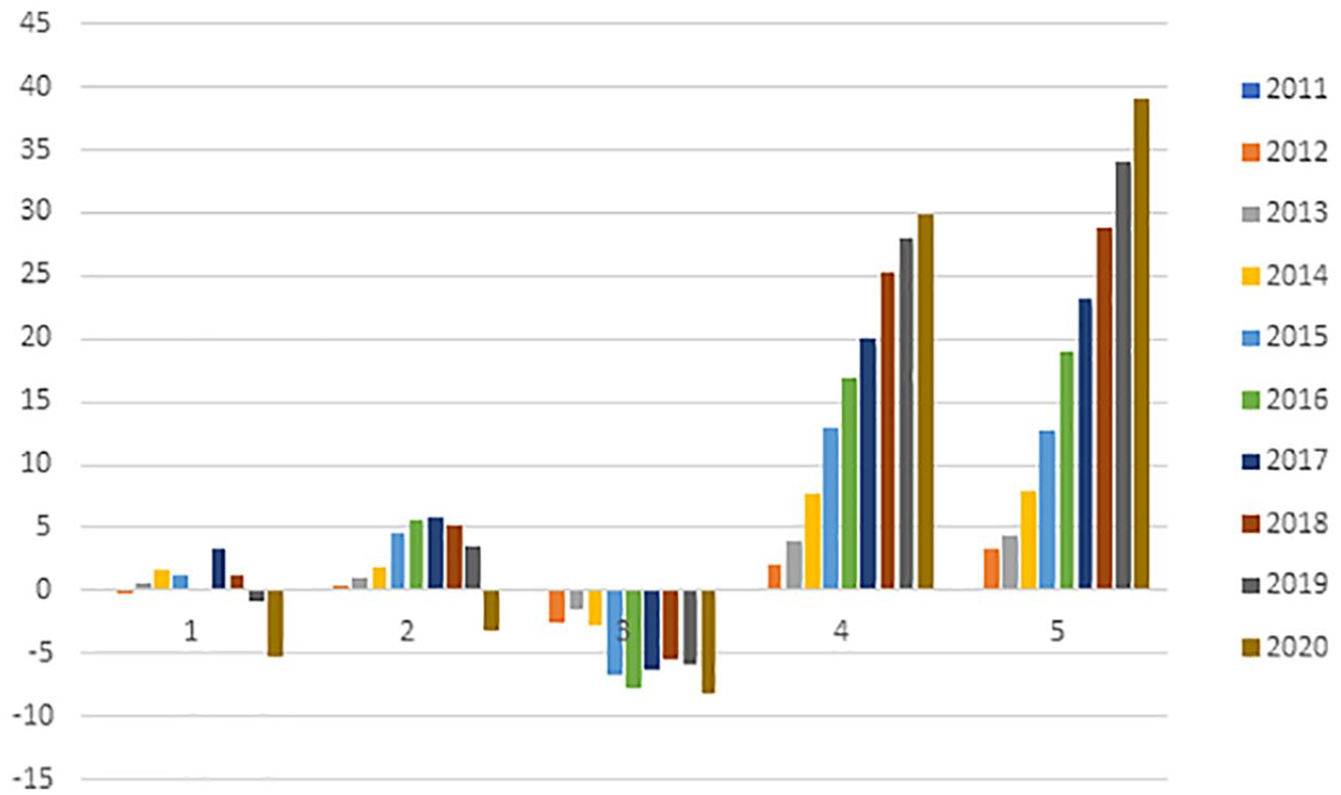
Occupational earnings structure, 2011–2020. Percentage change of quintiles compared to first year.
The patterns of change between 2011 and 2020 resemble those of Definition 1a, although the decline has now moved up to Quintile 3, and a rather strong increase of the number of employed in Quintile 2 takes place. This pattern indicates that average earning jobs seem to decline, while jobs that imply lower earnings (due to fewer hours) have increased.
Similar to the analysis of the first definition, the largest occupational category in Q1 in 2011 is ISCO 532: Personal Care Workers in Health Services (constituting 38%), followed by ISCO 531: Child Care Workers and Teachers’ Aide and ISCO 911: Domestic, Hotel and Office Cleaners and Helpers (8% each).
Distribution of social categories in the lowest-paid quintile of Definitions 1a and 1b
Table 1 shows the distributions of social categories within low-paid employment presented according to the different definitions, as well as at two time-points (at the beginning of the series and just before the pandemic). Overall, the analysis shows that females, young people, people with lower education and people born outside Europe are overrepresented within the categories of low-paid employment, independently of the definitions. Moreover, workers in part-time work as well as with temporary employment are also clearly overrepresented. This picture obviously becomes clearer with Definition 1b of low-paid work, when mean earnings within occupations are allowed to vary with yearly working hours. The socio-economic position of the low-paid employed is strongly dominated by service workers. They are also often members of LO unions, or not unionized at all.
Distribution within the lowest-paid occupational wage quintile (Q1). LFS, weighted data.
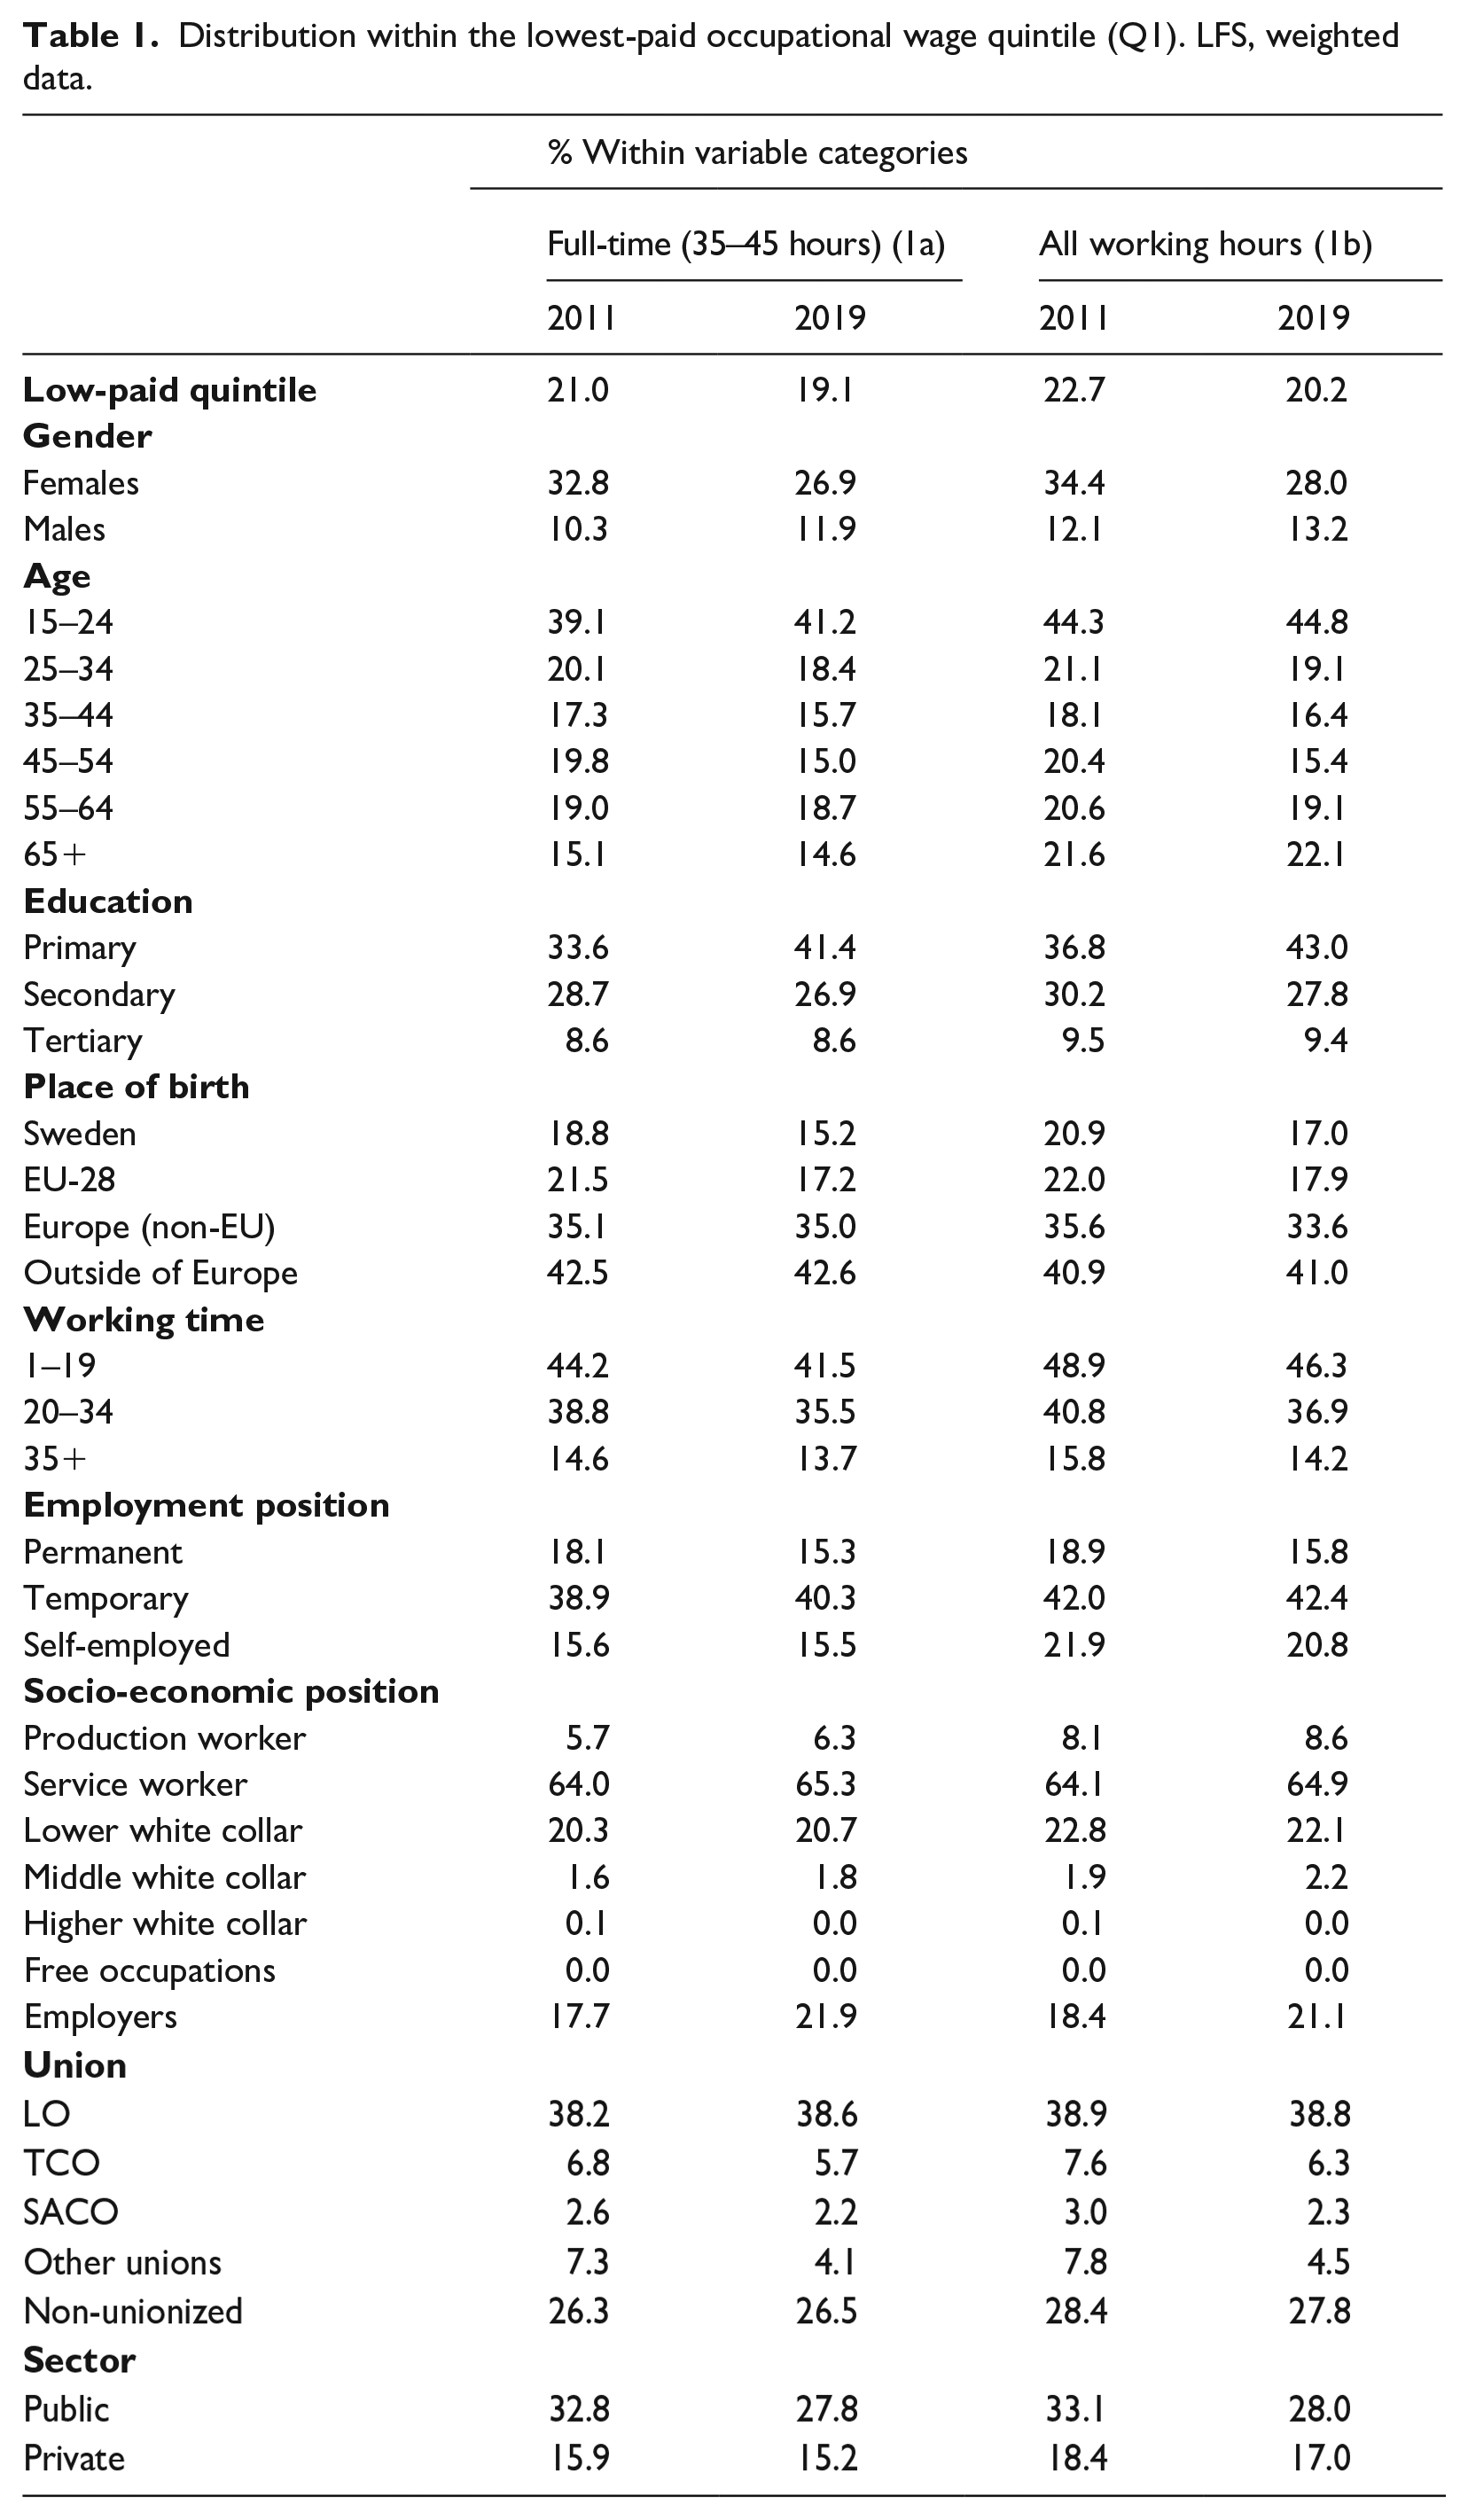
Comparing changes over time, the clearest patterns are that the share of females and public employees in a low-paid position are declining, although they still constitute the greater share within each group.
Overall, the two definitions of low-paid employment do not reveal large differences regarding the categories working in these kinds of jobs. The largest difference relates to the above-mentioned working-time variable and in relation to the youngest age group, whereas Definition 1b shows a larger share within the category. The reason for these overlaps between definitions is revealed when the two definitions are cross-tabulated in Table 2, which shows that 96% of people defined as working in Quintile 1 of Definition 1b (wages not restricted to full-time) are found in Q1 of Definition 1a (full-time restriction). Consequently, Q1 overlaps with the same occupations and people to a very high degree. Following the quintiles higher up, the largest variation between the two definitions is found in Q3 with only a 52% overlap. In Q5, however, the overlap is again very high (93.5%).
Cross-tabulation of Definitions 1a and 1b. Percent. LFS, weighted data.
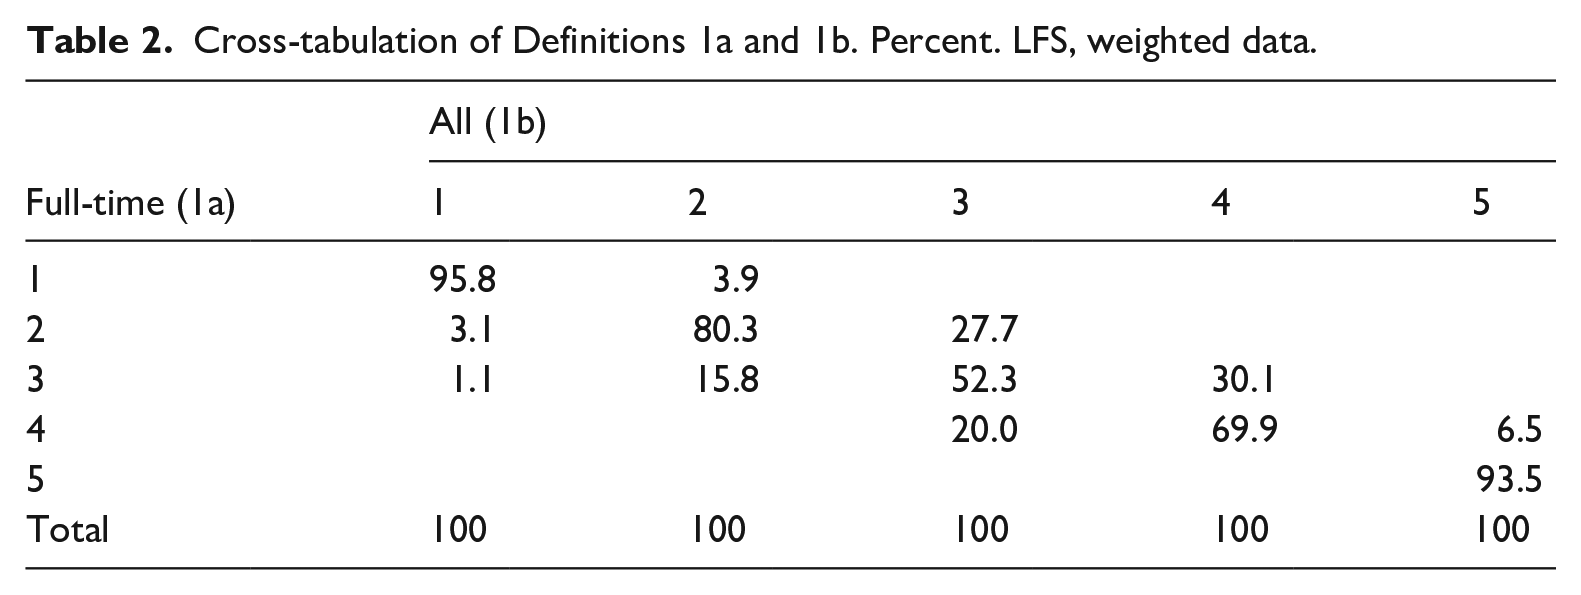
All in all, this analysis indicates that the lowest-paid quintile occupations include both the lowest full-time wages and the lowest total yearly working time, which push down the possible earnings within the quintile. On the opposite end, the highest-paid quintile occupations indicate both the highest wages and stable full-time jobs. Consequently, differences in earnings between the highest- and the lowest-paid quintile are not so much caused by people not working full-time jobs, but by these kinds of occupations not offering stable full-time possibilities.
Definitions 2a and 2b: Individual low-paid position based on 60% of full-time median wage earnings (2a) or 60% of median wage earnings (2b)
Figure 4 presents the share of employees in a low-paid position, defined as 60% of the median yearly wage. The top line is calculated using full-time wages as the median reference and the bottom line is calculated using earnings of all working hours.
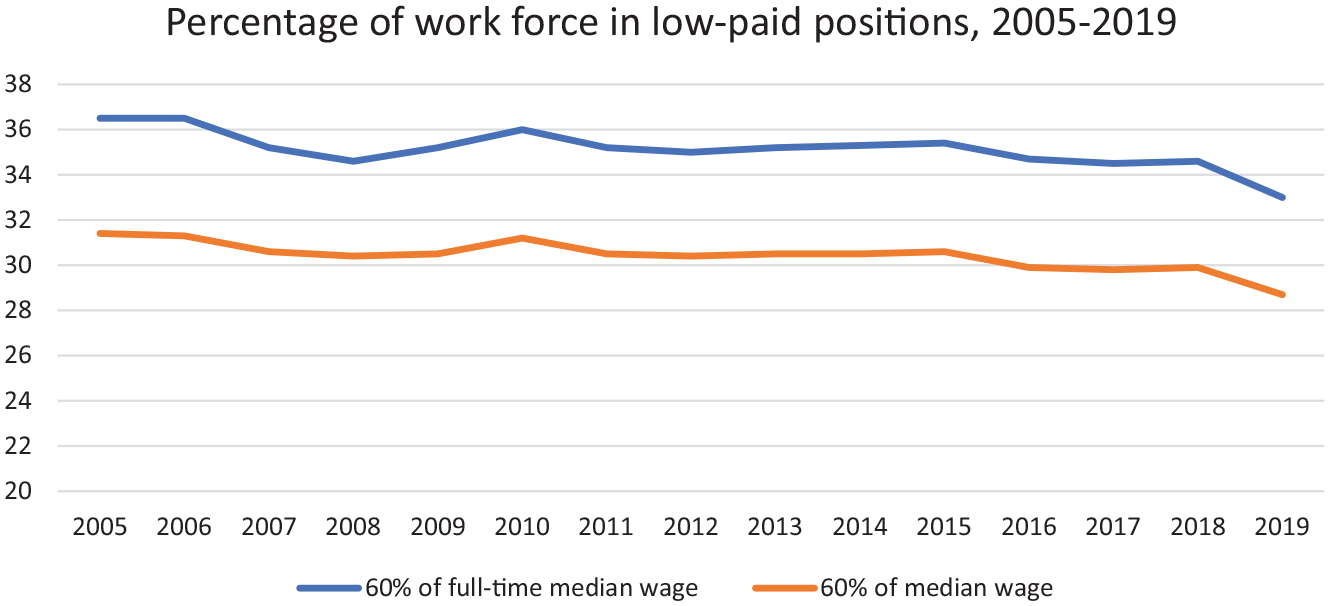
Development of the low-wage group as share of labor force, 2005–2019.
The results show 2a at 36.5% and 2b at 31.4% in 2005, and 33 and 28.7% in 2019, respectively. The general pattern is noticeably similar for both definitions, with a general decrease of about 3.5% when comparing 2005 with 2019, and a similar slight peak around 2010 and a more noticeable decrease in 2018–2019. Definition 2b results in 4–5% fewer employees in a low-paid position compared to 2a for each year. Depending on the definition, close to or more than one-third of all workers are in a low-paid position in Sweden, which illustrates that this phenomenon is far-reaching on the labor market. The general difference between 2a and 2b also shows that using the full-time criterion has a stable but noticeable effect. This could indicate the need to further engage with the ‘living hours’ (Ilsøe, 2016) argument.
Table 3 shows the distributions of social categories within low-paid employment presented according to Definitions 2a and 2b. Three time-points show the composition of low-paid positions in 2006, 2011 and 2019. Overall, the results confirm the pattern found in Table 1, with females, young people, people with lower education, those born outside Europe, part-time workers and temporary workers being overrepresented in the low-paid category. The general trend over time is that most categories show a drop in the percentage being in a low-paid position. However, those people with primary education, working 19 hours or less, in temporary employment and service workers actually increase over time. This indicates a stronger correspondence between these indicators of precarity and a low-paid position. The difference between 2a and 2b is noticeable and mostly as expected, with the difference being the lowest for those groups making up the ‘core’ of the labor market – for example, the middle-aged, middle and higher white collar and permanently employed – while a larger difference is found, but also expected, for temporary employed and part-time workers. The largest difference is found for the group working 20–34 hours, indicating that a relatively large group crosses the cut-off point into a low-paid position. Service workers and those born outside Europe also stand out, with a relatively larger share defined as low-paid when applying the full-time criterion.
Distribution of low-paid positions among employees based on yearly earnings with a cut-off point based on 60% of yearly wages (2a), and 60% of yearly earnings (2b). LFS, weighted data.
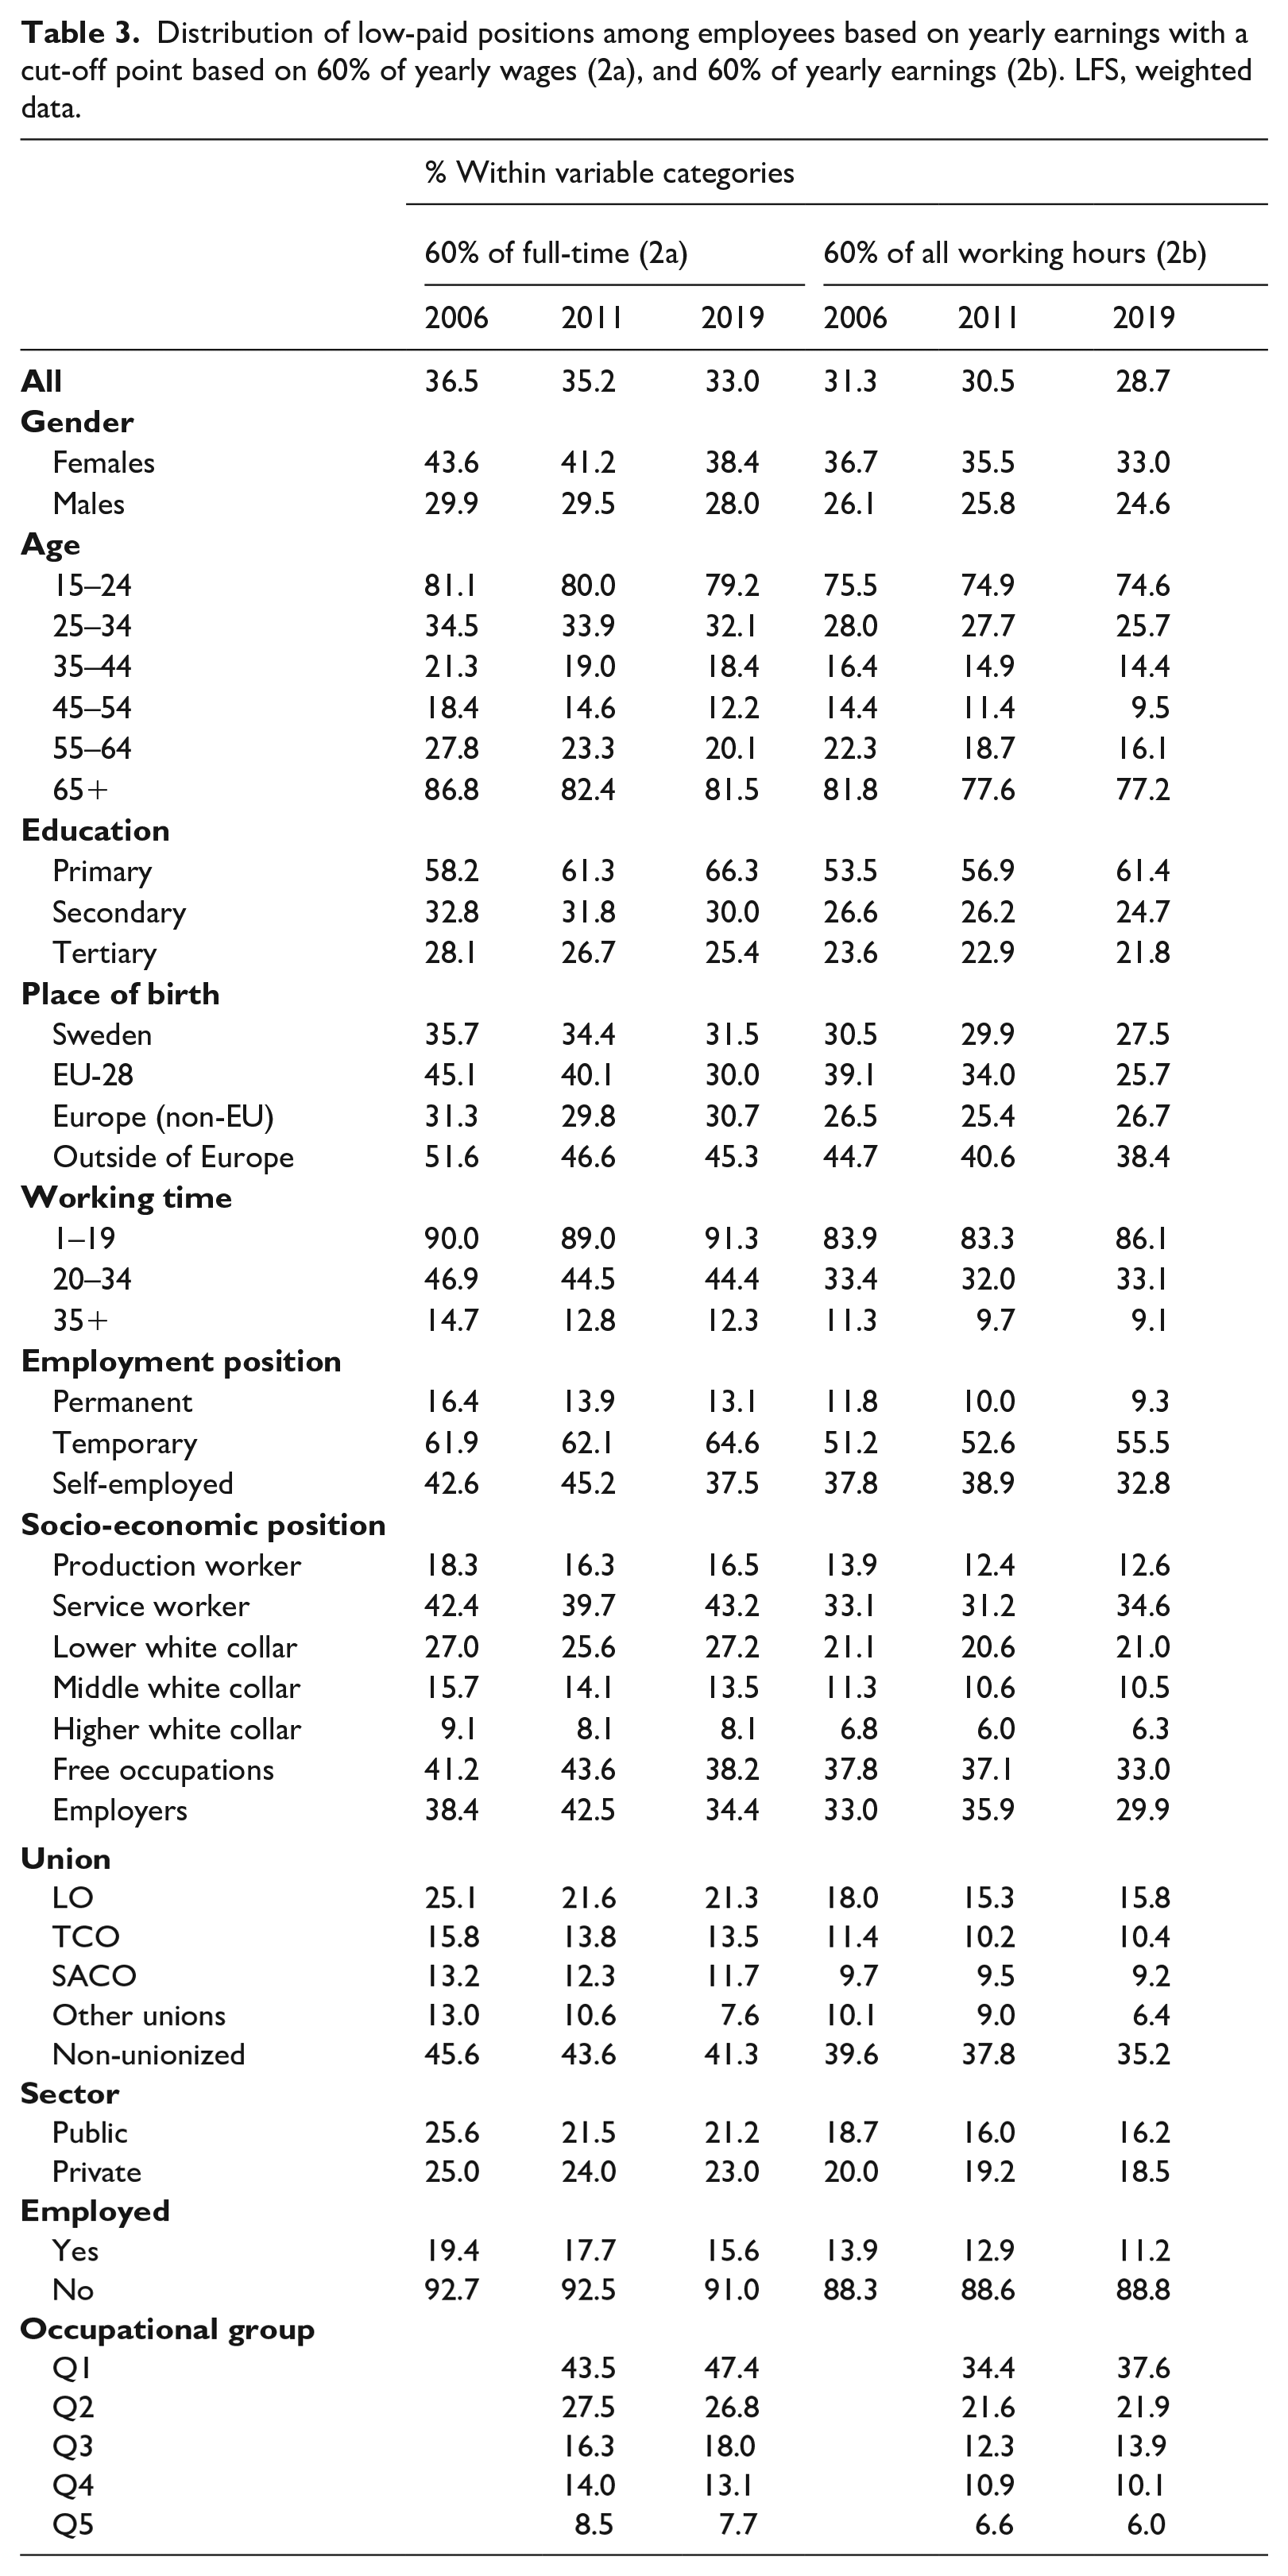
Finally, we apply the occupational quintiles used in Definition 1a. Almost half of all the individuals in Q1 are in a low-paid positions when using Definition 2a in 2019, with a falling share for the other quintiles according to their ranking. The change over time shows an increase in the low-paid group in Q1 and Q3 using the full-time criterion. The change in Q2 differs depending on the definition used. The results indicate that occupational group can act reasonably well as an expression of low-paid position, compared to the individual-based definitions.
Discussion
This article has studied how low-paid employment has developed in Sweden since 2005. The purpose was to develop complementary definitions and indicators and study how low-paid employment has developed with regard to the functioning of the Nordic model of wage setting. Sweden is a case in point, given the specific labor market and policy developments during this period that mainly point towards a growing low-paid sector. We used four different definitions to better illustrate this potential development. The two first definitions are based on an individual’s occupation, either reflecting full-time wages, or actual earnings when time in paid work is allowed to vary. The other two definitions are based on the individual’s yearly earnings, and low-paid position is defined as either below 60% of the median full-time wages, or 60% of earnings.
The different definitions show very similar developments of low-paid employment over time. The two individual-based definitions (2a and 2b) show a declining share of low-paid employees of about 3 percentage points over the whole period (2005–2019) and about 2 percentage points from 2011 to 2019. Similarly, the two occupational-based definitions (1a and 1b) show declines of about 2 percentage points for 2011–2019. However, calculating the percentage change in the number of employed within occupational quintiles, a weak growth is shown until 2017, whereafter a rather sharp decline takes place and particularly in the first year of the pandemic. For the individual-based Definitions 2a and 2b, the largest decline takes place in the last year (2019) of these time-series (about 1.5 percentage points).
The results for the occupational-based definitions until 2017 can be interpreted as support for either a weak growth of low-paid employment, which could be considered in line with the results of Åberg (2015), or that the change is so small that it should not be considered either growth or decrease, in line with the results of Berglund et al. (2020). Whether the effect of the pandemic year of 2020 will continue, which seems to indicate a stronger upgrading trend in line with the results of Oesch and Piccitto (2019), and the mechanism behind this trend, is a subject for future research.
For all definitions, we find that certain categories are overrepresented in low-paid positions. Those include females, young people, the lower educated and immigrants. They are also part-time workers, on temporary contracts, and working in services. Thus, low-paid positions in the Swedish setting are partly a result of working less than full-time or having an unstable employment. This is the main reason for the difference in our results compared to Hällberg and Kjellström (2020), who calculated the share of employees below 60% of the average median wage within all occupations to be 0.9% in 2018, while our results for individuals’ earnings being less than 60% of either median full-time wages or median earnings are 34.6 and 29.9% for 2018. Hällberg and Kjellström used full-time equivalents for calculating wages, meaning that all employees, even those working less than full-time, are recalculated as de facto full-time employees for calculating their monthly wage. Our calculations express yearly earnings, taking into account both part-time work and spells of unemployment. Roughly 40% of the employees included in the LFS work fewer than 40 hours per week, which will have an impact on the share. Thus, wages recalculated to full-time equivalents and yearly earnings express different aspects, where the first reflects the industrial relations system’s capacity to squeeze out wages below minimum standards, while the latter indicates the capacity of the labor market to offer jobs that are manageable to live on.
These results also lend support to the notion that research on low wage and wage dispersion in the Nordic setting should take into greater account the ‘living hours’ concept (cf. Ilsøe, 2016). However, it is important to notice that a rather large proportion of those in a low-paid position are still full-time employed (approximately 40% for 2a and 2b, and approximately 53% for 1a and 1b in 2019) and in permanent employment (44 and 40% for Definitions 2a and 2b, respectively, and about 62 and 59% for Definition 1a and 1b, respectively). This means that also many ‘standard employed’ are placed in the low-paid segment. As can be seen in Table 2, the occupations making up the lowest-paid quintile are almost identical, regardless of whether a full-time criterion (1a) is used or not (1b).
What methodological insights do we get from comparing the definitions? Concerning 2a and 2b, the main differences relate to the size of the low-paid segment, where the full-time criterion increases the size, and certain categories (such as females and immigrants) have a more distinct low-paid presence with the full-time criterion. The two occupation-based definitions show very similar results regarding categories occupying those positions, probably due to the very high overlap for Quintile 1 for Definitions 1a and 1b (about 96%). We conclude that occupations in the lowest-paid quintile usually imply being both among the lowest wages on the labor market and the fewest yearly hours in employment. Moreover, relating Definition 1a to the 60% of median wage criterion of 2a, a clear majority of those are working in Quintile 1 (about 40%). Consequently, the definition of 1a based on occupational full-time wages is quite a reliable indicator for a low-paid position on the Swedish labor market as well. Our individual-based definitions find several key categories that predict a low-paid position and these patterns still hold for the most part in the occupational definitions.
Even though the low-paid segment has not increased, Definitions 2a and 2b give us some valuable insights into the development over time, where service workers, temporary employees and those with primary education are more often found in a low-paid position in 2019 compared to 2005. As we suspect there are limited possibilities of advancement from these positions, as well as limited support structures (such as union membership, access to training programs, etc.), this could indicate that precarity has become a stronger characteristic of low-paid employees in Sweden.
The results of the current study indicate that the industrial relations system characterizing Sweden counteracts an increase of low-paid employment, despite tendencies that work in the other direction, including routine-biased technological change and political ambitions to increase the number of so-called simple jobs. As discussed above, the IA has great influence on the wage-setting system, with the aim of keeping the industry wage increases in check to aid export competitiveness, but also to set a uniform level for wage raises on the labor market as a whole, a system reminiscent of the Solidaristic Wage Policy (cf. Erixon, 2010). This makes wages, particularly those in the lower part of the wage distribution, hard to move downward (in a relative sense), which is often necessary for the expansion of the low-paid sector. Considering the presence of the numerous policy changes in the last decades in the direction of an increase of low-paid work, the IA seems to us to be a very strong countervailing force. In addition, much indicates that the high-paid end of the wage distribution is paid under the market value (compared to a fully liberalized labor market), which instead is transformed into increased employment. The overall effect of this system may be a general upgrading of the labor market, where low-paid employment has not been allowed to rise, even when politicians have interfered with this purpose in mind. Our overall results warrant further research that directly tests the functions and outcomes of the IA system.
A methodological limitation with regard to development of low-paid employment concerns our data. This study relies heavily on the LFS. However, the LFS is based on telephone interviews to individuals sampled from the Swedish Population Register in Sweden. In recent years the rate of drop-outs from the LFS has increased markedly (Statistics Sweden, 2019). As a consequence, some social categories (such as migrants) risk being underrepresented in the data. Statistics Sweden has sought to solve this by weighting observations. However, it is unclear whether this really solves the issue of underreporting categories that may have a higher probability of working in the low-paid segment. These groups are not likely to be captured in the LFS and could therefore decrease the prevalence of low-wage work in the statistics. Moreover, the questionnaire does not reach non-residents, and certainly does not reach workers in the grey economy, and large groups of posted workers in Sweden are not included either. Consequently, this study may underestimate the numbers in low-paid employment on the Swedish labor market. Further research should strive to address whether part of the low-paid work in the labor market has moved into the grey economy and, if so, could be studied by other means.
Footnotes
Declaration of conflicting interests
The authors declared no potential conflicts of interest with respect to the research, authorship, and/or publication of this article.
Funding
This research was funded by Forte, the Swedish Research Council for Health, Working Life and Welfare, dnr 2020-00359.