
Abstract
While citizen opinion polls reveal that Europeans are concerned about the labour market consequences of technological progress, our understanding of the actual significance of this association is still imperfect. In this article, the authors assess the relationship between robot adoption and employment in Europe. Combining industry-level data on employment by skill type with data on robot adoption and using different sets of fixed-effects techniques, the study finds that robot use is associated with an increase in aggregate employment. Contrary to some previous studies, the authors do not find evidence of robots reducing the share of low-skill workers across Europe. Since the overwhelming majority of industrial robots are used in manufacturing, the findings should not be interpreted outside of the manufacturing context. However, the results still hold when including non-manufacturing sectors and they are robust across a wide range of assumptions and econometric specifications.
Introduction
The impact of automation technologies on employment has been a highly debated topic since the beginning of the First Industrial Revolution. While previous technological advances have destroyed jobs in some sectors, job losses were usually offset by newly created jobs in other sectors in the medium to long term. This is exemplified by the well-documented shift from agriculture to manufacturing in the United States in the first half of the 20th century (Lebergott, 1966). Nonetheless, there is a concern nowadays that the ongoing technological (digital) revolution may be different – that this time automation technologies may destroy more jobs than they create. News outlets often run stories about large-scale job destruction as a consequence of increased robot use, and in a recent Eurobarometer survey, 72% of respondents agreed to the statement that ‘robots and artificial intelligence steal people’s jobs’ (European Commission, 2017). Since not all jobs are equally exposed to automation, there are additional concerns about the impact of such trends on income inequality and social cohesion (Frey and Osborne, 2017; Graetz and Michaels, 2018).
In this article, we analyse how one particular automation technology – advanced industrial robots – is related to total employment and the share of low-skill employment in Europe over the last two and a half decades. 1 Industrial robots are digitally controlled machines whose purpose is the physical manipulation of objects. In line with most recent literature on this topic, we rely on the definition of industrial robots published by the ISO (8373:2012; see ‘Data and methods’ section for more details). They are often used as a proxy for advanced automation technologies, because data on their deployment have been readily available since the early 1990s and they differ from traditional machinery in that they can handle tasks previously done by human workers, such as welding, bending and moulding.
Combining data on the use of industrial robots across different economic sectors and European Union (EU) countries with data on employment by skill type, we construct a panel to explore the relationship between the increased use of robots and changes in total employment levels or in the share of low-skill employment between the years 1995 and 2017. 2 In contrast to most of the literature, we find that industrial robots are positively associated with total employment. Also deviating from previous studies, we do not find evidence of a negative relationship between robot use and low-skill employment. 3 These results are robust across a wide range of assumptions, estimator choices, sector selections and time periods and they hold whether we look at absolute numbers of robots, robots per 1000 workers or the percentile of robot density. We additionally control for country-sector- and time-fixed effects, changes in the capital/labour ratio, in capital formation and in the share of information and communications technology (ICT) capital, and find that our results remain qualitatively the same. We expand on previous literature on this topic, which we review in detail in the next section, in several ways. First, we use more recent data on both industrial robots and labour supply, which almost doubles the number of observations compared to previous studies and thus increases the robustness of our findings. Second, we test a broader set of model assumptions, indicators and parameters, which allows the identification of the specific assumptions that drive our results as well as those of previous papers.
When interpreting the results in a policy context, the following points must be taken into account. First, our findings refer to recent and ongoing trends, but cannot be projected into the future. Industrial robots have been around since the 1980s (although their broad deployment has taken place in the last two and a half decades, the period covered in this article), and should not be confused with more advanced technologies such as AI-enhanced robots, which are not yet deployed on a large scale. In the medium term, these more advanced robots may have the potential to be more disruptive. Second, since the overwhelming majority of industrial robots are used in manufacturing sectors, we cannot interpret these results outside of the manufacturing context. It would be particularly interesting to look at the effect of service robots on employment, but we are not aware of a dataset that is sufficiently rich for analysis (which may in fact reflect that service robots are still a relatively recent and rarely used technology). Third, judging from the explanatory power of the estimated models, the effect of robotisation is small compared to time- and country-sector-fixed effects, hence most of the variation we see in employment statistics is driven by other factors, such as a secular contraction of the manufacturing sector in Europe over the last decades (time-fixed effects) and a shift in automotive manufacturing from Western to Eastern European countries (country-sector-specific effects; see Cséfalvay, 2020). Fourth, we cannot fully discard the hypothesis that robots and employment are positively correlated because they both reflect higher investment and general economic success in specific country–sector pairs. We try to capture this effect to some extent by controlling for capital formation, but this does not suffice to completely discard this hypothesis. Fifth, if there are employment spillovers across sectors, the magnitude of the effect of robotisation on employment can be overstated (e.g. if robots displace workers who are then absorbed by other industries, one would be over-estimating the negative effect of this technology on employment).
This article is structured as follows. After a review of the related literature in the next section, we introduce the different datasets, indicators and methods in the third section. In the fourth section, we present some descriptive statistics and the fifth contains the main results of the econometric analysis, as well as a robustness analysis and a critical discussion of our results in the light of previous research. The sixth section concludes and discusses policy implications.
Previous literature on robots and employment
There are a number of articles on the mechanisms behind the impact of automation on the labour market in general (Acemoglu and Autor, 2011; Acemoglu and Restrepo, 2018a, 2018b, 2019; Autor, 2015; Autor et al., 2003). These mechanisms also apply in principle to the specific technology that we analyse in this article: industrial robots. Three basic effects are at play. First, technology directly displacing labour from certain tasks (‘displacement effect’). Second, the creation of new tasks through technology, which might create new jobs. Third, the ‘productivity effect’, which is a result of increased productivity and output due to using cheaper capital in production. Increased output leads to an increased demand in all factors, including labour. 4 The productivity effect is even more pronounced in the long run as a consequence of general equilibrium effects (Acemoglu and Restrepo, 2018b). The overall effect of robotisation on employment is then determined as the sum of these three effects and can go both ways.
The empirical literature on the effect of industrial robots on employment can be split into two groups: studies that use aggregate data from the International Federation of Robotics (IFR, 2019) as a source for information on robot deployment and studies that use micro-economic data. 5 In general, micro data-based studies tend to find a neutral or positive correlation between (low-skill) employment and the use of robots, suggesting a complementarity between robots and (low-skill) jobs. By contrast, the studies that rely on IFR data – which require aggregation at the sectoral and national level – tend to find a negative correlation between robots and employment, at least for low-skill workers. Overall, the studies are difficult to compare systematically, since they cover different time periods, economic sectors and countries.
It is common in the literature using the IFR data to study the changes in employment and robot adoption over a specific time period by taking long differences between the first and the last year of the period. This reduces the importance of measurement error in the total variation but leads to a loss of data points. Graetz and Michaels (2018) use the EU Kapital Labour Energy Material Services (EU KLEMS) database to combine the IFR data with data on the share of low-, medium- and high-skill employment in different industries. Looking at changes in employment shares and robotisation between 1993 and 2007 in 14 sectors and 17 countries, they report a negative correlation between robotisation and the share of low-skill employment and no significant effect on total employment. Using a similar technique, Carbonero et al. (2018) analyse the period from 2000 to 2014 in 15 sectors and 41 countries. They find a negative correlation between robot adoption and total employment, which is more pronounced in developing countries but still exists in developed countries. De Backer et al. (2018) analyse the period 2000–2014 and find a positive correlation between robots and employment in developed countries (depending on the years analysed) and no correlation for developing countries. Borjas and Freeman (2019) use data from the American Community Survey (ACS) on employment and find that between 2004 and 2016 there has been a negative correlation between robots and employment, in particular low-skill employment, in the US.
Although the IFR data lack regional detail, some authors choose to assign robots to different subnational regions, based on the distribution of employment, in order to identify the effects of robot adoption based on spatial variation. Using this approach, Acemoglu and Restrepo (2019), Dauth et al. (2021), Chiacchio et al. (2018) and Antón et al. (2020) explore the impact of robots on employment on the US, Germany, and different selections of EU countries, respectively. This approach has the advantage that local employment spillover effects between sectors are accounted for, since the smallest unit of analysis is a region, not a sector.
Acemoglu and Restrepo (2019) find a negative effect of robots on employment and wages. 6 The results of Chiacchio et al. (2018) suggest a negative impact of robotisation on employment and wages in six European countries. Antón et al. (2020) explore a wide range of specifications and find that the outcome strongly depends on the time period analysed: while results for the period 1995–2005 are ambiguous and strongly dependent on specific assumptions, positive effects of robots on employment prevail in the period 2005–2015. Throughout both periods, the authors do not find evidence of an effect in terms of polarisation of labour markets in Europe. This approach is currently subject to several criticisms related to the validity of the so-called Bartik-type instruments (Adão et al., 2019; Apfel, 2019; Borusyak et al., in press; Goldsmith-Pinkham et al., 2020; Jaeger et al., 2018).
Another method for obtaining a richer dataset is combining the IFR data with micro-economic data on employment: this method assigns each household a measure of robot exposure, depending on the sector in which the household is employed. Dauth et al. (2021), using household-level micro data, find that, between 1994 and 2014 in Germany, every additional robot has destroyed two manufacturing jobs – however, this has been exactly offset by job creation in the service sector. Jansson and Karabulut (2019) directly analyse the effect of robot exposure on the wealth ownership of households in Sweden between 1999 and 2007. They report a negative correlation between the two factors, which is especially pronounced for low-skill households.
Among the studies based solely on micro-economic data, Jäger et al. (2016) have the broadest geographical coverage. They use firm-level data from the European Manufacturing Survey for analysing the relationship between industrial robots, employment and productivity across 3000 firms in six EU countries and Switzerland for the year 2012. The authors find a neutral effect of robots on employment and a significant positive effect on productivity. Koch et al. (2021) use a panel of manufacturing firms in Spain, which covers the years 1990–2016 and around 1900 manufacturing firms. They find that robot adoption is correlated with increased employment and output, while non-robot-adopting firms had falling employment rates. Domini et al. (2021) confirm the existence of a positive correlation between automation and aggregate employment for the case of France. These studies suggest complementarity between employment and robots at the micro-level that seems harder to detect when looking at aggregate data. 7 This conclusion is also in line with Raj and Seamans’ (2018) call for more micro-based studies on AI and robotisation.
Some of the studies cited above go beyond our exclusive focus on employment (Carbonero et al., 2018; De Backer et al., 2018; Graetz and Michaels, 2018). Additional studies using the IFR data focus more on the process of robot adoption (Fernández-Macías et al., 2021; Jungmittag, 2021), on the effect of robots on productivity (Graetz and Michaels, 2018; Jungmittag and Pesole, 2019; Kromann et al., 2020), and on the effects of robots on trade and offshoring (Carbonero et al., 2018; De Backer et al., 2018; Krenz et al., 2021). It is also worth mentioning that there is an extensive body of literature examining the labour market consequences of technological change that goes beyond robots, mainly focused on the task content of jobs and its effect on different segments of the labour force (see, among others, Autor, 2015; Barbieri et al., 2019; Fernández-Macías and Hurley, 2017, for recent surveys on the topic).
In sum, the reviewed literature is inconclusive on whether robots increase or decrease employment. Studies that use IFR data tend to find negative or null correlations between robotisation and employment, while studies that use micro-economic data tend to find positive or neutral effects. How can this inconsistency be explained? On the one hand, the effects of robots on employment are likely to be small compared to other trends that occurred over the same time period (Mishel and Bivens, 2017). On the other hand, no two studies look at the same years, economic sectors and countries, which makes them hard to compare systematically.
As we show below, even though we use the IFR data we find a positive correlation between robotisation and total employment and no evidence for a negative correlation regarding the low-skill employment share. Our empirical analysis differs from previous studies in the following factors, which explain the difference in outcomes: (1) in our benchmark analysis, we focus on the manufacturing sectors, which contain the overwhelming majority of all industrial robots (including non-manufacturing sectors still leads to the same effects but with a reduced magnitude); (2) we use data from the EU Labour Force Survey (LFS) instead of EU KLEMS data (we also use EU KLEMS data as a robustness exercise which leads to significant differences in some estimations; the differences between the two datasets are discussed in the next section); (3) we calculate robot densification by dividing the number of robots in a given country–sector pair by the stock of robots in the same country-sector in 1995, not by employment in each year, to avoid endogeneity issues. Graetz and Michaels (2018) is the study that is most similar to ours but comes to different conclusions and focuses on a more restricted period of analysis. We show that when we reintroduce these factors in our estimation we come to similar results to Graetz and Michaels (2018). 8 This is described in detail later in the article.
Data and methods
Data description
In this article, we use the World Robotics database, compiled by the International Federation of Robotics (IFR, 2019), as our source for data on annual shipments of industrial robots. The International Organisation for Standardisation defines an industrial robot as ‘an automatically controlled, reprogrammable, multipurpose manipulator programmable in three or more axes, which can be either fixed in place or mobile for use in industrial automation applications’ (ISO, 2012).
The IFR data cover the period between 1993 and 2017 and more than 40 countries, including all EU-28 countries except for Cyprus and Luxembourg. Robots are classified according to the International Standard Industrial Classification of All Economic Activities Revision 4, which is equivalent to European Classification of Economic Activities Revision 2 (NACE Rev. 2). The data in manufacturing sectors are mostly provided at the two-digit level, whereas outside of manufacturing they are provided at the one-digit level only. It is evident from Figure 1 that almost all industrial robots in Europe are deployed in manufacturing, and that within manufacturing four subsectors – automotive (29–30), metal products (24–25), rubber and plastic (22–23) and machinery (28) – account for more than 80% of all industrial robots.
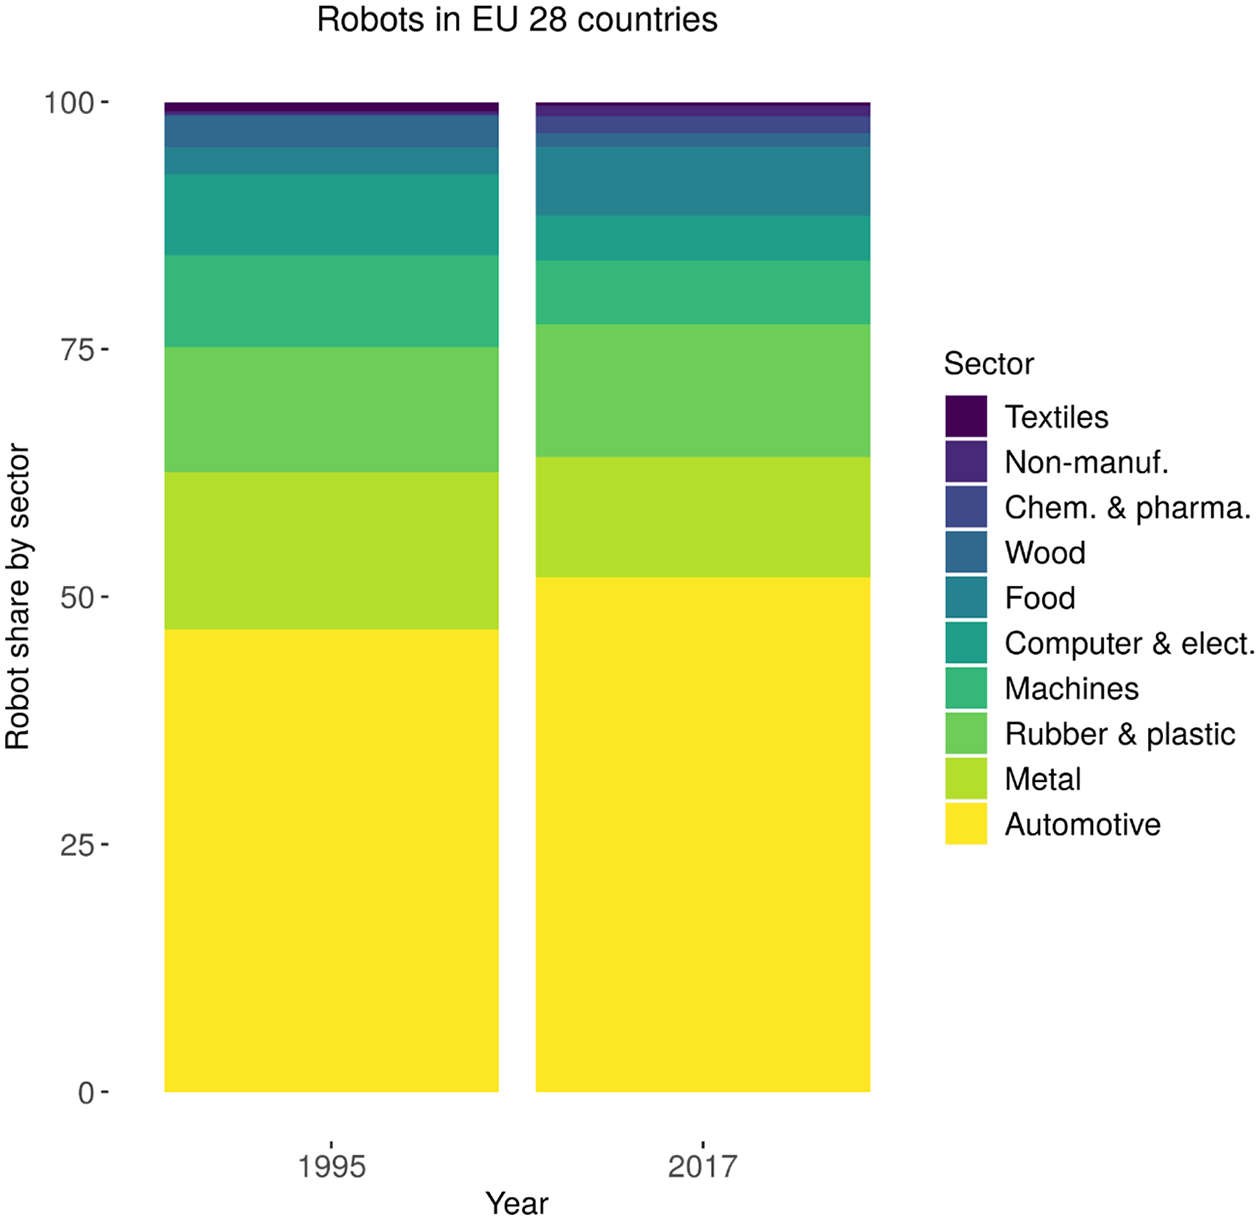
Sector shares in robot stock in the years 1995 and 2017 in Europe.
The IFR estimates the operational stock of industrial robots from annual robot shipments, by assuming that a robot depreciates at a rate of 100% after 12 years of use. Since we encountered several problems with the original stock data, we follow Borjas and Freeman (2019), Graetz and Michaels (2018) and others in reconstructing the robot stock ourselves based on the annual shipment data and a yearly depreciation rate of 10%. Our results do not change qualitatively if we use depreciation rates of 5% or 15% or assume full depreciation after 12 years.
In order to get a relative measure of the degree of robot adoption independent of the size of an economic sector, we define robot density as the number of robots per 1000 employees. This metric is also sometimes called ‘robot intensity’ and is widely adopted in the economic literature on robots, e.g. Antón et al. (2020), Borjas and Freeman (2019), Dauth et al. (2021) or Graetz and Michaels (2018). For the descriptive statistics in the following section, robot density is given as the number of robots divided by employment in each year. By contrast, when we use robot density as the independent variable in the regression analyses in the fifth section, we calculate it as the number of robots divided by employment in a base year (usually 1995). Nevertheless, in the robustness analysis we show that even when using absolute numbers of robots instead of robot density our results remain qualitatively unchanged.
Similar to Graetz and Michaels (2018), the robot variable we use in our benchmark estimations is the percentile of the robot density distribution. We reproduce their specification exactly in the section ‘Comparison to previous research’, while in the ‘Main results’ section we calculate robot density as specified in the previous paragraph. As a robustness check, we also analyse robot variables from other publications. We look at the robot density directly, as in Borjas and Freeman (2019) and similar to Dauth et al. (2021) and Acemoglu and Restrepo (2020), who additionally weigh the robot density by changes in either employment or output to create a higher spatial resolution. Finally, we also use the robot stock as a variable, as in Carbonero et al. (2018).
For data on total employment and employment by skill level, we rely on the European Labour Force Survey (EU-LFS). Employment is categorised by educational attainment according to the United Nations Educational, Scientific and Cultural Organization’s 2011 International Standard Classification of Education (ISCED): low-skill employment corresponds to ISCED 0–2, medium-skill employment to ISCED 3–4 and high-skill employment to ISCED 5–8. The EU-LFS covers more countries and years than EU KLEMS, which is the main reason for using the EU-LFS. This does not imply that EU-LFS data are superior to EU KLEMS’ – in fact, data on employment by skill level in EU KLEMS are mainly taken from the EU-LFS (Jäger, 2017). The EU-LFS data can vary significantly from year to year when looking at specific sectors or categories of employment. This is why, apart from yearly data, we also look at six-year averages, which smoothes out most of the short-term fluctuations, and long-difference estimators. However, there is no large difference in outcomes between the different methods.
Finally, we use a number of control variables, such as the capital/labour ratio, the ICT share of total capital stocks and gross fixed capital formation, from the 2019 release of the EU KLEMS database which covers the years until 2017 (Stehrer et al., 2019). However, since some country–sector pairs are missing, especially in capital accounting, using these control variables reduces the number of observations in some estimations. For countries that use a currency other than the euro we use exchange rates from EUROSTAT. Descriptive statistics for the variables used in this study are presented in Table C1 in the Appendices. In addition to time-fixed effects, we use these control variables to control for macroeconomic trends (such as the 2007/2008 financial crisis or the general decline of the employment share in manufacturing). Those variables are potentially endogenous, but, as we will see in the econometric analysis, they hardly influence our results.
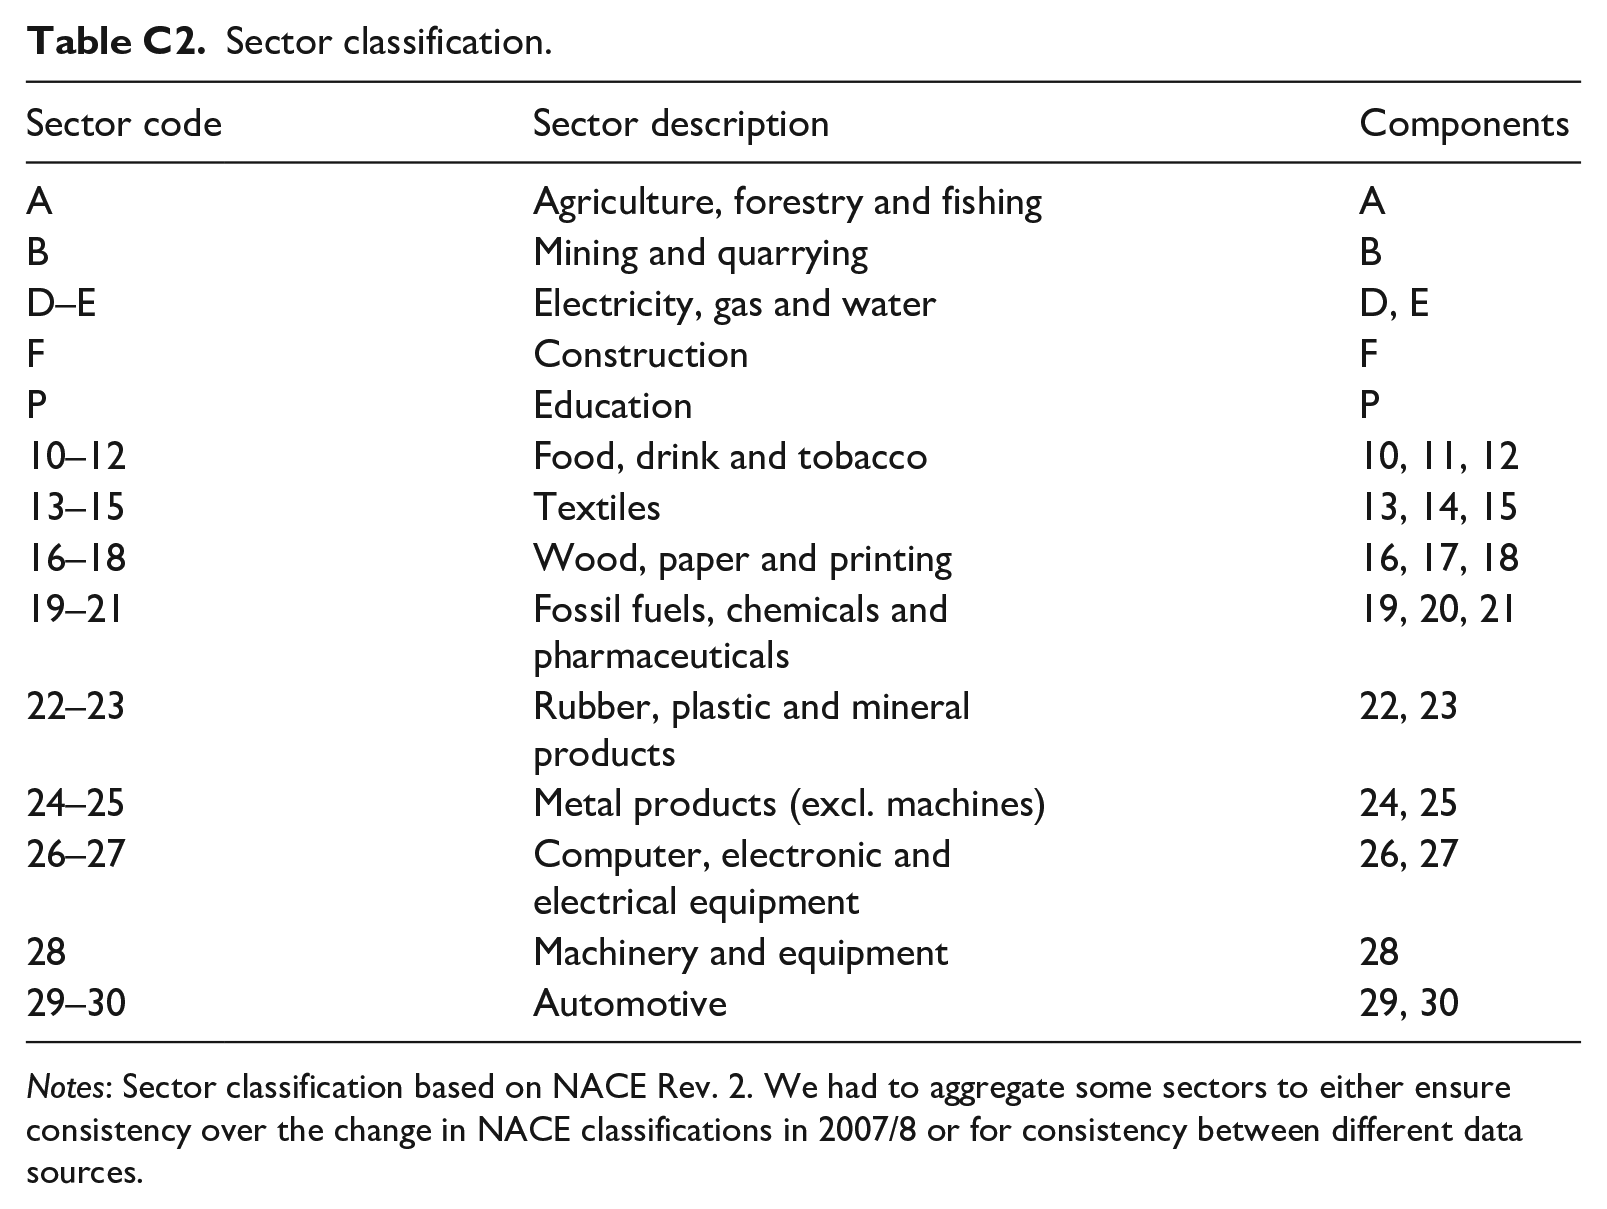
Since the datasets cover different time periods, countries and sector aggregates, the more control variables we include the lower the number of observations becomes (see Table C1). Also, due to the change in NACE classification in 2007/2008, some economic sectors are aggregated to ensure consistency over the entire period. Since the aggregates differ between IFR and EU KLEMS data, we had to further aggregate sectors to a ‘common denominator’ to ensure proper matching between all datasets. See Table C2 in the Appendices for the sector classification used in this study.
Methods
For most regression analyses in this article, we use estimations of the following form:

where X is the variable of interest (total employment, low-skill employment, low-skill employment share of total employment, change in total employment compared to the initial year), robots is a measure of robotisation (robot stock, robot density, percentile of robot density) and controls includes a vector of covariates (capital/labour ratio, capital formation, ICT share of capital). The indexes c, s and t stand for the respective country, sector and year (or, in the case of averages over several years, t refers to each time period).
For the first-difference estimator, the estimation changes slightly to:

In the case of the long-difference estimator, the estimation becomes:

where ΔX refers to the change in the variable X between the first and the last year (in most cases between 1995 and 2017). In all the specifications above, we also control for different fixed effects, which are indicated in the tables containing the results.
Robots and employment in Europe: Descriptive results
Since the 1970s, the employment share of manufacturing sectors has been decreasing in major European economies as well as in the EU-15 countries on average, 9 as illustrated in Figure 2. In 1970, manufacturing accounted for more than 20% of employment in all depicted countries, in some cases even more than 30% (Germany and the UK). Nowadays, all countries shown have a percentage below 20%. In fact, except for Germany and Italy, the percentage is below 15%, and it even goes below 10% in the UK and Sweden.
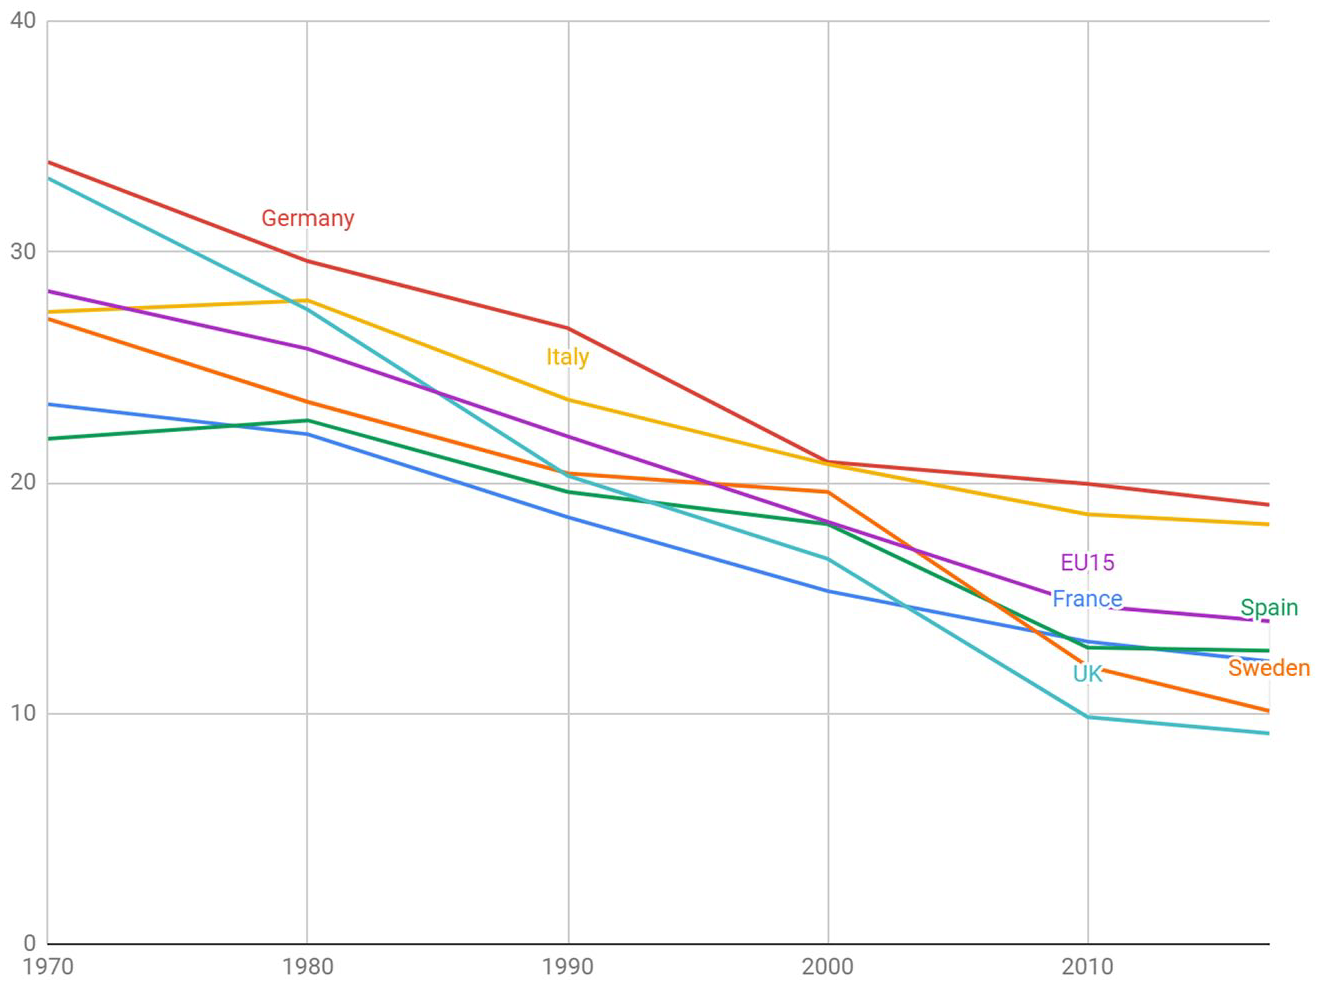
Share of employment in manufacturing in Europe (1970–2016).
For most of the 20th century, technological progress has been much faster in manufacturing than in services (see, for example, Baumol, 1967; Baumol and Bowen, 1965). This generated a large differential in productivity growth between the two sectors, which was one of the main factors that reduced the share of employment in manufacturing relative to services. As discussed in Fernández-Macías et al. (2021), the advanced industrial robots that we are analysing in this article should be understood as part of this long-run automation process, affecting mostly the last two decades shown in Figure 2.
The installation of advanced industrial robots took off in Western European manufacturing from the late 1990s (Fernández-Macías et al., 2021). If this had provoked a major disruption in terms of employment, we would expect to see an acceleration in the decline of the employment share of manufacturing over the last few decades in Figure 2. However, there seems to be a more or less continuous decline from the 1970s, with no generalised acceleration over the last two decades. In some countries such as the UK and Sweden the rate of deindustrialisation accelerated after 2000, but in other countries a deceleration took place instead over the same period (Germany, Italy, France). For the EU-15 as a whole, the pace of decline has been relatively constant since the 1970s, in fact slowing down slightly in the most recent period. 10 In other words, the broad trends of employment in manufacturing do not suggest an acceleration of deindustrialisation as a result of a major technological disruption in the last 20 years, but rather a continuation of a secular decline in manufacturing employment that started decades earlier. Similar trends can be observed in other developed economies such as the US, Japan or Australia.
This relationship becomes more complex when looking at individual country–sector pairs. In the 15 largest manufacturing country–sector pairs in Europe, which account for more than two-thirds of all industrial robots, robots and employment frequently move in the same direction, but not always (see Figure D1 in the Appendices). For instance, in German car manufacturing (by far the heaviest user of robots in Europe), the stock of robots and the number of workers both increased steadily. Italian, Spanish and Czech car manufacturing, as well as the German rubber and plastics and food sectors, follow a similar pattern. In other cases, the evolution of robot stocks and employment appear to go in opposite directions, more in line with the replacement hypothesis, for example in the Italian metal sectors.
When looking at changes in per cent relative to the base year (1995), it becomes apparent that the magnitude of change of both variables differs greatly (see Figure D2): whereas robot stocks expanded significantly relative to the initial values, employment changed only marginally regardless of the direction in which it moved. This demonstrates that a simply descriptive approach is not sufficient to analyse such a complex problem: while in some country–sector pairs employment moves with the number of robots, in others it moves in the opposite direction. Country- and sector-specific time trends and other factors such as the capital/labour ratio have to be carefully accounted for using an econometric approach. Also, at least in relative terms, changes in employment appear to be smaller in magnitude than changes in robotisation.
Using absolute numbers of industrial robots and persons employed complicates the comparison of country–sector pairs of different sizes, which is the main motivation for using a ‘robot density’ indicator. In our case, we use the number of robots per 1000 workers in a sector, which is in accordance with most of the literature. For total employment, we analyse the change in employment compared to the initial year. With regard to employment by educational attainment, we analyse shares of total employment. In the rest of this article, to ensure that our results are robust to alternative parameterisations, we consider all these indicators and mention whenever the estimation results change qualitatively.
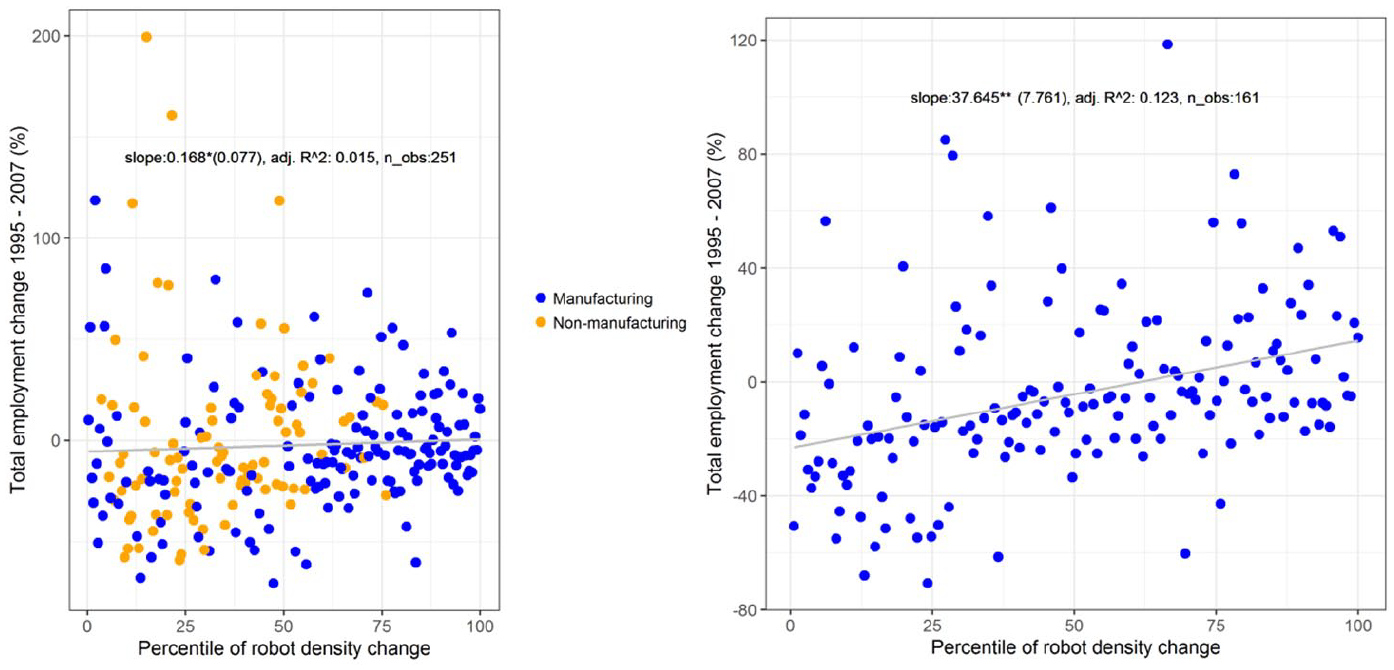
However, even if we use a relative measure of robot adoption such as robot density, values are relatively small and the distribution has a long right tail (see Figure 3, left panel), which makes the fitting of a linear model more complicated since outliers in the tail might disproportionately impact the outcome. To check whether outliers drive our estimations of outcomes and similarly to Graetz and Michaels (2018), we use the percentile of the robot density distribution as an independent variable to check for the robustness of our results (see Figure 3, right panel). We verify that this choice does not change the estimation qualitatively.
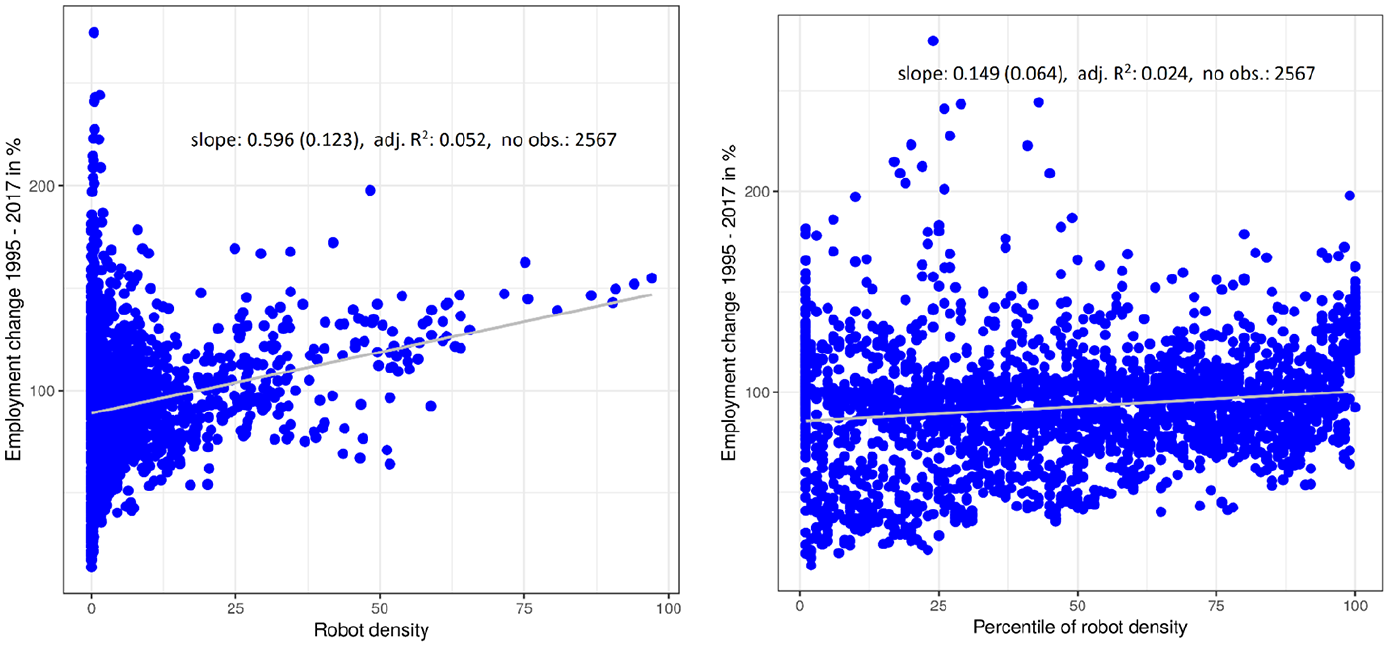
Robot density and change in total employment (1995–2017).
Another crucial point in the analysis is the selection of sectors. Since industrial robots are primarily used in the manufacturing sectors (see Figure 1), including non-manufacturing sectors (which tend to be large in terms of employment but lack significant robot deployment) such as Agriculture (A), Mining (B), Utilities (D–E), Construction (F) and Education (P) leads to the same conclusions but with a reduced magnitude, especially when the percentile of robot density is used as the independent variable. This is illustrated in Figure 4. Non-manufacturing sectors are plotted in orange and manufacturing sectors in blue. It is clear right away that when the non-manufacturing sectors are included in the regression, the regression line is completely flat. When only manufacturing sectors are included, as in Figure 3, the regression line has a positive slope. Nonetheless, this effect is partially offset by controlling for country-sector-fixed effects, as we discuss in the next section.
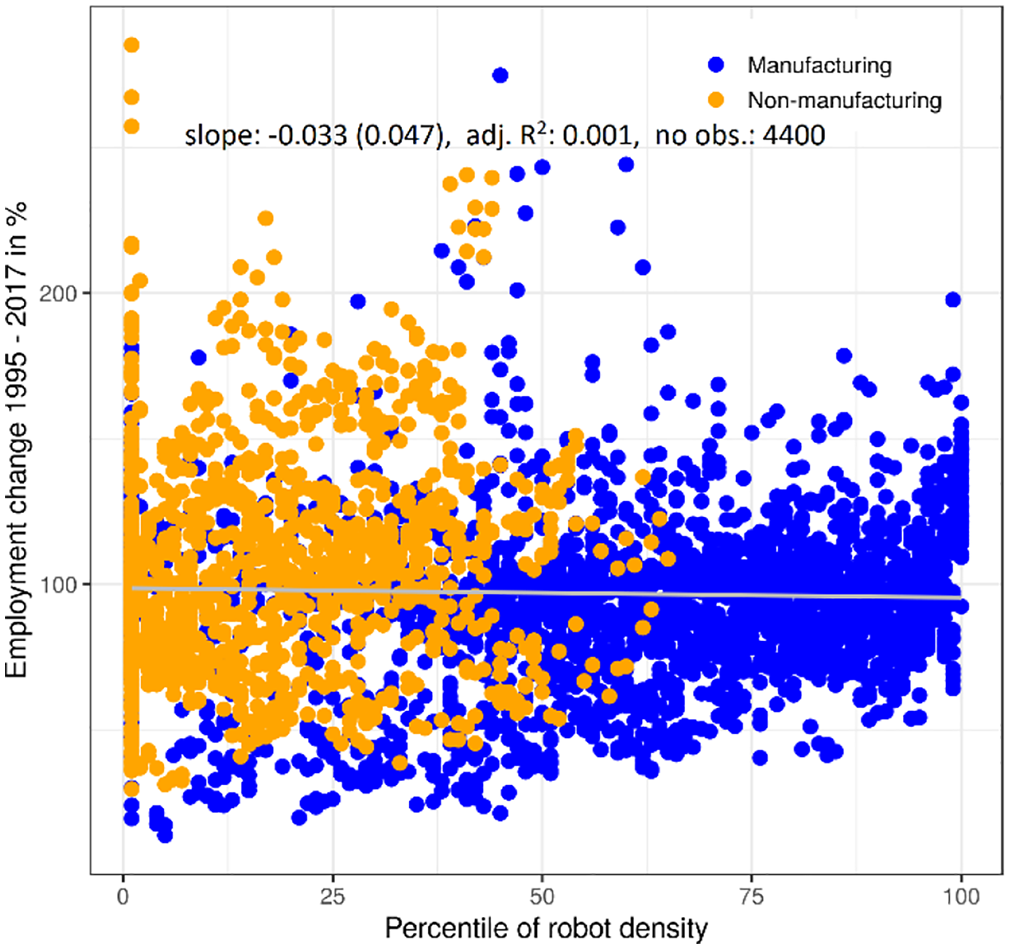
Percentile of robot density and change in total employment for all sectors (1995–2017).
Robots and employment in Europe: Econometric analysis
This section provides a detailed econometric analysis of the relationship between robot adoption and total employment, as well as the composition of employment in terms of skill levels. We use a sectoral approach in the sense that each sector in each country at a given time counts as one observation.
The first part of the section contains the main results, which are derived using a within-group Ordinary Least Squares (OLS) estimator, controlling for country-sector- and time-fixed effects. Standard errors are clustered at the country-sector level, robust to unknown forms of heteroscedasticity and serial correlation. We use yearly data for the main analysis, but we check if the results hold when averaging over three- and five-year periods in the second subsection, where we also use a first-difference and a long-difference estimator (using only the initial and the final year in the case of the long-difference estimator). This also increases the comparability of the results to other studies such as Graetz and Michaels (2018). We do not weigh the observations, as some authors do, by within-country employment shares, except in the third subsection, where we do so for the purpose of comparison with other literature. We additionally control for changes in the total stock of capital, in the ICT share of capital and in the capital/labour ratio. These variables are likely endogenous to some extent, but, although it is beyond the scope of this article to solve this issue, we include them in some specifications in order to test the robustness of the econometric results.
We use different measures of robot adoption: the total robot stock in a country, robot density (calculated as the number of robots per 1000 workers, see ‘Data and methods’ above for details), the percentile of the robot density distribution and, for the long-difference estimator, the percentile of change in robot density between the first and the last period (analogous to Graetz and Michaels, 2018). In terms of employment, we look at absolute numbers of total and low-skill employment, as well as at the share of low-skill employment and the change in total employment compared to the base year. We analyse two different periods: 1995–2007 and 1995–2017. This makes our results comparable to previous studies which mostly stop in 2007 and it also has the advantage that we are able to check for possible distortions caused by the 2007 change in NACE classification and the financial crisis of 2007/2008.
Main results
Our main results are as follows. For the full period from 1995 to 2017, we find a significant positive correlation between the percentile of robot density and the change in total employment compared to 1995 (Table 1). The correlation remains positive when controlling for country-sector- and time-fixed effects and other explanatory variables, and when robot density or robot stock is used as the independent variable. The correlation coefficient is negative, however, when only country-sector-, but not time-fixed effects are controlled for (column 2). In this case, time trends such as a general trend of deindustrialisation are attributed to the robotisation variable, demonstrating the importance of controlling for time trends. The results in Table 1 can be interpreted as moving from one percentile in the robot density distribution to the next leading to an increase of 0.44 (+/− 0.10)% in total employment compared to 1995. Looking at the robot density directly instead of percentiles (see Table A1 in Appendix A), the result can be interpreted as one additional robot per 1000 workers being correlated with an increase of 1.14 (+/− 0.16)% in total employment. Finally, in absolute numbers, this can be interpreted as one additional robot being correlated with 4 (+/− 2) additional workers (see Table A2 in Appendix A). The exact magnitude of these correlations depends to some extent on the control variables, but this finding is very robust.
The effects of robot density percentile on total employment (1995–2017).

Notes: Pooled OLS, yearly data, only manufacturing sectors. Results of regressing the change in total employment (in per cent) on robot density percentile. This table corresponds to the right panel in Figure 3. Standard errors clustered at the country-sector level are displayed in parentheses. ** significant at the 1% level; * significant at the 5% level. The number of observations can vary between model specifications as the control variables are not available for all country–sector pairs.
Source: Authors’ analysis from World Robotics database, EU-LFS and EU KLEMS.
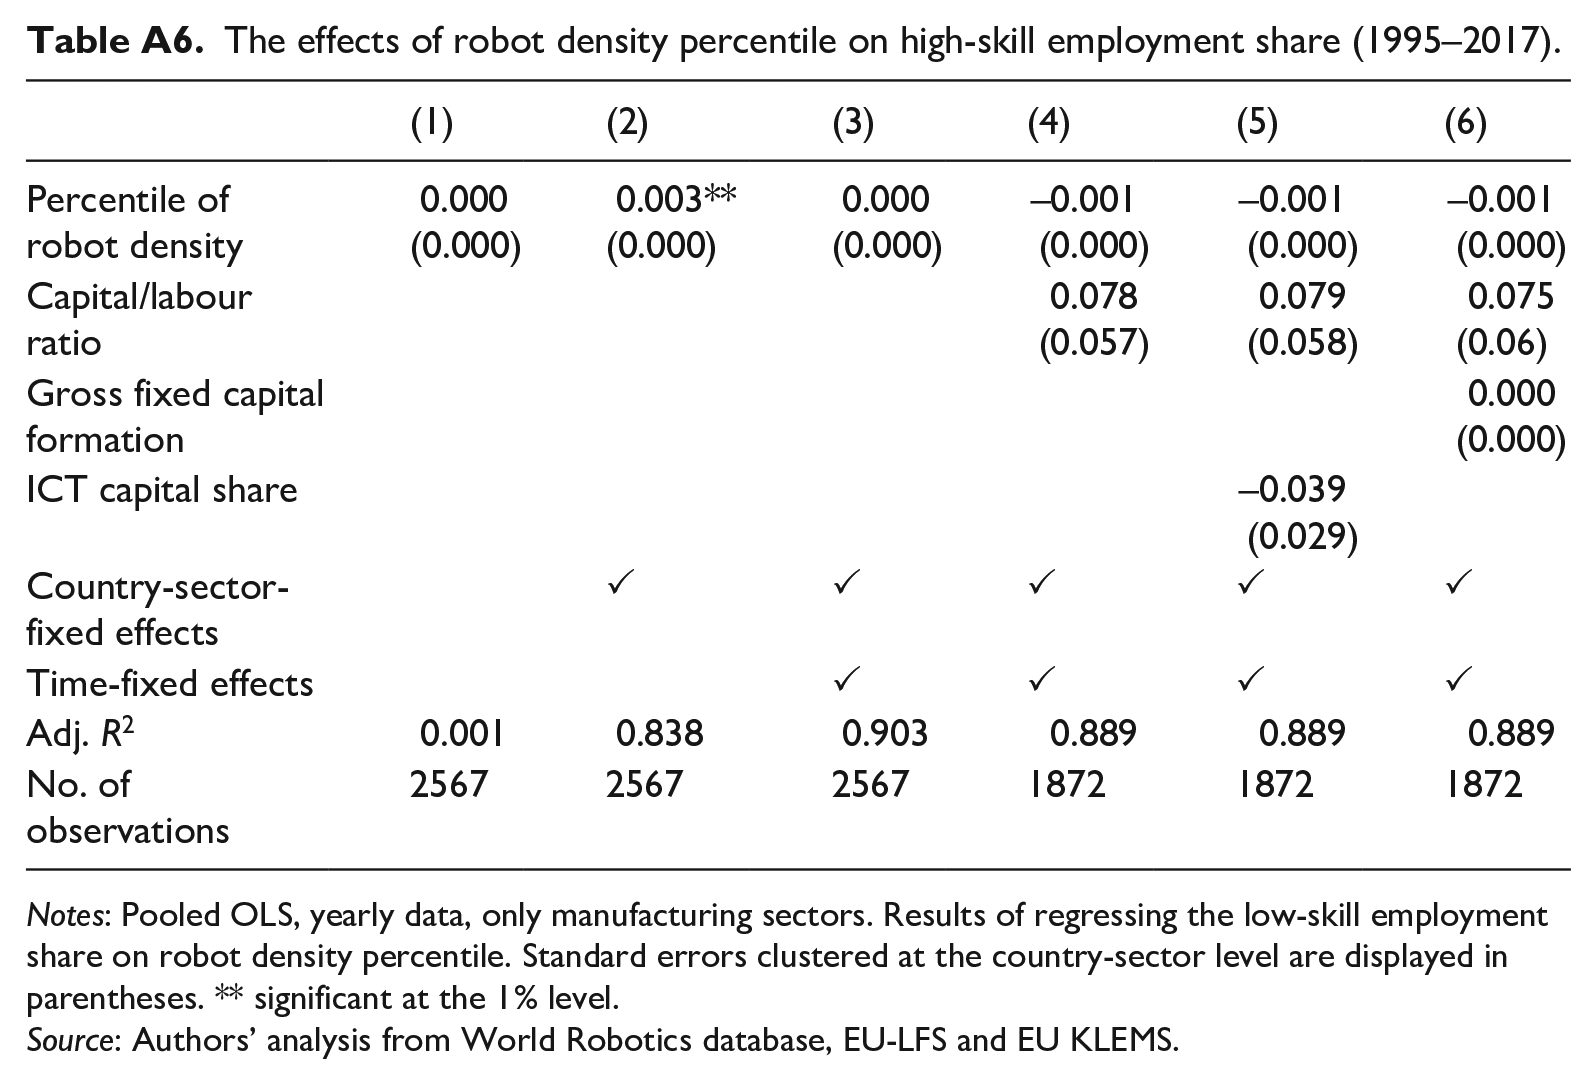
We also find a very small, sometimes significant, correlation between robot adoption and the low-skill employment share, which can be negative or positive, depending on the control variables and the choice of the estimator. When controlling for changes in the capital/labour ratio, the correlation becomes even smaller and is no longer significant (see Table 2). The correlation is mostly nil, when using a long-difference estimator (see Table B2 and ‘Robustness checks’ subsection below). 11 This behaviour does not depend on the estimator we use, the choice of independent variable (robot density, robot density percentile, robot stock) or the choice of dependent variable (low-skill employment share, absolute low-skill employment numbers). There is also no evidence of a significant correlation between medium- or high-skill labour and the percentile of robot density (see Tables A5 and A6). With the available data we do not find conclusive evidence of a significant, robust correlation between robot adoption and low-skill employment, be it negative or positive, either in absolute numbers, or as a share of total employment.
The effects of robot density percentile on low-skill employment share (1995–2017).
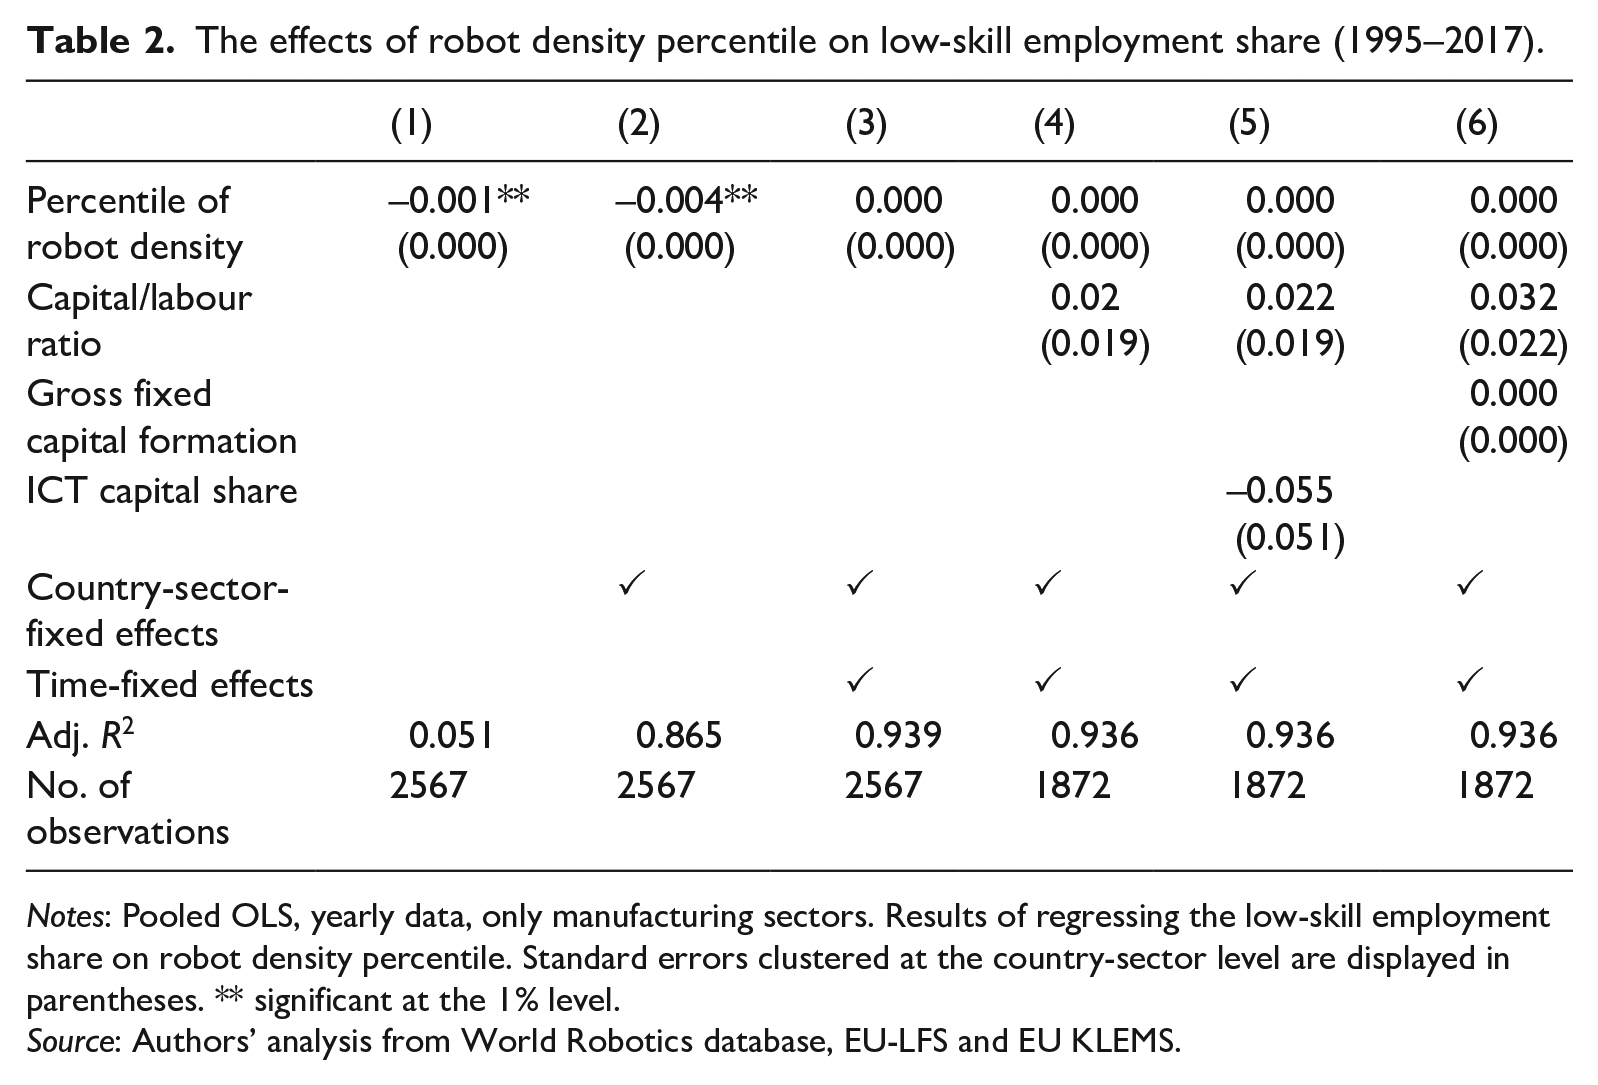
Notes: Pooled OLS, yearly data, only manufacturing sectors. Results of regressing the low-skill employment share on robot density percentile. Standard errors clustered at the country-sector level are displayed in parentheses. ** significant at the 1% level.
Source: Authors’ analysis from World Robotics database, EU-LFS and EU KLEMS.
For the first period (1995–2007), the effects regarding total employment are comparable to those of the full period but a bit larger: moving from one percentile in the robot density distribution to the next leads to an increase of 0.61 (+/− 0.17)% in total employment compared to 1995 (see Table 3). In absolute numbers, this increase is even more pronounced (Table A3 in Appendix A): one additional robot is correlated with 11 (+/− 1) additional workers.
The effects of robot density percentile on total employment (1995–2007).
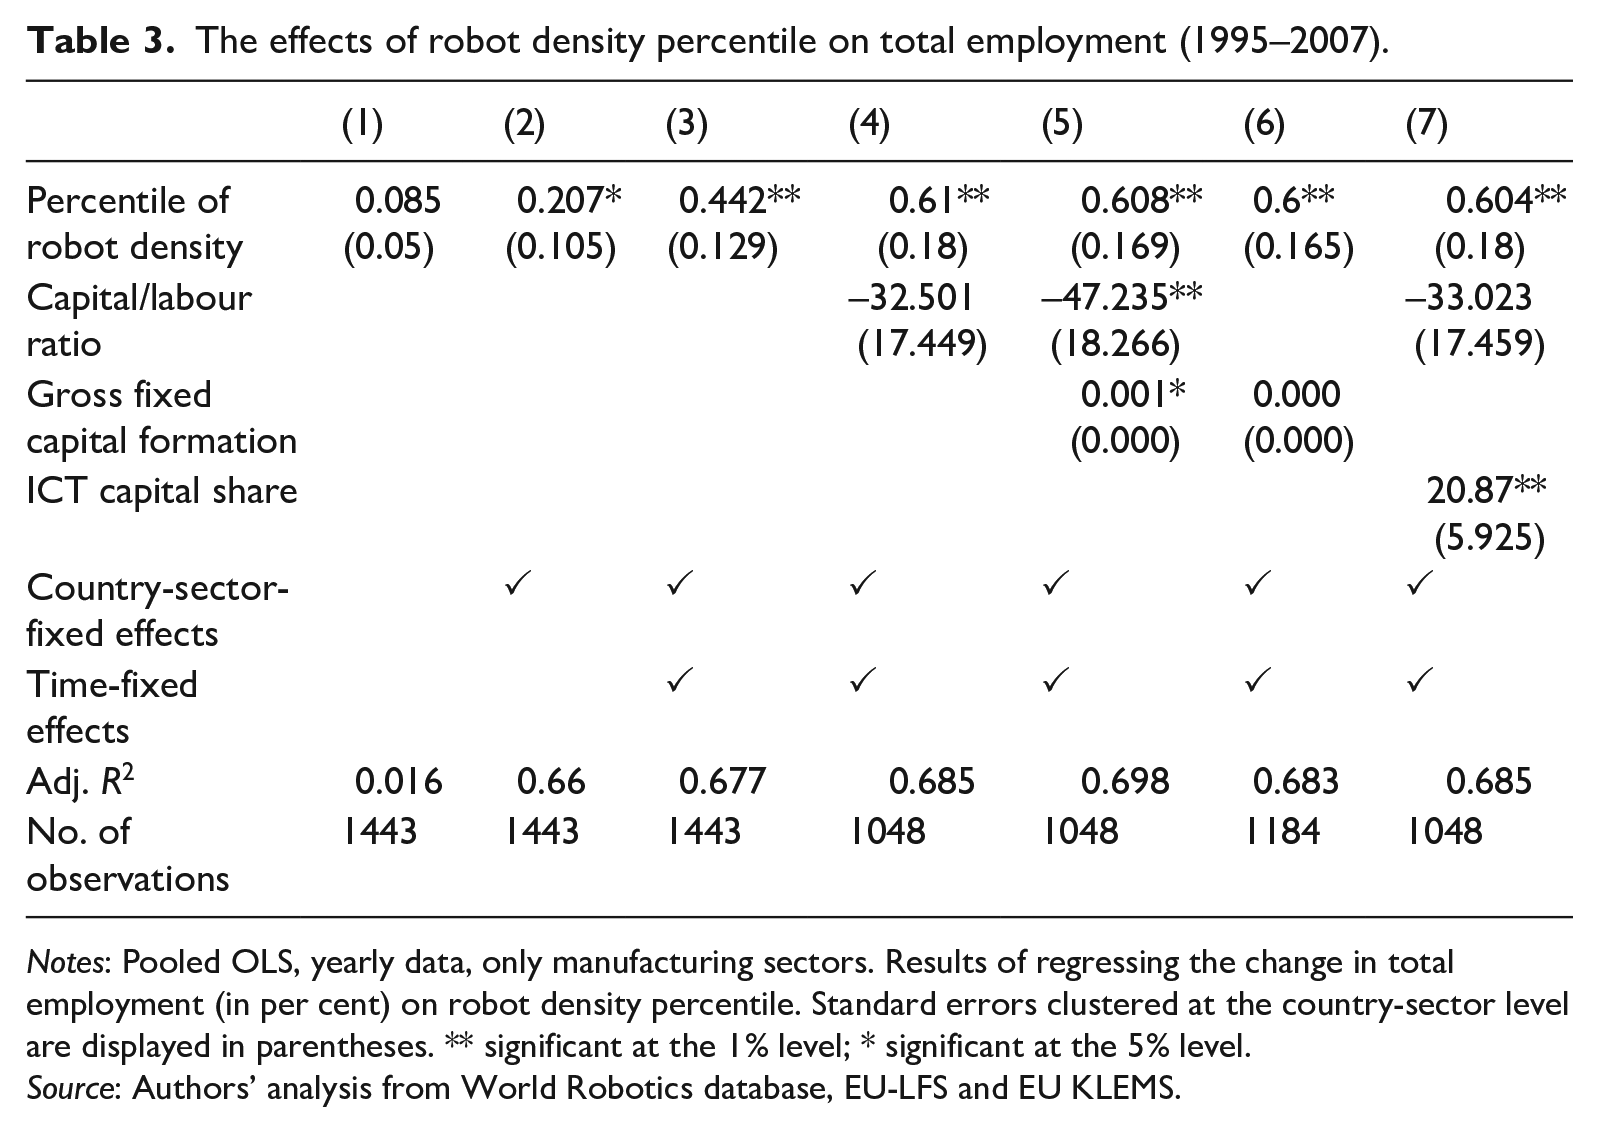
Notes: Pooled OLS, yearly data, only manufacturing sectors. Results of regressing the change in total employment (in per cent) on robot density percentile. Standard errors clustered at the country-sector level are displayed in parentheses. ** significant at the 1% level; * significant at the 5% level.
Source: Authors’ analysis from World Robotics database, EU-LFS and EU KLEMS.
Regarding low-skill employment in the first period (see Table 4), we do not find a positive correlation between the low-skill employment share and any measure of robotisation, but we find a positive correlation in absolute numbers between low-skill employment and the robot stock. In the period 1995–2007 one additional robot is correlated with 2 (+/− 1) additional low-skill workers (see Table A4). However, this does not imply a positive effect on the low-skill workers’ share of total employment, since one additional robot is correlated with 11 (+/− 1) additional workers (Table A3). Hence, only for sectors in which the low-skill workers’ share of total employment is below 18% would an increase of three workers lead to an increase in the low-skill employment share.
The effects of robot density percentile on low-skill employment share (1995–2007).
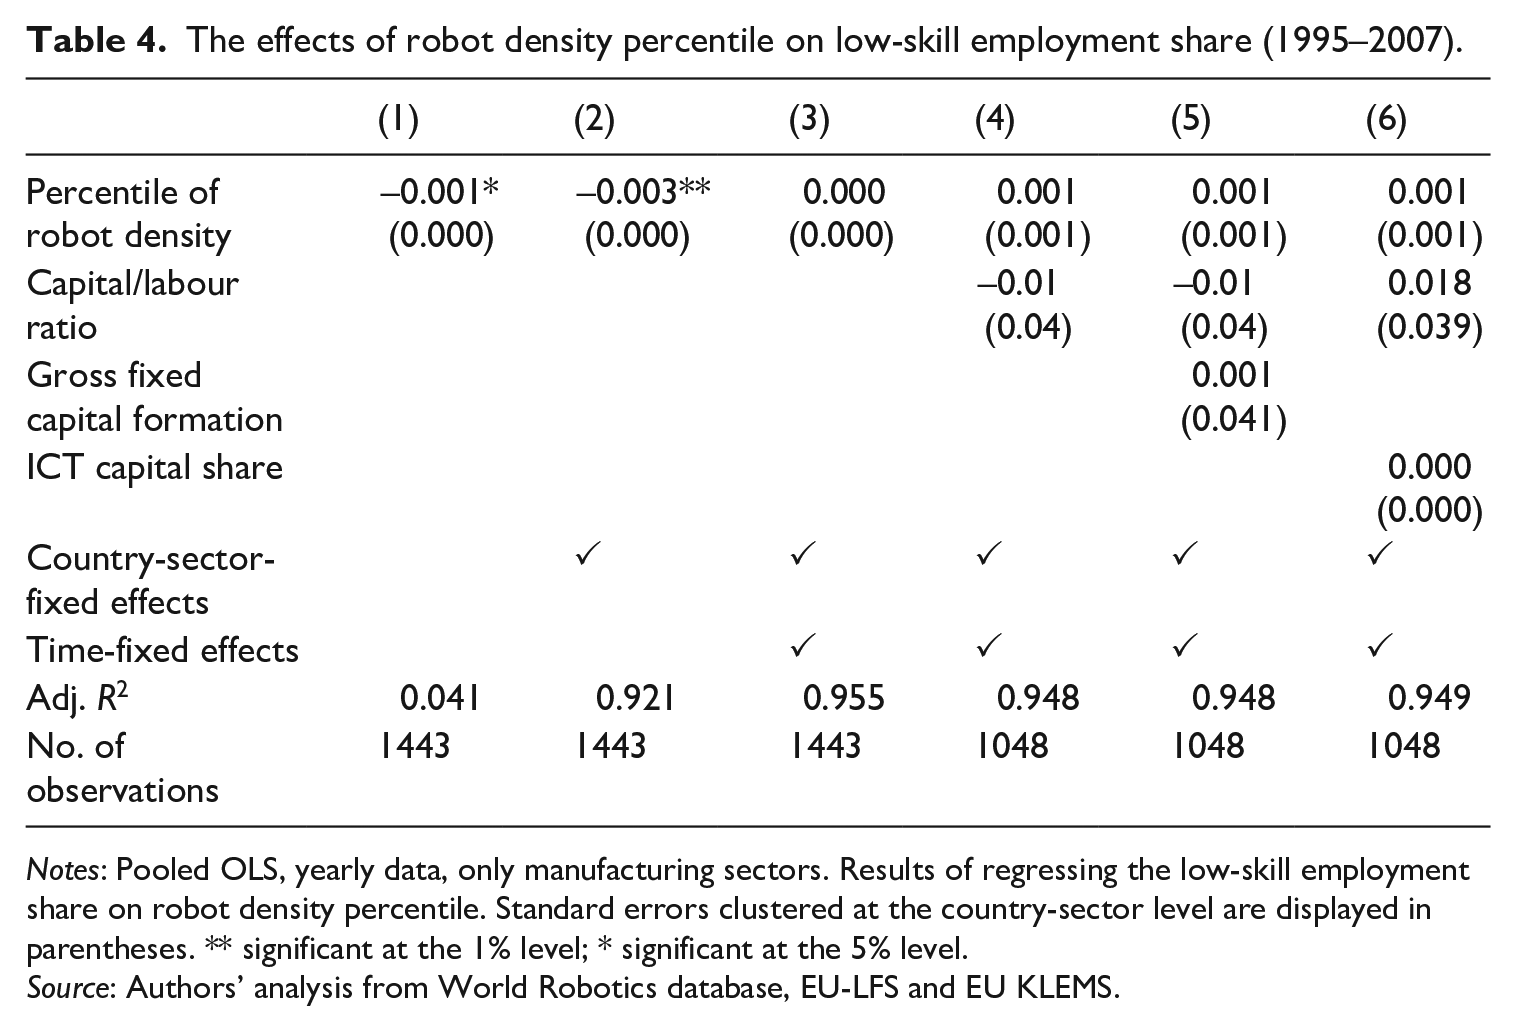
Notes: Pooled OLS, yearly data, only manufacturing sectors. Results of regressing the low-skill employment share on robot density percentile. Standard errors clustered at the country-sector level are displayed in parentheses. ** significant at the 1% level; * significant at the 5% level.
Source: Authors’ analysis from World Robotics database, EU-LFS and EU KLEMS.
Robustness checks
This section analyses the robustness of our results with regard to variations in estimators, sector selection, averaging over years, country group affiliation and the construction of the stock. Regarding estimators, we additionally use a first-difference and a long-difference estimator (which are different alternatives for controlling for time-invariant unobserved heterogeneity). The long-difference estimator only uses observations from the first and last year and thus has the additional advantage of filtering out short-term fluctuations. This implies that, if there is a relevant measurement error in the robot variable, the long-difference estimator might reduce its weight on total variation compared to other estimators. On the other hand, it might yield distorted results since it omits a large number of observations. We find that both estimators confirm the results from the previous section (see Tables B1 and B2 in Appendix B for results using a long-difference estimator; results obtained using a first-difference estimator are available upon request).
To exclude the possibility that short-term fluctuations influence our main findings, we also do the estimations using six-year averages. These fluctuations should be accounted for mostly by using time dummies; still we consider this a worthwhile robustness check. We find that the significance of the correlation between total employment and robotisation is preserved and of a similar magnitude. Furthermore, there is no correlation between low-skill employment and robotisation for six-year averages (see Tables B3 and B4 in Appendix B).
In the benchmark analysis in the previous subsection, we only include manufacturing sectors, since they comprise the large majority of all industrial robots (see also Figure 1). However, some other studies choose to also include sectors that have almost no industrial robots, whenever the data are available. Including all available economic sectors adds degrees of freedom but might increase unobserved heterogeneity and the likelihood of omitted relevant variables. We nevertheless redo the estimations for all economic sectors, to analyse whether our main findings are affected and for comparability with other studies. We find that when non-manufacturing sectors are included there are no qualitative differences in our results compared to the benchmark cases (see Tables B5 and B6 in Appendix B).
The data on the robot stock in the original dataset delivered by the IFR have several flaws and thus most studies construct their own robot stocks from the IFR data on annual robot deliveries, assuming either a yearly depreciation rate or the full depreciation of a robot after 12 years. The results in the benchmark analysis all use robot stock data compiled assuming a 10% annual depreciation rate. We alternatively use a 5% and 15% annual depreciation rate and also use the official IFR stock compilation that assumes full depreciation after 12 years. We find that these assumptions do not change our estimation results qualitatively (results for full depreciation after 12 years using the IFR stock compilation are given in Tables B7 and B8 in Appendix B, and results using other compilations of the capital stock are available on request).
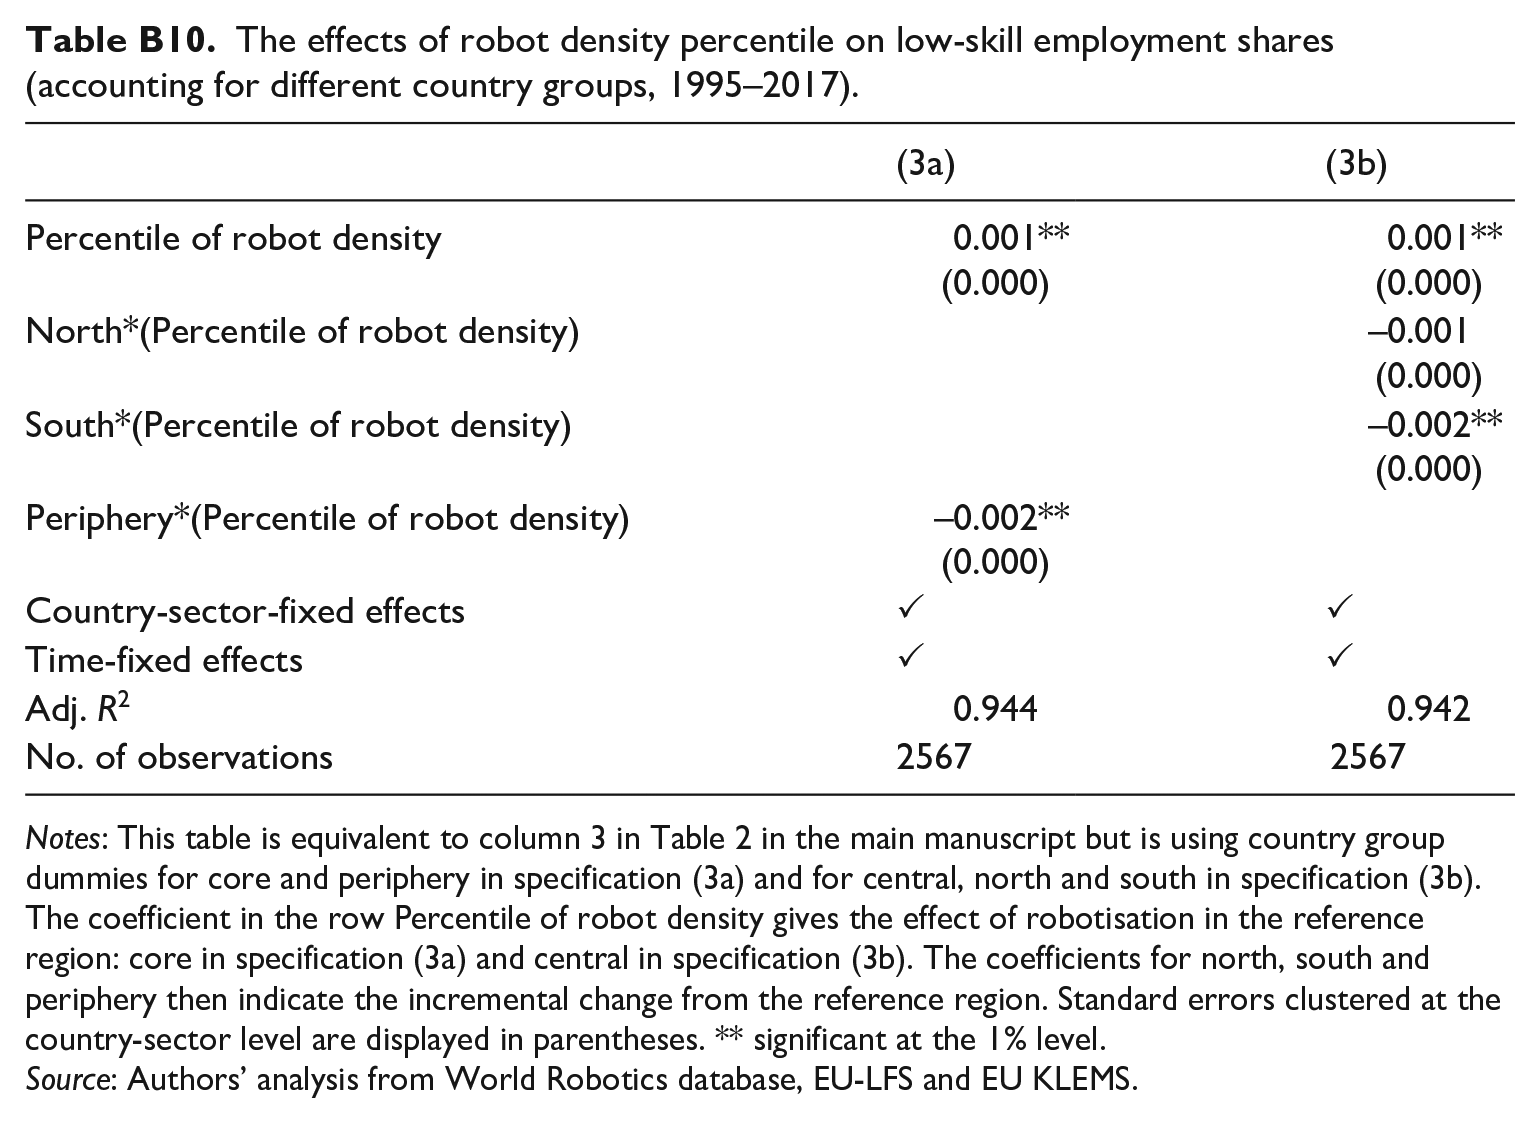
Finally, we analyse whether the effects of robotisation differ by country group. For that purpose, we repeat the estimations of our baseline specification (i.e. Tables 1 and 2) with two different sets of country groups. The first set classifies countries into the categories core and periphery; 12 the second set classifies them into the categories central, north and south. 13 We interact the robot variable with a dummy variable for the respective country group, while keeping the robot variable. In doing that, the coefficients of the robot*region variable indicate the incremental effect of robotisation in the specific region compared to the reference region. We find that there are no qualitative differences with respect to our main results. Robotisation still has a small positive effect on total employment and either no significant effect on the share of low-skill employment or a small effect that fluctuates around zero in all country groups. One interesting finding is that in the core vs periphery model the effect of robots on total employment is larger in the periphery than in the core countries. Furthermore, it appears that the null average effect in Table 2 hides some heterogeneity in the effects of robot adoption on low-skill employment in the central vs north vs south specification. For more details, see Tables B9 and B10 in Appendix B.
Comparison to previous research
The findings in the earlier part of this section contradict some of the results presented in Graetz and Michaels (2018) and other publications that analyse the relationship between robot adoption and employment. This is somewhat surprising since we use the same sources for the data on robots. Our results are, however, not directly comparable to Acemoglu and Restrepo (2019), Dauth et al. (2021), Chiacchio et al. (2018) and Antón et al. (2020) since they derive their findings from spatial variation in robot exposure, while we look at variation between sectors. 14 In this subsection, we therefore focus on describing the roots of the differences between our analysis and that of Graetz and Michaels (2018), another study that also analyses sectoral variation in robot exposure. However, the main points also apply to other studies to some extent.
Regarding low-skill employment, we do not find robust evidence for correlations between robot adoption and the low-skill employment share, while Graetz and Michaels (2018) find a significant negative correlation that also appears to be robust over a large set of assumptions. 15 The majority of this difference is explained by the fact that we use data from the European Labour Force Survey (LFS), while Graetz and Michaels (2018) rely on data from the 2008 release of EU KLEMS. Applying Graetz and Michaels’ methods to the LFS data yields an almost flat line, while the same method applied to the EU KLEMS 2008 data yields a significant negative correlation between robot adoption and low-skill employment shares (see Figure 5). Since the LFS data are the reference source on employment in Europe (in fact, EU KLEMS data derive from it), we consider its results more reliable.
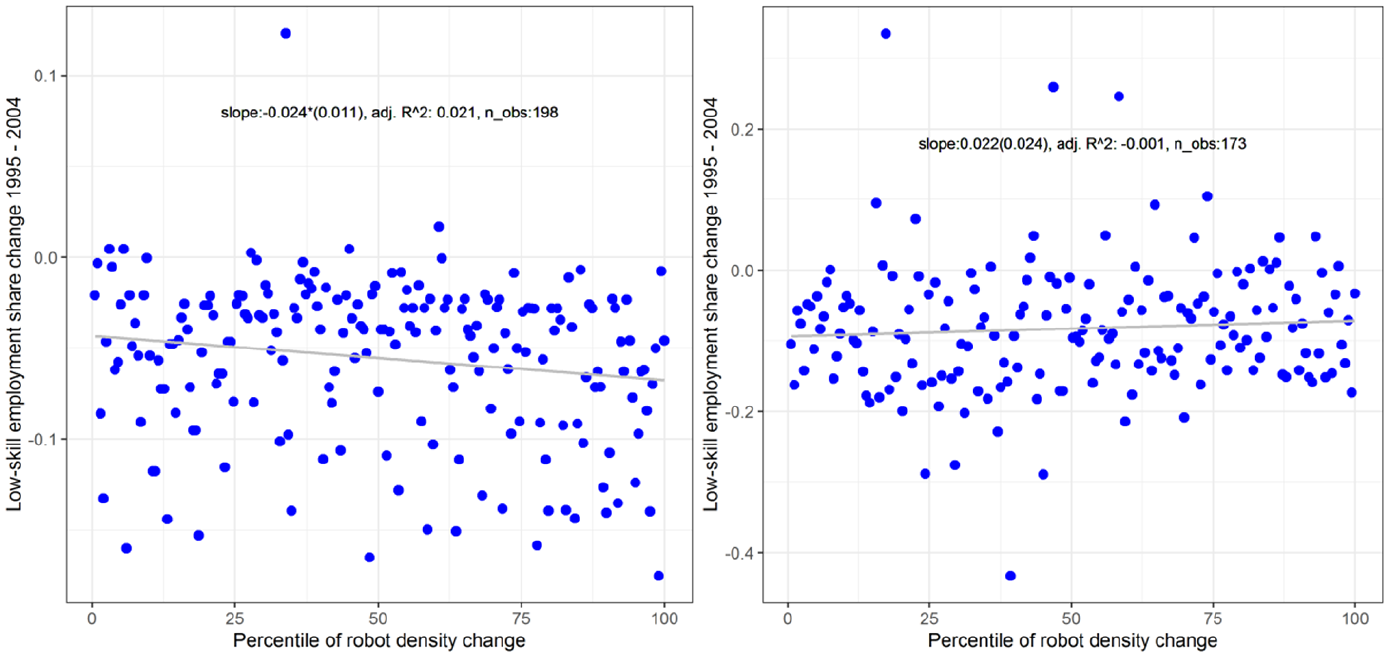
Correlation between change in robot density and change in low-skill employment share (1995–2004).
While our results indicate a robust positive correlation between total employment and robot adoption, Graetz and Michaels (2018) do not find evidence for such a relationship. This case is a bit more complicated, since the differences arise from more than one factor. In fact, there are four factors to consider, with the first two having the largest impact. First, Graetz and Michaels (2018) use the 2011 edition of EU KLEMS for data on total employment while we rely on the EU-LFS. Second, when calculating the robot density, we use employment in the year 1995 in the denominator to avoid making employment endogenous, while Graetz and Michaels (2018) use employment in each year in the denominator. The third and fourth factors concern their choices to weigh robot densities by their within-country share of total employment and to include non-manufacturing sectors and countries with almost no robots. Still, when using data from KLEMS 2011, we demonstrate how relaxing each of these differing assumptions leads us from finding no significant correlation to finding a significant positive correlation, even when using the exact same data as Graetz and Michaels (2018). The main process is summarised in Figure 6. In our view, our approach in each of these four factors is more adequate for a correct assessment of the impact of robots on employment.
Correlation between change in robot density and change in total employment (1995–2007).
Conclusion
In the recent literature, there has been a heated debate about whether increased use of robots has a detrimental effect on employment and, in particular, on low-skill employment. This debate has even reached public opinion and policy circles where the general tone has been rather pessimistic, stressing the potential of robots to replace workers. This article critically assesses this hypothesis using panel data on the deployment of robots in European manufacturing and employment by skill level over the last two and a half decades.
We find a positive correlation between recent robot adoption in Europe and total employment for a wide range of specifications. For the period 1995–2017, our results demonstrate that moving from one percentile in the robot density distribution to the next is associated with an increase of 0.44 (+/− 0.10)% in total employment. In relative terms, the result can be interpreted as one additional robot per 1000 workers being associated with an increase of 1.24 (+/− 0.16)% in total employment. Regarding low-skill employment, we do not find evidence for the hypothesis that industrial robots reduce the share of low-skill employment after controlling for other factors such as country-sector- and time-fixed effects, capital/labour ratios and (ICT and total) capital formation.
While these results are well within the range of absolute values reported in the literature (see, for example, Acemoglu and Restrepo, 2020; Borjas and Freeman, 2019: Chiacchio et al., 2018), they do not concur with the popular narrative of robots destroying jobs on a large scale. By contrast, our results demonstrate that country–sector pairs that have high levels of automation have been more resilient to the ongoing decline in manufacturing, especially in terms of employment. Moreover, this suggests that powerful demand effects might be at play that ensure employment growth, despite labour-saving technical progress (Bessen, 2019). Therefore the current debate about industrial robots increasing inequality might be misleading (see also Mishel and Bivens, 2017).
Previous studies on this topic generally fall into two camps. The first camp uses robot and employment data at the country-sector level and generally finds negative or no effects of robots on total employment and negative effects on low-skill employment. The second camp uses micro-economic data and generally finds a positive or neutral effect of robot adoption on total employment, as well as on low-skill employment at the firm level. Our analysis belongs to the first camp in terms of data and methods, but deviates from most other studies of that camp in terms of estimation outcomes. This difference is mainly a consequence of using a different data source on employment by skill level, a longer time series, the way we determine the robot density indicator and the fact that in our benchmark case we only analyse manufacturing sectors, since these are the sectors that employ the overwhelming majority of robots.
As usual in the literature on robots and employment, there are some caveats to our results. First, we use a dataset on industrial robots. An industrial robot is a relatively established technology, which mostly relies on reprogrammable mechanical arms being able to move in three dimensions and which is generally used for tasks such as handling, welding and moulding. Second, data availability is a general problem when it comes to analysing the effect of new technologies such as AI, robots or similar technologies on society, and industrial robots are just a rough approximation of such a technology (Frank et al., 2019; Raj and Seamans, 2018). However, data availability reflects economic relevance to some extent, and while some of these new technologies may have an enormous disruptive potential, there is not much evidence yet supporting any large-scale effects. Third, the positive correlation we find between robot adoption and total employment has to be interpreted against the backdrop of a contracting manufacturing sector in Europe. Our results imply that national industries with a higher robot adoption tend to be more resilient in terms of employment than the rest. This contradicts the idea that industrial robots are replacing workers on any significant scale, but it should not be understood either as proof that robot adoption is causally linked to employment growth. Fourth, using aggregate data, we only look at net effects of robotisation. It would be highly interesting to use more granular data to determine winners and losers of robotisation, for example by controlling for gender and age. This would allow an analysis of whether robotisation leads to early retirement, similar to existing literature on the effects of technological change (Ahituv and Zeira, 2011; Yashiro et al., 2021).
There is no doubt that robots have an effect on how we work and live that will likely increase over the coming decades. However, our results demonstrate that, in the case of industrial robots, their impact on employment has been mostly positive (or neutral, in the case of low-skill employment). Taken together with findings from the literature showing that industrial robots have increased productivity (Graetz and Michaels, 2018; Jungmittag and Pesole, 2019), the benefits of this specific technology seem to outweigh its potential costs. This implies that policy makers should think twice before implementing regulations that could potentially curb industrial robot use, such as specific taxes on robots. Nevertheless, the effects are relatively small, so current evidence would not justify a policy intervention in favour of industrial robots either. Moreover, our findings do not support the demands for a universal basic income to compensate for massive job losses caused by industrial robots (Hoynes and Rothstein, 2019). However, in order to assess the final impact of these robots on inequality and to go beyond the net effects derived in this article, we would need to do the same type of analysis with an EU-wide micro-level panel dataset on robot deployment (which, to our knowledge, does not exist), and to discuss issues such as ownership structures and tax systems, which goes beyond the scope of this article.
Footnotes
Appendix A: Additional estimations
The effects of robot density percentile on high-skill employment share (1995–2017).
| (1) | (2) | (3) | (4) | (5) | (6) | |
|---|---|---|---|---|---|---|
| Percentile of robot density | 0.000 (0.000) |
0.003** (0.000) |
0.000 (0.000) |
–0.001 (0.000) |
–0.001 (0.000) |
–0.001 (0.000) |
| Capital/labour ratio | 0.078 |
0.079 |
0.075 |
|||
| Gross fixed capital formation | 0.000 |
|||||
| ICT capital share | –0.039 |
|||||
| Country-sector-fixed effects | ✓ | ✓ | ✓ | ✓ | ✓ | |
| Time-fixed effects | ✓ | ✓ | ✓ | ✓ | ||
| Adj. R2 | 0.001 | 0.838 | 0.903 | 0.889 | 0.889 | 0.889 |
| No. of observations | 2567 | 2567 | 2567 | 1872 | 1872 | 1872 |
Notes: Pooled OLS, yearly data, only manufacturing sectors. Results of regressing the low-skill employment share on robot density percentile. Standard errors clustered at the country-sector level are displayed in parentheses. ** significant at the 1% level.
Source: Authors’ analysis from World Robotics database, EU-LFS and EU KLEMS.
Appendix B: Robustness checks
The effects of robot density percentile on low-skill employment shares (accounting for different country groups, 1995–2017).
| (3a) | (3b) | |
|---|---|---|
| Percentile of robot density | 0.001** (0.000) |
0.001** (0.000) |
| North*(Percentile of robot density) | –0.001 |
|
| South*(Percentile of robot density) | –0.002** |
|
| Periphery*(Percentile of robot density) | –0.002** |
|
| Country-sector-fixed effects | ✓ | ✓ |
| Time-fixed effects | ✓ | ✓ |
| Adj. R2 | 0.944 | 0.942 |
| No. of observations | 2567 | 2567 |
Notes: This table is equivalent to column 3 in Table 2 in the main manuscript but is using country group dummies for core and periphery in specification (3a) and for central, north and south in specification (3b).The coefficient in the row Percentile of robot density gives the effect of robotisation in the reference region: core in specification (3a) and central in specification (3b). The coefficients for north, south and periphery then indicate the incremental change from the reference region. Standard errors clustered at the country-sector level are displayed in parentheses. ** significant at the 1% level.
Source: Authors’ analysis from World Robotics database, EU-LFS and EU KLEMS.
Appendix C: Descriptive statistics and sector classification
Sector classification.
| Sector code | Sector description | Components |
|---|---|---|
| A | Agriculture, forestry and fishing | A |
| B | Mining and quarrying | B |
| D–E | Electricity, gas and water | D, E |
| F | Construction | F |
| P | Education | P |
| 10–12 | Food, drink and tobacco | 10, 11, 12 |
| 13–15 | Textiles | 13, 14, 15 |
| 16–18 | Wood, paper and printing | 16, 17, 18 |
| 19–21 | Fossil fuels, chemicals and pharmaceuticals | 19, 20, 21 |
| 22–23 | Rubber, plastic and mineral products | 22, 23 |
| 24–25 | Metal products (excl. machines) | 24, 25 |
| 26–27 | Computer, electronic and electrical equipment | 26, 27 |
| 28 | Machinery and equipment | 28 |
| 29–30 | Automotive | 29, 30 |
Notes: Sector classification based on NACE Rev. 2. We had to aggregate some sectors to either ensure consistency over the change in NACE classifications in 2007/8 or for consistency between different data sources.
Appendix D: Robots and employment at the sectoral level
Acknowledgements
We thank John Hurley, Andre Jungmittag, Miguel Ángel Malo, Robert Marschinski, Rafael Muñoz de Bustillo, Anna Naszodi and Songül Tolan for helpful comments on an earlier draft of this article. We further thank Anna Atkinson for excellent comments and proofreading.
Declaration of conflicting interests
The authors declared no potential conflicts of interest with respect to the research, authorship, and/or publication of this article.
Funding
José-Ignacio Antón gratefully acknowledges the financial support from Ramón Areces Foundation Grants for Research Projects in Social Sciences (17th edition).
Disclaimer
The content of this article does not reflect the official opinion of the European Commission. Responsibility for the information and views expressed in the article lies entirely with the authors.