
Abstract
Accurately predicting Energy Use Intensity (EUI) has become increasingly important in efforts to enhance energy efficiency and sustainability in buildings. This study aims at comparing the performance of three machine learning approaches, namely, Baseline Ensemble, Auto Hyperparameter Optimized Ensemble and Bayesian Optimized Ensemble, using real world sensor data collected from four zones of a university building in Thailand via a Building Energy Management System. The models are tested on both un-normalized and min-max normalized datasets to examine how data preprocessing influences prediction accuracy, error reduction, and training efficiency. The results of the study demonstrate that normalization improves prediction precision by significantly reducing mean absolute error and mean squared error values, although it has a limited effect on R2 values. Among the three approaches, the Bayesian Optimized model trained on normalized data provides the most accurate and stable results while maintaining reasonable training times. These results highlight the practical value of integrating normalization and automated tuning when designing building energy models. The proposed Least Squares Boosting (LSBoost) – Bayesian Optimization model in the study offers a reliable and adaptable tool for forecasting Energy Use Intensity, with potential applications in real-time control, diagnostics, and long-term energy planning.
Practical application
This study presents a robust, data-driven framework for accurately forecasting Energy Use Intensity (EUI) in real-world building operations using Bayesian-optimized LSBoost models. By integrating indoor sensor data, external weather variables, and advanced machine learning, the proposed method supports energy managers, building operators, and HVAC control engineers in enhancing predictive maintenance, operational efficiency, and real-time energy management. The approach is particularly suited for smart building systems and retrofitting strategies that require scalable, accurate, and resource-efficient energy modeling under variable occupancy and environmental conditions.
Keywords
Introduction
Research background and motivation
Building operations contribute to 30% of the world’s final energy consumption and 26% of global carbon emissions, highlighting the importance of improving energy efficiency in buildings as a key measure in addressing climate change. 1 Therefore, the International Energy Agency (IEA), has recognized the building sector as one of the most economical areas for cutting energy use and issued 25 policy recommendations targeting to improve energy efficiency and decrease CO2 emissions. 2 Hence, it is no surprise that three out of the 17 United Nation’s Sustainable Development Goals (SDGs), namely SDG 7: Affordable and Clean Energy, SDG 11: Sustainable Cities and Communities and SDG 12: Responsible Consumption and Production are directly related to the promotion of energy efficiency and sustainability in the building sector.3,4 Predicting building energy consumption is fundamentally presented as a strategy for conserving energy and enhancing decision making to reduce overall energy use in the literature.5,6
Building energy performance refers to the efficiency with which a structure consumes energy, and one of its most widely recognized indicators is Energy Use Intensity (EUI). Energy Use Intensity (EUI), defined as the total annual energy consumption per unit of gross floor area (kWh/m2/year), is widely adopted as a standardized metric to evaluate and compare the energy efficiency of buildings across different types and sizes. 7 EUI is not only an internal performance metric but also plays a significant role in ensuring regulatory compliance and achieving recognized sustainability standards. Increasingly mandated by jurisdictions and referenced in benchmarking systems, EUI serves as a foundational metric for retrofit planning, design optimization, and policy compliance. 8 Accurate EUI data enables building owners and managers to benchmark performance, identify improvement areas, and evaluate the effectiveness of energy saving initiatives.9–12 Predicting EUI involves accounting for a range of building specific and operational variables. Energy performance is influenced not only by heating, ventilation and air conditioning (HVAC), lighting, and plug loads, but also by broader environmental and behavioral factors, including user demographics, financial conditions, building design features, local climate, and operational energy characteristics, all of which interactively affect overall building energy consumption. 13 Temperature is particularly recognized as a reliable predictor for HVAC demand across various building types, with heating and cooling loads correlating strongly to indoor-outdoor thermal variances.14,15 Solar radiation and humidity further modulate thermal loads, the former significantly influencing lighting energy demand as well. Thus, their inclusion in data sets enhances predictive accuracy.15–17
Energy performance is shaped by a complex interplay of physical, mechanical, meteorological, and behavioral systems. 18 Occupancy, in particular, plays a pivotal role in influencing both thermal and nonthermal loads. Lighting and plug loads are especially sensitive to occupant presence and behavior. Studies suggest that occupancy schedules drive lighting usage patterns, while occupant driven activities account for a significant portion of plug load consumption in office buildings.19,20 Additionally, the development of occupant related schedules contributes to modeling precision by aligning simulations with real world behavioral patterns.21,22 However, modeling these effects remains challenging due to the unpredictable and interdependent nature of usage patterns.21,23 Discrepancies between predicted and measured energy use persist due to factors such as inaccurate modeling assumptions, diversity of end use behaviors and variations in occupancy. Uncertainties in material properties and construction practices can also contribute to these discrepancies.24,25 Moreover, energy models employed during the design phase often fail to reflect actual operational performance once the building is in use. 26 This gap between values underlines the importance of using multiple, data rich predictors and accounting for temporal patterns through daily load profiles and correlated environmental data.17,19,20,23 Data variability and the lack of sufficiently detailed measurement data further complicate reliable modeling efforts.27,28 In practice, measured energy consumption can differ substantially from predicted values, sometimes by several multiples. 26
To summarize, accurate prediction of EUI remains challenging due to the influence of various factors such as climatic variation, occupant behavior, building typologies, data availability, and the natural variability in building energy performance. 26 These challenges underline the limitations of conventional modeling techniques and emphasize the need for more advanced, data-driven approaches to bridge the building energy performance gap. In this context, interpretability and accountability of machine learning models are not only highly desirable but also increasingly demanded, as they enhance transparency and trust in data-driven decision-making within the field of building energy consumption. 29
In their study, Ciampi et al. 30 propose analyzing prediction techniques across three categories: conventional, artificial intelligence (AI)-based, and hybrid models. Their study emphasizes that while conventional models offer ease of implementation, their performance tends to decrease in the presence of nonlinear relationships. In contrast, AI-based models are capable of addressing such complexities more effectively, however with increased computational complexity and greater data requirements. Similarly, hybrid modeling approaches may achieve superior predictive performance but necessitate more sophisticated methodologies.30–33 Given these tradeoffs, the characteristics of the available dataset and the compatibility between data and selected prediction methods are critical factors in enhancing overall prediction accuracy. Therefore, selecting an appropriate method using a comparative analysis of multiple approaches can provide a significant advantage in achieving more reliable predictions. For energy performance prediction of buildings, these considerations are particularly relevant, as traditional methods can be time consuming and require extensive manual analysis. On the other hand, machine learning based models are distinguished by their ability to learn more complex relationships. Therefore machine learning models, or referring to Ciampi et al.’s classification, AI-based models and hybrid models offer a powerful alternative, enabling dynamic energy management through the efficient processing of large datasets.34,35
This study investigates the prediction of Energy Use Intensity (EUI) using Regression Ensemble Trees trained with the Least-Squares Boosting (LSBoost) algorithm. It specifically explores the impact of three different optimization strategies—namely, non-optimized, auto hyperparameter optimized, and Bayesian optimized LSBoost ensembles—on model performance.
The primary contribution of this study lies in addressing a notable research gap: while ensemble methods and boosting algorithms have been increasingly applied to building energy prediction, the integration of Bayesian optimization with LSBoost for EUI prediction has not been systematically explored. By benchmarking this approach against traditional and automated hyperparameter tuning methods, this work contributes new empirical evidence on its performance advantages and generalization capabilities. Furthermore, the study offers insights into how feature normalization affects model performance when dealing with mixed-scale building datasets, providing guidance for future data-driven energy modeling frameworks.
To this end, the study is guided by the following research questions: (1) Can Bayesian optimization enhance the predictive accuracy of LSBoost ensembles for EUI prediction? (2) How does feature normalization influence model performance under different optimization schemes?
The investigation uses a publicly available dataset—CU-BEMS—containing energy consumption and environmental measurements from the Chamchuri five building at Chulalongkorn University in Bangkok, Thailand. 36 The findings provide insights into the impact of feature scaling and model optimization on EUI prediction, offering guidance for data-driven energy performance assessments in similar commercial building types.
Literature review
Machine learning (ML) is a widely adopted and powerful tool for prediction tasks across various domains, primarily due to its capacity to model complex, nonlinear relationships in data.34,37,38 For building energy performance prediction, a range of ML algorithms are commonly used, including linear regression (LR), neural networks (NN), decision trees (DT), random forests (RF), K-nearest neighbors (KNN), gradient boosting (GB), and support vector regression (SVR).38–43 Deep learning models such as recurrent neural network (RNN), long short-term memory (LSTM), gated recurrent unit (GRU) are also applied for energy forecasting purposes.44–47
Traditional regression models, such as linear regression, require assumptions about the underlying data distribution, which limits their flexibility. In contrast, machine learning based regression approaches can learn more complex and nonlinear relationships without these constraints, making them more suitable for energy modeling tasks. 48 Each algorithm offers unique strengths: decision trees generate interpretable, rule based predictions by partitioning data based on informative features; neural networks, inspired by biological neurons, capture highly complex patterns through interconnected layers; and linear regression remains valuable when relationships among variables are predominantly linear. Among these approaches, tree-based methods, such as decision trees, random forests, and gradient boosting, are particularly notable for their robustness to heterogeneous data and their balance between predictive accuracy and interpretability. Numerous studies have confirmed their effectiveness in energy forecasting applications.38–42
Ensemble learning is a modeling framework that integrates multiple individual models to produce superior predictions by utilizing their collective strengths. 49 It mitigates the weaknesses of individual models, reducing both variance and bias, and ultimately improving generalization of data. 50 Ensemble methods are typically categorized into bagging, boosting, and stacking.51,52 Bagging, exemplified by random forests, reduces variance by averaging predictions across multiple models trained on different data subsets. Boosting methods such as Gradient Boosting, Extreme Gradient Boosting (XGBoost), Light Gradient Boosting Machine (LightGBM) and Least Squares Boosting (LSBoost), focus on sequentially correcting the errors of weak learners, thereby reducing bias. Stacking, on the other hand, combines the predictions of several base models by training a meta-learner to generate the final prediction. Each strategy employs a distinct mechanism for model aggregation, contributing to prediction accuracy, especially in complex tasks like building energy forecasting.51,52
A prominent method within ensemble learning is the application of ensemble trees, particularly through bagging techniques. Ensemble Bagging Trees (EBT) enhance prediction stability by training several decision tree models on slightly varied versions of the original dataset, created through random sampling. Their individual predictions are then combined to produce a more reliable and balanced final output.37,53 Compared to conventional decision tree methods such as Classification and Regression Trees (CART), EBT offers superior accuracy and reduced variance, making it well suited for applications requiring real-time fault detection and system monitoring.37,54
Boosting algorithms such as Gradient Boosting Decision Trees (GBDT), XGBoost, and Categorical Boosting (CatBoost) have also been widely adopted to iteratively refine model performance by emphasizing errors in previous iterations.53,55,56 Among these, LSBoost has been particularly applied to minimize squared error loss. Although LSBoost has shown promise, its specific applications in building energy prediction remain underexplored compared to more commonly used frameworks such as XGBoost and LightGBM. 53 LSBoost improves its performance by building each new model to learn from the mistakes of the ones before it, gradually making the predictions more accurate with each step. Its simplicity and effectiveness in handling regression tasks make it a suitable candidate for energy forecasting. Despite LSBoost’s potential, its performance can be sensitive to hyperparameter settings, including the number of learners, learning rate, and maximum tree depth. Therefore, hyperparameter optimization plays a critical role in achieving optimal model performance. Automated hyperparameter tuning methods such as Grid Search, Random Search, Genetic Algorithms (GA), and Particle Swarm Optimization (PSO) are commonly employed to reduce manual intervention while improving model generalization and accuracy.38,43,53,54
Bayesian models rely on Bayes’ conditional probability theory to solve classification and regression problems. These include approaches such as Naïve Bayes, Gaussian Naïve Bayes, Bayesian Networks (BNs), and Bayesian Belief Networks. While these methods are widely used in other predictive domains, they remain relatively underutilized in energy consumption forecasting. 30 Notable applications of BNs include Huang et al., 57 who applied BNs for cooling load prediction and observed comparable performance with reduced computational time compared to SVM and ANN; Soares Geraldi et al., 58 who investigated energy prediction in schools with a focus on model design; and O’Neill et al., 59 who explored building energy performance prediction while addressing discretization and uncertainty analysis. More recently, Ciampi et al. 30 used Bayesian Networks to forecast industrial HVAC energy consumption. These studies highlight the broader potential of Bayesian approaches for energy modeling, although their application is still limited compared to tree-based and boosting methods. Bayesian optimization, in particular, has emerged as a robust technique for tuning hyperparameters by balancing exploration and exploitation in the search space. It builds a probabilistic model of the objective function and uses it to select the most promising hyperparameters for evaluation. In the context of LSBoost, Bayesian optimization can significantly enhance performance by identifying optimal parameter combinations without exhaustive search. 53
Across the reviewed studies, ensemble learning consistently emerges as a promising approach for improving the prediction accuracy, robustness, and scalability of building energy models. While challenges such as increased computational complexity remain, the integration of ensemble methods with optimization algorithms provides a flexible and powerful framework for addressing the complexities of building energy data.37,38,53–55
In summary, the choice of machine learning technique for building energy prediction should be informed by the complexity of the dataset, the need for interpretability, and the required prediction accuracy. Ensemble learning approaches, especially those incorporating LSBoost with advanced hyperparameter tuning techniques, offer a compelling solution for achieving more reliable and precise energy consumption predictions.
Methodology
Data characterization and temporal patterns
The data set used in this study is the publicly available CU-BEMS dataset which includes detailed building operation data, with power consumption separately measured for individual air conditioners, lighting loads and plug loads in kW and indoor environmental measurements, namely temperature (°C), relative humidity (%), and ambient illuminance level (lux) measurements of a seven story 11,700 m2 office building, the Chamchuri five building of Chulangkorn University in Bangkok, Thailand. 60 CU-BEMS is an advanced Building Energy Management System (BEMS) developed by the Smart Grid Research Unit team in partnership with the University of Tokyo, both local and international industry collaborators, and funded by Thailand’s Ministry of Energy through the Energy Conservation Fund. 61 The entire dataset can be reached through figshare. 36 In the training of the ML models, the available data on lighting, plug and air conditioning power consumption levels, measured illuminance levels, temperature and relative humidity values for Floor 7 of the building have been utilized. Floor 7 has been selected as it is one of the floors that has the lowest amount of missing data and also being the topmost floor, it has a higher susceptibility to weather conditions, compared to lower floors. In the original data collection and presentation, different floors have been divided into different zones; for Floor 7 there are five zones available; the configuration of the zones for each floor has been meticulously explained in (Pipattanasomporn et al. 2020a). Data collection has been made on a minute basis for the power consumption in kW of a total of 7 AC units, four in Zone 1, and 1 each in Zones 2, 4 and 5; the lighting systems and the plug systems of all individual zones and the four sensors installed in each zone were used for the collection of the aforementioned indoor conditions on Floor 7. Among the five zones, Zone 3 is a circulation area including the stair cases and therefore does not include any sensors and thus has not been included in the scope of this study.
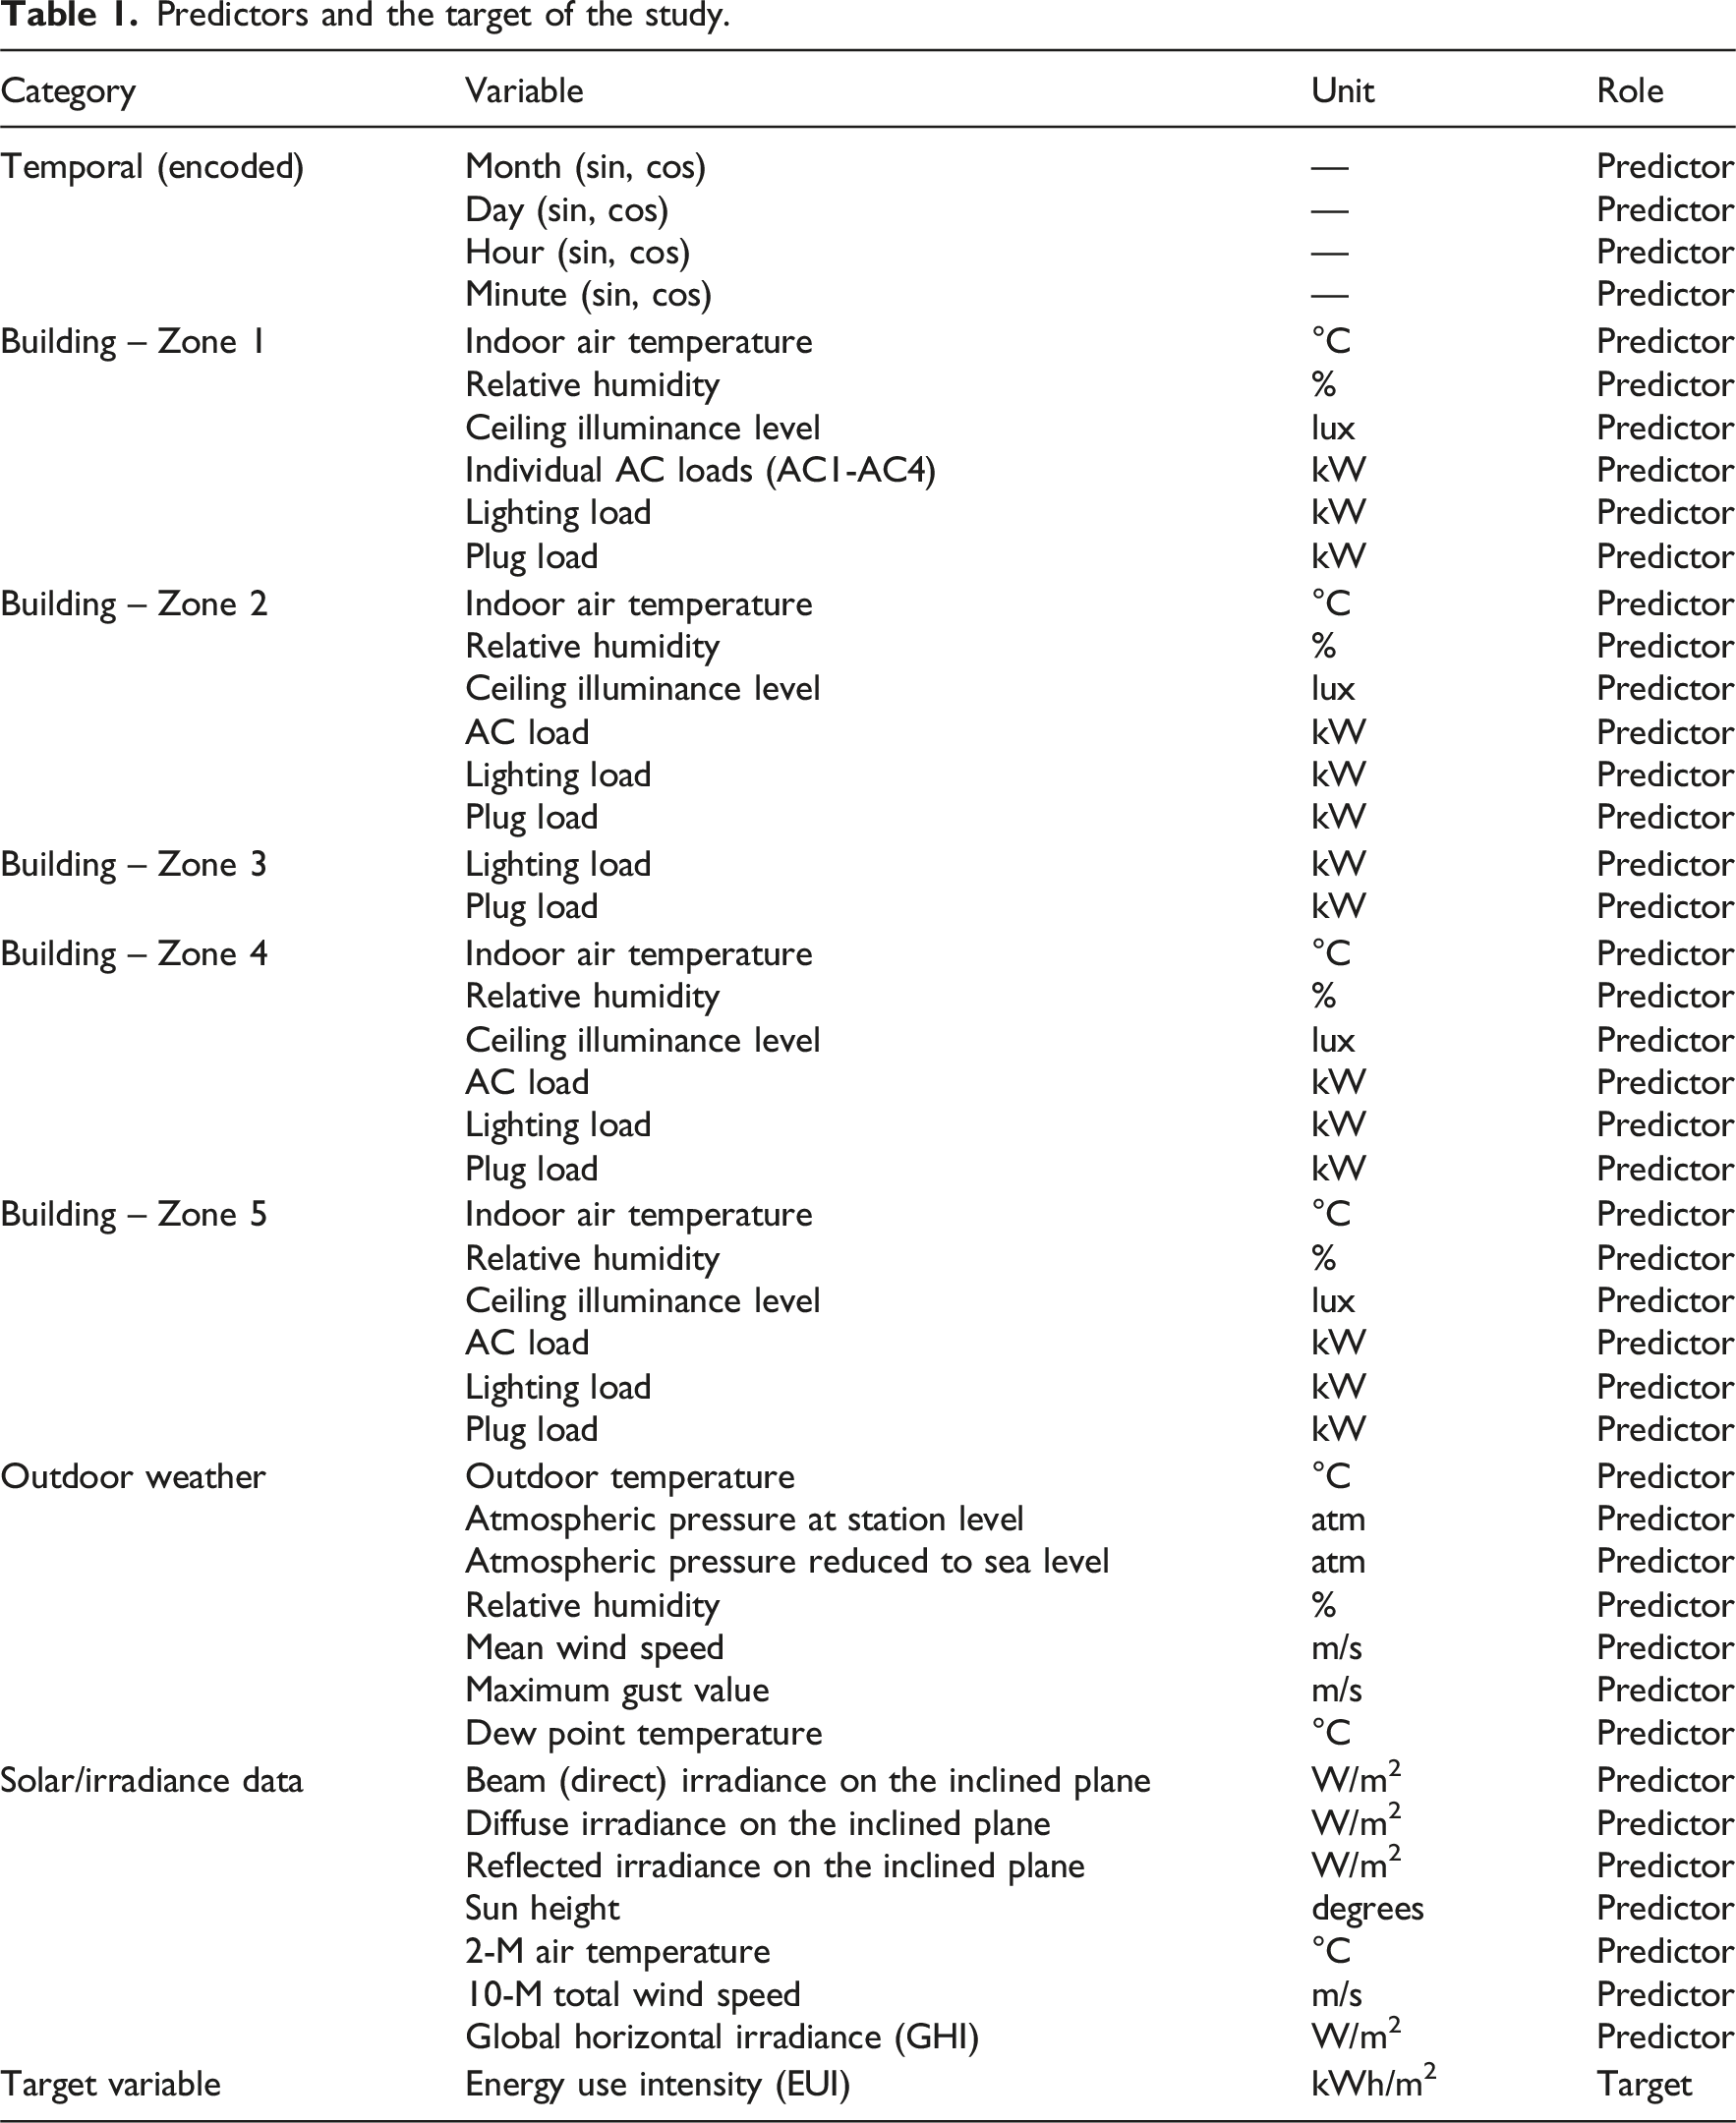
Predictors and the target of the study.
For the initial part of the study, an analysis of the data was made to grasp the general nature of the inputs in hand. The raw sensor data are recorded as power measurements (kW) at one-minute resolution. As the building is a University office building, the occupation profile is quite distinct; the building is extensively used during weekdays, sometimes on Saturdays and almost never on Sundays. A look at the weekday profiles shows specific behavioral patterns; weekdays exhibit clear peaks during typical working hours, while Saturday and Sunday profiles demonstrate reduced and more variable usage, particularly for plug loads and lighting. This separation offers a more detailed view of occupancy driven loads and supports the inclusion of temporal features in model development. Because annual EUI represents cumulative energy consumption, it may mask temporal variations in building performance, such as those associated with occupancy patterns or seasonal heating and cooling demands. As a result, complementary EUI metrics evaluated at shorter time scales—ranging from monthly and weekly to daily or hourly—are increasingly recognized as valuable for real-time energy performance assessment.
64
Therefore, for a better understanding of the utilization profile, the air conditioning (AC), lighting, plug power consumption values as well as the minute based incremental energy use intensity contributions illustrating diurnal electricity consumption patterns have been plotted for the equinox and solstice days of 2019 as representative days of seasonal profiles. The corresponding plots are given in Figures 1–4 for March 21st, June 21st, September 23rd and December 20th, respectively. As the 21st of December was a Saturday, December 20th, which is a workday, has been specifically plotted instead to be able to compare the seasonal changes more clearly. While the analysis included data from both workdays and weekends, only weekdays are presented in this manuscript due to space constraints. Power consumption for (a) AC; (b) lighting; (c) plug and; (d) incremental EUI on March 21st, 2019. Power consumption for (a) AC; (b) lighting; (c) plug and; (d) incremental EUI on June 21st, 2019. Power consumption for (a) AC; (b) lighting; (c) plug and; (d) incremental EUI on September 23rd, 2019. Power consumption for (a) AC; (b) lighting; (c) plug and; (d) incremental EUI on December 20th, 2019.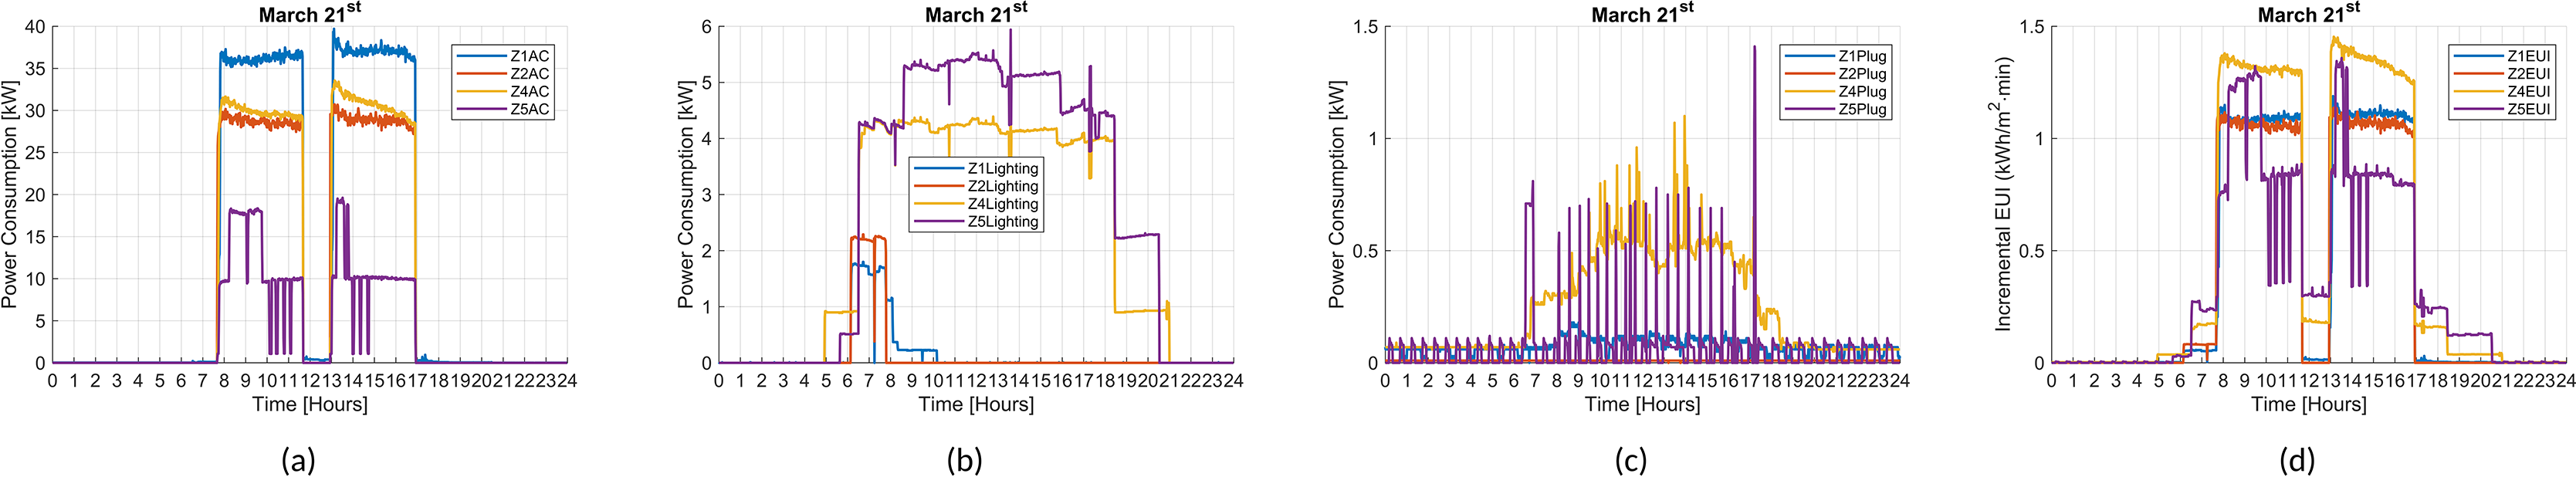
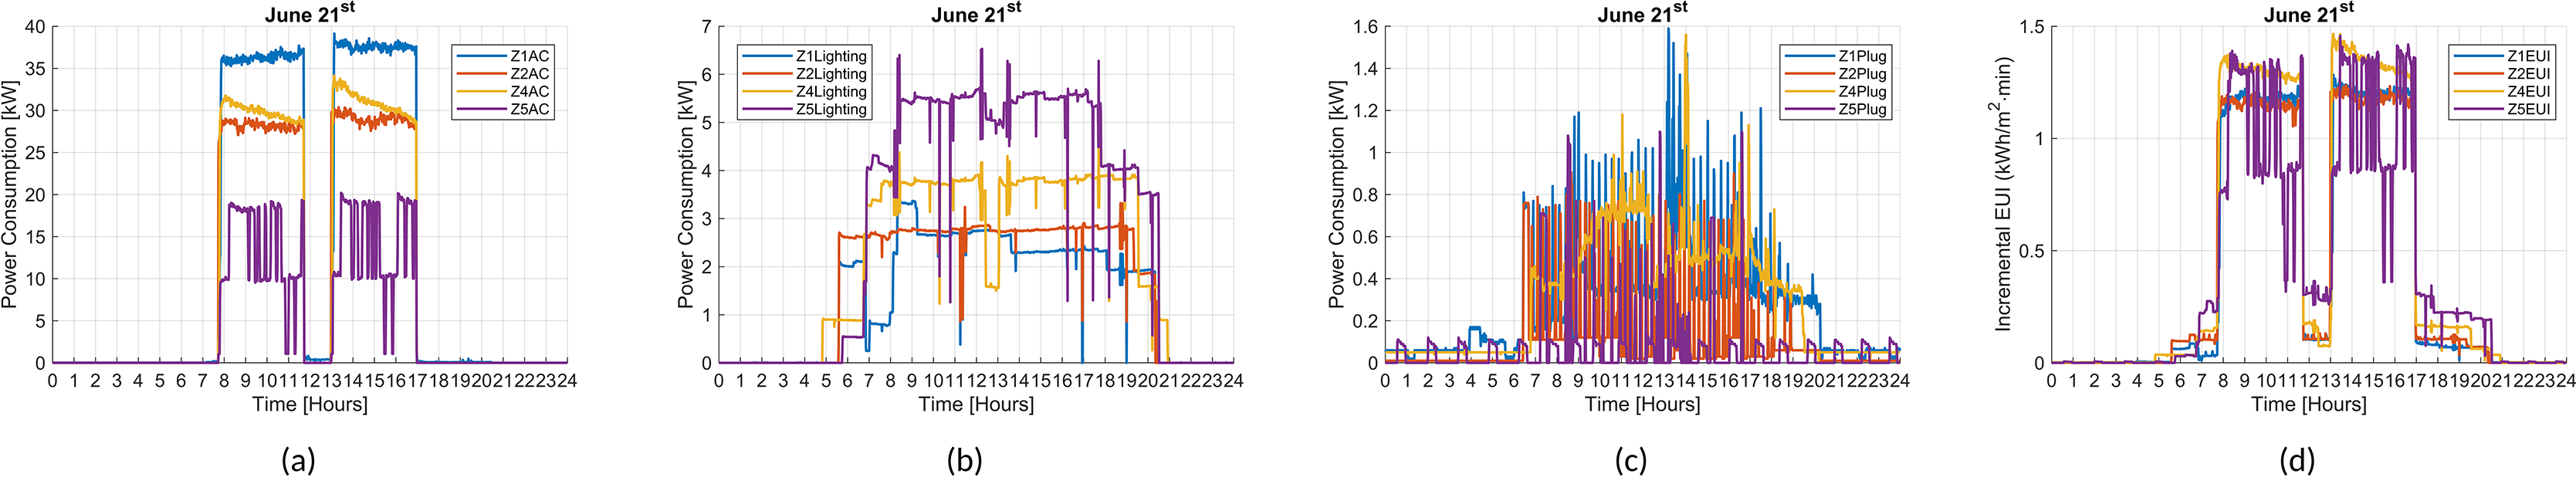
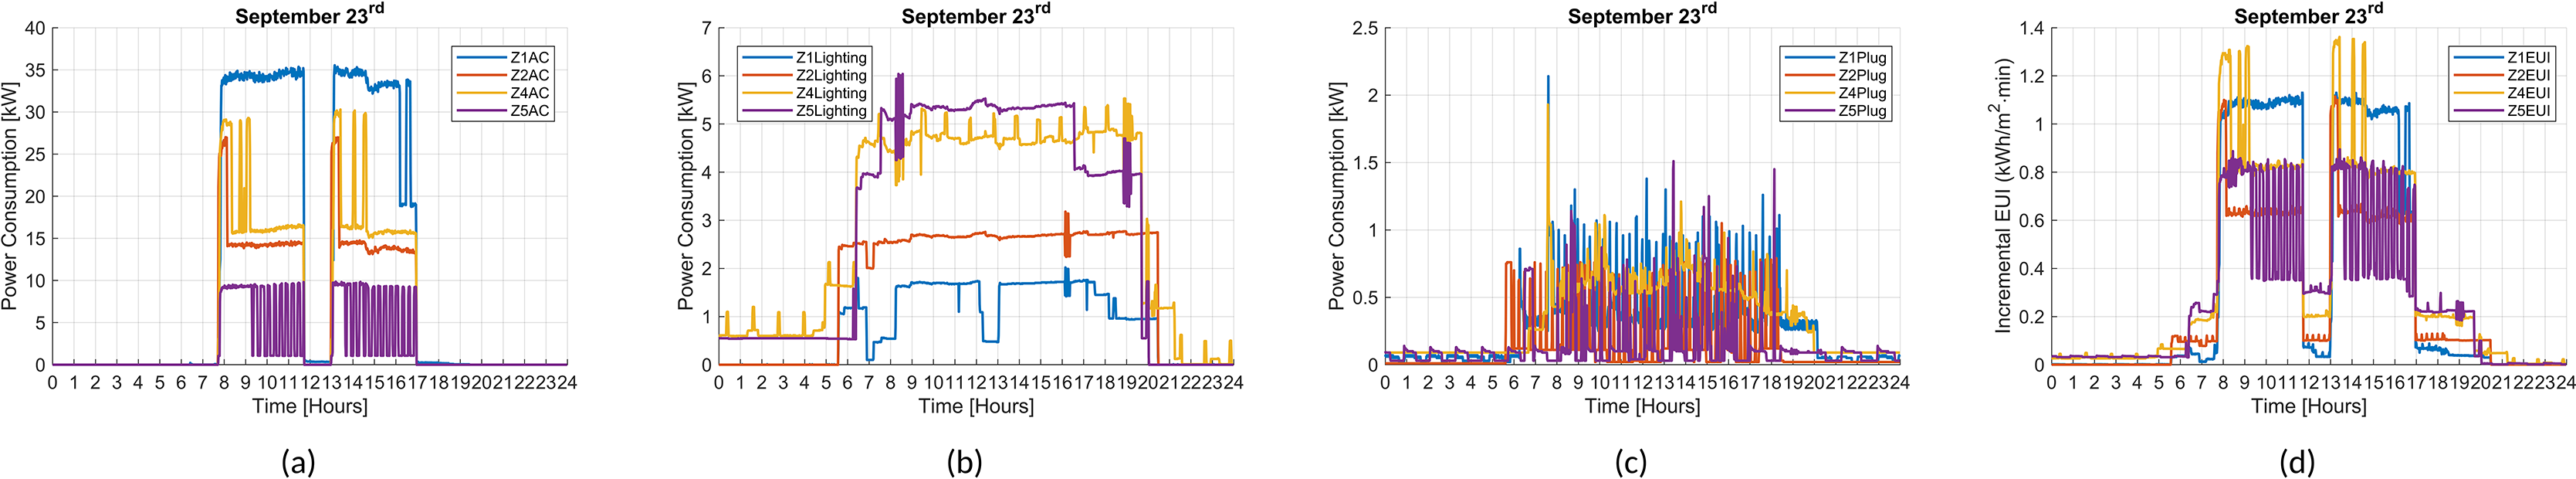
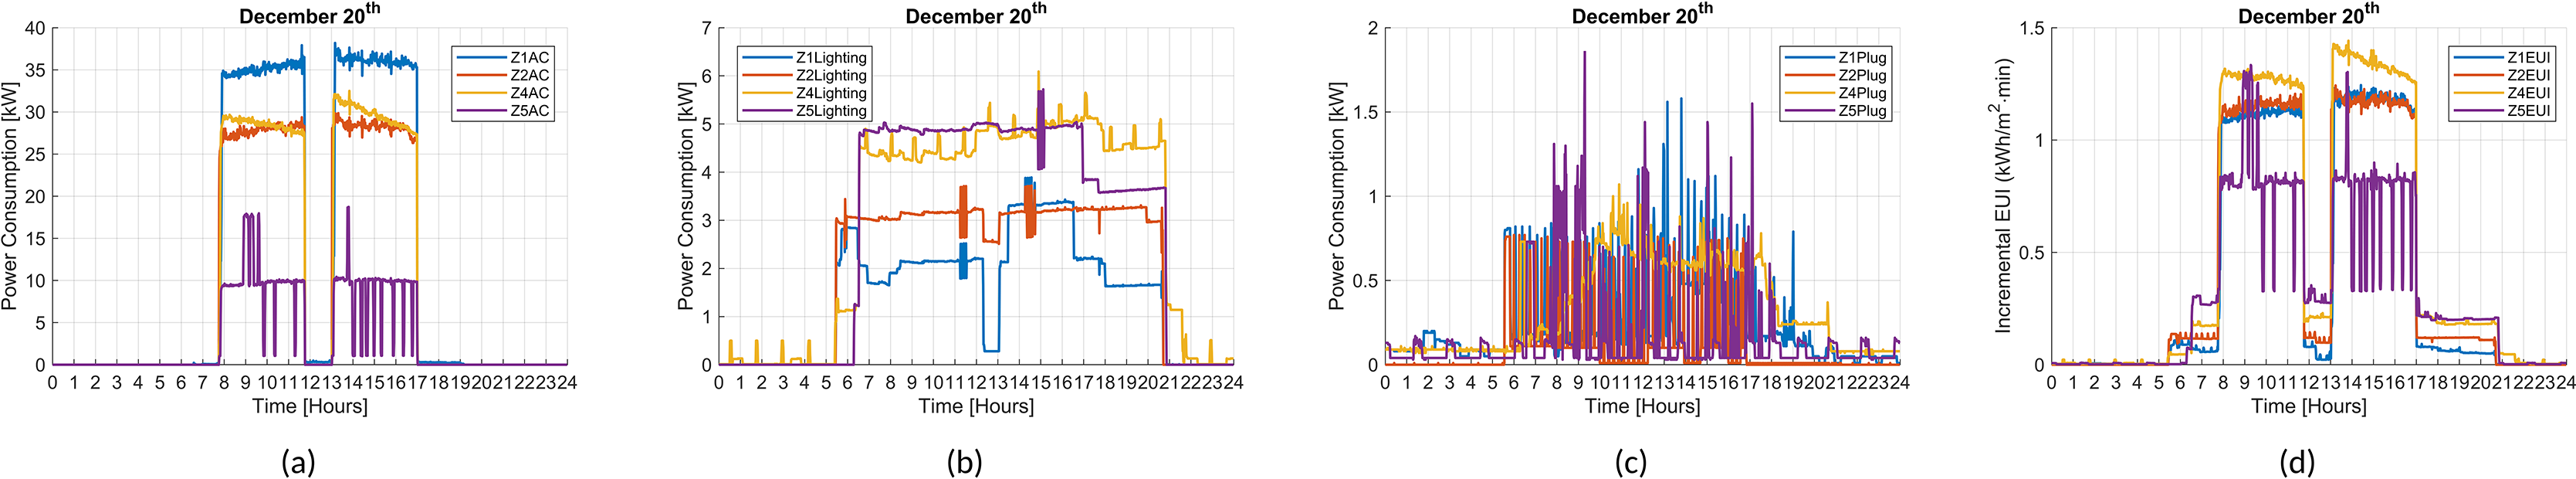
As can be seen from the figures, the three major end-use loads of the building have very distinct patterns that are quite different from each other, but similar in terms of the different dates of the year. The daily utilization appears to begin approximately around 8.00 AM, reaching full capacity during regular work hours, dropping down to nearly zero during lunchtime and ending around 17.00 PM on a regular basis when the AC consumption figures are taken into consideration. However, a look at the lighting consumption values shows that the building is actually occupied from much earlier hours of the day till the late hours of the evening, from almost 5.00 AM up till 21:00 PM. Although air conditioning, lighting, and plug loads exhibit distinct consumption profiles, each category demonstrates a consistent internal pattern across seasonally representative days throughout the year. This indicates that, despite their structural differences, each end use maintains seasonal consistency in its operation, while remaining clearly distinguishable from the others.
The highest power demand, as would be expected, is from the AC units, with Zone 1 having the largest contribution that reaches values of approximately 40 kW during the year, followed by Zones 2 and 4. The lowest power demand of AC appears to be at Zone 5, which is quite reasonable as this Zone is the smallest one with the least number of windows, meaning the least susceptibility to sunlight during the day as well. Unsurprisingly, the largest contributor for the lighting load is Zone 5, probably due to the same reason; the least number of windows and the least façade area translates into the least amount of daylight on the work plane, resulting in a higher utilization of lighting even though the Zonal area is smaller than the rest of the Zones of Floor 7. For lighting, Zone 4 closely follows Zone 5, then followed by Zone 2 and the lowest power demand is in Zone 1; the Zone with the largest façade area among all Zones. Finally for plug loads, it is difficult to make a clear distinction between the Zones as they are quite intertwined and show seasonal differences as it appears in Figures 1(c), 2(c), 3(c) and 4(c).
Given that AC systems constitute the largest portion of the total energy consumption, the EUI profile across the day exhibits a pattern that is strongly correlated with the AC load. An example of this can be seen for the values of March 21st, where both the AC consumption profile and the corresponding minute based EUI values (Figure 1(a) and (d)) demonstrate parallel fluctuations, featuring similar highs and lows across the daily cycle. However, a closer examination of zonal differences shows that the lighting and plug loads also play a significant role in shaping the EUI through intensifying the amplitude values. For instance, while Figure 1(a) shows that Zone 1 has the highest total AC load on March 21st, the EUI is highest in Zone 4 (Figure 1(d)), followed closely by Zone 5, the two zones which had the highest lighting load (Figure 1(b)). It’s not only the lighting load which contributes to the amplitude values; Figure 1(b) and (c) which present the lighting and plug load values on March 21st, respectively, clearly indicate that Zones four and five exhibit markedly higher trends in these two categories on the same day. These findings underscore the need to account for diverse end use contributions when interpreting normalized energy metrics like EUI, particularly in mixed use or variably occupied buildings. These observations will further be taken into account in the machine learning stage, through the comparison of normalized and un-normalized data use.
The machine learning approach
In this study, the predictive capabilities of the Regression Ensemble Trees framework are explored through the application of the LSBoost algorithm for EUI forecasting. LSBoost has been particularly chosen due to its balance between predictive accuracy, interpretability, and computational efficiency, making it a practical choice for modeling EUI under real world data constraints. Three modeling strategies are considered: a baseline LSBoost model without hyperparameter optimization, an LSBoost model with automated hyperparameter tuning, and an LSBoost model with hyperparameter tuning using Bayesian techniques.
During the data preprocessing stage, which was carried out using MATLAB, the first step involved computing the EUI value. The original dataset included individual power consumption values for air conditioning, lighting, and plug loads; these were aggregated and normalized to generate the final EUI value used as the target variable. The original time series data were then decomposed into year, month, day, hour, and minute components. To preserve the cyclical nature of temporal features, these attributes were transformed using sine and cosine encoding, enabling the model to capture periodic consumption patterns effectively.
The final dataset was assembled by integrating time encoded variables, indoor sensor data, and external meteorological/irradiance inputs, followed by missing value imputation via nearest neighbor interpolation. While the data of Floor 7 had one of the lowest amounts of missing data, an intervention was still necessary to complete the dataset. This comprehensive preprocessing ensured consistency and readiness of the input data for subsequent training.
The regression model was trained using Least-Squares Boosting (LSBoost), an ensemble approach that integrates multiple shallow decision trees in sequence to gradually reduce squared prediction errors. To ensure strong generalization performance and minimize potential bias caused by data partitioning, a 10-fold cross-validation scheme was applied to the dataset with 432,501 observations and 51 predictors. During validation, zone-specific predictions were generated through fold-wise inference on unseen data, allowing for a comprehensive and reliable assessment of model accuracy. The generalization metrics, expressed as the Coefficient of Determination (R2), the Mean Squared Error (MSE) and the Mean Absolute Error (MAE) across learning cycles, were computed to ensure convergence. To ensure the reliability of the trained models, prediction performance plots were examined. These visual diagnostics showed a consistent alignment between predicted and observed values across all validation folds. Overall, the ensemble model demonstrated stable and accurate generalization performance, supporting its suitability for practical applications in energy forecasting of real-world buildings.
The data obtained from the CU-BEMS dataset were un-normalized values, directly collected from the sensors within the building. As the main machine learning method was decided to be gradient boosting regression trees for this study, the initial approach was to work with the un-normalized data as decision tree systems are generally considered robust models that typically do not require extensive normalization. However, after a careful analysis of this specific dataset, it has been seen that the predictors selected for the study exhibit significant differences in amplitude. As has been explained in detail, although the target variable, EUI, tends to follow a pattern similar to that of AC consumption, its overall amplitude is influenced collectively by all consumption predictors. Therefore, it was hypothesized that normalization might help ensure a balanced contribution from each predictor. Based on this reasoning, for each zone, three distinct models were developed using both un-normalized and normalized predictor values. To obtain the normalized values, min-max scaling was used on all numeric input features to ensure uniform feature ranges across the predictors. Each proposed model was trained and validated in MATLAB, using both un-normalized and normalized datasets to assess the impact of normalization on predictive accuracy and computational efficiency.
Results
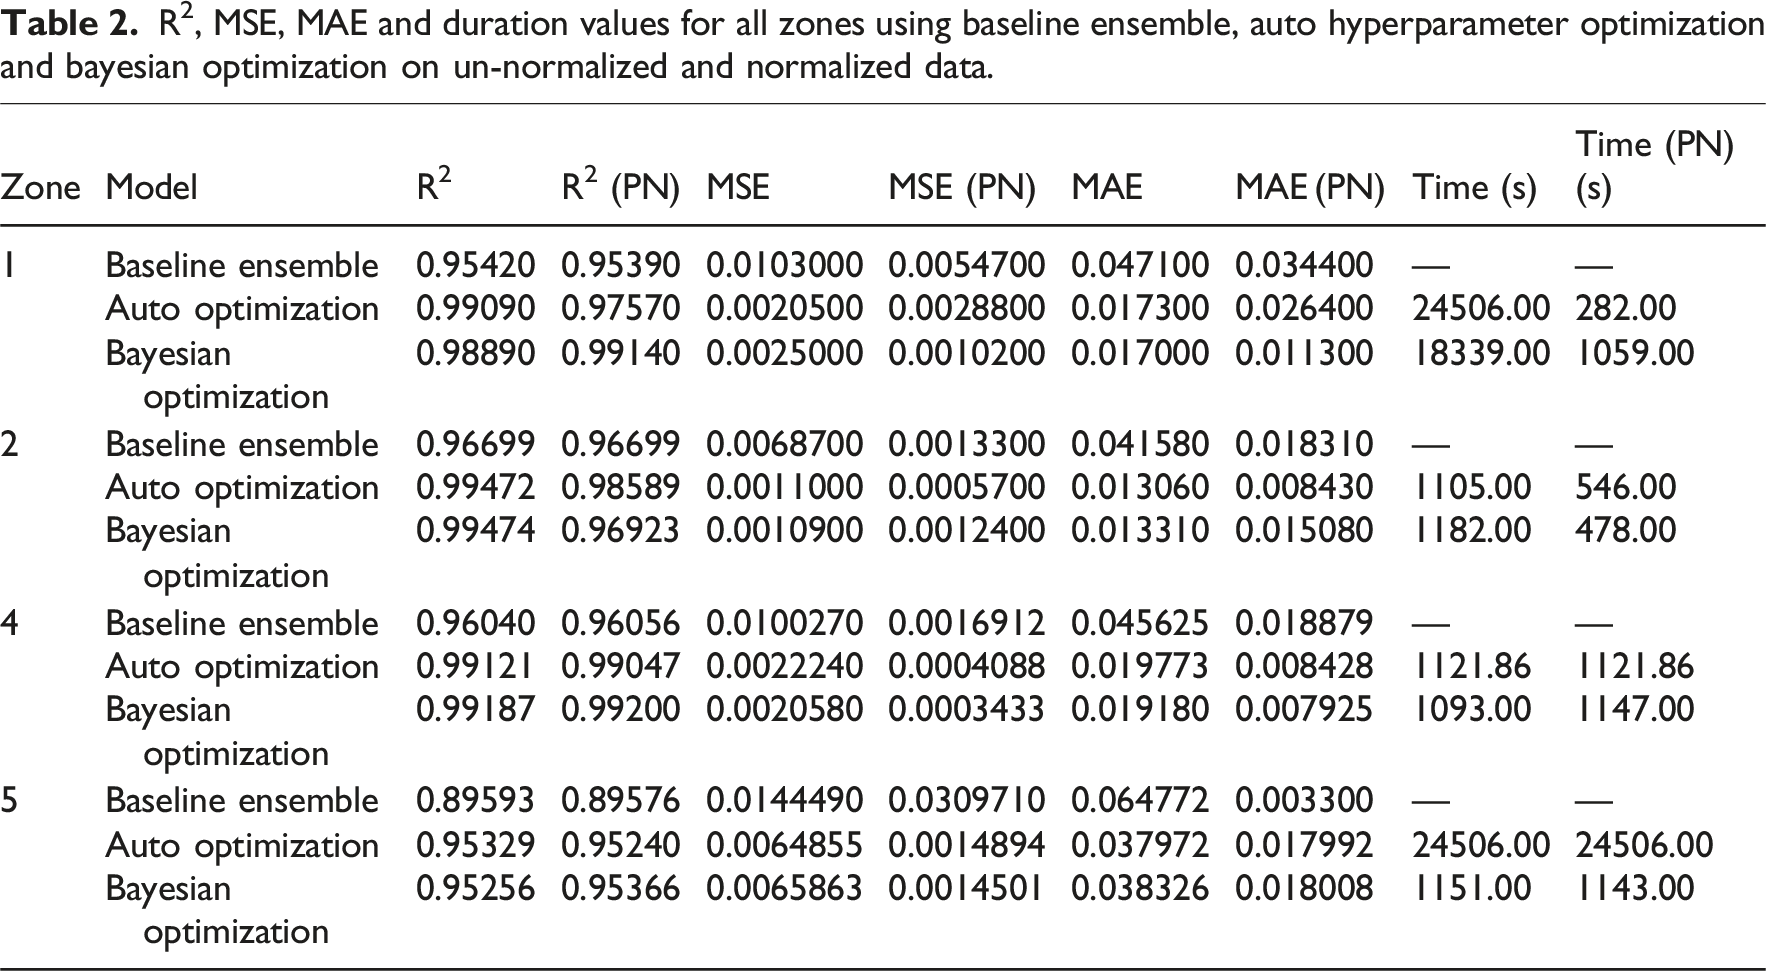
R2, MSE, MAE and duration values for all zones using baseline ensemble, auto hyperparameter optimization and bayesian optimization on un-normalized and normalized data.
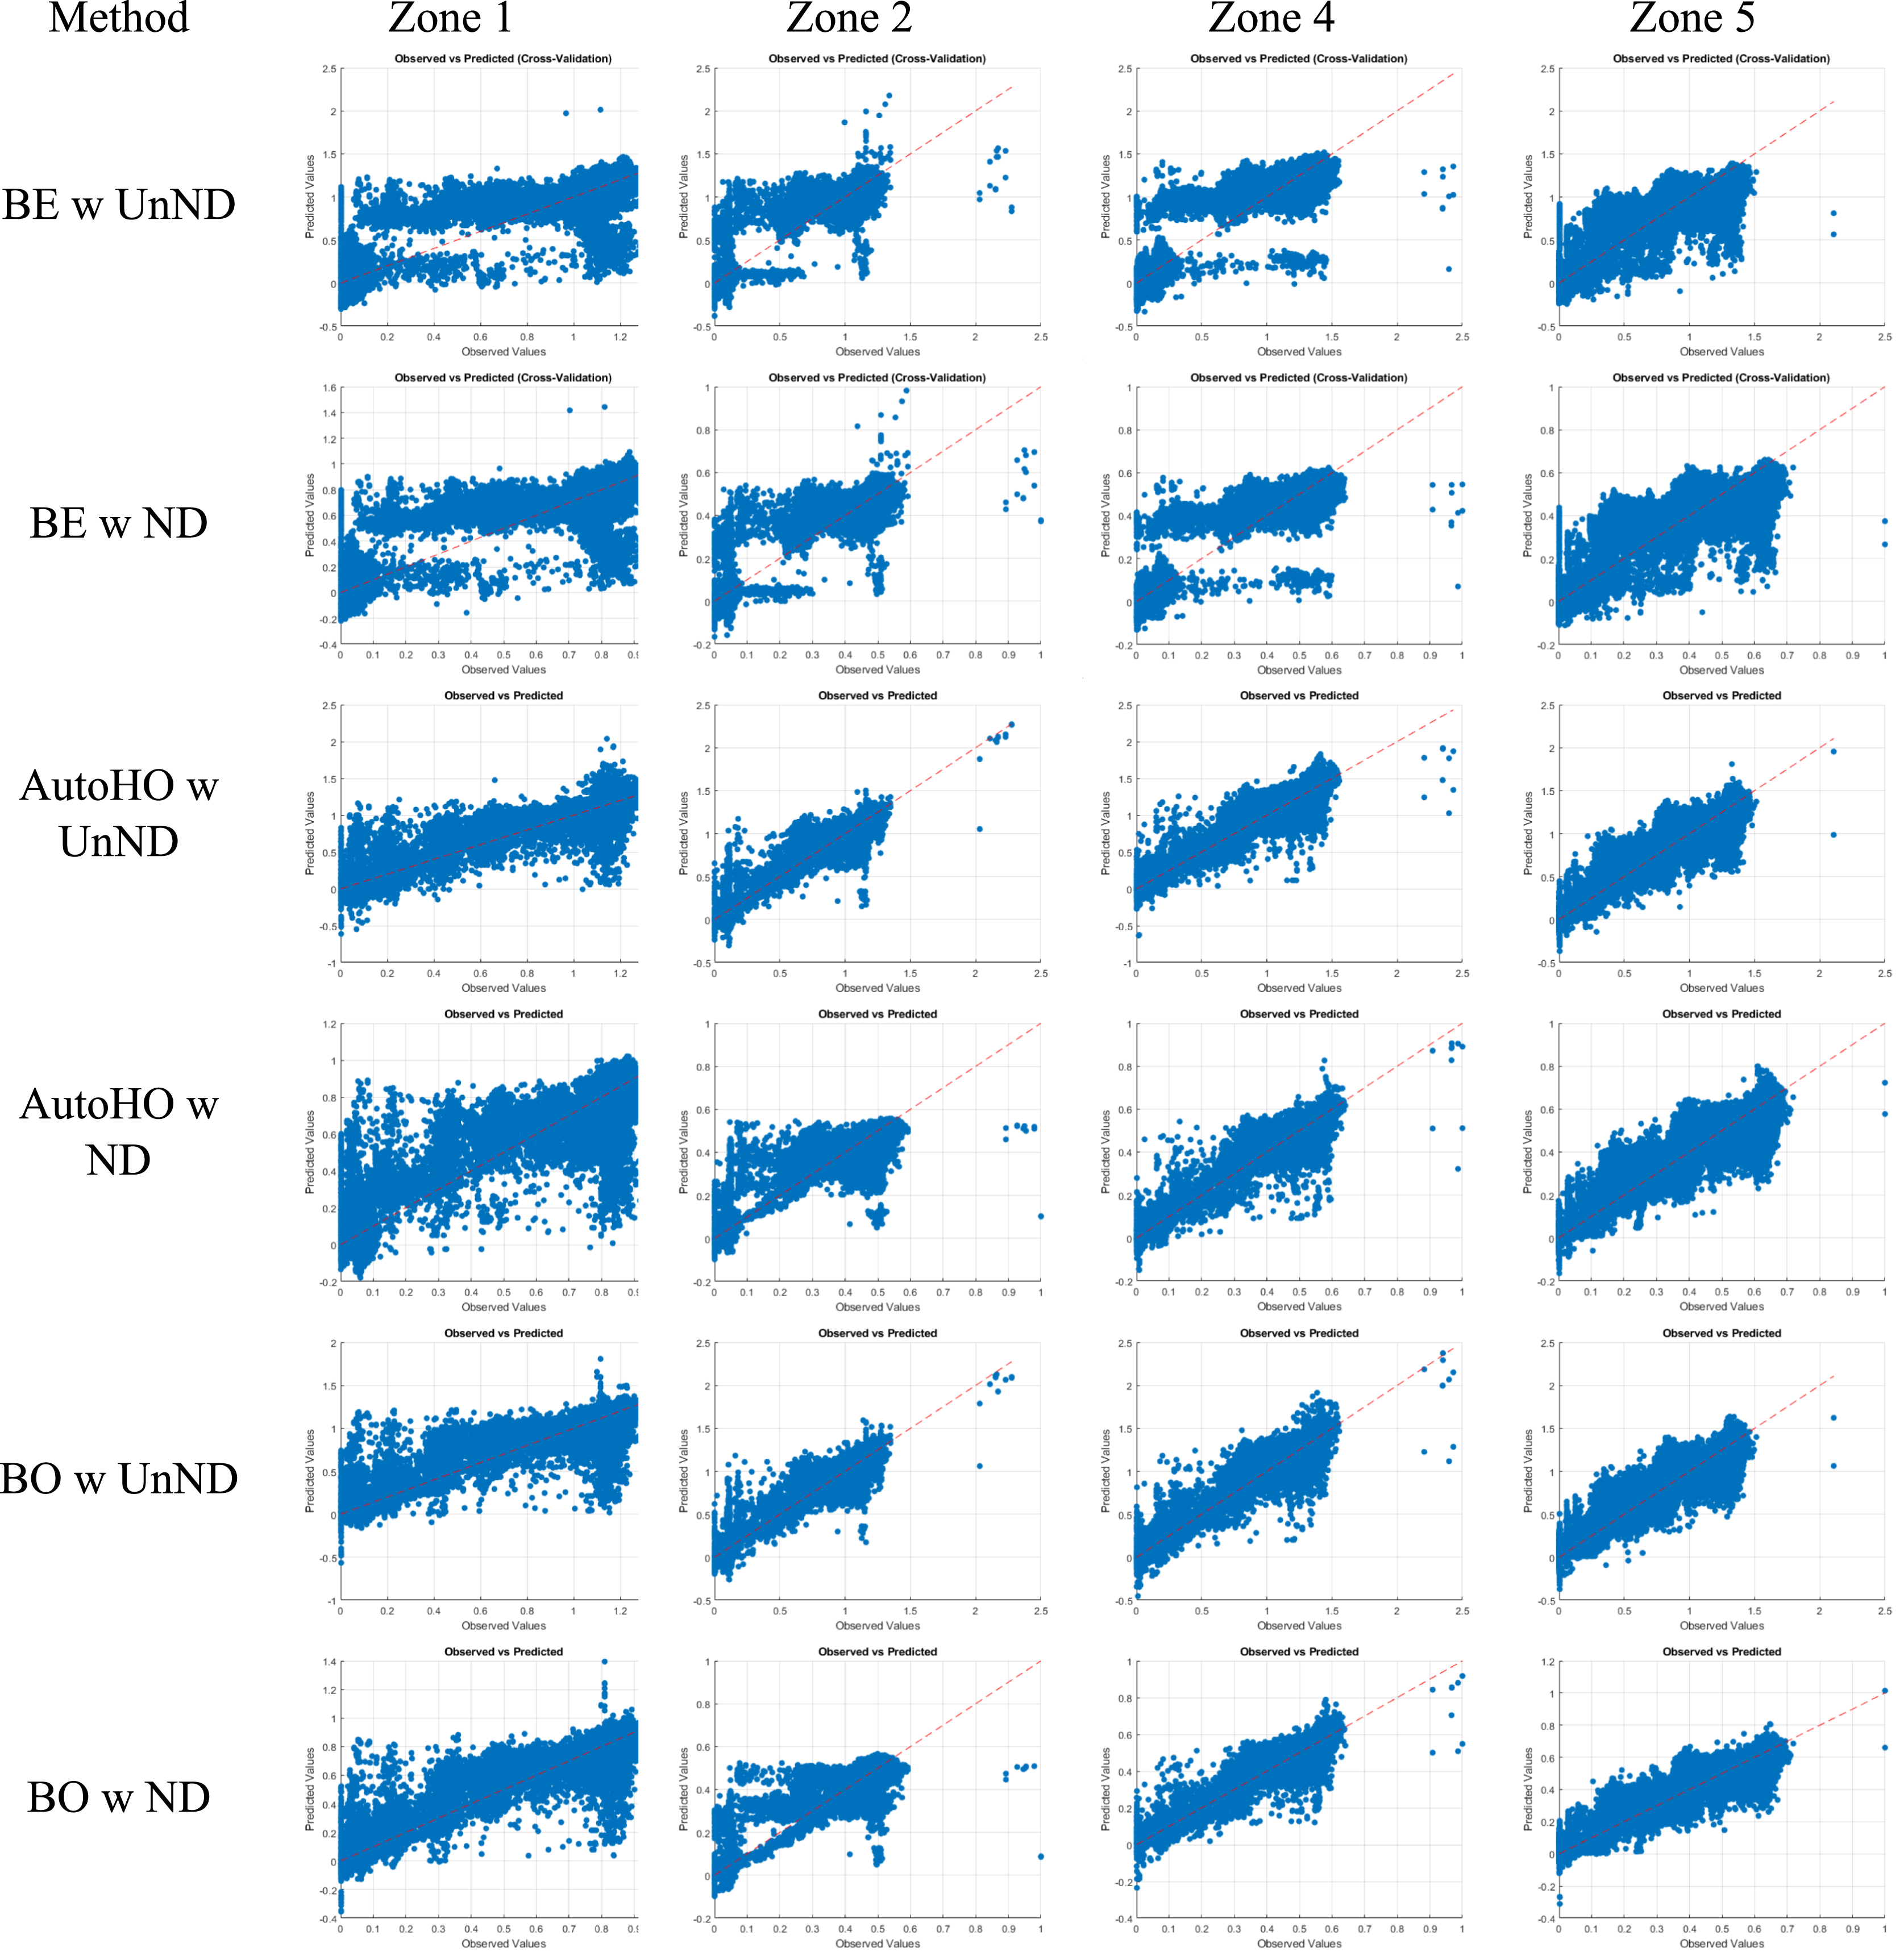
Observed vs. Predicted values graphs for all zones using baseline ensemble (BE), auto hyperparameter optimization (AutoHO) and bayesian optimization (BO) on un-normalized (Un ND) and normalized data (ND).
Across all zones, the Baseline Ensemble model showed minimal changes in R2 after normalization, demonstrating the fundamental scale invariance of tree-based models. However, a consistent and substantial decrease in both MAE and MSE was observed, suggesting that normalization may reduce prediction noise without affecting overall fit. This trend was most notable in Zone 4 in terms of the MSE and MAE values, and in Zone 5 in terms of the MAE value. The advantage of normalization showed itself as improved prediction precision without added model complexity, while the limitation of the approach was that the model did not benefit from normalization in terms of variance explanation (R2).
While auto hyperparameter optimization significantly reduced computation time for normalized data in Zones 1 & 2 by smoothing the hyperparameter search space, it also led to a moderate drop in R2 in all zones. This indicates that, although the optimizer achieved faster convergence due to the homogenized input scales, it occasionally settled on parameter sets that were not optimal for achieving the highest accuracy. On the other hand, normalized data led to dramatic reductions in MAE and MSE, especially in Zones 4 and 5. The advantages of normalization in auto hyperparameter optimization came out to be accelerated training time (approximately 6.8 h in un-normalized vs. similar or faster in normalized) and improved error metrics.
The final approach of Bayesian Optimization consistently achieved the best balance of high accuracy and low error, especially when trained on normalized data. It yielded the lowest MSE and MAE in all zones, and R2 either remained high or improved slightly (e.g., Zone 5: R2 increased from 0.9526 to 0.9537). For this method, normalization showed the advantage of superior predictive performance with stable or improved R2, while it has the limitation of computational resources due to its training time periods. Nevertheless, this method seems to be the most optimal for applications demanding both accuracy and efficiency.
Discussion
An overall look at the findings show that normalization reduced MAE and MSE across all models
With the Baseline Ensemble model, as expected for a tree-based algorithm, R2 remained nearly constant after normalization, underscoring their scale-invariance. However, notable improvements were observed in MSE and MAE. In Zone 4, the MSE value dropped down from 0.010027 to 0.0016912, almost a 6-fold change while the MAE value dropped down from 0.045625 to 0.018879. In Zone 5, on the other hand, MSE increased from 0.014449 to 0.030971 while MAE showed a clear drop from 0.064772 to 0.0033. Except for Zone 5, normalization proved beneficial across all other zones. This was an outcome that was somewhat unexpected theoretically, as normalization is typically considered unnecessary for tree-based models. These findings suggest that although decision trees are theoretically insensitive to the scale of input features, normalization can still enhance their performance by promoting more balanced decision boundaries and reducing the impact of extreme prediction errors.
With the second approach of Auto Hyperparameter Optimization, the normalization of the data reduced training times considerably by making it easier for the algorithm to navigate the range of possible hyperparameter values more effectively. While this led to faster convergence and significantly lower MSE/MAE with often more than 50 % of reduction in the obtained values (e.g. MSE for Zone 2, dropped down from 0.00110 to 0.00057; MAE for Zone 5 dropped down from 0.037972 to 0.017992), R2 values also experienced a moderate decline in some zones. This tradeoff indicates that certain hyperparameter configurations optimized for un-normalized data may no longer be optimal when normalized data is utilized.
The last but not least approach, Bayesian Optimization, consistently outperformed the previous two, especially when trained on normalized data. It achieved the lowest MAE and MSE across all zones, with stable or slightly improved R2 values (e.g., in Zone 5, R2 increased from 0.9526 to 0.9537). While its training time was approximately 20 min per run, it remains acceptable for applications requiring both accuracy and robustness.
To summarize, among the three modeling strategies, Bayesian Optimization consistently delivered the most accurate and stable predictions across all zones and data configurations, with notably low MAE and MSE values. Its performance on normalized data confirms its suitability for applications requiring both high precision and acceptable computational cost. Auto hyperparameter Optimization, while beneficial in reducing training time, occasionally showed slight declines in R2, indicating sensitivity to feature scaling in parameter selection. The Baseline Ensemble model, despite its simplicity, also proved to be a robust low-complexity option. The results underline that model selection should be guided by a balance between prediction performance, computational demand, and the operational needs of the application.
Conclusion
This study investigates the predictive performance of three Boosted Regression Tree models, Baseline Ensemble, Auto Hyperparameter Optimized, and Bayesian Optimized, for estimating EUI in four distinct building zones of a university building. The study contributes to the literature by highlighting the practical benefits of Bayesian optimization in improving EUI prediction accuracy, a technique that has so far seen limited application in energy modeling frameworks. The models were tested using both un-normalized and min-max normalized datasets, allowing for a comparative analysis of data preprocessing strategies and modeling approaches in terms of accuracy, error reduction, and computational efficiency. Across all zones and models, normalization consistently resulted in substantial improvements in error metrics such as MAE and MSE, while changes in R2 values remained minimal. This indicates that while normalization does not always affect the proportion of explained variance, it significantly enhances the precision of predictions. These findings directly respond to the two research questions posed in the introduction, confirming the value of Bayesian optimization and normalization in improving EUI prediction performance.
Looking at the results of the study, several recommendations and contributions can be listed: (1) To the best of our knowledge, this study represents a unique example of estimating EUI using a boosted regression tree approach, a technique that has rarely been applied in this context. (2) Normalization is recommended when feature scales differ by a factor of 2-3 or more, especially when input features include both continuous data and time-based features (e.g., sine-cosine encoding). (3) For real time systems such as AC or lighting control, the use of Bayesian Optimization on normalized data presents the best balance between predictive performance and computational demand. (4) Auto Optimization offers a valuable middle ground but requires careful consideration of hyperparameter sensitivity post normalization, particularly for high dimensional datasets or when computational resources are limited. (5) Baseline Ensemble is an effective low complexity model, suitable for interpretable, lightweight applications, though it may underperform in tasks if detailed accuracy is needed.
To conclude, normalization should not be treated solely as a preprocessing step but as a structural design choice influencing model performance. Its interaction with algorithm behavior is complex, particularly for models sensitive to hyperparameter settings. As such, data normalization, model architecture, and optimization strategies must be considered jointly in EUI forecasting frameworks. This integrative approach establishes the foundation for more reliable energy modeling systems, with direct implications for smart building operations, energy management platforms, and sustainability driven planning. The proposed LSBoost-Bayesian method presents a practical and adaptable approach for improving EUI predictions based on real world building data.
In addition to its methodological contributions, the study also highlights several ways in which these models can be applied in real-world building management scenarios. The proposed ML framework offers building managers a practical, data-driven alternative to conventional energy modeling methods. Unlike traditional physics-based models, which often require detailed knowledge of building materials, systems, and occupancy schedules, the LSBoost models developed in this study operate directly on existing sensor data and external weather inputs, resources typically available through modern Building Management System (BMS) infrastructures.
For example, the Bayesian-optimized LSBoost model can be integrated into real-time energy dashboards to forecast daily or hourly EUI trends, enabling facility managers to detect anomalies such as unexpected energy spikes due to faulty equipment or irregular occupancy patterns. Zone based EUI predictions also help identify areas of high energy intensity, supporting targeted actions like schedule adjustments, occupancy-aware controls, or maintenance planning. Additionally, the framework allows for faster performance analysis, which is particularly valuable in operational settings that require timely diagnostics and decision making. While not a replacement for physics-based simulation tools, the proposed models can serve as complementary tools by offering empirical baselines that help prioritize deeper investigations or control interventions.
Footnotes
Ethical considerations
Ethical approval is not required for this manuscript.
Author contributions
Funding
The authors received no financial support for the research, authorship, and/or publication of this article.
Declaration of conflicting interests
The authors declared no potential conflicts of interest with respect to the research, authorship, and/or publication of this article.
Data Availability Statement
This study used the CU-BEMS dataset, which is publicly available at https://sgrudata.github.io/. Additional weather data used in this study were sourced from the Reliable Prognosis website and are available at https://rp5.ru/Weather_archive_in_Bangkok,_Suvarnabhumi_(airport) and solar irradiance data from the Joint Research Center and available at ![]() .
.