
Abstract
Our purpose was to examine the effect of working under the collided supply jets from active chilled beams on occupants’ perception, work performance, and stress. A repeated measures design with 36 participants was implemented with two test conditions: a reference condition, where active chilled beams were functioning appropriately, and a test condition, where supply jets from the active chilled beams collided and fell down to the workstation. Individual factors, such as gender and draught sensitivity are considered. Working under the collided supply jets resulted in lower thermal sensation, higher percentage of dissatisfied with the thermal environment and warmer thermal preference. The reference condition was perceived to be better for concentration, performance, and working efficiently for a long period of time. The Draught sensitive groups’ 0-back accuracy was lower when working under increased air movement and they had lower perceived performance and higher perceived workload than Draught neutral group at the end of exposure time. The present results indicate that working under the influence of the collided supply jets might generate stronger negative effects among females and draught sensitive persons. Self-rated draught sensitivity is an important parameter, and it is recommended to be used whenever air movement is studied with humans.
Practical application
This study provides evidence that individual factors, such as gender and draught sensitivity, are important while designing and implementing energy-efficient cooling systems that prioritize occupant comfort. The findings from this study has practical implications for indoor environment design and management in workplaces.
Introduction
Modern offices are often designed to have shared rooms or open-plan spaces. A high office occupation rate can lead to a high thermal load hampering the control of thermal environment. Thermal environment is an important factor of indoor environment affecting occupants’ wellbeing and performance.1–4 The proportion of dissatisfied respondents regarding thermal conditions was 30.6 % in a recent study with global dataset having over 82 000 respondents. 5
Thermal environment can be controlled with active chilled beams. An active chilled beam (ACB) is an energy efficient air-conditioning device that combines supply air with cooling of re-circulated room air. ACBs have developed tremendously over the last decades. 6 In addition to low energy consumption, ACBs are widely applied due to their silent operation, suitable integration with architectural design, convenient maintenance and they can provide good thermal comfort and indoor air quality.
Heat sources have a significant effect on room airflow patterns affecting also the airflows resulting from ACB.7,8 Wu et al. 8 evaluated the effects of configuration and strength of heat sources on thermal comfort in a mock-up room with ACB system. The study shows that symmetrical heat sources provide better thermal comfort than asymmetrical ones. Ming et al. 9 showed the importance of ACB terminal layouts on ventilation performance and thermal comfort. The uniformly distributed layouts provide higher local thermal comfort. A lot of research and analytical studies have been carried out to ACBs under office-like conditions. 6 However, there are gaps between research and practice which need to be tackled with further research. A steady state or symmetric layout condition is typically studied in research. However, in practice the condition is often not symmetrical or steady state as the locations and the amounts of heat sources can vary. This influences the needed cooling power to maintain desired temperature. There is a risk with heat source asymmetry, and with high heat loads, that the supply air throw length increases due to the increment of cooling power in the ACB. This may lead to the collision of supply air jets coming from adjacent ACBs and cause local thermal discomfort to occupants. 10 Our study focuses on this kind of situation, which is often seen in draughty workstations in rooms with mechanical ventilation.
There is a need to increase understanding of how different HVAC solutions affect occupants, since dissatisfaction towards thermal environment is an undisputed and global problem in offices,5,11 and the complaints regarding thermal environment in offices are often related to air temperature and feeling of draught. Reijula and Sundman-Digert conducted a survey in 122 workplaces to assess the extent of indoor air problems in office environments in Finland. 12 They found out that draught was one of the most common problem having 22% of respondents reporting that draught problem had existed every week in the work environment. 12 De Dear et al. 3 pointed out in their review paper that the literature is lacking variety of studies on chilled beams comfort performance studied with human subjects. Latif et al. 6 made a literature review of performance evaluation of ACB systems. Also, Latif et al. 6 mentioned the need of studies which evaluate ACB performance with feedback from real people. There is a lack of research that studies the effect of working under the collided supply jets of ACBs on occupants’ comfort and cognitive performance in a realistic office environment with commercially available furniture and HVAC solutions. Our study responses to this lack by adding information of perceived conditions regarding both, appropriately functioning ACB and draughty condition caused by ACB, in a laboratory simulating an office environment with commercially available furniture and HVAC solutions.
A lot of general research is done related to air movement and draught.13,14 They are very useful regarding knowledge related to basic phenomena, but they do not compensate for applied research done with real HVAC products. Previous studies have resulted in well-known thermal comfort and draught rate models.
15
ISO 7730
15
defines draught as unwanted local cooling of the human body caused by air movement. Draught rate (DR) is the percentage of people predicted to be bothered by draught. Draught rate can be calculated with equation (1):
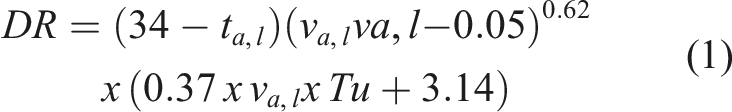
Occupants’ thermal sensation can be assessed with seven-point thermal sensation scale: −3 Cold, −2 Cool, −1 Slightly cool, 0 Neutral, 1 Slightly warm, 2 Warm, and 3 Hot. It is affected by air temperature, mean radiant temperature, air relative humidity, air velocity, occupants’ activity level (i.e., metabolic rate) and clothing insulation. The Predicted Mean vote (PMV) is an index that predicts the mean value of the votes of a large group of people exposed to the same thermal conditions. It is based on the heat balance of human body. 15 The Predicted Percentage Dissatisfied (PPD), people who are dissatisfied with the thermal environment, can be determined from the PMV.
The PMV model is based on laboratory experiments, 16 and its applicability to field settings with different ventilation solutions has been questioned.17,18 The PMV model has found to predict rather well the actual mean thermal sensation near neutral conditions, while the PPD has found to underestimate the percentage of dissatisfied. 2 Van Hoof 19 summarized the strengths and limitations of PMV model. The PMV model seems to be free from bias if air speed is below 0.2 m/s but underestimates the cooling effect when air speed is increased. 19 The PMV model does not consider personal factors such as age, body mass index or gender. For example, females have been found to have cooler thermal sensation and to be more dissatisfied than males, especially in cooler conditions.2,20,21 Gender differences have also been seen related to air movement. Females have been found to report lower thermal sensation and higher dissatisfaction with increased air speed than males. 22 As in the PMV model, gender differences are not considered in draught rate either (Eq. (1)). Despite many proposed thermal comfort models and suggested improvements to PMV model, Fanger’s PMV model has remained the most popular. 23
In addition to above-mentioned physiological individual differences, there is evidence that self-rated sensitivity to an indoor parameter can be interrelated to parameter’s apparent effect on occupants. For example, high noise sensitivity is known to be associated with adverse effects of noise. 24 Recent studies show that self-rated sensitivity to temperature divides people into groups which react physiologically differently to thermal stimuli.25–27 Therefore, it is also important to include self-rated draught sensitivity whenever the effect of draughty conditions on occupants is studied.
There are many studies in the literature about the effect of too warm environment, too cold environment, or locally increased air movement on thermal comfort and performance.2–4,28 Too warm or too cold environment has shown to decrease the work performance.2–4 On the other hand, increased air movement in warm environment seems to have positive effects on thermal comfort and work performance.28,29 The literature is still lacking variety of studies where the effect of draught on the performance is measured, specially in cases where the draught is caused by different HVAC solutions in the means of collided supply jets in neutral room temperatures.
The research field is also missing studies related to the physiological stress responses related to these draughty conditions. One physiological stress measure is the heart rate variability (HRV). It provides information on the functioning of autonomic nervous system. 30 A frequently used stress indicator obtained by HRV measurement is the LF/HF ratio. High LF/HF values denote stress. HRV has been used as a physiological measure of the stress effect related to adverse thermal environment.31,32 LF/HF ratio has been found to be higher when participants are exposed to high or low temperatures. 31 However, the effect of air speed on LF/HF ratio seems to be temperature dependent. Zhu et al. 31 observed that LF/HF ratio decreased with increasing air speed at room temperature 30°C, but increased slightly among air speed at room temperature 26°C.
More knowledge is needed about the comfort, performance and stress effects of a simulated real-life draught situation where draught is generated from commercially available HVAC solutions due to increased heat loads and cooling, while room temperature itself is kept at desired level. In addition, many studies related to draught have used set-up of supply air terminals or fans, where participants can easily guess that the research question is related air movement (expectation bias). More research is needed in a realistic office environment with participants that are unaware of the research question.
Our aim was to examine the effect of increased air movement on occupants’ perception, work performance, and stress in an office laboratory simulating a draught situation caused by downfall of collided supply jets from ACBs. Also, individual factors, such as gender and draught sensitivity is considered.
Materials and methods
Design
A laboratory experiment was conducted with a repeated measures design, where participants experienced both experimental conditions. Two experimental conditions were used: A) a reference condition with low air speed, and B) a condition with increased air speed at the workstation. The exposure time was the same for both conditions. The order of the conditions was counterbalanced between participants. Gender and draught sensitivity were used to stratify the participants into the two balanced groups.
Participants
The description of participants and differed groups used in the analysis. Standard deviations are presented in brackets.
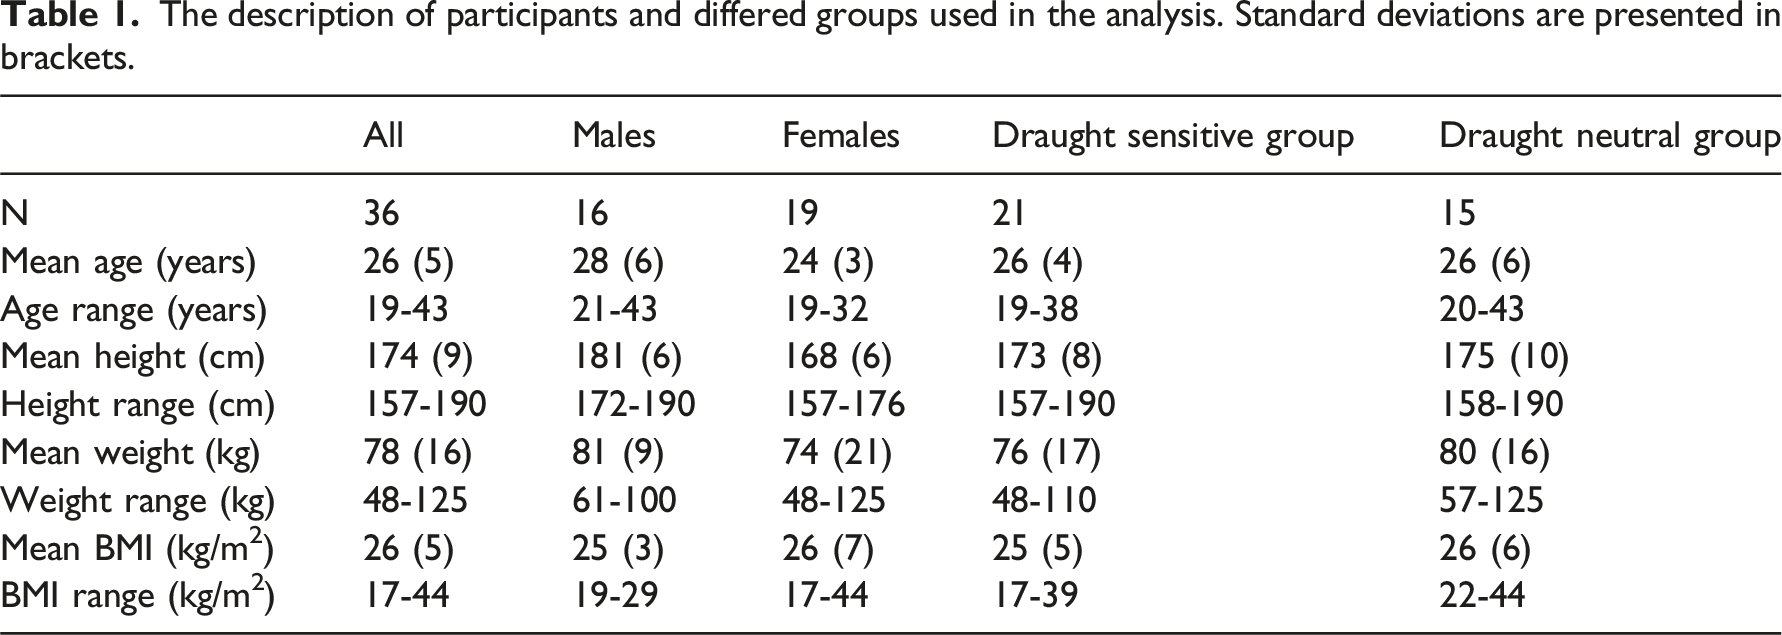
The draught sensitivity was asked during the recruitment phase together with 10 questions related to either perception or the sensitivity to other indoor environmental factors (noise, high temperature, cool temperature). This was done to hide the purpose of the study. The draught sensitivity was asked with the question “How well does the following statements describe you in general?”. The statement related to draught sensitivity was “I am sensitive to draught.” and the response scale was 1) Totally agree to 6) Totally disagreed. Participants replying 1 to 3 were included in the Draught sensitive group (Table 1). The Draught sensitive group includes 12 females, 8 males and 1 without gender information. The Draught neutral group included 7 females and 8 males.
Ethical aspects
The ethical committee of Turku University of Applied Sciences approved the study (statement 2021–06). All participants provided voluntary informed consent before participation. The participants were compensated for their effort and time with a gift voucher worth 30 euros.
Experimental setting
The experiment was carried out in spring 2022 at the psychophysics laboratory, Turku University of Applied Sciences, Finland (Figure 1). The outdoor temperature varied between −9.9°C and +8.0°C during experiment days and the mean outdoor temperature was 0.2°C. The psychophysics laboratory has two similar experimental rooms. Both rooms had similar layouts, furniture, and HVAC apparatus, so that participants did not see the difference between them. The psychophysics laboratory is built inside the main building and there are no exterior walls in the laboratory that could produce uncontrollable heat loads. A photograph of one room is shown in Fig. S1 (Supplementary material). The layout of the psychophysics laboratory. The room height is 2.6 m from floor to suspended ceiling. Chilled beams are installed 0.1 m below suspended ceiling. Two conditions were used. Condition A (low air speed) was in Room 1 and condition B (increased air speed) in Room 2.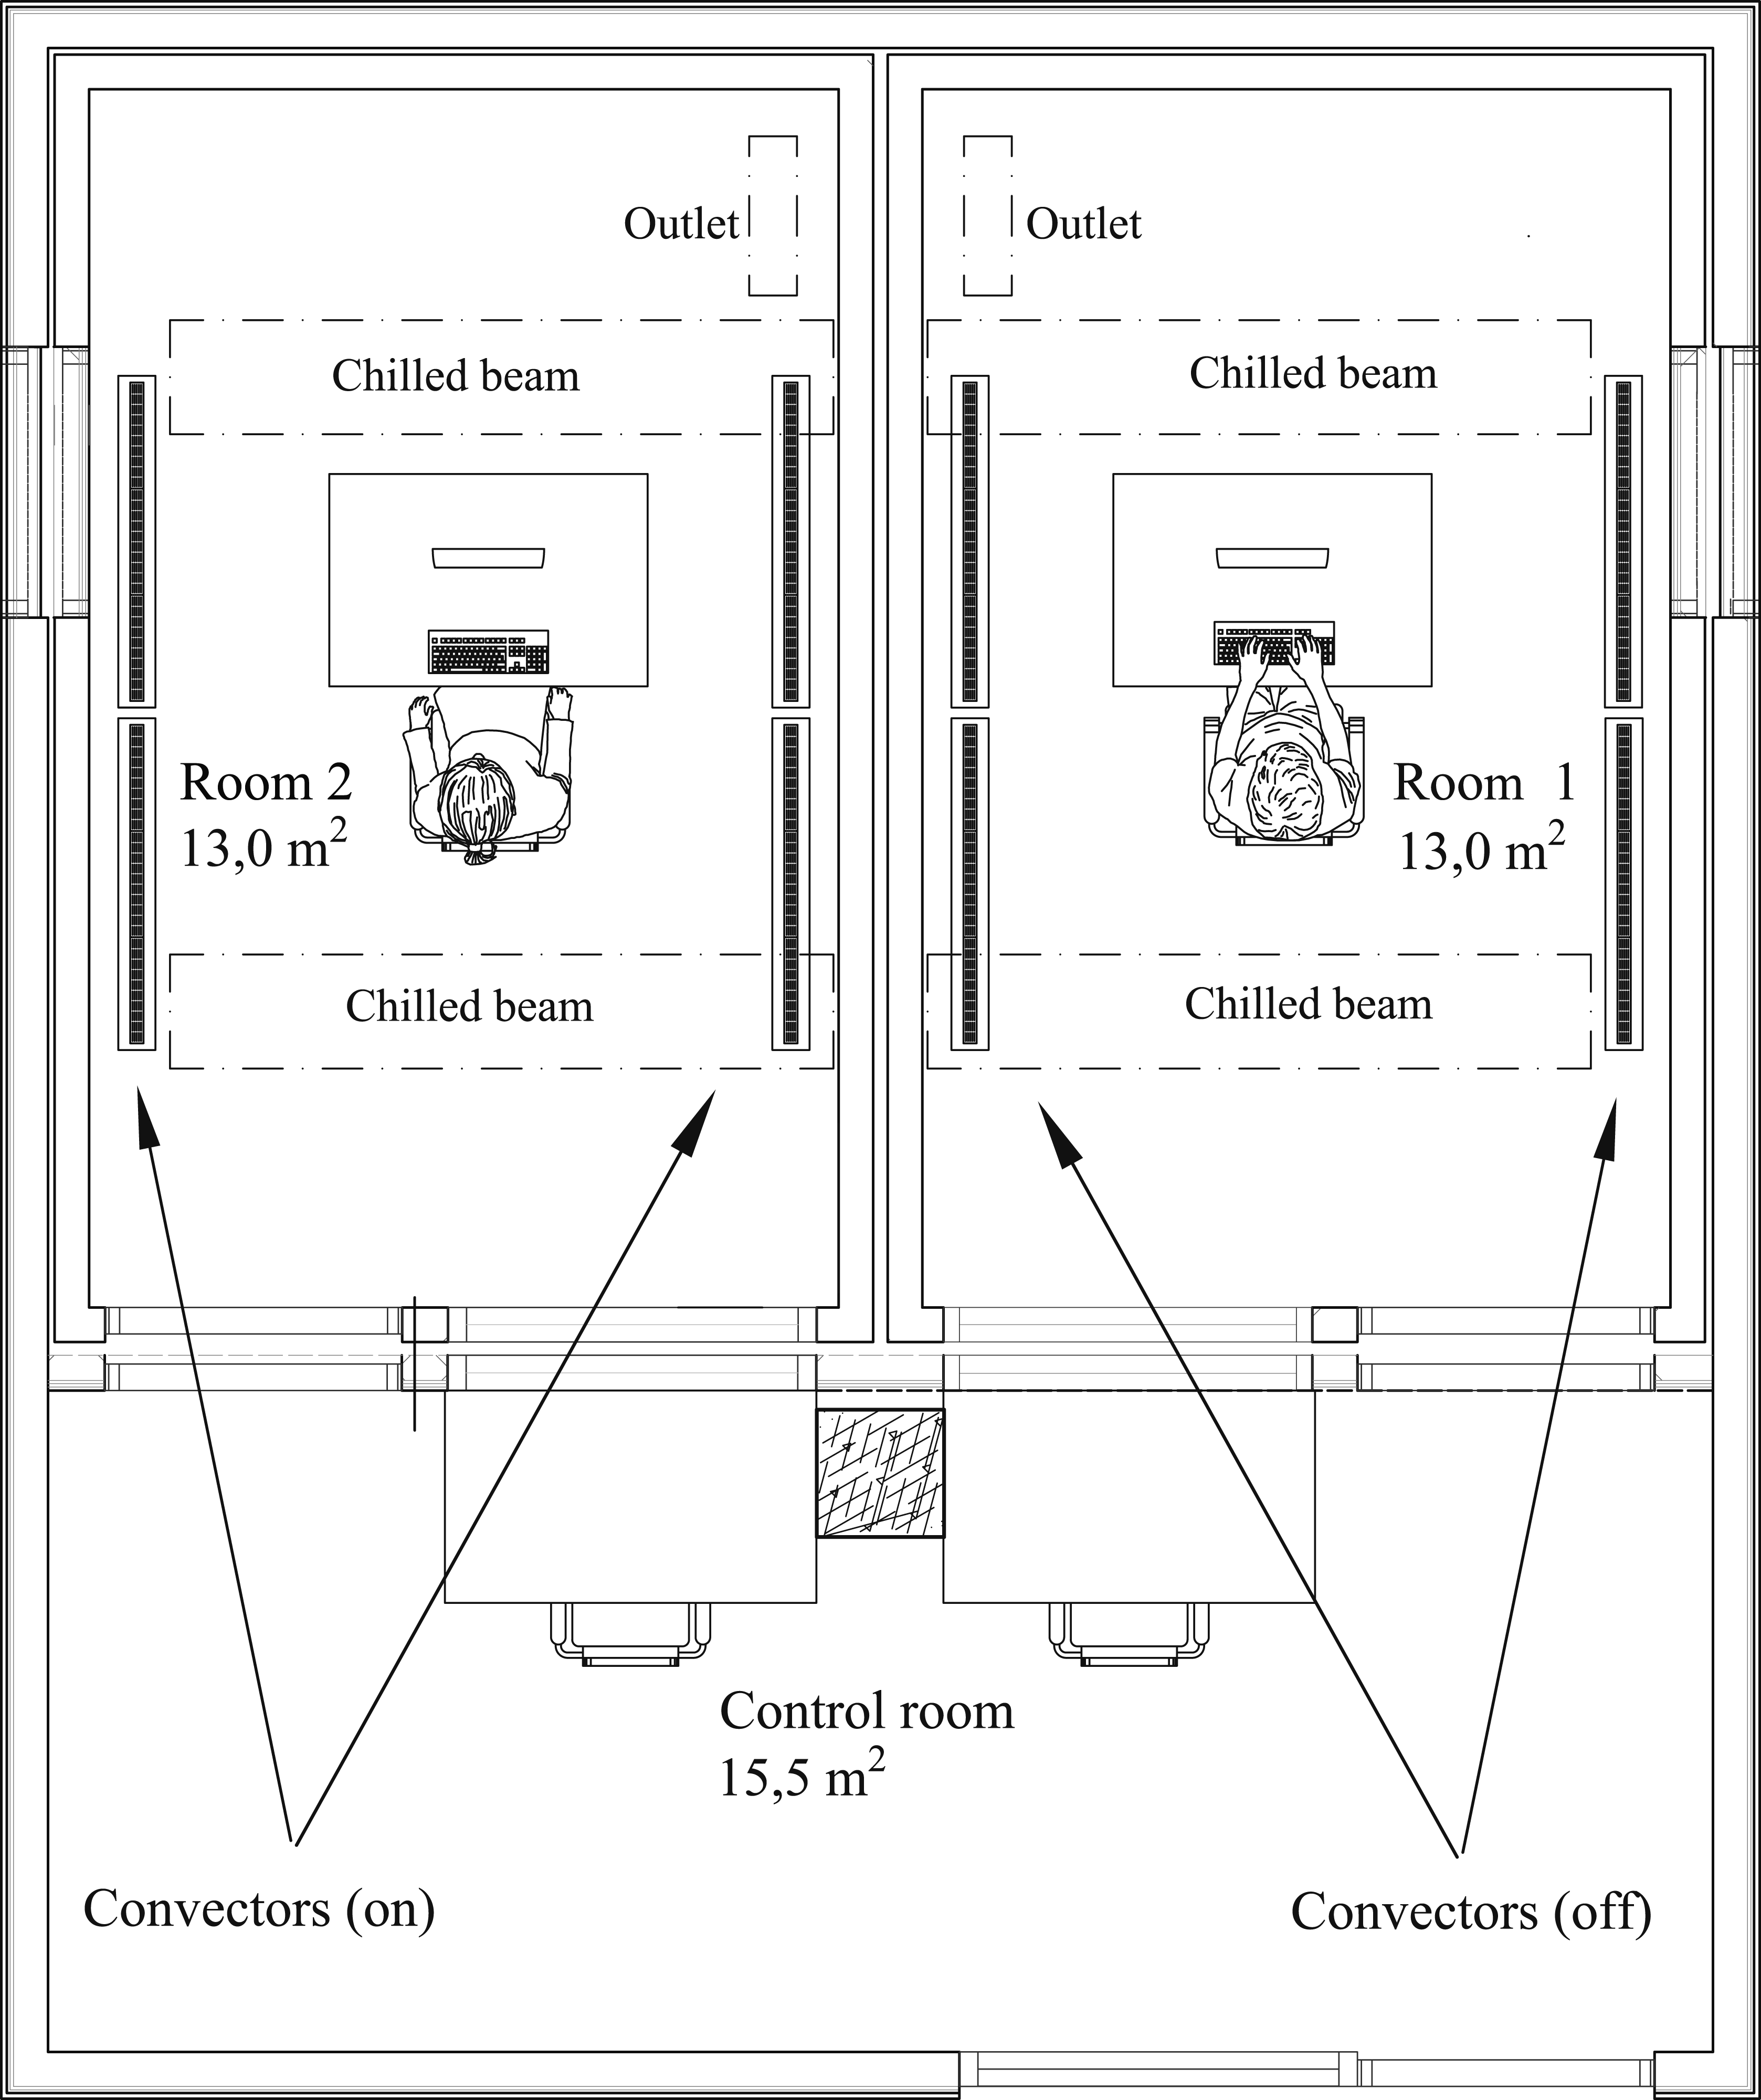
Description of the experimental conditions
The study had two experimental conditions. A) temperature above desk T = 23.5 ± 0.5°C, mean air speed voz<0.1 m/s, draught rate DRoz < 10%, supply airflow Q = 30 L/s, CO2, mean = 580 ppm and B) temperature above desk T = 23.5 ± 0.5°C, mean air speed voz<0.45 m/s, draught rate DRoz < 45%, supply airflow Q = 70 L/s, CO2, mean = 510 ppm.
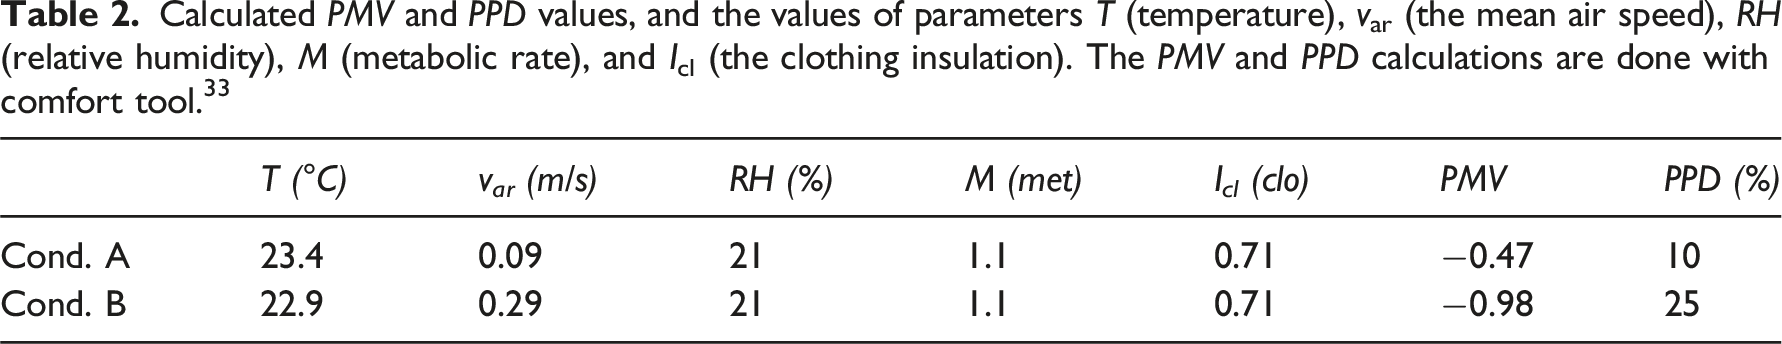
Calculated PMV and PPD values, and the values of parameters T (temperature), var (the mean air speed), RH (relative humidity), M (metabolic rate), and Icl (the clothing insulation). The PMV and PPD calculations are done with comfort tool. 33
Air speeds were measured from horizontal plane above workstation (1.9 m * 1.9 m area at the height of 1.5 m from the floor with 10 cm * 10 cm measurement grid). The mean air speeds were sampled for 3 min with hot-sphere anemometers. Draught risks were calculated according to equation (1) at each measurement point. Measurements were made both with and without the heated dummy. The results obtained from the measurements with the heated dummy are presented in Figure 2. The measured mean air speeds (a) and ((b) and calculated draught rates (c) and ((d) in a horizontal plane at the height of 1.5 m above the floor. The condition A is on the right and condition B is on the left. Dashed white line is table and office chair.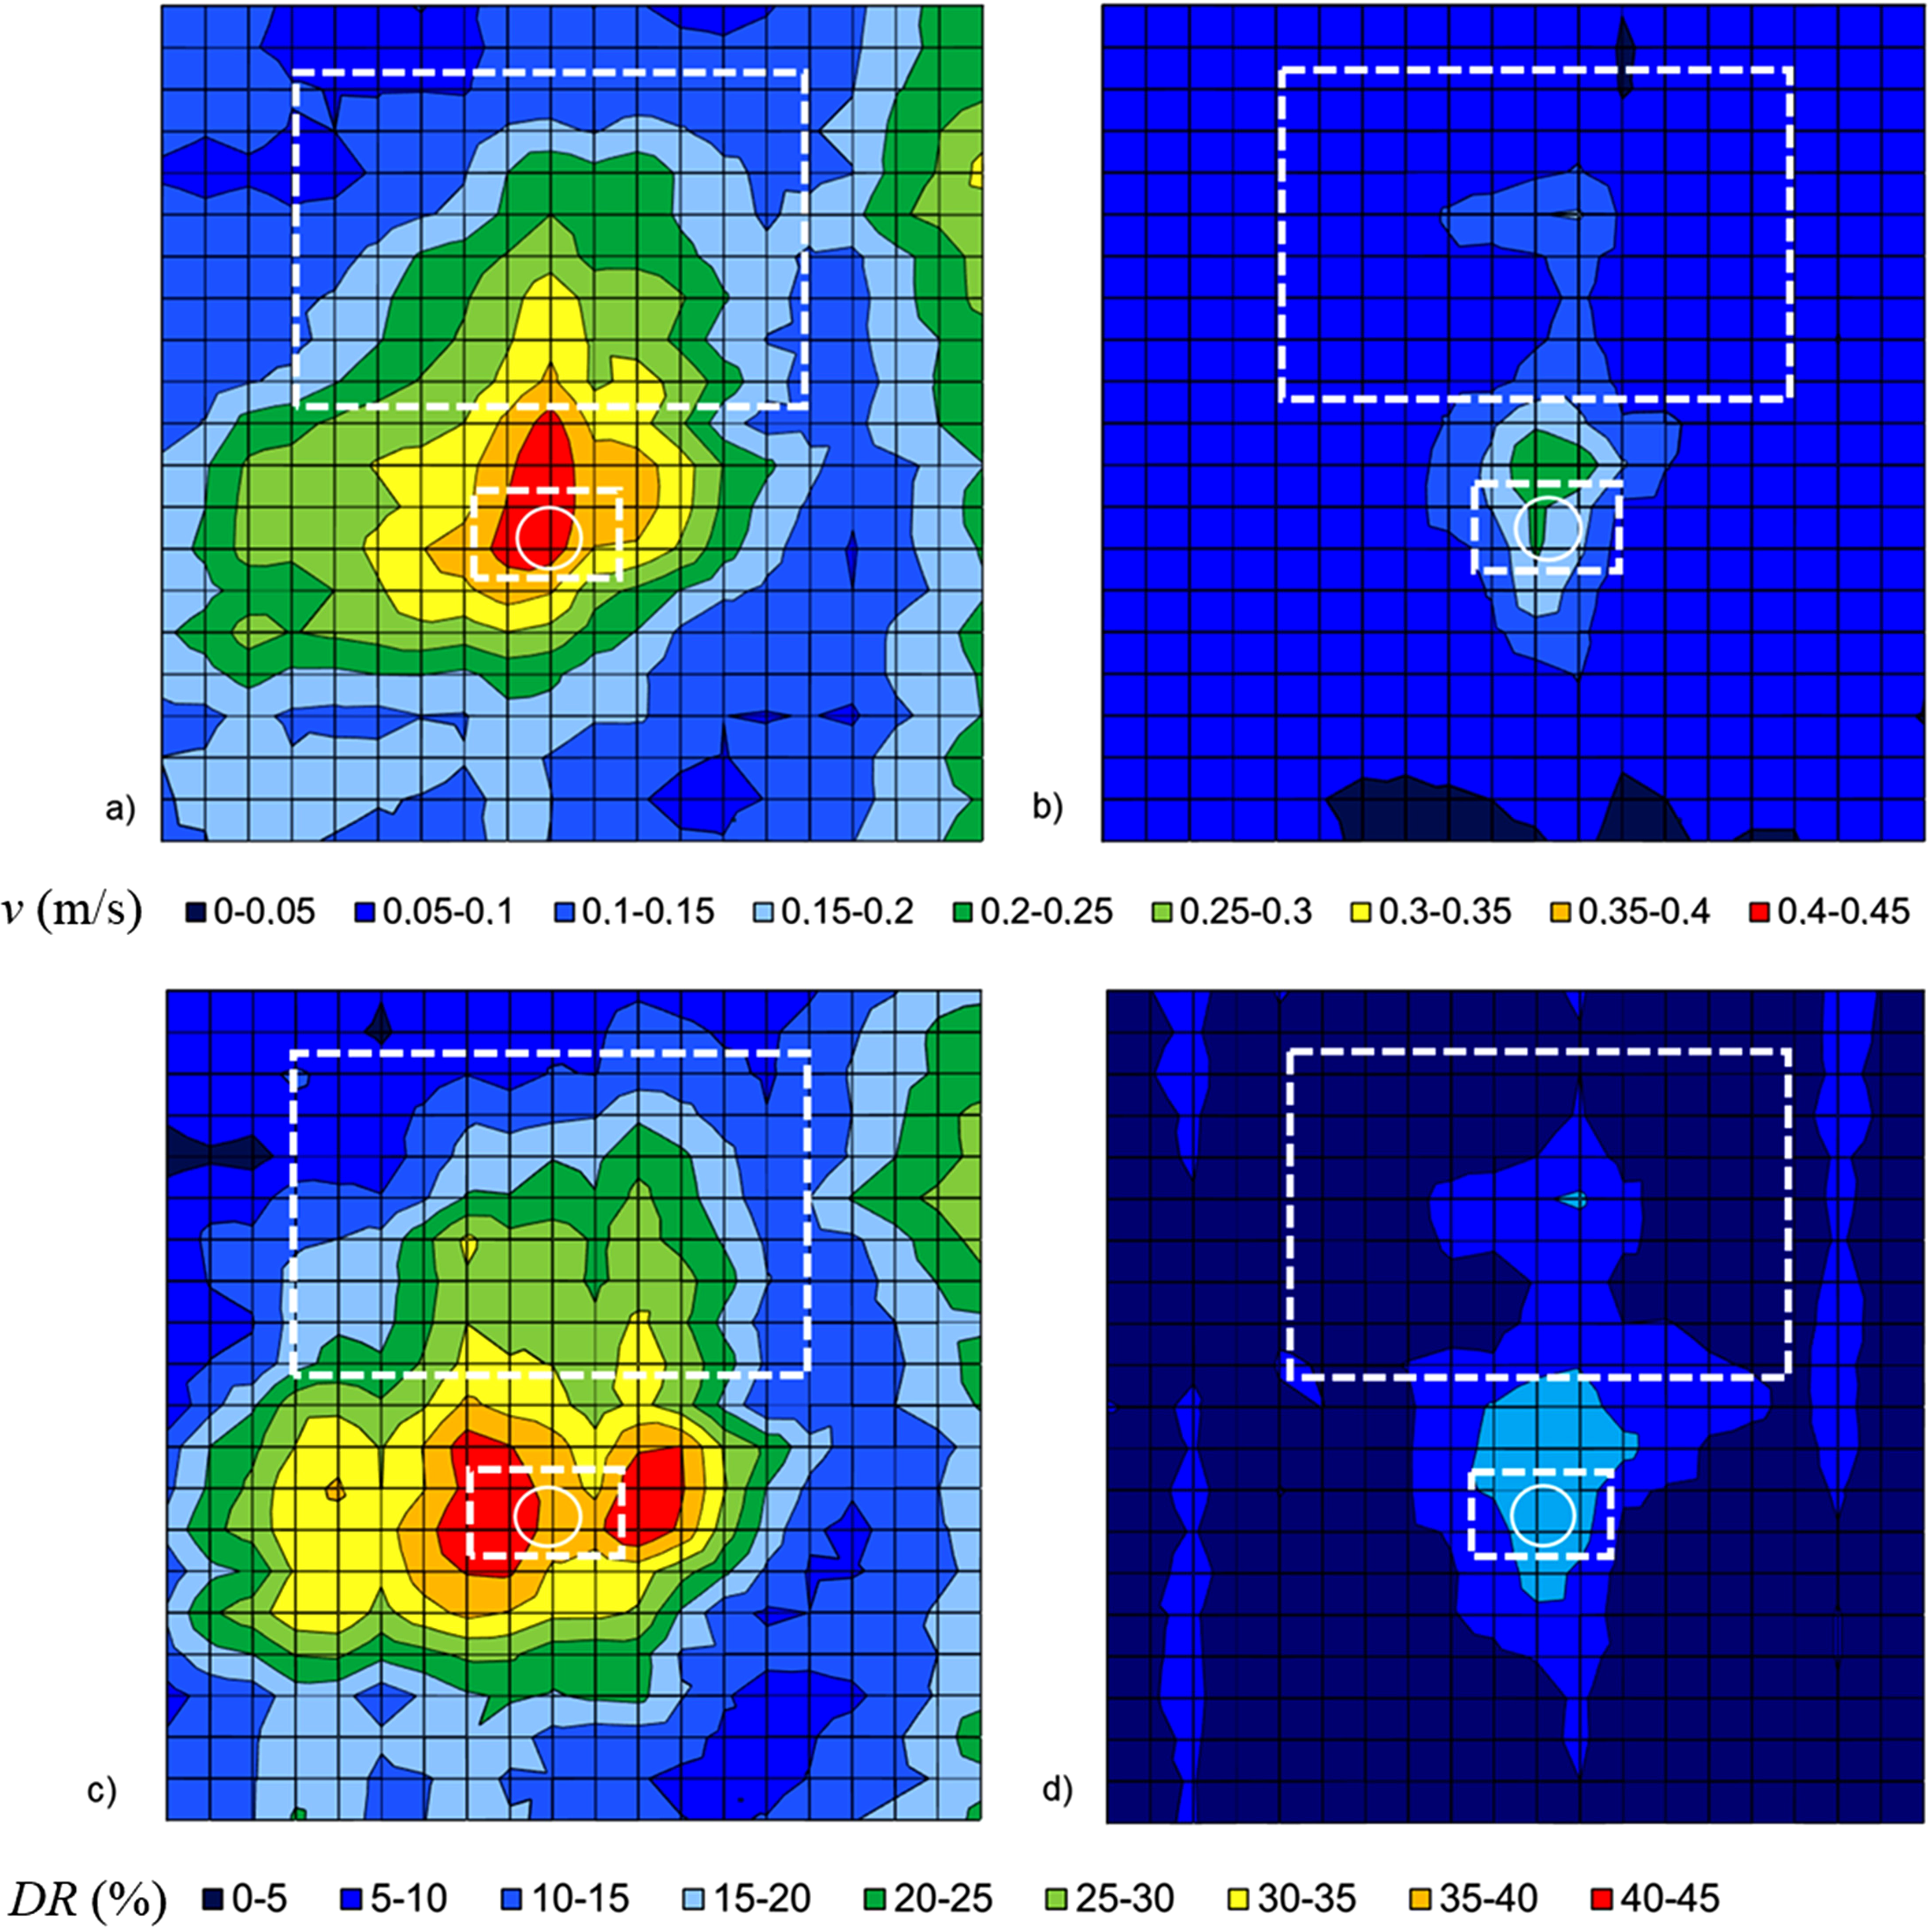
The predicted mean vote and the predicted percentage dissatisfied
Table 2 shows the calculated PMV and PPD values together with the parameter values used in calculations. The temperature used in calculations is the mean temperature of the occupied zone in the workstation measured with hot-sphere anemometers. The measured relative humidity of 21 % is typical indoor air humidity in Finland during the heating season. The measurements were done with thermoset polymer capacitive sensing element Siro device (Produal, Finland, accuracy of ±2.4 %).
Psychological variables
The dependent variables of the study.
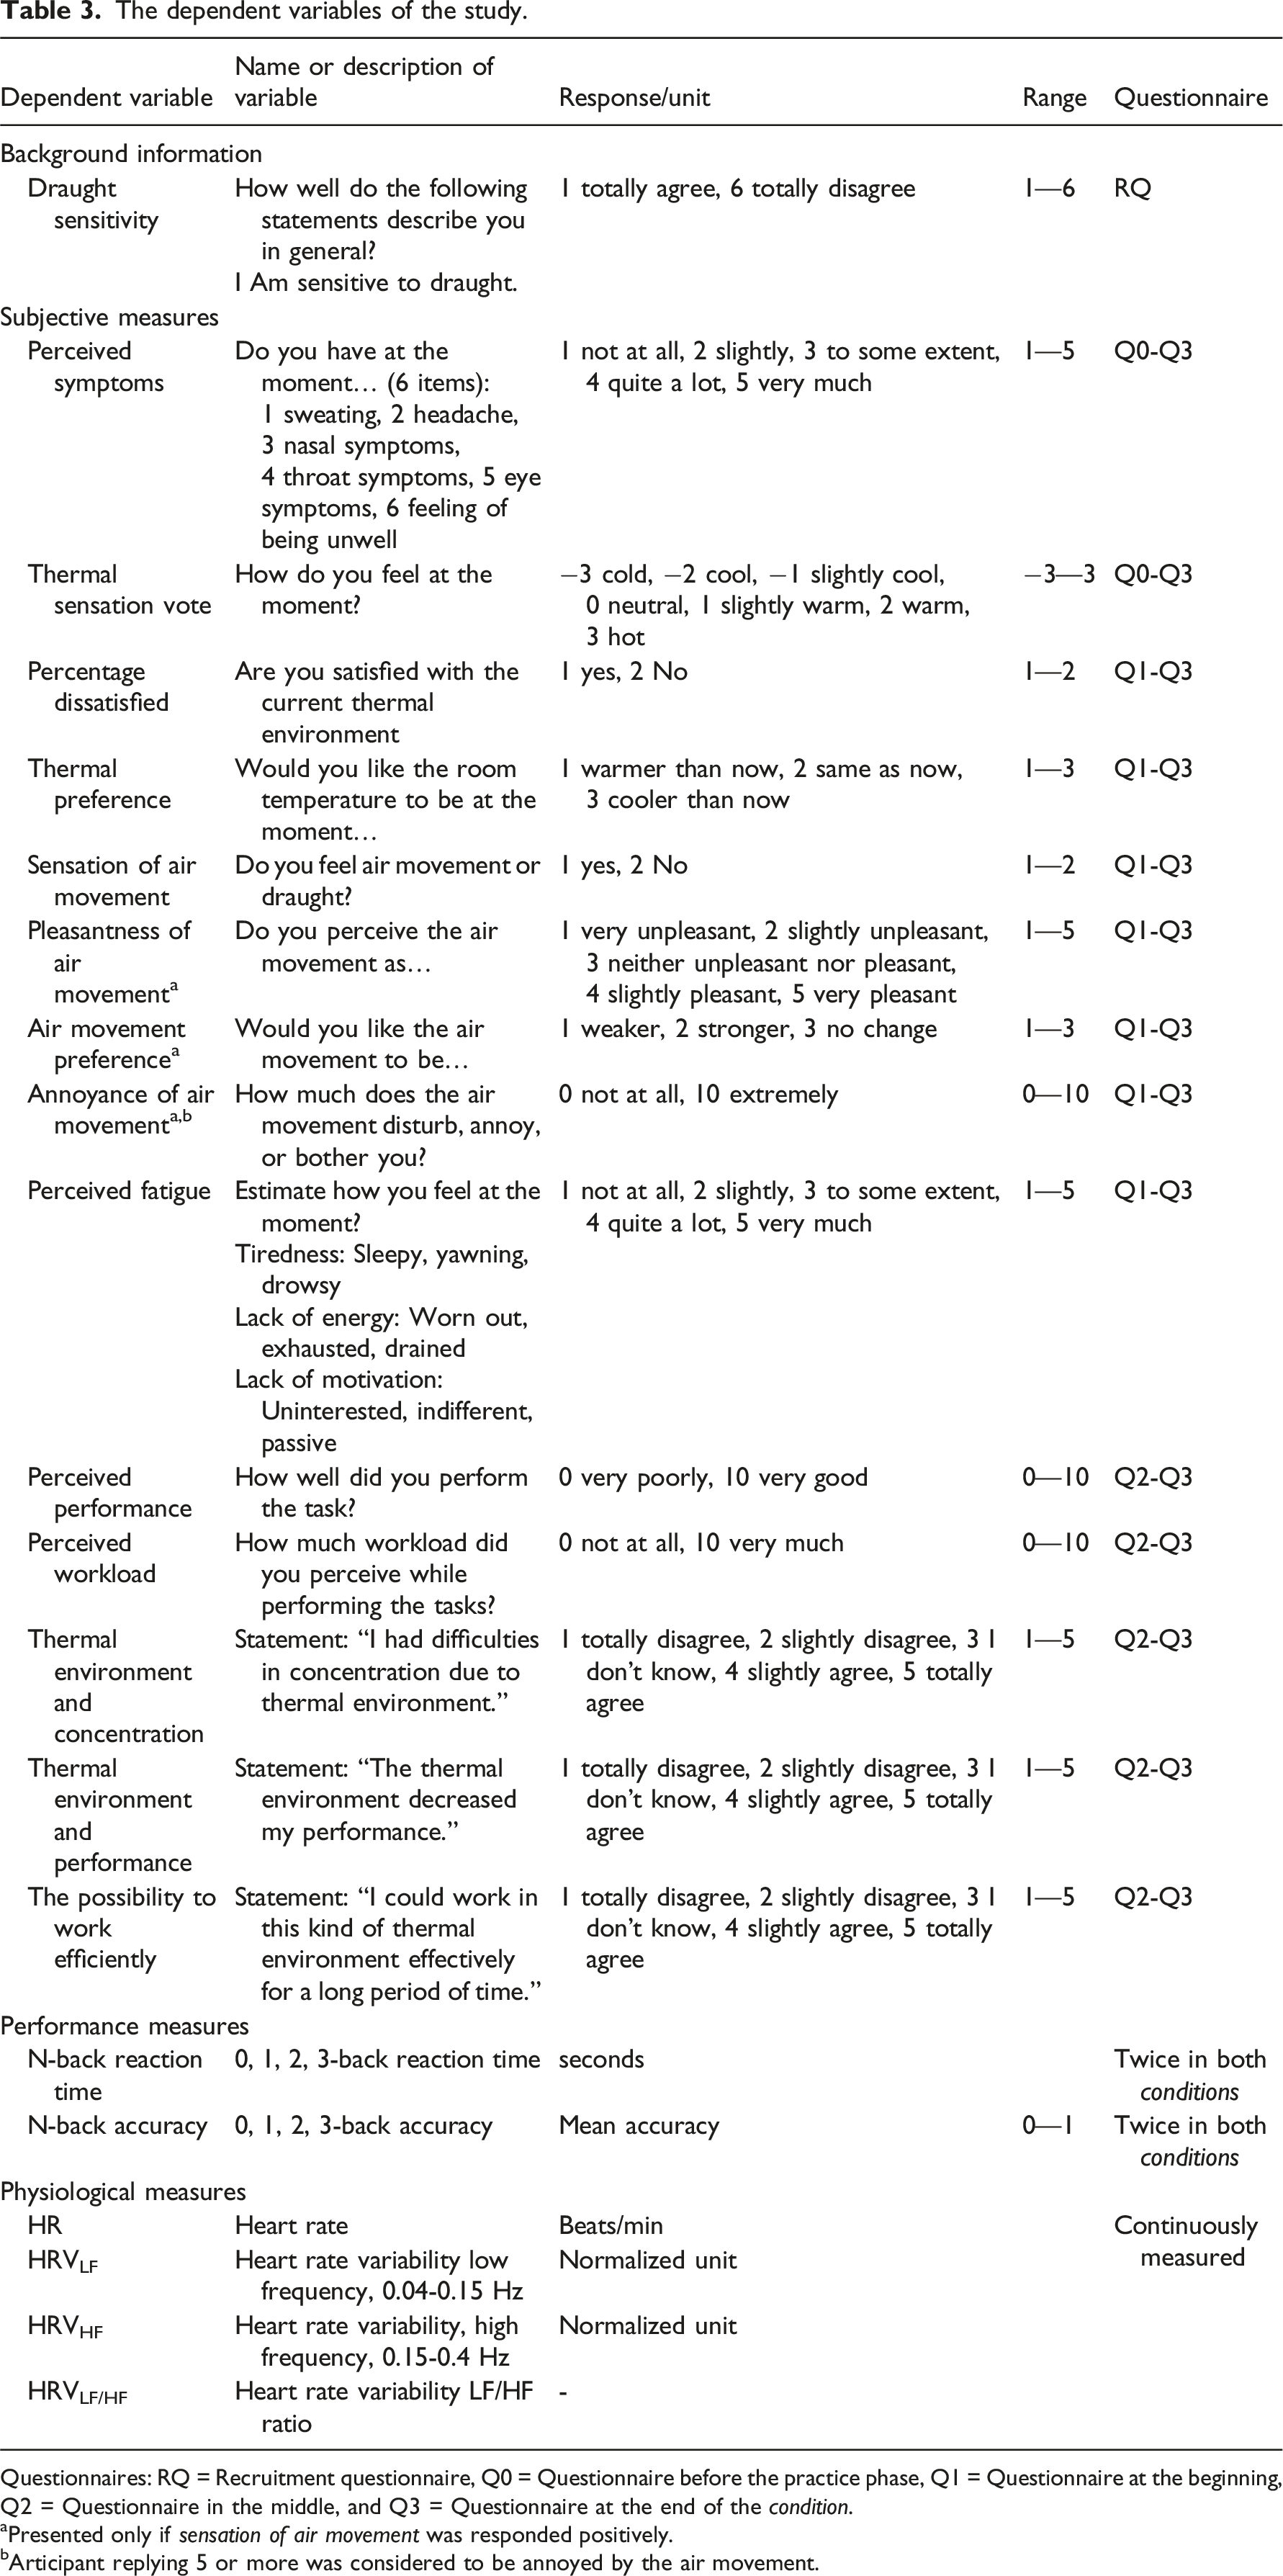
Questionnaires: RQ = Recruitment questionnaire, Q0 = Questionnaire before the practice phase, Q1 = Questionnaire at the beginning, Q2 = Questionnaire in the middle, and Q3 = Questionnaire at the end of the condition.
aPresented only if sensation of air movement was responded positively.
bArticipant replying 5 or more was considered to be annoyed by the air movement.
Performance variables
During the experiment, the participants performed N-back task (Table 3) and dummy tasks, which were presented using MATLAB R2018a with Psychtoolbox Version 3.0.15 (PTB; psychtoolbox.org). 34 N-back task was used since it has been sensitive to temperature changes 2 and air movement in warm environment. 28 Serial recall and operation span tasks were used as dummy tasks to keep participants busy between questionnaires and N-back tasks. In the serial recall task participants memorized 9 numbers presented in a random order on display. In the operation span task participants memorized a sequence of items while simultaneously performed simple math problems.
The N-back task is a working memory task requiring monitoring, updating, and manipulation of information. 37 0-Back requires just monitoring, 1-3 -back all abovementioned strategies. Sequences of letters are presented on the display one letter at a time for 500 ms with a 2500 ms inter-stimulus-interval. Four difficulty levels were used (0-back, 1-back, 2- back and 3-back). Participants were instructed to respond quickly, but accurately by pressing a key on the keyboard labelled YES (left arrow) or NO (downward arrow), depending on the instructions of the difficulty level. In 0-back, the task was to press ‘YES’ every time the letter ‘X’ appeared on the display and press ‘NO’ for all other letters. In 1-back, participants were required to respond whether the currently presented letter was identical to the one immediately preceding it. In 2-back, participants were required to respond whether the currently presented letter was identical to the one presented two trials back. In 3-back, participants were required to respond whether the currently presented letter was identical to the one presented three trials back.
Physiological variables
Heart rate variability (HRV) was measured with a sensor (Faros 180, Bittium Biosignals Ltd, Kuopio, Finland) attached to the participant with a textile belt and Stingray adapter, positioned under the chest muscle line. Participants attached the belt by themselves. The sensor monitored the participants’ electrocardiogram (ECG). HRV describes the variations between consecutive heartbeats, known as R-R intervals. 30 The accelerometer sampling rate was 25 Hz, and the dynamic range was ±4 g. The ECG sampling rate was 250 Hz. R-R interval data were analyzed with designated software (Kubios HRV, Kubios Ltd). Sensor was synchronized with the computer running the experimental tasks, and MATLAB used to present the tasks, also marked with the exact durations of the periods to be analysed. Each period started when questionnaire Q1 was opened and ended when questionnaire Q3 was submitted. These time markers were later entered into the ECG data. Analyses were done for the heart rate (HR), FFT spectrum to powers of LF (low frequency, 0.04-0.15 Hz; HRV LF ), and HF (high frequency, 0.15-0.4 Hz; HRV HF ) bands in normalized units and to the ratio of the LF and HF band powers (HRV LF/HF ) (Table 3).
Experimental procedure
The procedure is shown in Figure 3. Recruitment questionnaire RQ was filled beforehand online. The order of conditions was counterbalanced based on gender and draught sensitivity received from RQ. First, the participant read and signed the informed consent form. Then, the heart rate monitor was put on and practice phase started with questionnaire Q0 according to procedure. The practice phase was done in the control room (Figure 1). It included explaining and practicing all tasks one-by-one. The N-back task had 30 practice trials in each difficulty level, resulting altogether 120 trials in the practice phase. After the practice phase, participants moved to either Room 1 or Room 2 (Figure 1). The procedures of the first phase and the second phase were identical. Participants changed the room between the phases which lead to similar initial state in the second phase as in the first phase, since both phases started after changing the room. Procedures of the experiment.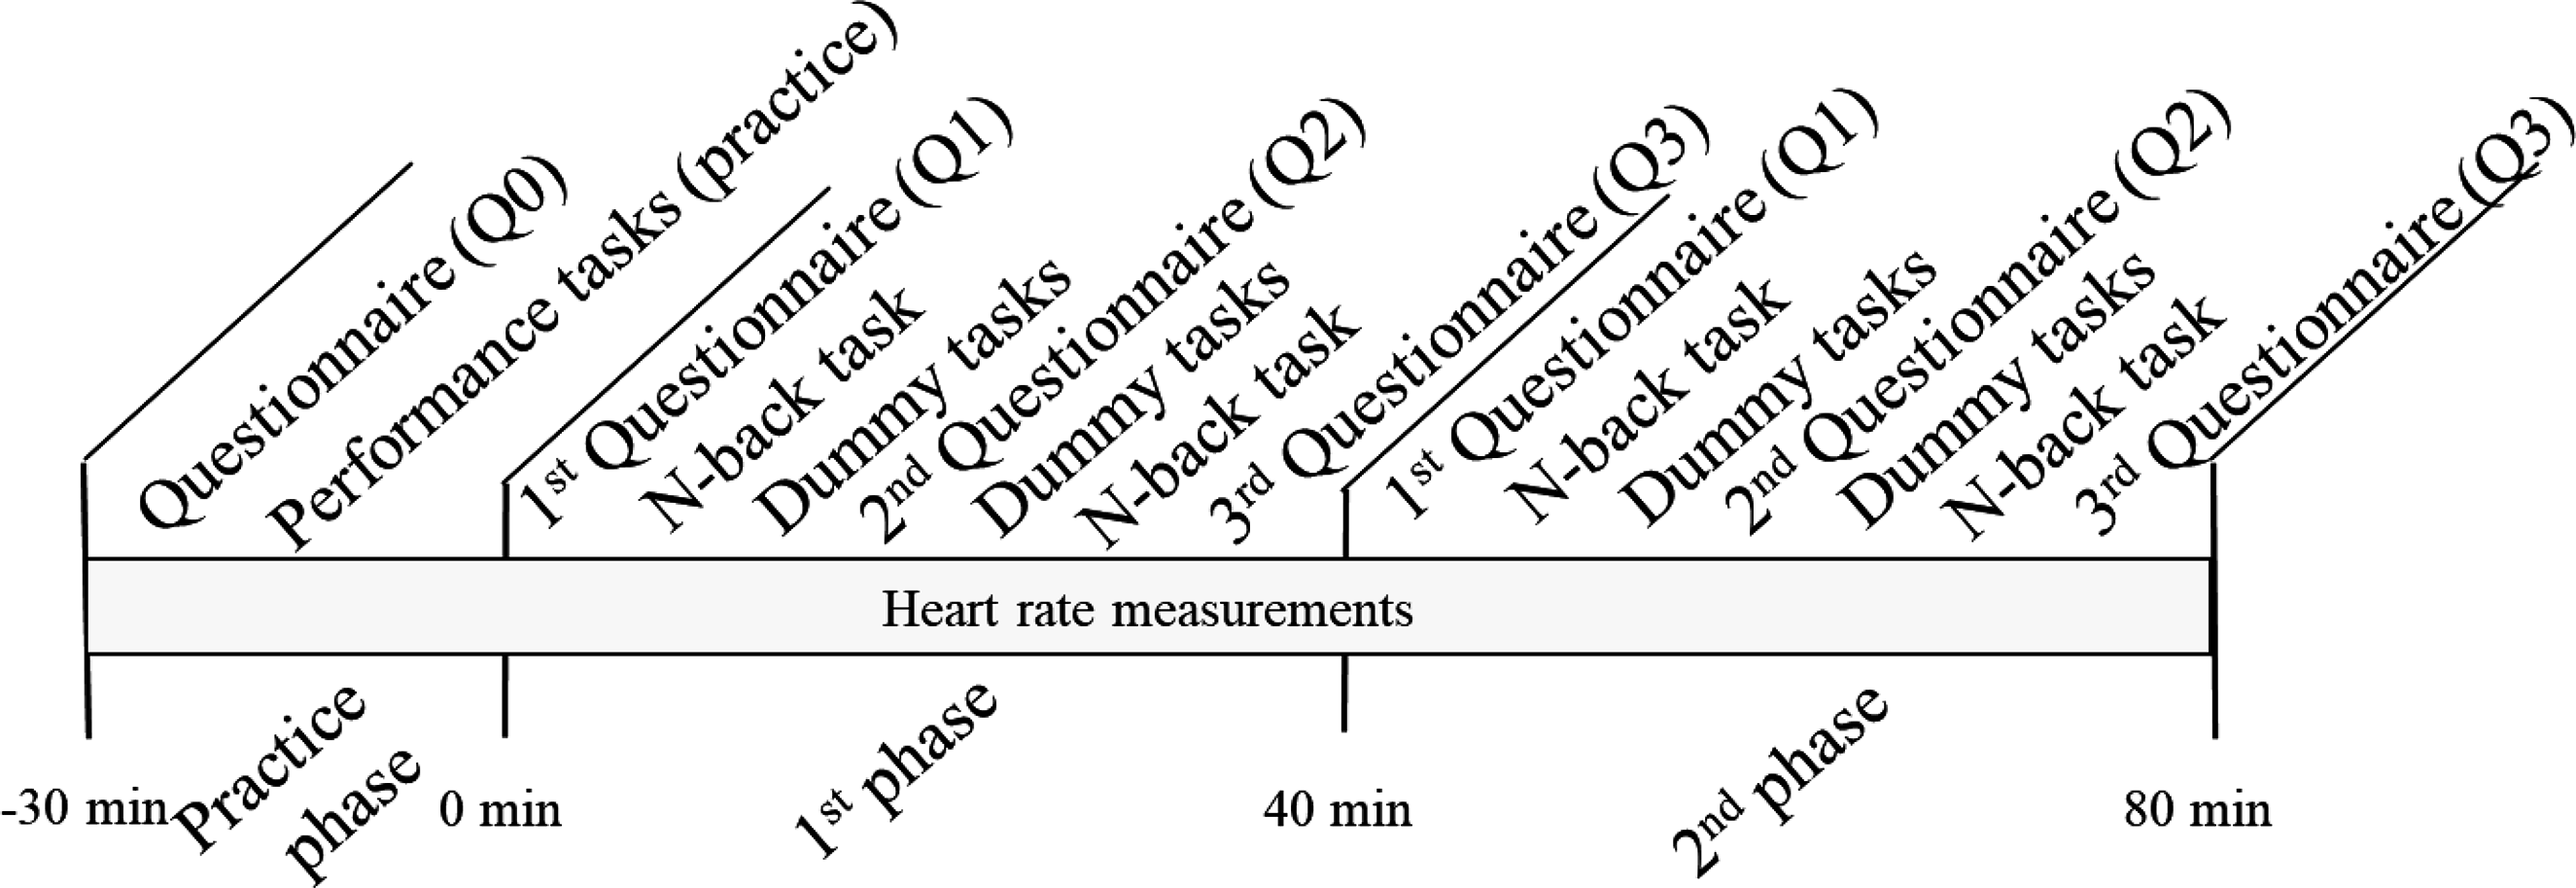
The first N-back task started, on average, after 2 minutes from the beginning of the phase, and the second N-back task started, on average, 9 minutes before the end of the phase. Questionnaire Q2 was filled in the middle of the phase.
Statistical analysis
Statistical analyses were conducted with IBM SPSS Statistics for Windows, Version 29 (IBM Corp., Armonk, NY, USA). The normality of the data was tested with Shapiro-Wilk test. A repeated-measures ANOVA or paired samples t-test (two-tailed) was used for normally distributed or similarly skewed data. The Greenhouse-Geisser correction was applied when Mauchly’s test indicated violation of sphericity, and the corresponding p-values are reported. Wilcoxon’s test was used for variables that were not normally distributed or similarly skewed. Marginal Homogeneity test was used for categorial variables. A p-value of 0.05 or less is considered as statistically significant.
The Mann-Whitney U test was used whenever comparisons were made to two independent samples. The grouping variables were gender and draught sensitivity.
The N-back task data was not normally distributed or similarly skewed. Therefore, each difficulty level was separately analyzed with Wilcoxon´s test and the Benjamini-Hochberg procedure was used for alpha-error adjustment. 38
The data regarding heart rate (HR), and FFT spectrum to powers of LF (HRV LF ) and HF (HRV HF ) bands in normalized units was normally distributed. The ratio of the LF and HF band powers (HRV LF/HF ) data was not normally distributed, but it was similarly skewed. Therefore, a paired samples t-test was used for analysis.
Results
Psychological measures
Thermal comfort
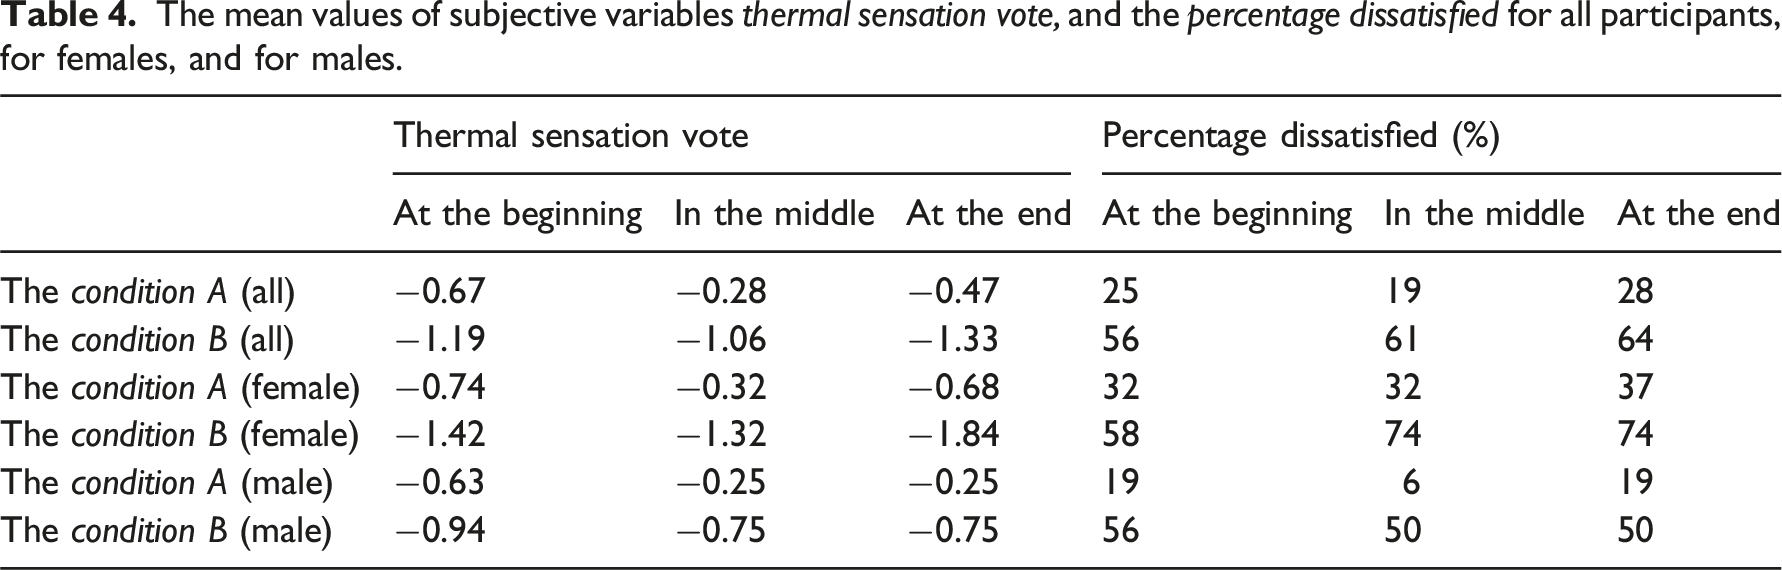
A significant difference between conditions was seen in thermal sensation votes (F1,33 = 19.94, p < 0.001). Figure 4 shows the distributions of the thermal sensation vote for all participants. Statistically significant differences between conditions were found in all studied exposure times (at the beginning: t (35) = 3.00, p = 0.005; in the middle: t (35) = 6.47, p < 0.001; at the end: t (35) = 6.78, p < 0.001). Table 4 shows the mean values of thermal sensation votes and the percentage of dissatisfied for all participants, for females and for males. A significant difference between genders was seen at the end of condition B in thermal sensation votes (t (33) = 3.66, p < 0.001). Females had lower thermal sensation than males. No significant differences were seen between Draught sensitive group and Draught neutral group (all p’s > 0.05). The distribution of thermal sensation votes in conditions A and B as a function of the exposure time. The box contains the middle 50% of the votes and the central bold line is the median of the distribution. Upper and lower quartiles are above and underneath the box, respectively. The mean values of subjective variables thermal sensation vote, and the percentage dissatisfied for all participants, for females, and for males.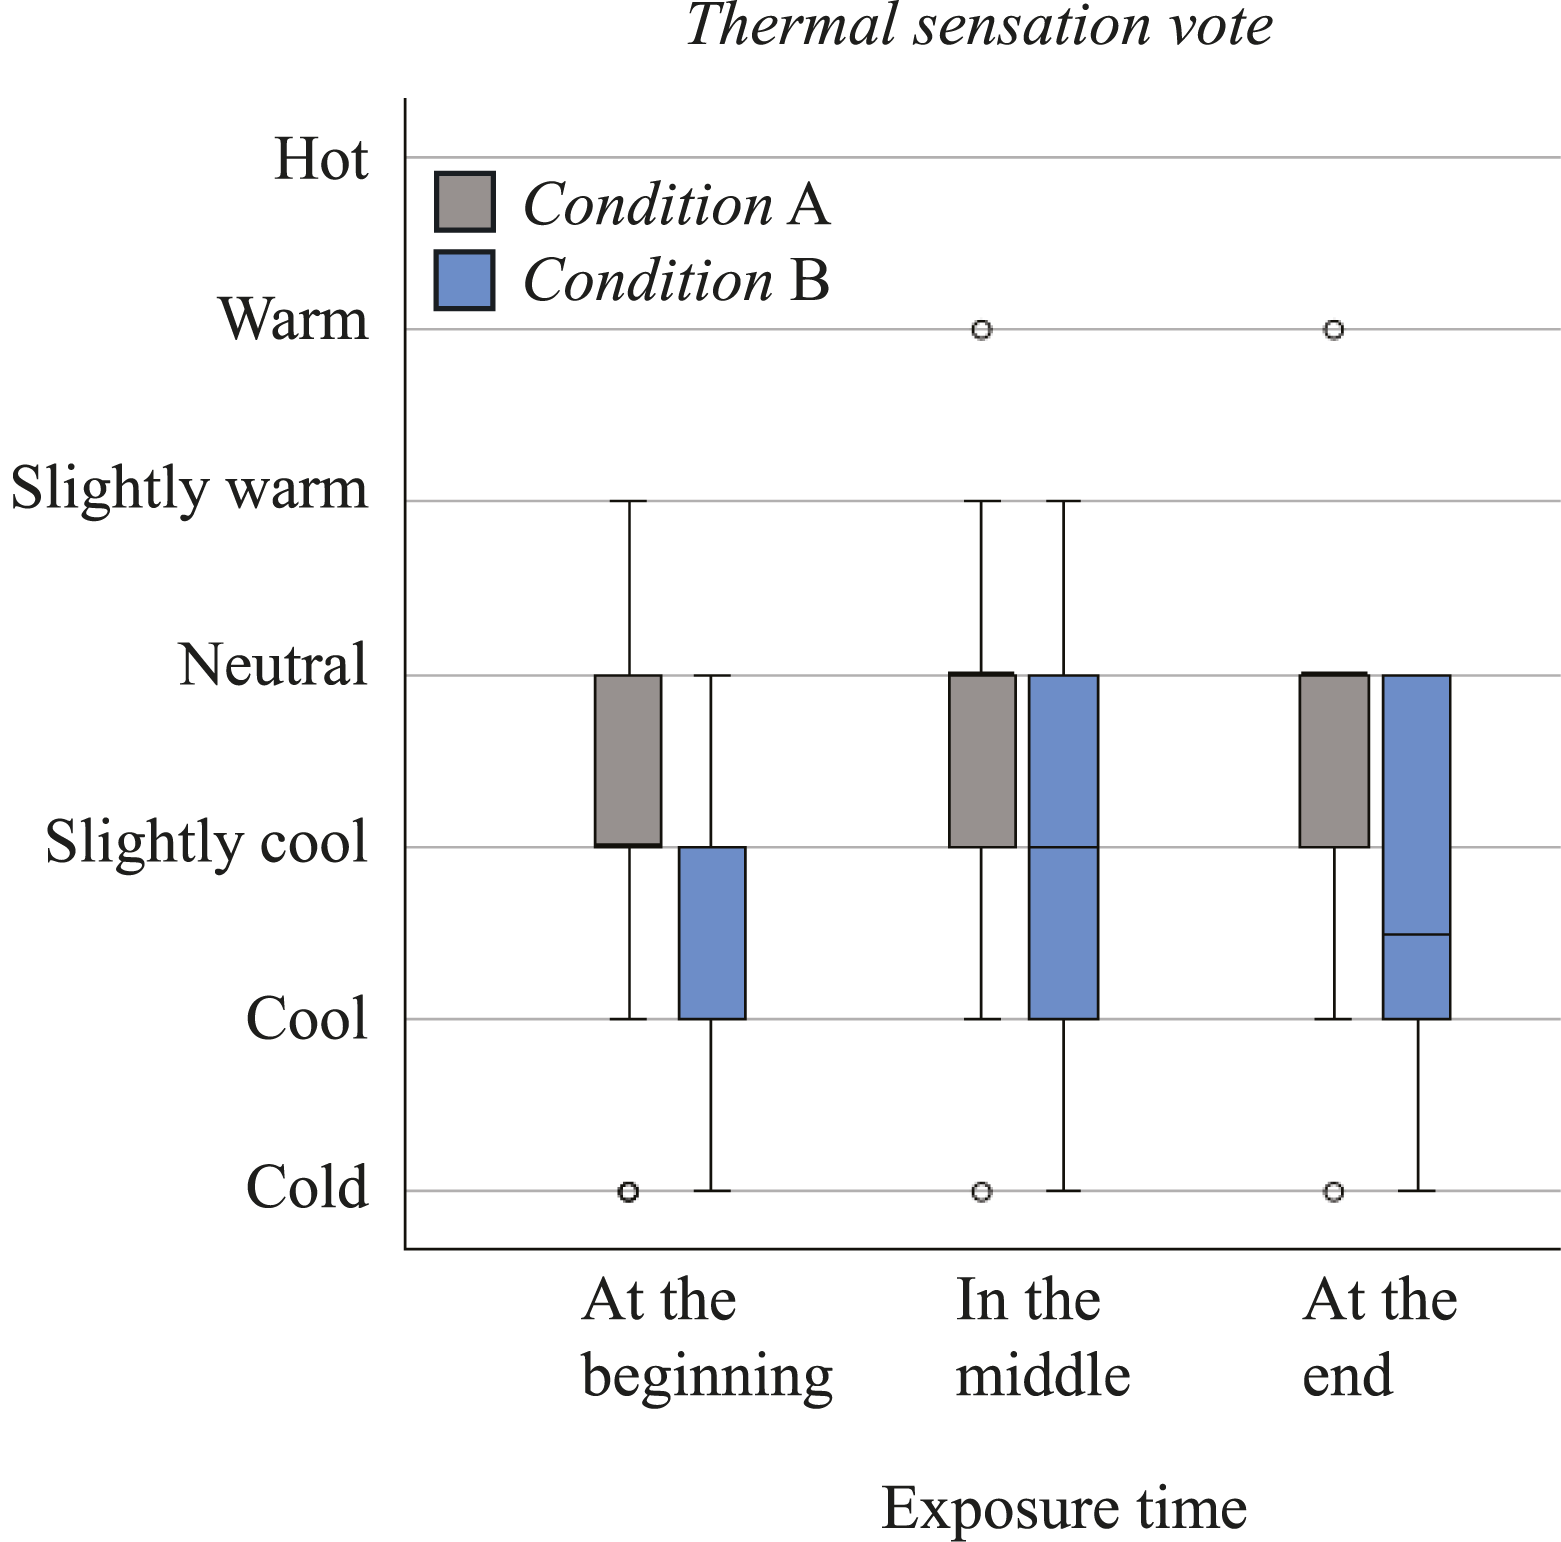
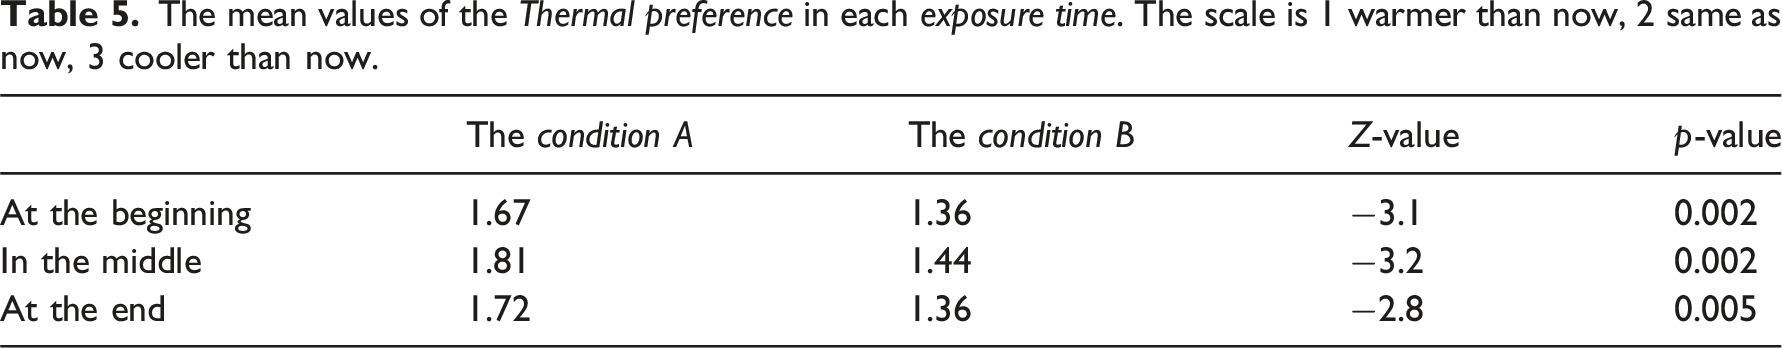
The mean values of the Thermal preference in each exposure time. The scale is 1 warmer than now, 2 same as now, 3 cooler than now.
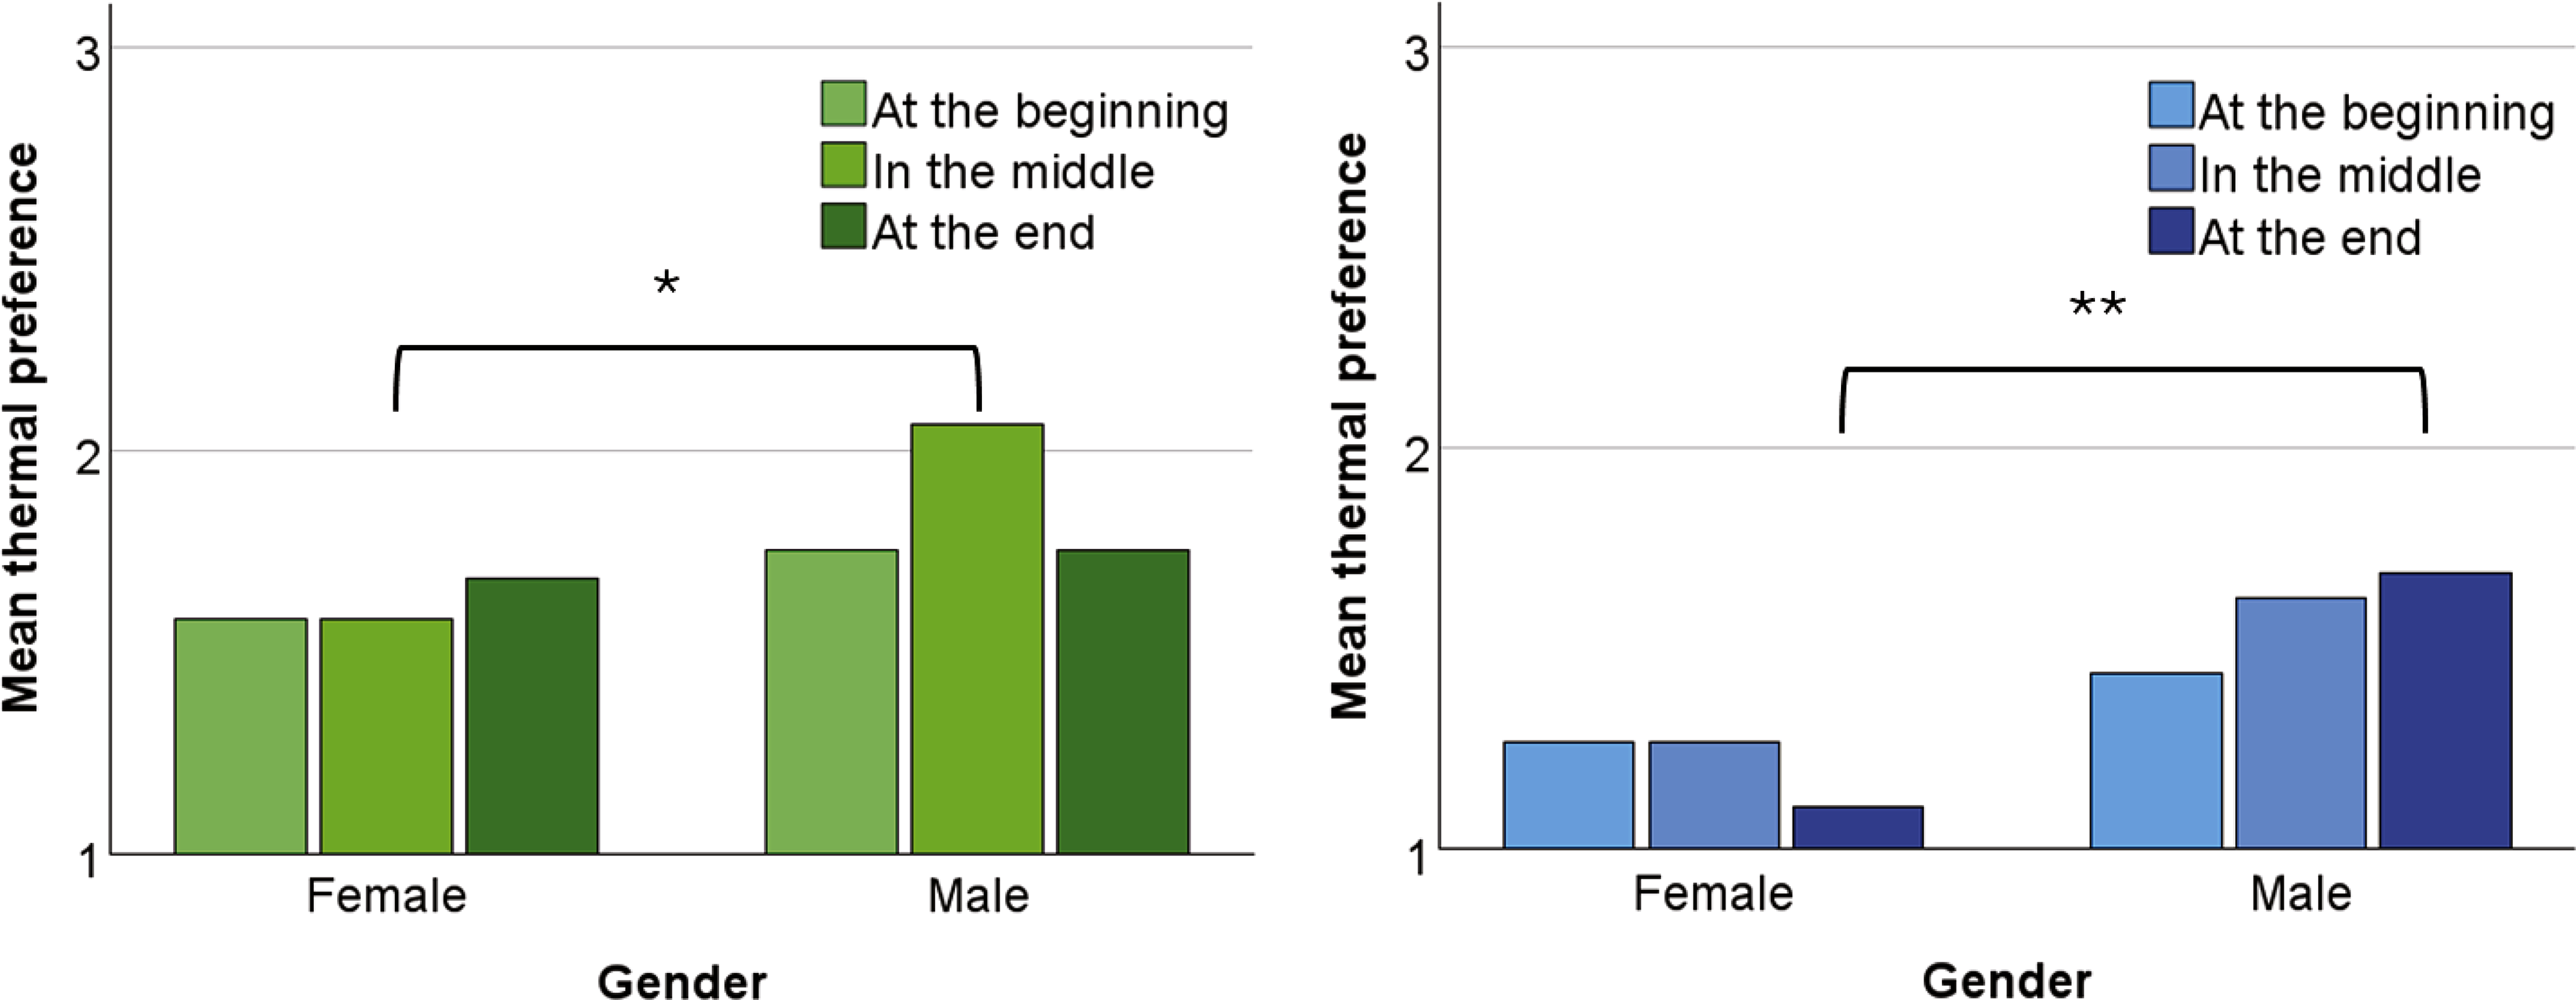
The mean values of genders’ thermal preference in each exposure time (scale 1 = warmer than now, 2 = same as now, and 3 = cooler than now). The condition A is on the left and condition B is on the right. Marking * is for p < 0.05 and ** is for p < 0.01.
Perception of airflow
Sensation of air movement differed between the conditions. Approximately 90% of responses indicated that the air movement is felt in condition B, while 15% of responses was “yes” in condition A. In condition B, the air movement was perceived as unpleasant among 64% of responses. Females reported the air movement to be more unpleasant than males at the end of condition B (Z = −2.3, p = 0.020). The difference was nearly significant in the middle of condition B (Z = −1.8, p = 0.067). Approximately 80% of the responses indicated that they wanted weaker air movement, and 20% of the responses indicated that they wanted no change to the air movement in condition B. No responses were given to the option stronger. Annoyance of the air movement showed that approximately 50% of the participants were annoyed by the air movement at the beginning, 36% in the middle, and 49% at the end of condition B. Approximately 58% of female votes, and 31% of male votes reported to be annoyed by the air movement. Also, a difference between Draught sensitive group and Draught neutral group was seen in the middle of condition B (Z = −3.0, p > 0.003). Approximately 52% of Draught sensitive group, and 13% of Draught neutral group reported to be annoyed by the air movement.
The local sensation of air movement, body parts where air movement is felt as pleasant and body parts where air movement is felt as unpleasant were asked with open questions if sensation of air movement was responded positively. The air movement was mainly felt in hands (87%), face and head (52%), and torso (14%). Thighs and feet received only few votes. The percentage of participants reporting air movement to be unpleasant was approximately 45% (hands), 19% (face and head), and 3% (torso), and pleasant 8%, 4%, 0%, respectively.
Perception of symptoms
All perceived symptoms were minor, and no statistically significant differences between conditions were observed (all p’s > 0.05). The mean value was below 1.8 in all symptoms in both conditions, and in all exposure times. Similarly, the mean values of all items of perceived fatigue were always below 2, and no statistically significant differences were seen (p > 0.05).
Perception of work performance
Perceived performance and perceived workload did not differ between conditions for all data (all p´s > 0.05). However, Draught sensitive group had lower perceived performance (mean 4.0) than Draught neutral group (mean 6.1) at the end of the exposure time in condition B (Z = −2.6, p = 0.011). Also, perceived workload was higher among Draught sensitive group (mean 5.9) than Draught neutral group (mean 4.3) at the end of the exposure time in condition B (Z = −2.1, p = 0.036). No statistically significant differences between genders were seen (all p’s > 0.05).
With more focused questions related to the effects of thermal environment, a significant difference between conditions were seen. At the end of the exposure time, the thermal environment was perceived to impair concentration (Z = −2.5, p = 0.011) and work performance (Z = −2.7, p = 0.007) more in condition B (Figure 6). The condition A was perceived to be better for the possibility to work efficiently for a long period of time (Z = −2.5, p = 0.014, Figure 6). A gender difference was seen at the end of condition B in variables thermal environment and concentration (Z = −2.3, p = 0.020) and the possibility to work efficiently (Z = −2.0, p = 0.046). Approximately 38% of females, and 27% of males reported that the thermal environment impaired their concentration, and 79% of females, and 47% of males reported that they could not work efficiently for a long period of time in that kind of thermal environment. In the middle of condition B, there was a significant difference between Draught sensitive group and Draught neutral group in variables thermal environment and concentration (Z = −2.6, p = 0.009) and thermal environment and performance (Z = −2.3, p = 0.023). The Draught sensitive group responded the thermal environment to impair concentration in 62% of responses, and to impair work performance in 19% or responses. The Draught neutral group responded 20% and 13% of responses, respectively. No differences between these two groups were seen at the end condition B (all p’s > 0.05). The mean values of statements regarding perception of work performance (Scale: 1 = Totally disagree, 2 = Slightly disagree, 3 = I don’t know, 4 = Slightly agree, 5 = Totally agree). Marking * after the statement is for p < 0.05.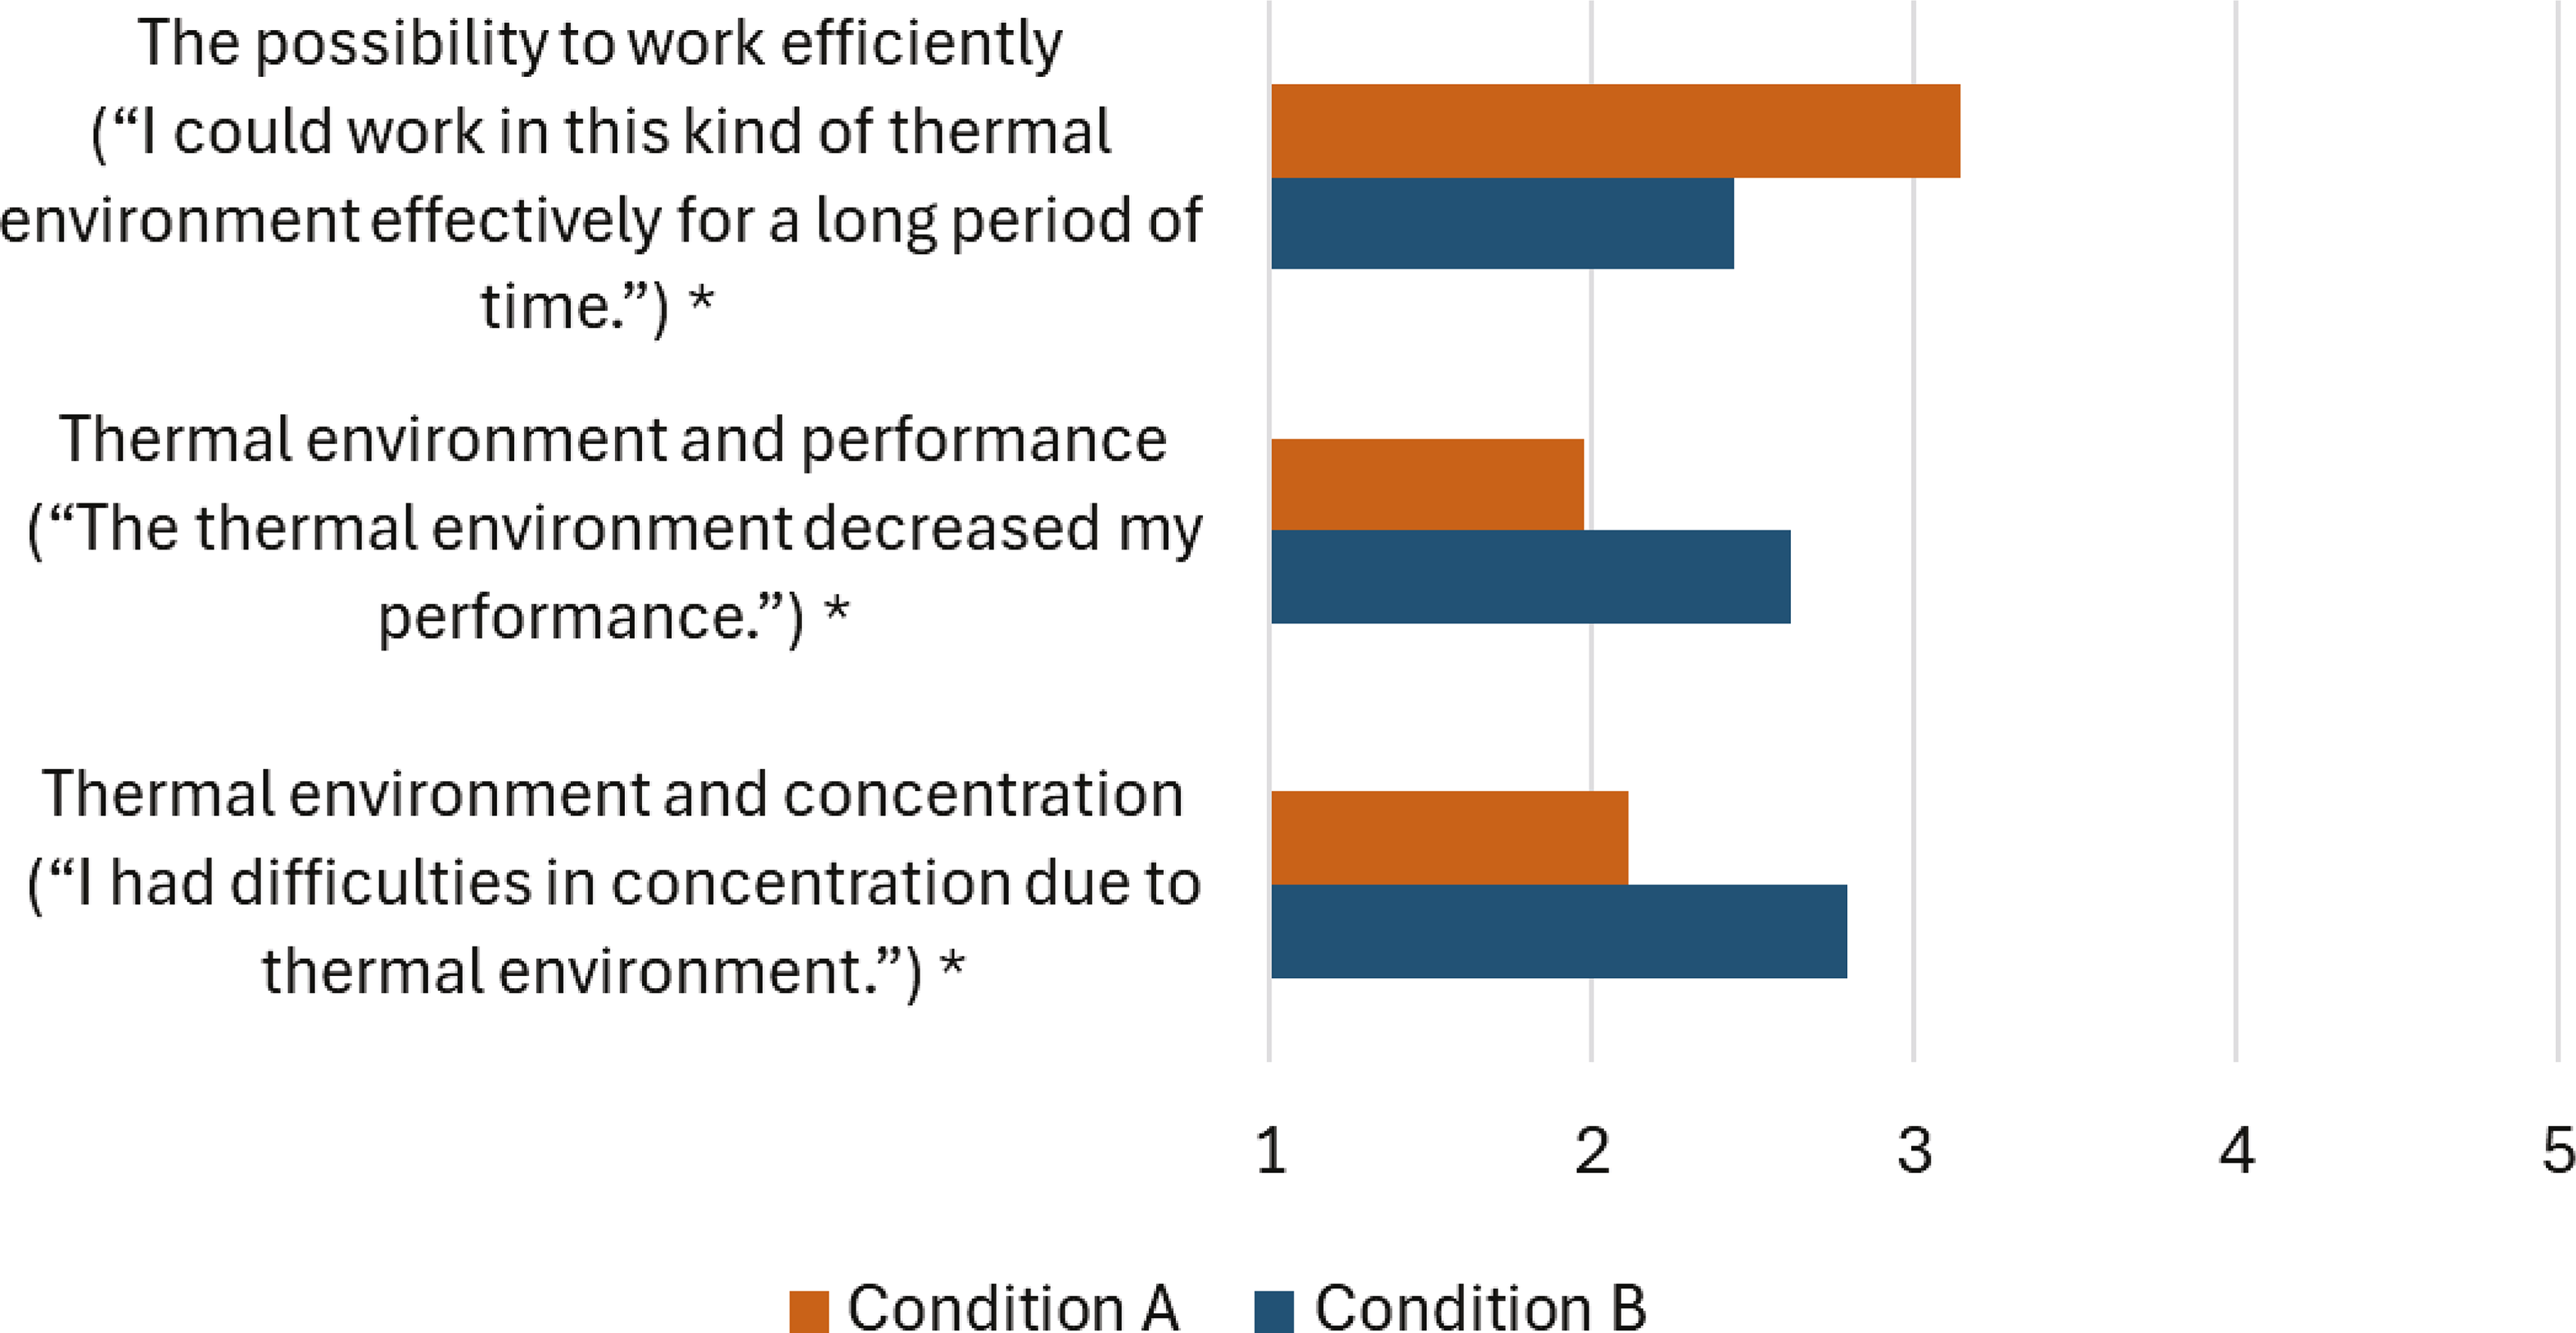
Performance measures
The condition did not have a statistically significant effect on N-back accuracy (Table S1 in the supplementary material) nor N-back reaction time (Table S2 in the supplementary material). Interestingly, the N-back accuracy of the 0-back task was weaker in condition B than in condition A (Z = −2.680, p = 0.028) for the Draught sensitive group.
Physiological measures
The conditions did not differ from each other regarding heart rate (HR) nor heart rate variability measures (HRV LF , HRV HF , HRV LF/HF ). None of the pairwise comparisons were significant (p > 0.05). Analysis was also done for the Draught sensitive group (N = 21), with similar results. The mean values, standard deviations and statistical analysis results can be seen in the supplementary material (Table S3).
Discussion
Analysis of results
In this study a laboratory is furnished to resemble a real office with commercially available furniture and HVAC solutions, and thermal and air movement conditions are created to be as similar as possible to a real-life draughty condition by adjusting the heat loads instead of creating increased air movement with local supply air terminals or fans. A condition with collided supply jets from ACB (increase air movement, condition B) was compared to a condition where ACB were functioning appropriately (low air movement, condition A), while supply air devices, room layout and room temperature were kept the same. The local temperature at the occupied zone was 0.5°C cooler in condition B due to the downfall of collided supply jets. Psychological, physiological and performance effects were studied from the participants working under these conditions. The increased air movement caused negative effects seen in many subjective responses.
The condition did not have a statistically significant effect on work performance in the N-back task. Previous studies have shown that performance in this task can decrease with increasing temperature 2 and increase with increasing air movement in elevated temperatures. 28 However, those studies did not have air movement causing unwanted cooling, as in our study. On the other hand, Yang et al. 39 saw no effect of temperature on the performance of N-back task with narrower temperature range than Maula et al.. 2 This is in a line with our study, which did not have large temperature differences as Maula et al. 2 did.
In addition to objective performance measures, subjective performance effects were studied. The condition did not affect perceived performance. However, the thermal environment was perceived to impair concentration and work performance more in condition B. Also, condition A was perceived to be better for working efficiently for a long period of time. This means that participants perceived that they were able to remain their performance, though it was perceived to be more challenging in condition B.
The PMV model was able to predict well the participants’ mean thermal sensation vote, especially at the end of condition A. At the end of condition B, the PMV model underestimated the cool sensation, which is in line with previous findings by Van Hoof. 19 The PPD model underestimated the percentage of dissatisfied. Similar findings have been found before with similar rigorous study design when thermal environment is adjusted to theoretical comfort zone according to PMV-PPD model. 2 The calculated draught rate at the occupied zone in condition B was always below 45%. The air movement was perceived as unpleasant in 64% of responses and 80% of responses indicated that they wanted weaker air movement. Therefore, the draught rate model gave lower percentage than subjective measures.
A gender difference was observed in thermal sensation vote at the end of condition B. Females had a lower mean thermal sensation than males. The percentage of dissatisfied was higher among females than males. Similar findings regarding gender differences can be seen in thermal preference in both conditions as well. This is in line with previous studies showing females to be more dissatisfied than males especially in cooler conditions.20–22 Females also reported the air movement to be more unpleasant than males at the end of condition B. This verifies findings by Kalmár & Kalmár 22 who found females to be more dissatisfied with increased air speed than males. In addition, our study found a gender difference in perception related to the effect of thermal environment (condition) on concentration and the possibility to work efficiently for a long period of time. Previous studies have focused on gender difference regarding thermal sensation, comfort, and satisfaction.
It seems that the Draught sensitive group differed from the Draught neutral group regarding objective and subjective performance measures. This was seen in the accuracy of the N-back task, and in the perception of the effects of thermal environment on concentration and performance. Draught sensitive group was more annoyed by the air movement than draught neutral group. Interestingly, the Draught sensitive group did not differ from Draught neutral group regarding thermal sensation and comfort. We would have expected these two groups to differ also regarding thermal sensation and comfort. Nevertheless, these results confirms that not only physiological factors, such as, age, gender, BMI etc. Should be considered in contrast of individually differences of occupants. In addition, subjectively assessed individual factors, such as draught sensitivity (defined in Table 3), should be taken into account. This is in a line with Zhang et al., 25 finding that subjectively assessed background factor, thermal preference, was important since it had an effect on objectively measured physiological responses.
No effects were seen on heart rate nor heart rate variability. Previous studies have shown that LF/HF increases when participants are exposed to high or low temperatures, 31 but in in our study we had almost equal temperatures. Also, the airflow in occupied zone differed from those studies, since here we manipulated the thermal environment and airflow patterns in whole room scale, not with local device. The airflow pattern of collided supply jets differs regarding timely and locally variations from the patterns gained from local fans. Our air speeds were also lower than those of Zhu et al.. 31
Strengths and limitations
Our study contains several strengths. We conducted a controlled laboratory conditions simulating a real-world draughty and non-draughty conditions with commercially available HVAC products, and the draughty condition was created by adjusting the heat loads instead of creating increased air movement with local supply air terminals or fans. The two rooms involving different experimental conditions had exactly similar appearances. Participants were unaware of the research question. The effects of condition were studied very broadly using psychological, performance, and physiological variables. Participants were tested in both conditions during one visit, since we had nearby rooms reserved for different conditions. To minimize the learning effect, participants practiced the performance task before entering the laboratory, and the order of conditions was counterbalanced. The conditions studied were planned using the PMV model. We managed to get participants mean thermal sensation vote slightly below 0 (Neutral) in condition A, as planned. It is rather challenging to control airflow patterns of collided supply jets in a whole room level, but we managed to create increased air velocities into the workstation without additional fans.
Despite all that, there are some limitations in our study. We studied only one draughty condition with certain inlet device. There are many others, so our results alone cannot be generalized to draughts in overall. Participants were mainly young students and may not represent older part of the population. The results represent the set-up for this study including certain clothing insulation value and activity level. Different results are possible with variations of clothing and activities. There are many parameters in airflow affecting perception. Only one type of airflow, including certain direction, orientation and velocity range, is studied here. Finally, the exposure time was rather short compared to real-world working hours in offices. It is possible, that with longer exposure times more negative effects of increased air movement rises. This should be considered in future studies.
Conclusions
Our study examined the effects of working under the collided supply jets from active chilled beams on occupants’ perception, work performance, and stress. A commercially available products and air conditioning solutions were used. Working under the collided supply jets caused negative effects seen in many subjective responses. It was perceived to be worse for concentration, performance and working efficiently for a long period of time. Some performance effects were observed within Draught sensitive group, and no effects were seen in physiological stress measures. Our results indicate that working under the influence of collided supply jets might generate stronger negative effects among females and draught sensitive persons. The parameter, draught sensitivity, was able to divide participants into groups, which were differently affected by the same stimuli. Therefore, it is recommended to use draught sensitivity whenever air movement is studied with humans, especially when the differences between draught related conditions are rather small.
Supplemental material
Supplemental Material - Working under the collided supply jets of active chilled beams - The effect on comfort and work performance
Supplemental Material for Working under the collided supply jets of active chilled beams - The effect on comfort and work performance by Henna Maula, Arttu Sivula, Jenni Radun, Iida-Kaisa Tervahartiala, Valtteri Hongisto in Building Services Engineering Research & Technology
Footnotes
Ethical considerations
The ethical committee of Turku University of Applied Sciences approved the study (statement 2021–06). All participants provided voluntary informed consent before participation.
Consent to participate
All participants provided voluntary informed consent before participation.
Funding
The authors disclosed receipt of the following financial support for the research, authorship, and/or publication of this article: This study was part of MOTTI –project, whose main funder is a public-research funding organization Business Finland (decision no. 2682/31/2019). Other funders are Audico Systems Ltd, Framery Ltd, Halton Ltd, Martela Ltd, Rockwool Finland Ltd, Pietiko Ltd, University Properties of Finland Ltd, Finnish Ministry of the Environment, Turku Technology Properties Ltd, and Turku University of Applied Sciences Ltd.
Declaration of conflicting interests
The authors declared no potential conflicts of interest with respect to the research, authorship, and/or publication of this article.
Supplemental material
Supplemental material for this article is available online.