
Abstract
Thermal comfort is influenced by climate, expectations and adaptation opportunities. Hence the emergence of adaptive thermal comfort standards. Unfortunately, international adaptive standards and much of the underlying literature, are based on data collected from middle-income individuals in office or apartment blocks, raising the question of their validity in other contexts. This paper is the first large-scale investigation of the applicability of these standards to populations living in refugee/displacement camps, to establish whether comfort theory needs to be modified for such populations. This was achieved through highly difficult, data collection in camps in Jordan, Djibouti, Ethiopia and Peru. The data collected consists of 1982 rows of personal variables and concurrent environmental measurements. From these, the thermal comfort boundaries of the displaced were found to be wider (13K) than suggested in prevalent standards (8K). A new mathematical model of thermal comfort for such groups is hence developed. The results expand our understanding of comfort theory to include an understudied population and will be useful for those responsible for shelter for the currently 120M displaced, as they now allow rational design standards to be set. A tool based on the new model is currently being applied by aid agencies in camps in Afghanistan.
Practical Application
The design of refugee accommodation across aid agencies requires the setting of design standards, as these impact material choice, construction techniques and cost, and hence the number of people that can be housed in any disaster. Highly constraining standards can thus reduce the population that can be housed, with associated implications for mortality rates. The alternative being the failure to set any quantitative target, creating a danger to life. The new thermal comfort model presented here allows for the first time the setting of targeted comfort design standards in camps.
Introduction
Thermal comfort is the second fundamental requirement for occupants of buildings after indoor air quality 1 and it influences their satisfaction with the indoor environment as a whole. 2 This is indeed also the case for people living in temporary shelters in refugee camps, where thermal comfort has been found to be the second most important priority following security. 3 A knowledge of what constitutes thermal comfort in these settings fundamentally determines several critical aspects of delivering transitional shelters, namely the design, material selection, buildability, speed and cost. To have a thermally comfortable space, an indoor environment close to thermal neutrality must be achieved. 4 Thermal neutrality is defined as the operative temperature To (To is a combination of the air and radiant temperatures and the airspeed) at which an average person or a group of people will feel neutral that is, neither hot or cold. 5
International standards on thermal comfort in buildings were historically based on the steady-state temperature approach, and in particular the predicted mean vote (PMV) index. This approach predicts human body thermal balance “with a given level of clothing insulation while undertaking a certain activity in a given environment”. 6 This approach assumes that any level of thermal stress is undesirable. 7 However, over the past three decades, many researchers have demonstrated that people can adapt to a wide range of temperatures. For example, people living in hot climates were found to be satisfied at temperatures as high as 30°C or more, which were previously deemed uncomfortable.8–10 Such results led to the creation of the adaptive thermal comfort theory, which was incorporated into the ASHRAE-55 standards and the European Standard EN 16,798 (formerly 15,251).
The ASHRAE Standards adaptive thermal comfort model (ASHRAE-ATCM) is increasingly applied to define acceptable indoor conditions worldwide in naturally ventilated settings, and it is accepted as an international standard.11,12 This is because the project on which the standards were based covered a wide range of hot, cold and temperate climates. However, only two projects out of 20 in the ASHRAE project (RP-884) were conducted in developing countries, namely, Indonesia, 13 and Pakistan. 14 It is often argued that the economic status of countries and/or occupants affect their expectations and in turn their adaptive response suggesting that people in lower economic groups can exhibit higher thermal tolerance 15 However, all the studies in the ASHRAE project were conducted in either office buildings or residential building blocks, 8 as such, the occupants were likely to be economically comfortable regardless of the economic classification of the studied country.
Research on thermal comfort boundaries in refugee camps settings is very limited. 3 There is evidence, however, that migrating populations find it difficult to adapt to environments that are less thermally comfortable than their long-term thermal history. 16 This suggests that displaced people may not be as adapted to their new environment. This paper aims to investigate the applicability of the ASHRAE-ATCM to impoverished and marginalised populations, in particular, those living in informal settlements and refugee camps. The overarching research question is: does poverty result in higher tolerance and adaptability to a wider range of temperatures than those predicted by the ASHRAE-ATCM and, if so, to what extent?
This will be achieved by analysing data from thermal comfort surveys conducted for the paper in refugee camps in Jordan, Djibouti and Ethiopia; and informal settlements in three locations in Peru. Then, compared the results to ASHRAE-ATCM which covered a wide range of climatic conditions and geographical locations.
Background: Adaptive thermal comfort and economic status
The adaptive theory considers physiological (acclimatisation), behavioural (adjustment) and psychological adaptation (habituation and expectation). 8 De Dear and Brager (1997) explained that “Psychological adaptation encompasses the effects of cognitive and cultural variables and describes the extent to which habituation and expectation alter thermal perceptions”. 8 It is hence suggested that the economic status or wealth of individuals influences their expectations and ability for psychological adaptation. For example, when Givoni developed his Building Bioclimatic Charts in the 1970s he suggested two different comfort envelopes, one for developed and another for developing countries. He argued that “it is reasonable to assume that people in developing hot countries, living mostly in non-air-conditioned buildings, were acclimatised to, and would tolerate, higher temperatures and/or humidity”, 15 thus he suggested an elevation of 2°C and 2 gr/kg moisture content for developing countries.
On the other hand, the ASHRAE project RP-884, on which the adaptive standards were based includes adaptive thermal studies from all over the world covering a wide range of climatic zones. In its final report it did not distinguish between the expectations of the population based on their national economic classification, 8 and its new adaptive standards.4,17–19
It is well accepted that the brain’s interpretation of warmth or coldness as pleasing or displeasing is influenced by the psychological conditions against which the stimuli are received, such as the individual’s recent thermal history, age, sex, culture and expectations. 20 McIntyre (1981) said that “a person’s reaction to a temperature, which is less than perfect will depend very much on his expectations, personality, and what else he is doing at the time”. 21
Recent research seems to focus more on the relationship between psychological factors such as the access to controls, and the sensation of thermal comfort; or the distinction between thermal perceptions in naturally ventilated buildings, versus air-conditioned based on occupants’ expectations. Few studies have investigated the relationship between subjects’ economic classification and their thermal sensation. One study looked at rural and urban thermal comfort in naturally ventilated residential buildings in winter and found that the mean thermal sensation vote of rural residences was approximately +0.4 (on a scale of −3 cold to +3 hot) higher than that of urban residences at the same operative temperature, suggesting that rural occupants may have had a higher tolerance or lower expectations. 22 Similarly, another study conducted in similar cold weather in Chile 23 found that low-income residents felt thermally comfortable at much lower temperatures than those predicted by ASHRAE-55 and EN 16,798-1. The high tolerance of the occupants was considered to be a result of fuel poverty and cultural adaptation. In another thermal comfort study conducted in two private universities that had significantly different tuition fees in Jakarta, 100% of the students surveyed in the first university had air-conditioning units in their accommodation, while only 50% of the students in the second university had the same. 24 The results found that the neutral temperature of the second group was 0.8 K higher than the first group. A study which looked at thermal comfort in three economic groups in India and found that the mean overall neutral temperature was always higher in lower economic groups. In addition, a greater tendency towards non-adaptive behaviour and lifestyle was found in the higher economic groups. They preferred much lower temperatures even though their indoor temperatures were the lowest, revealing a low level of tolerance. 25
However, it should be considered that the concept of tolerance, acceptance and preference is different; in other words, people with limited financial resources may tolerate and accept higher temperatures but this does not necessarily mean that they would prefer it. Indraganti explained that “thermal acceptance” is a different concept from “thermal comfort”. In a study on thermal comfort in India, the author found that although only 8% voted neutral on the sensation scale in May, 69% of the subjects voted that the thermal environment was acceptable on the acceptance scale. 26
Research in refugee and displacement camps is an emerging field, spanning various regions and tackling diverse climatic conditions. Several studies investigated thermal conditions in shelters, and found that they suffered from poor indoor environments categorised by very high or very low temperatures and inadequate heating or cooling measures.27–33 However, only two studies specifically investigated thermal comfort boundaries in accordance with the adaptive thermal comfort theory in displacement settings.3,34 The first found the neutral temperature of displaced people in Nepal to be 23.9°C which was much higher than the shelter’s indoor temperature in winter. 34 The other found thermal neutrality of refugees in Jordan to fit well within ASHRAE-55 comfort bands. 3
This study represents the largest investigation of thermal comfort in displacement camps and the applicability of ASHRAE-ATCM.
Methodology
Surveys
Thermal comfort surveys, including spot measurements of environmental parameters, were conducted in Zaatari and Azraq refugee camps in Jordan, Markazi camp in Djibouti, Hitsats camp in Ethiopia and several towns in Peru (Chivay and Yanake in the Andes Mountains, Viru and Trojillio on the coast, and Nuevo Belen in the Amazon). The surveys were either conducted directly by the research team who spoke the local language (Jordan and Peru) or with the assistance of local interpreters (Ethiopia and Djibouti). The thermal comfort scales used were the standard seven-point ASHRAE thermal sensation scale and the five-point thermal preference scale (see Table 1). The thermal sensation scale records an occupants’ Thermal Sensation Vote (TSV) on a scale of (hot to cold), while the thermal preference scale asks the occupants what their preferred sensation is (Thermal Preference Vote, TPV) at that moment, from “much cooler” to “much warmer”. A numerical approach to voting on the scales is used as proposed in 3. The spot measurements of environmental parameters include air velocity, wet bulb temperature, air temperature, relative humidity, and globe temperature, which were collected using hand-held devices at the same time a TSV and TPV were taken. The following instruments were used: • Air Temperature (Ta): Measured using the Testo 405i Smart Probe Thermo-Anemometer, (±0.5°C accuracy); or Extech HT200 heat stress meter (±0.8°C accuracy) • Relative Humidity (RH): Measured using the Extech HT200 (±2% RH accuracy) • Air Velocity (Va): Measured with ATP Hot wire anemometer or the Kestrel 5500 Weather Meter, both have an accuracy of ±0.1 m/s. • Globe Temperature (Tg): Assessed using a 150 mm diameter black globe thermometer with a Type K thermocouple probe, or Extech HT200 heat stress meter. ASHRAE standard thermal sensation and preference scales used in the surveys.
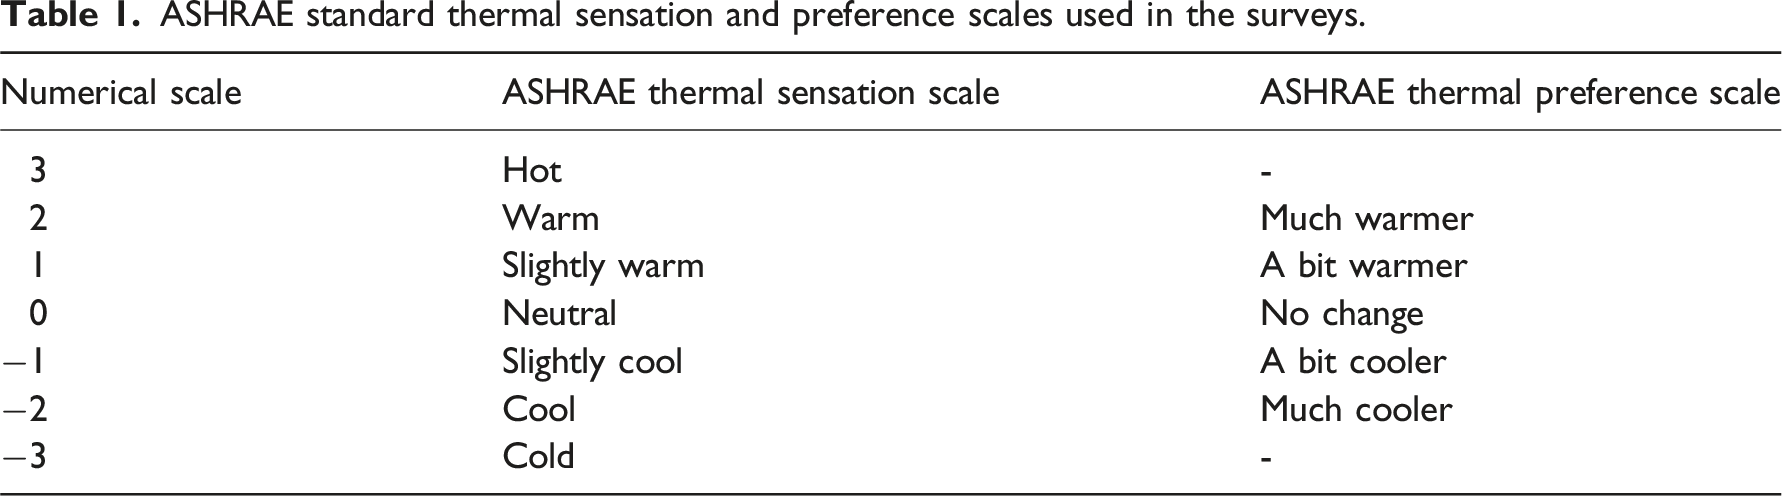
All measurement devices were calibrated prior to deployment and rechecked periodically to ensure data consistency (see also data quality procedures in Online Appendix Table A3). The selected instruments are widely used in thermal comfort research and conform to international standards such as ASHRAE 55 and ISO 7726.
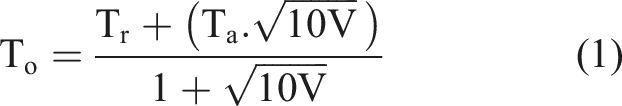
These variables where then used to calculate the operative temperature for each corresponding vote as follows using equation (1) provided in ISO 7726
35
:
Resultant database
Location information of thermal comfort surveys.
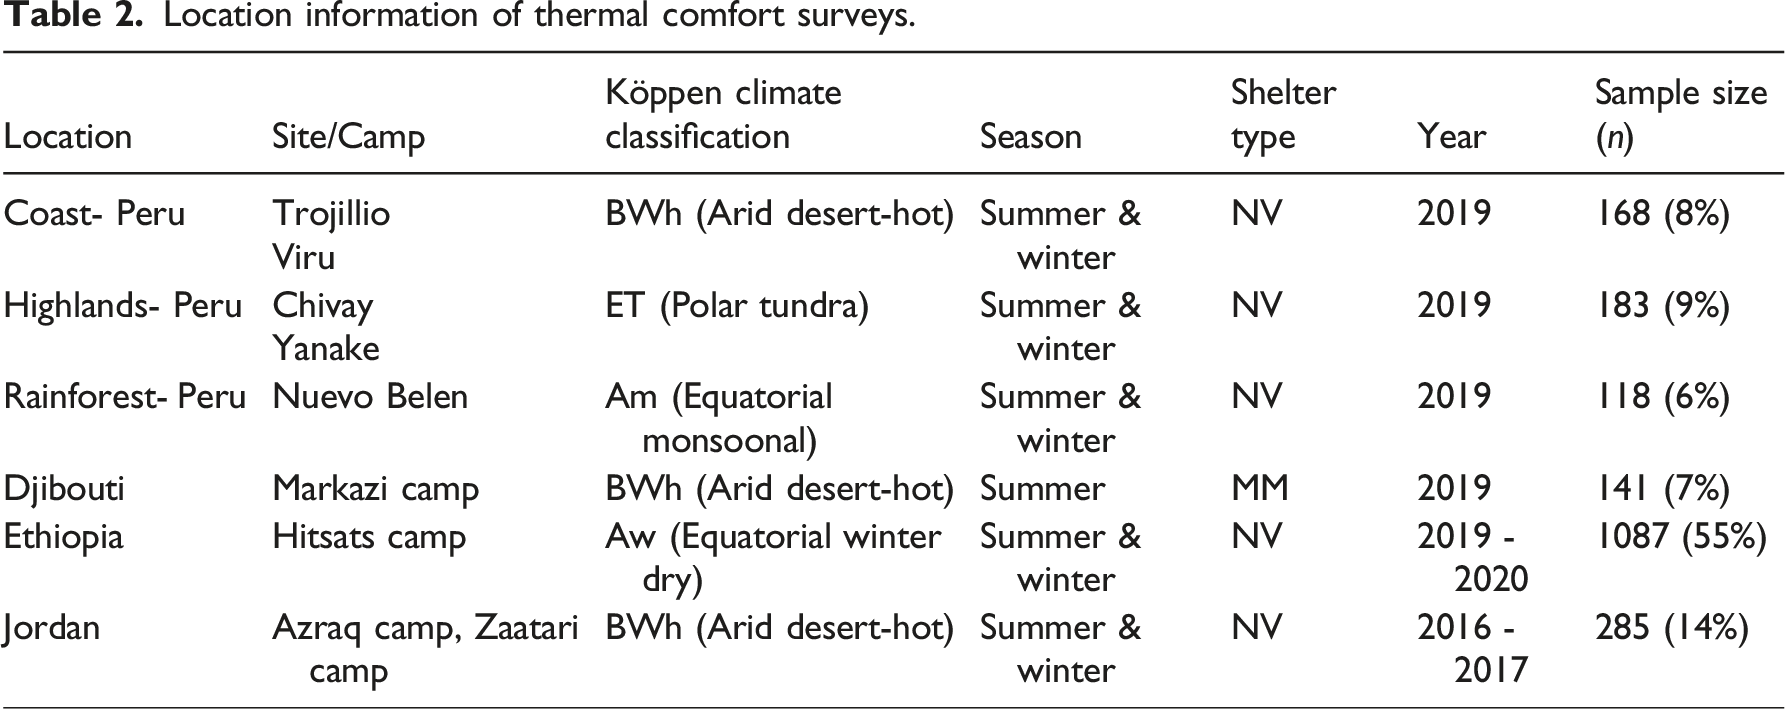
Two types of shelter are distinguished: naturally ventilated (NV) shelters and mixed-mode (MM) shelters. In NV shelters, occupants adapt to their indoor environment by opening windows and doors, and/or using fans. In most camps visited, electricity was available for few hours a day only, sometimes only at night. MM shelters operate in the natural ventilation mode the majority of the time. However, air-conditioning is used when outdoor conditions are inappropriate for natural ventilation and electricity is available.36,37 From Table 2, NV shelters represent the greatest data share and MM shelters only account for 7% (Djibouti during summer). All the data yielded from the surveys are compatible as a standard template was used, which is similar to ASHRAE’s RP-884 project template. The template includes basic information such as site/camp name, ID, interview location, season, date, time, subjects’ information (gender, height, weight, clothing level and activity), their thermal votes, environmental measurements (air temperature, globe temperature and air speed), and calculated To. A summary of descriptive statistics of both measured and derived environmental parameters is given in Online Appendix Table A1.
Analytical approach
Adaptive thermal comfort models are commonly derived using a linear regression of neutral temperatures Tn against outdoor temperatures. In this study, the neutral temperature Tn was determined using linear regression and Griffiths’ method. A summary of the analytical approach is illustrated in Figure 1. Flow chart of the analytical approach utilised.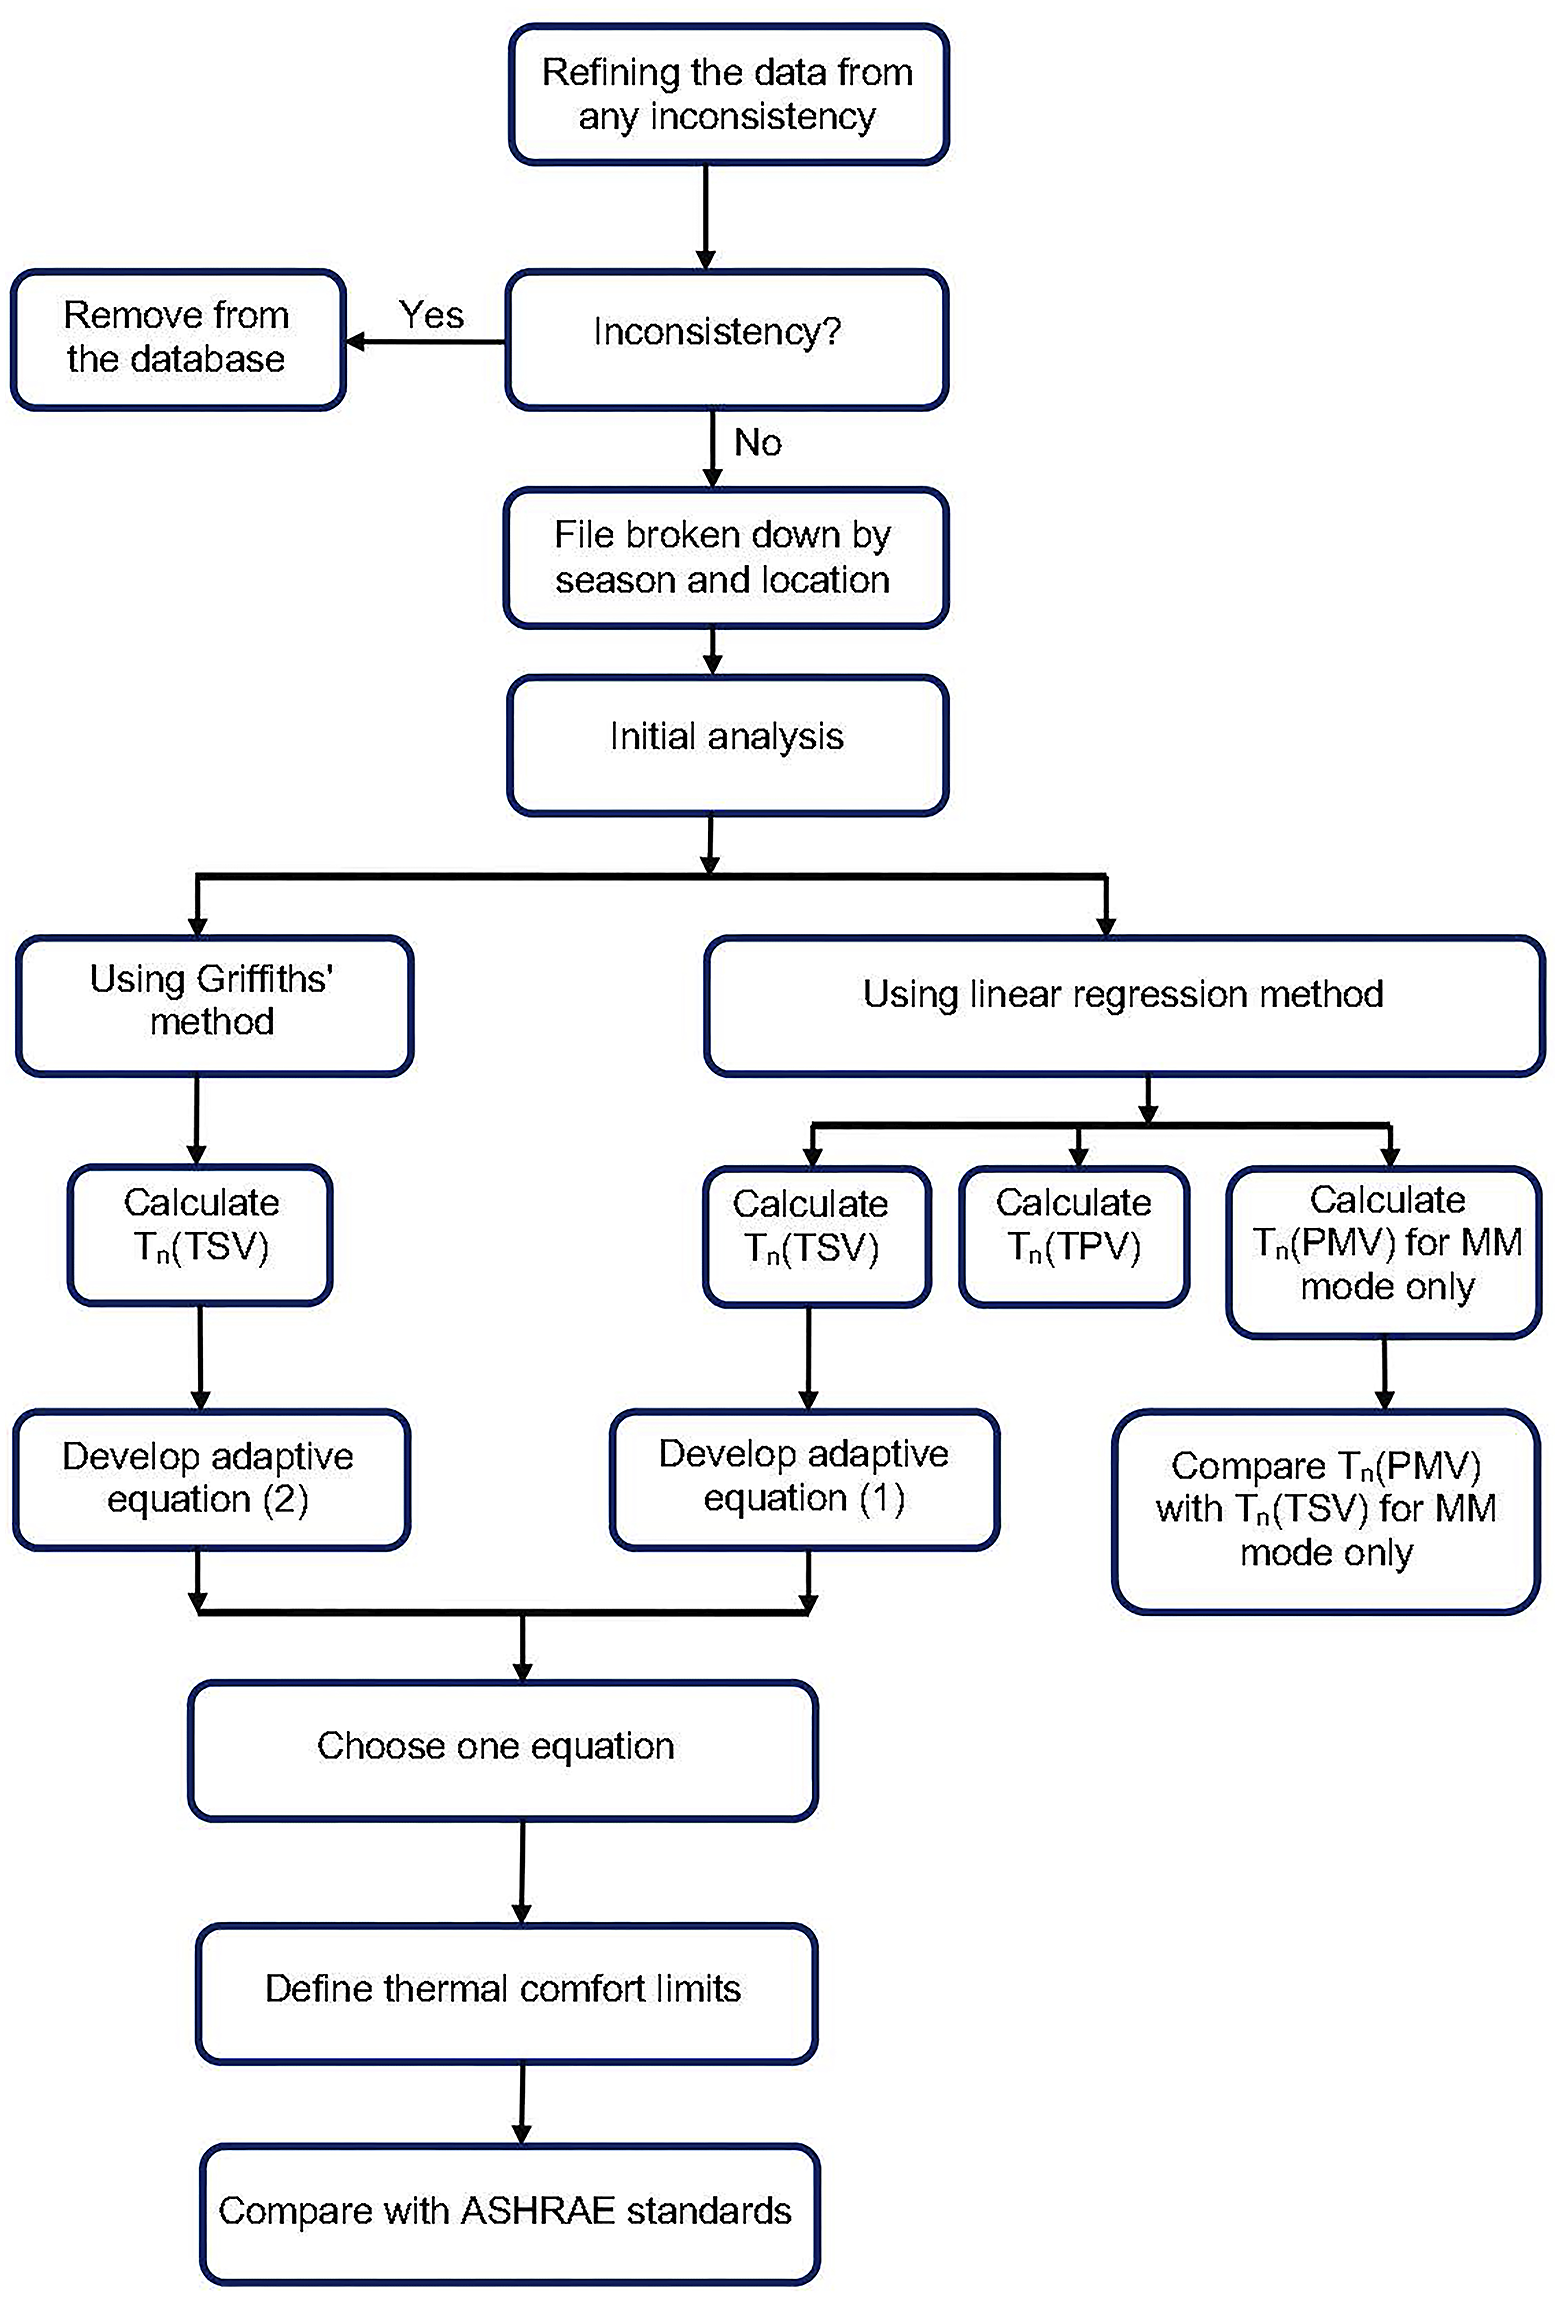
Regression
Regression analysis was used to calculate the neutral temperature following well-established techniques.8,23,38–40 While other techniques exist, these are often used where regression is unlikely to pick up subtle effects.
41
Here, our goal is to establish whether prevalent standards match occupant perception in the special setting of displacement and thus use the same techniques as those used in the standards to maintain parity and comparability. In this study, the mean TSVs at 0.5°C intervals are plotted against indoor operative temperatures To. Then, the neutral operative temperature Tn was achieved when TSV equals zero using equation (3):

The gradient of the linear regression measures occupants’ thermal sensitivity to variation in indoor temperatures (also known as adaptability). It indicates the degrees (of temperature) needed for a change of 1 unit in the seven-point ASHRAE thermal sensation scale. A steeper gradient suggests that people are less adaptable and are indicative of a range of indoor operative temperatures (known as the comfort band) over which occupants consider themselves to be comfortable.8,38,42 Completing a regression analysis using thermal preference votes (TPV) (instead of TSV) and the indoor operative temperature To results in what is known as the preferred neutral temperature, which is described as the optimum temperature of a population. 8
Griffiths’ method
The Griffiths method was used in the development of the adaptive thermal comfort model in the European standard EN 15,251. It is sometimes considered more reliable than regression analysis, for example, with narrow temperature ranges or a smaller amount of data.
43
In the case where the linear regression has a low coefficient of determination (<50%) in some of the sub-groups evaluated, the alternative approach to obtain the neutral temperature Tn is Griffiths’ method. This method uses the mean thermal sensation of a group, or a single thermal vote, and then calculates Tn by using a constant thermal sensitivity coefficient G, known as Griffiths’ constant.
5
In this study, Griffiths’ method is used to calculate Tn using the mean thermal sensation vote of a group through the following equation:
Griffiths’ constant represents changes in occupants’ thermal sensations when indoor temperature varies. For example, a high Griffiths constant of 5/°C indicates occupants are significantly affected by small change in indoor temperature (when indoor temperature changes by 2°C, the thermal sensation of occupants changes by one unit on the standard seven-point ASHRAE thermal sensation scale).
For deriving adaptive models, a Griffith’ constant value of 0.33/°C was recommended by Griffiths.
44
However, this value seems to underestimate the adaptation ability of those studied, and as such, various values have been used in the literature as Griffiths’ constant (from 0.25/°C to 0.5/°C).15,45–47 Some studies used the weighted mean value of regression coefficients to calculate Griffiths’ constant, which is more useful when enough regression models are fitted.38,39 For instance, in a comfort study in southeast Asia, Griffiths’ constant was derived from 17 regression models.
38
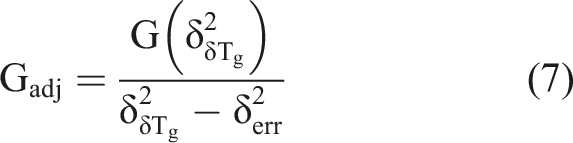
Another method calculates Griffiths’ constant based on the linear relationship between the difference in mean thermal sensation δTSV and difference in mean globe temperature δTg.
48
δTSV is the difference between a single TSV vote a day and the mean TSV for a population in the same day in the same location equation (5). While δTg is the difference between globe temperature recorded with each single TSV each day and the mean of all globe temperatures recorded that day equation (6). The method used in
48
to determine Griffiths’ constant was utilised in this paper as it is more suitable for the available data because it considers each single TSV recorded a day, whereas the weighted mean value method uses the coefficient of each regression model for each location and season.

Predicted neutral temperature
As an additional baseline for the MM shelters, the neutral temperature Tn was examined by the non-adaptive Predicted Mean Vote (PMV) approach instead of using the recorded thermal sensation votes. This is known as the predicted neutral temperature. 8 The PMV is calculated from the heat balance equations developed by Fanger. 49 Here the ASHRAE Thermal Comfort Tool 50 - which is available online - is used to derive PMV and other parameters. Several inputs are required to get the calculation, these are: Air temperature, Air velocity, Mean radiant temperature, Relative humidity, Metabolic rate, and Clothing insulation.
All these inputs are available from field measurements except the mean radiant temperature. The measured globe temperature Tg is used to represent the mean radiant temperature as suggested by.
20
Then, mean PMV at each 0.5
Results
Thermal comfort surveys
A total of 1982 subjects were interviewed, 846 males (43%) and 1136 females (57%). The number of females is higher as they were more likely to be in the shelters during the surveys. The overall age distribution is between 18 and 97 years with 61% of the subjects between 20 and 40 years. As for environmental parameters, the minimum and maximum indoor air temperature observed were 10°C in Jordan and 39.30°C in Ethiopia respectively. However, around half (52%) of the recorded temperatures were 30°C or more. The minimum recorded indoor air velocity is 0 m/s which was observed in all locations. A maximum of 0.90 m/s was noted in Djibouti and Ethiopia during summertime. The highest relative humidity was 84% and was observed in Djibouti and the rain forest in Peru. The minimum and maximum operative temperatures were 11°C in winter and 41°C in summer respectively.
Thermal sensation vote and thermal preference vote
Combined, summer and winter thermal sensation and preference vote percentages, from the whole dataset.
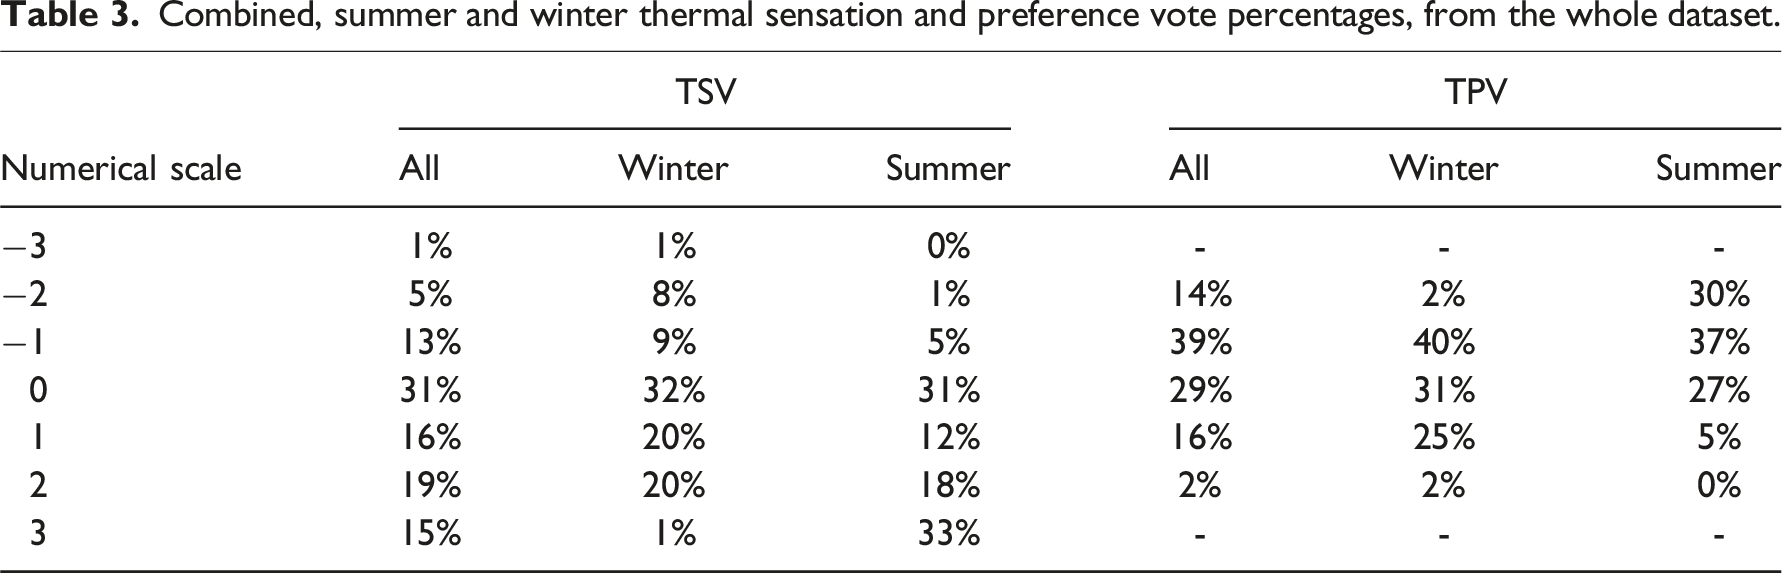
Furthermore, thermoneutrality was not the preferred sensation for all of those voted “Neutral”; 17% of those voted neutral on the thermal sensation scale preferred to feel a ‘bit cooler’ or ‘much cooler’, while 11% preferred to feel a bit warmer (Figure 2). This is in line with the results of previous studies,8,51,52 that found that people prefer a cooler sensation during warm seasons and vice versa.42,53–56 This phenomenon is best described by Humphreys and Hancock
51
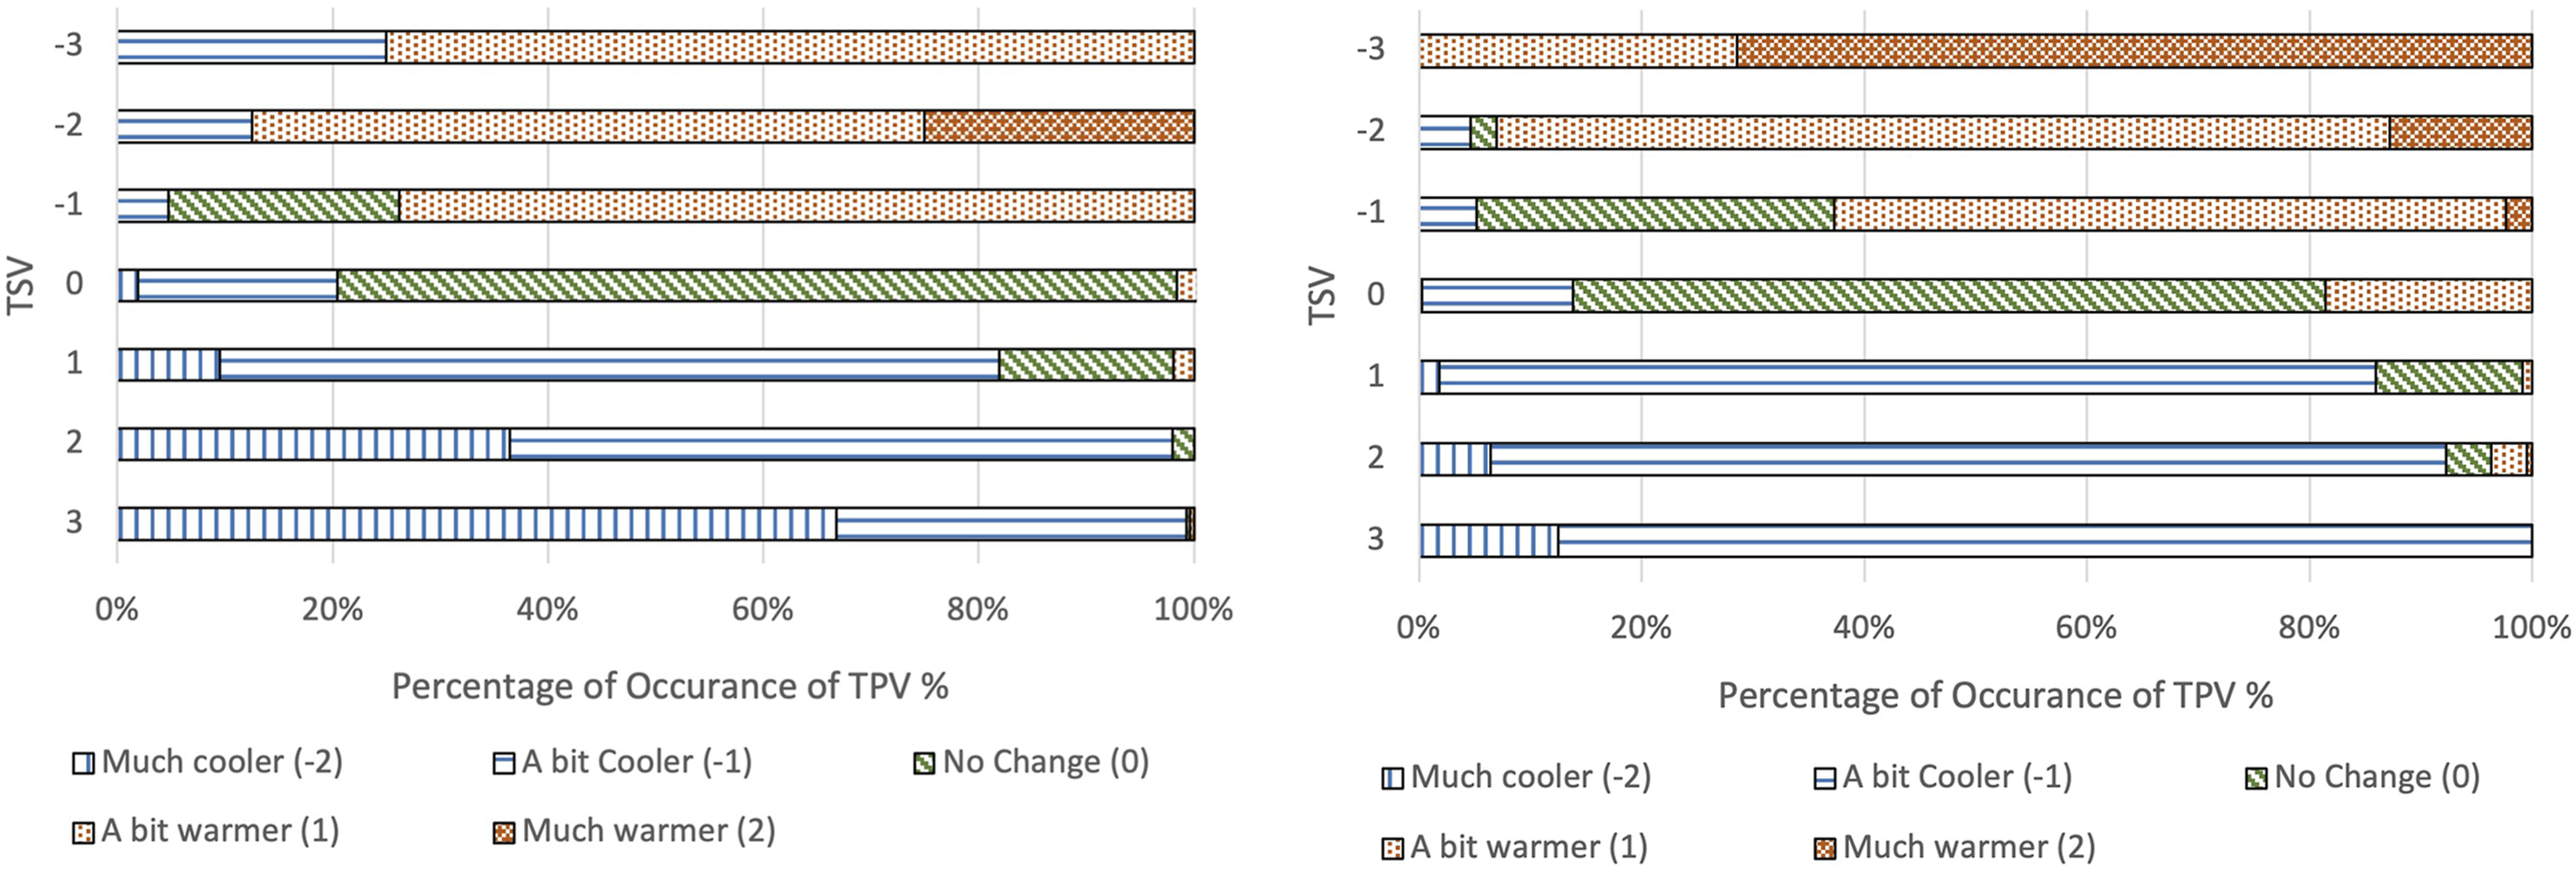
: “People prefer sensations on the warm side of neutral if it is cool outdoors and warm indoors, while they prefer sensations cooler than neutral if it is warm outdoors and cool indoors” and can be observed in Figure 3. Percentage distribution (%) of Thermal Preference Votes (TPV) in relation to Thermal Sensation Votes (TSV) during summer and winter across all studied locations. The graph illustrates the variation in TSV and TPV, providing insights into the relationship between subjective thermal sensation and preferred comfort levels in all the climatic contexts. Percentage distribution (%) of Thermal Preference Votes (TPV) in relation to Thermal Sensation Votes (TSV) during summer (left) and winter (right) separately across all studied locations. The graph illustrates the variation in TSV and TPV, providing insights into the relationship between subjective thermal sensation and preferred comfort levels in all the climatic contexts.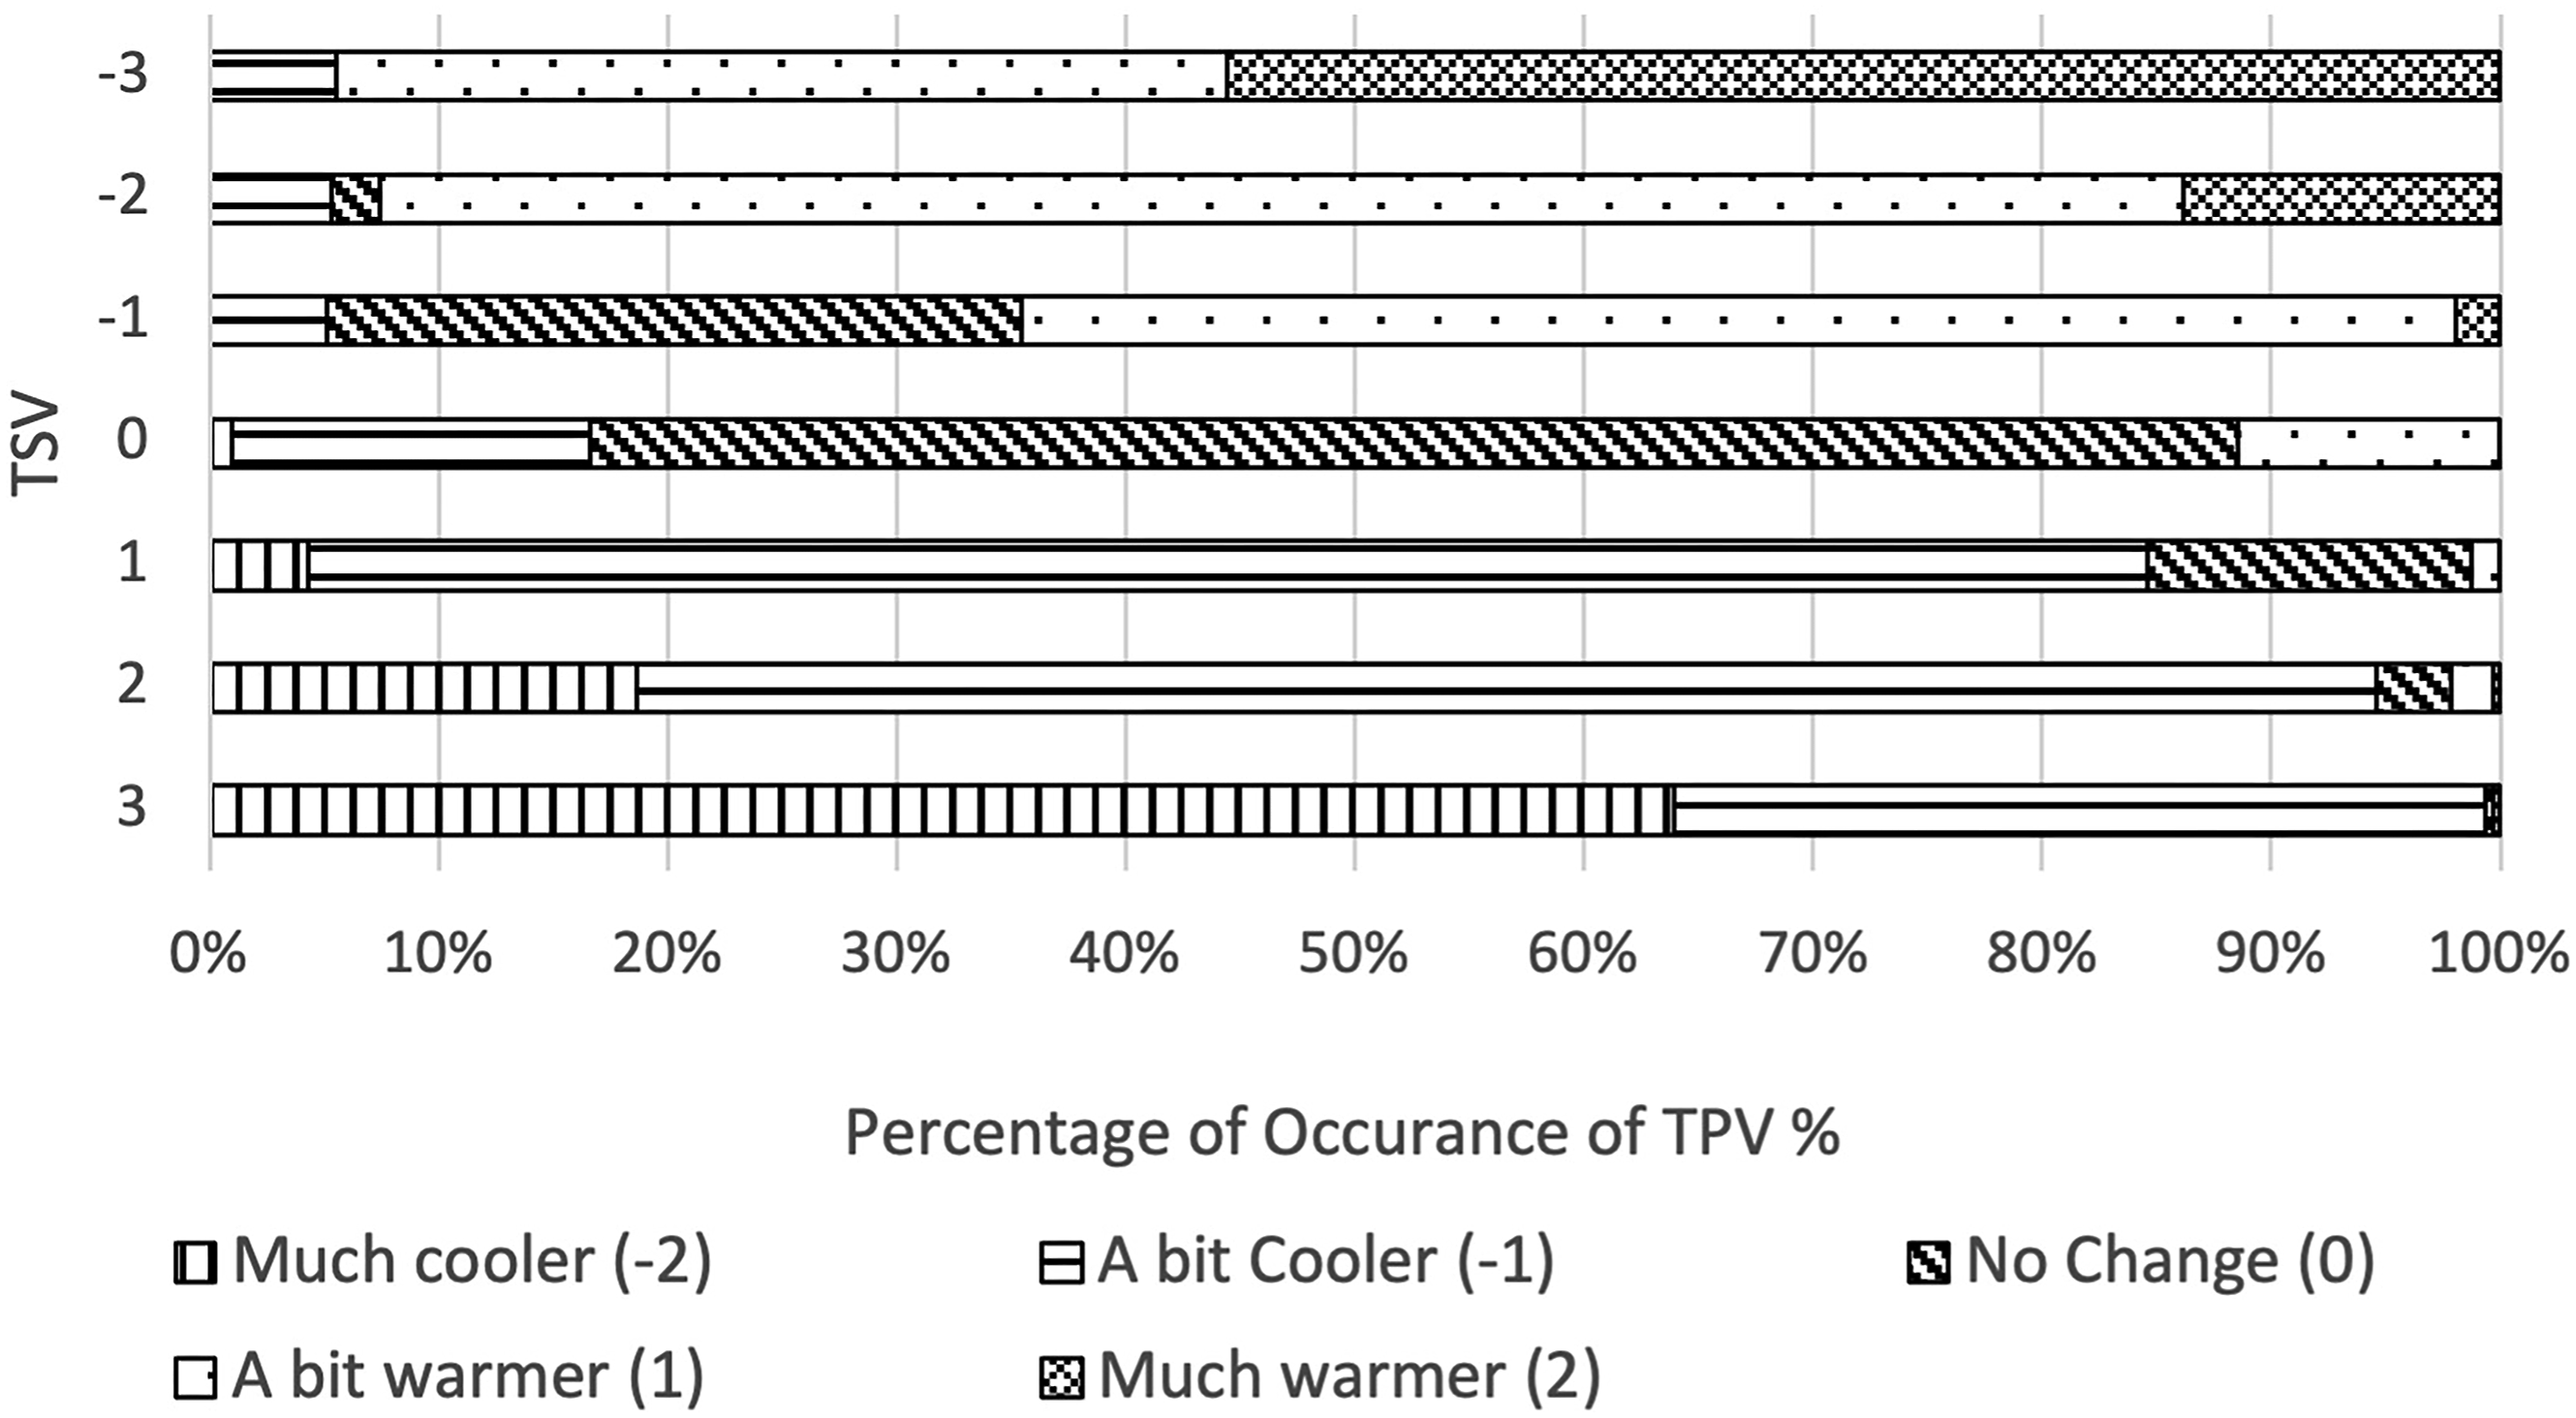
Calculating the neutral temperatures
Regression
The set of neutral temperatures Tn was calculated as follows: 1. The database is broken down by season and location, obtaining 11 sub-groups (Table 4). 2. A linear regression model is fitted for mean TSV and TPV obtained at 0.5°C intervals of To for each of the 11 sub-groups (see Online Appendix Figure A1 and A11). 3. The neutral temperature (indoor operative temperature To corresponding to TSV = 0) is obtained from each of the 11 regression equations. Regression Statistics for all TSV regression models and calculated neutralities.
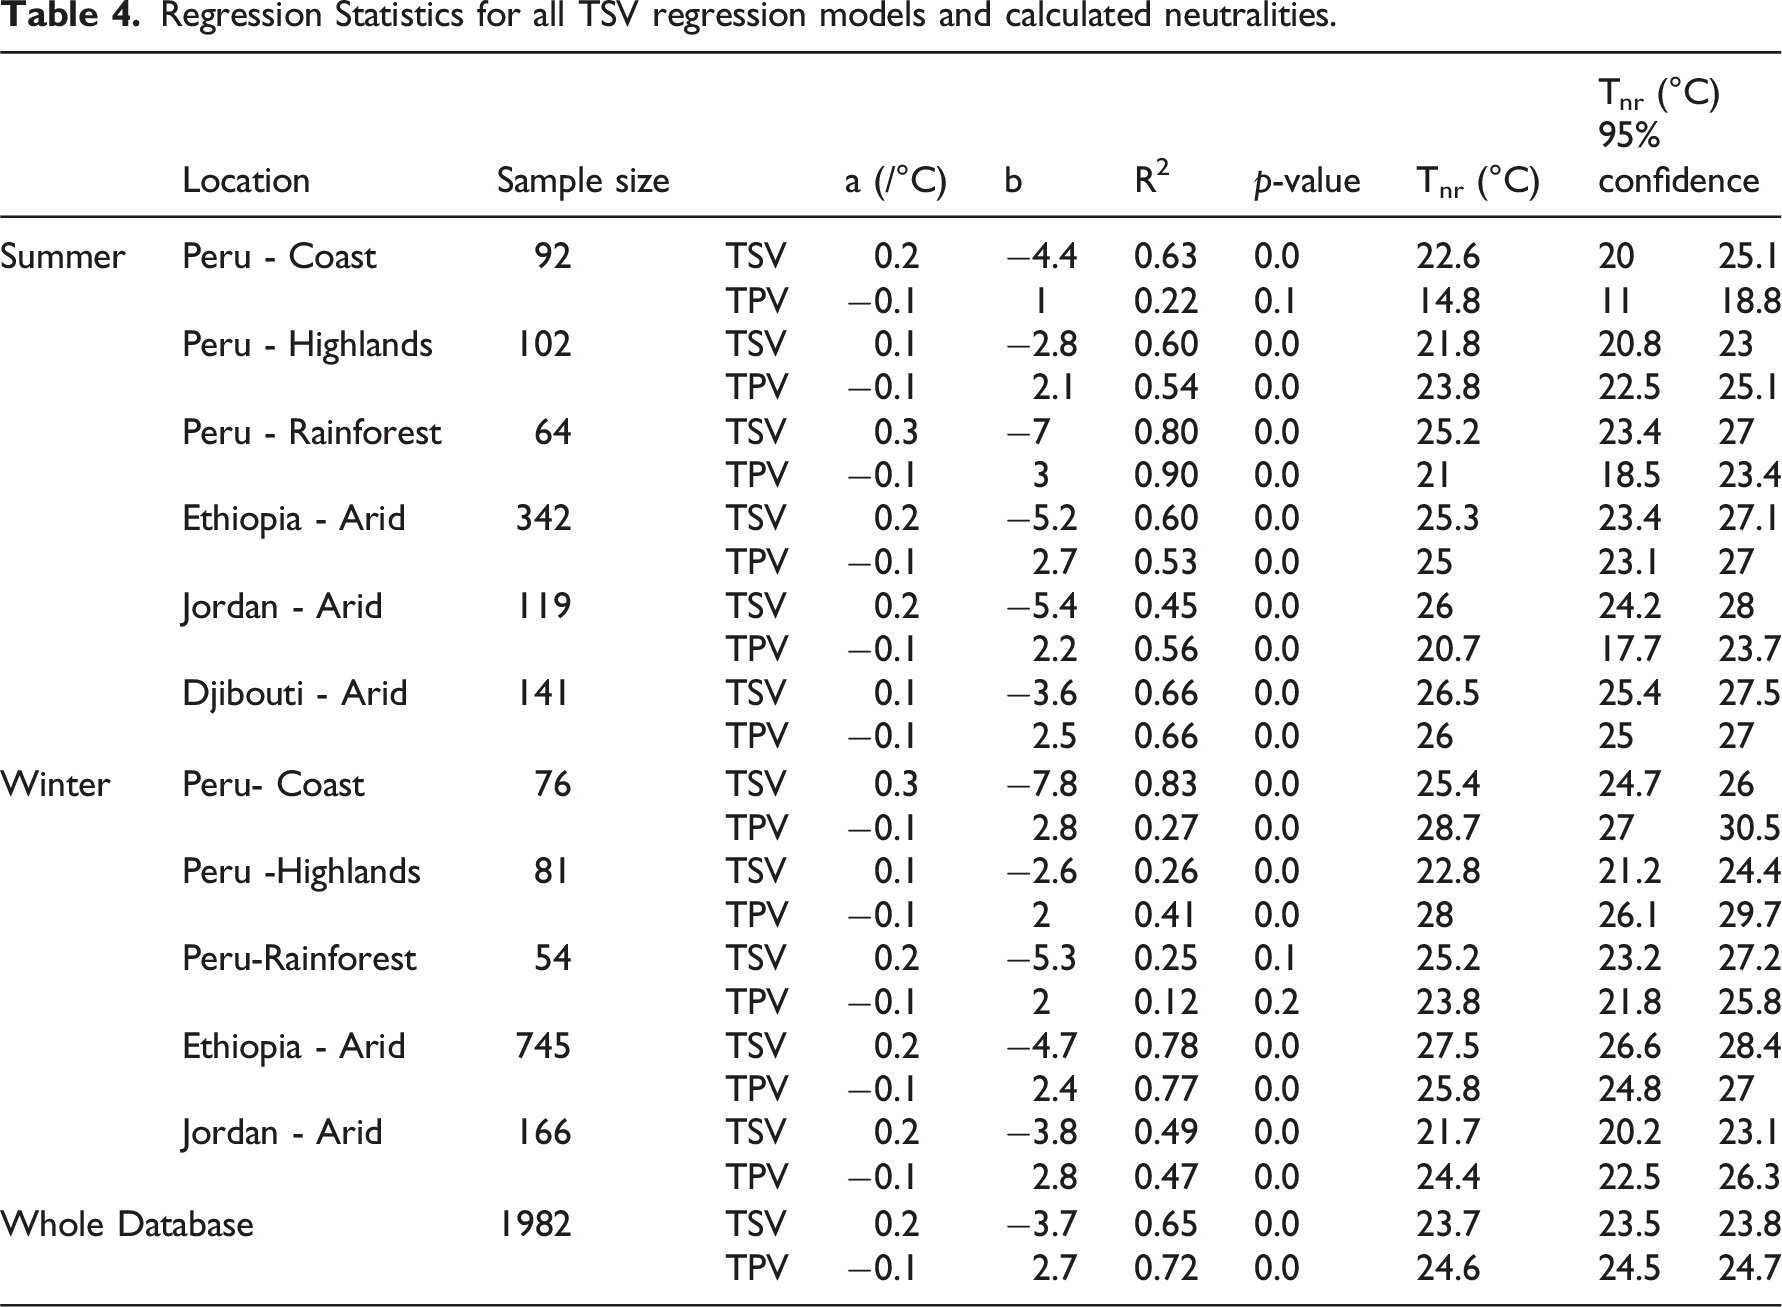
Table 4 summarises the regression models statistics. All models achieved a statistical significance of <0.05 expect for the Peru Rainforest sub-group in winter and Peru Coast TPV regression model in summer. The coefficient of determination (R2) ranges between 0.9 and 0.12, indicating a varying degree of reliability. For TSV, regression gradients for summer and winter vary between 0.1/°C and 0.3/°C which means that a change of between 9°C and 3°C in the indoor operative temperature To is needed to shift the mean TSV one unit. This is in line with other thermal comfort studies in the global south that obtained similar TSV gradients. 38 Less steep gradients suggest a larger range of temperatures across which occupants feel comfortable.
Those who live in a warm climate are more likely to prefer a cooler environment and vice versa. Most of them are less likely to choose the neutral temperature as their preferred.
21
Thus, in thermal comfort studies TPV is usually used to calculate the optimum temperature of a group of people instead of TSV. This is known as the preferred neutral temperature.
8
The preferred neutral temperature is derived when TPV = 0 in the regression equation. In the present study, the coefficient of determination (R2) was particularly low for some of the TPV regression lines, and as such the calculated preferred neutral temperatures are often unreliable. The regression lines of TSV and TPV for the whole database are plotted in (Figure 4). The intersect of these lines give a neutral temperature of all groups of 24°C. The preferred neutral temperature of the whole database of 24.6°C is very close to the neutral temperature. Thermal votes and neutrality for the whole database during summer and winter with 95% confidence bands.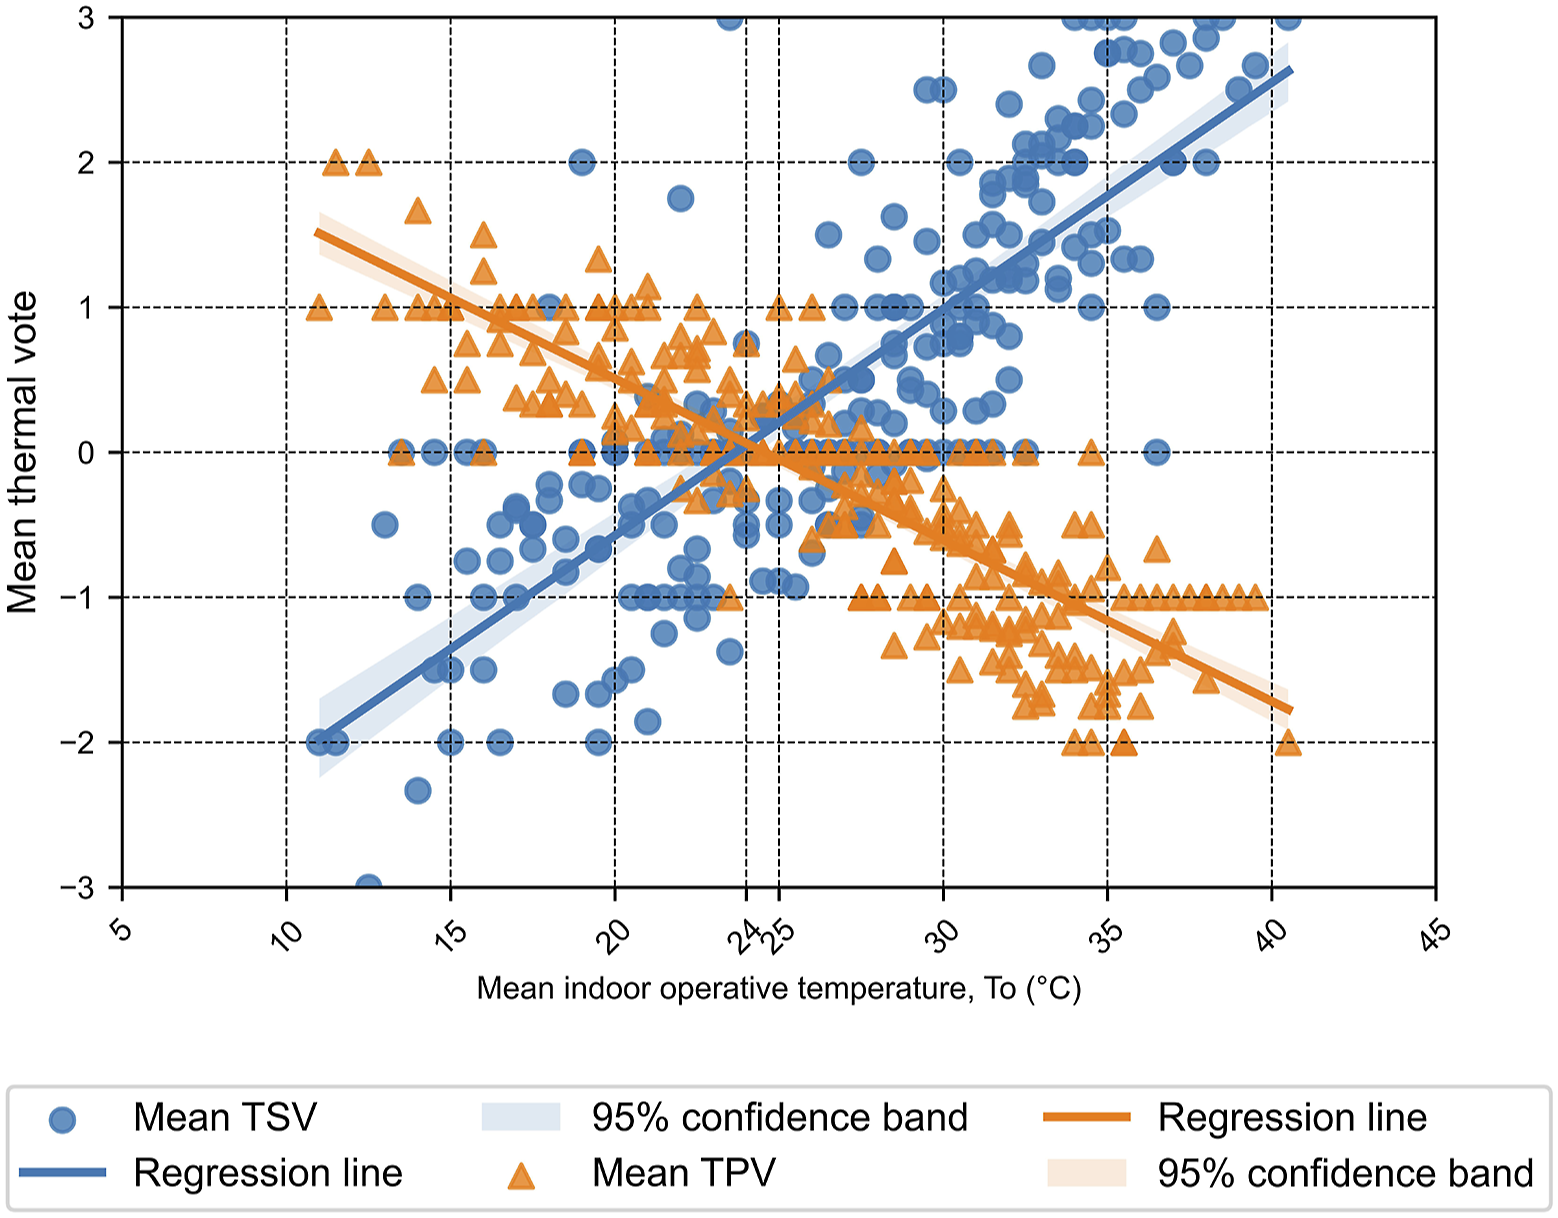
The neutral temperature values (Tn) were computed independently for TSV (Thermal Sensation Vote) (Figure 5) and TPV (Thermal Preference Vote) (Figure 6) across the 11 sub-groups individually. The linear regression model was constructed for mean TSV and TPV for To for each subgroup. The neutral temperature was determined from the regression equations, and the analysis indicated that the majority of models were statistically significant, with a few exceptions. Thermal sensation votes and neutrality for the 11 sub-groups across both summer and winter, covering a total of seven locations. Djibouti Arid and Peru Coast include only summer data, while all other locations have data for both summer and winter, with 95% confidence bands. Thermal preference votes and neutrality for the 11 sub-groups across both summer and winter, covering a total of seven locations. Djibouti Arid and Peru Coast include only summer data, while all other locations have data for both summer and winter, with 95% confidence bands.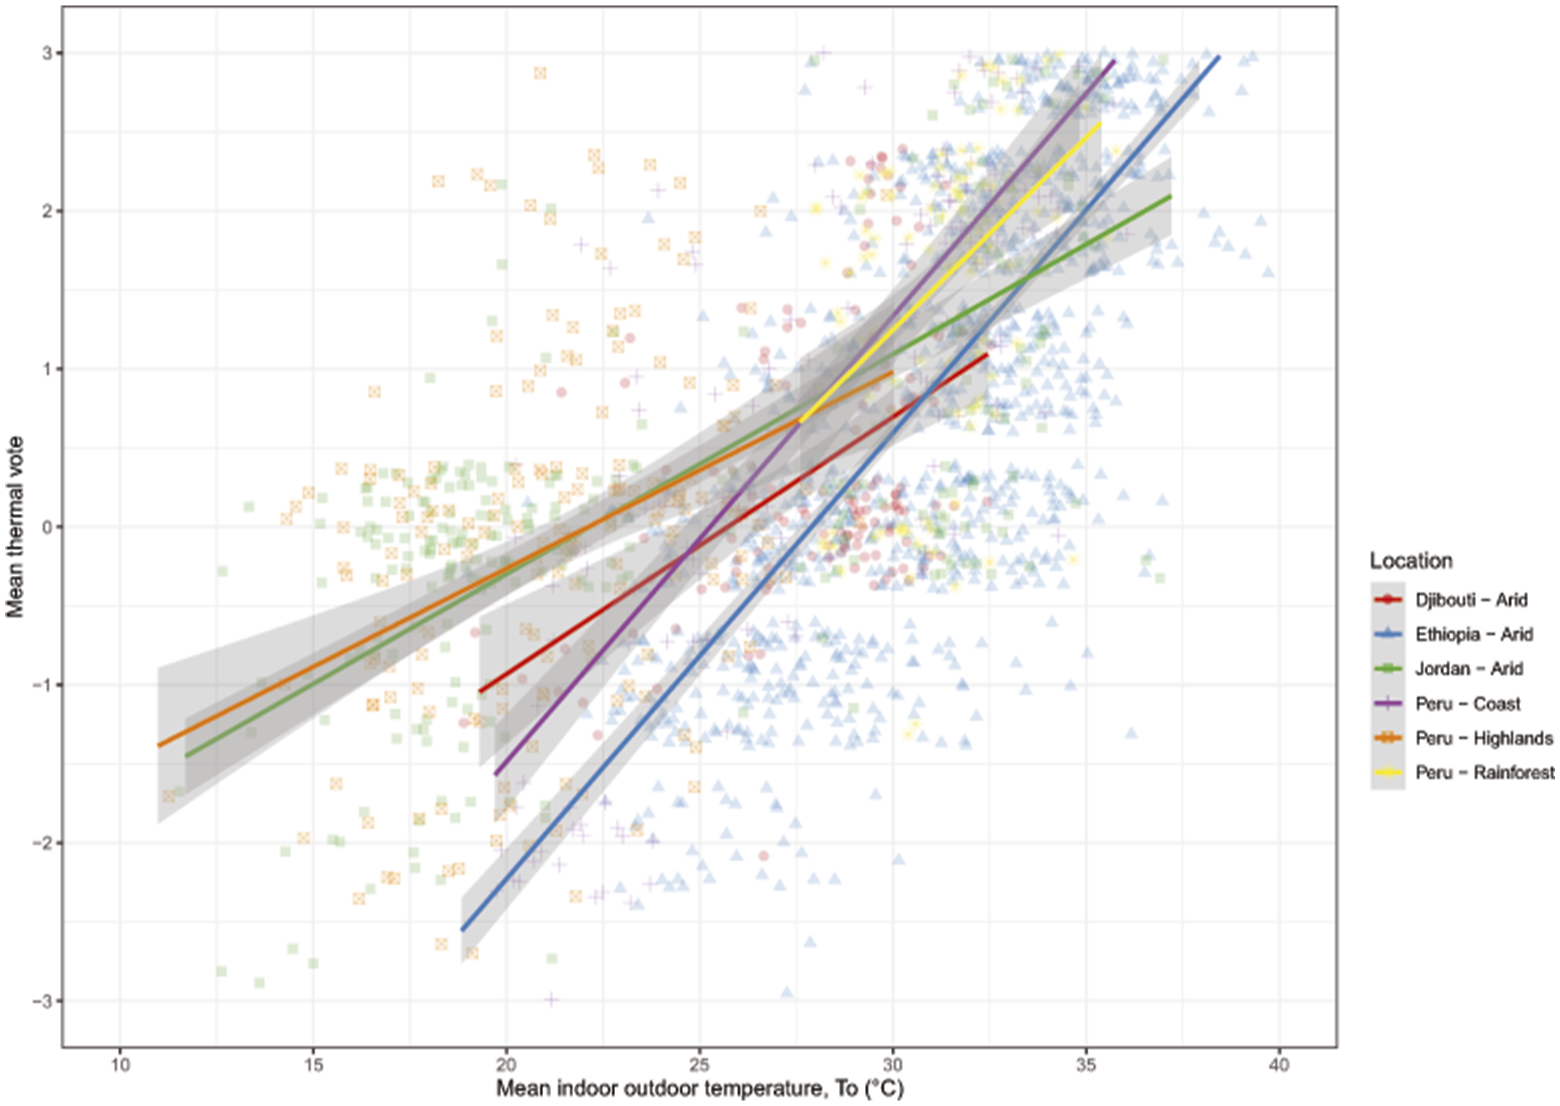
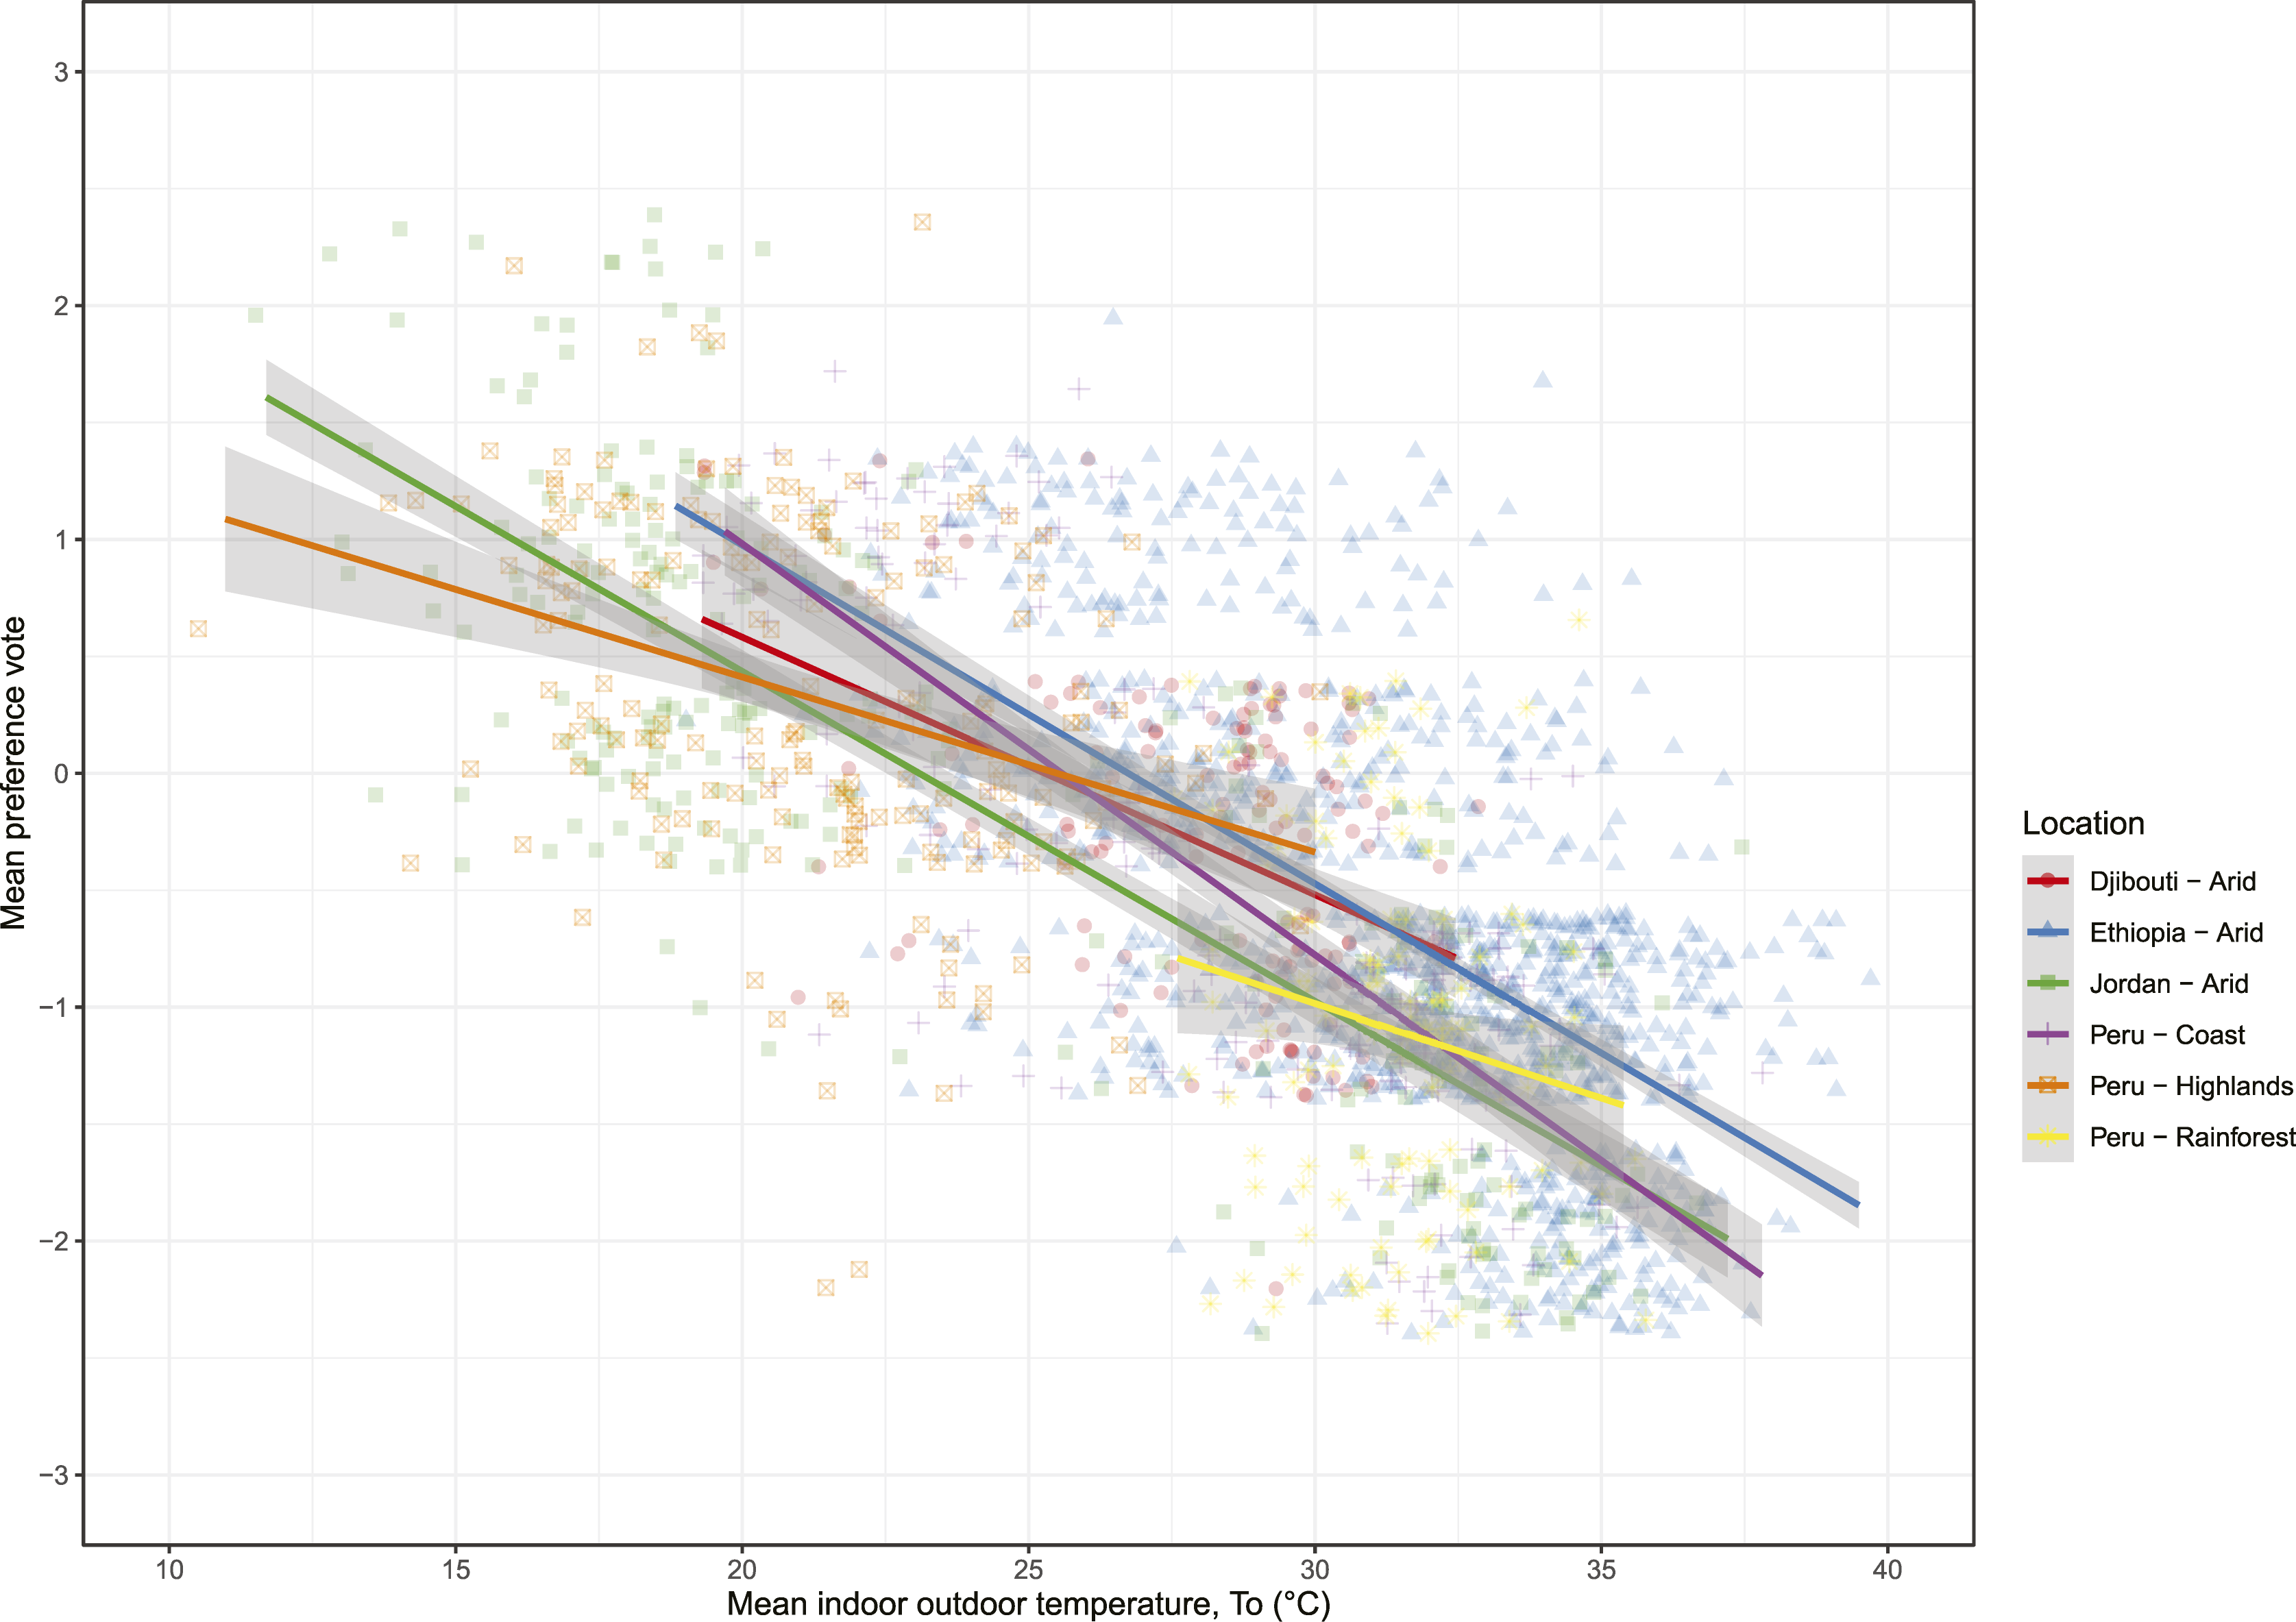
Although the models vary, this is more so for preference than sensation. In both, the case for an overarching trend is evident across the 11 sub-groups and corresponded with results from other thermal comfort research. This is particularly useful as displacements are unpredictable and highly-localised, with new hot-spots emerging even as old ones are unpredictably re-triggered. The regression patterns for thermal sensation and thermal preference were comparable, indicating that both exhibit a similar correlation with indoor operative temperature. Given these observations, a single model is deemed not only feasible but also useful.
Predicted neutral temperature
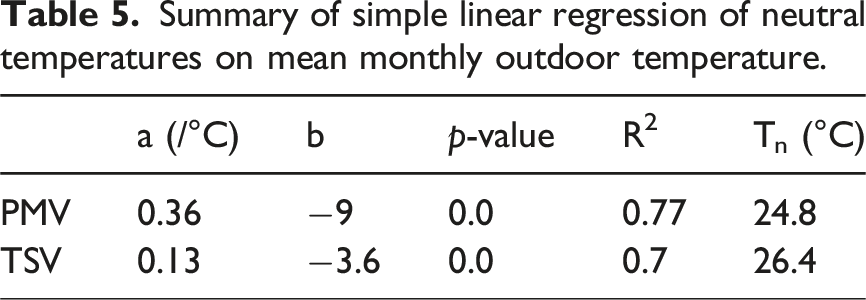
Previous research has shown that the PMV index is unsuitable for naturally ventilated settings as it tends to under/overestimate occupants’ thermal sensations. This is because it dismisses the psychological and behavioural adaptations.1,57 In this analysis, the PMV model was only used for MM shelters to predict the neutral operative temperature. This is to observe any discrepancy between the collected thermal sensation votes (TSV) and the calculated predicted mean vote (PMV). A linear regression was fitted for both mean PMV and mean TSV at 0.5°C intervals against indoor operative temperatures (Figure 7). Then, the neutral temperature was calculated for PMV and TSV (Table 5). Both regression lines achieved a statistical significance of <0.05. The slope of the PMV linear equation (0.36/°C) indicates that a 3°C change in indoor operative temperature changes mean PMV at each 0.5°C interval by one unit, The TSV slope indicates a 7°C change is needed to shift one unit on the thermal scale. This suggests occupants of MM shelters are not as sensitive to changes in internal temperature as the PMV model predicts. The reason that Tn (PMV) does not equal the value of Tn (TSV) is that the PMV model does not account for behavioural adjustments such as opening or closing windows, and turning on or off air-conditioners.
1
However, occupants of MM shelters adapt to their indoor environment by turning the AC unit on or off when they feel too hot or too cold. Additionally, it is observed that some occupants use a fan when the air-conditioner is off. These coping mechanisms help occupants to maintain their thermal comfort at higher temperatures than the PMV model predicts. Thus, the PMV model is underestimating the adaptive ability of these people and is unsuitable in these settings. Predicted thermal sensation votes and observed thermal sensation votes for MM shelters in Djibouti with 95% confidence bands. Summary of simple linear regression of neutral temperatures on mean monthly outdoor temperature.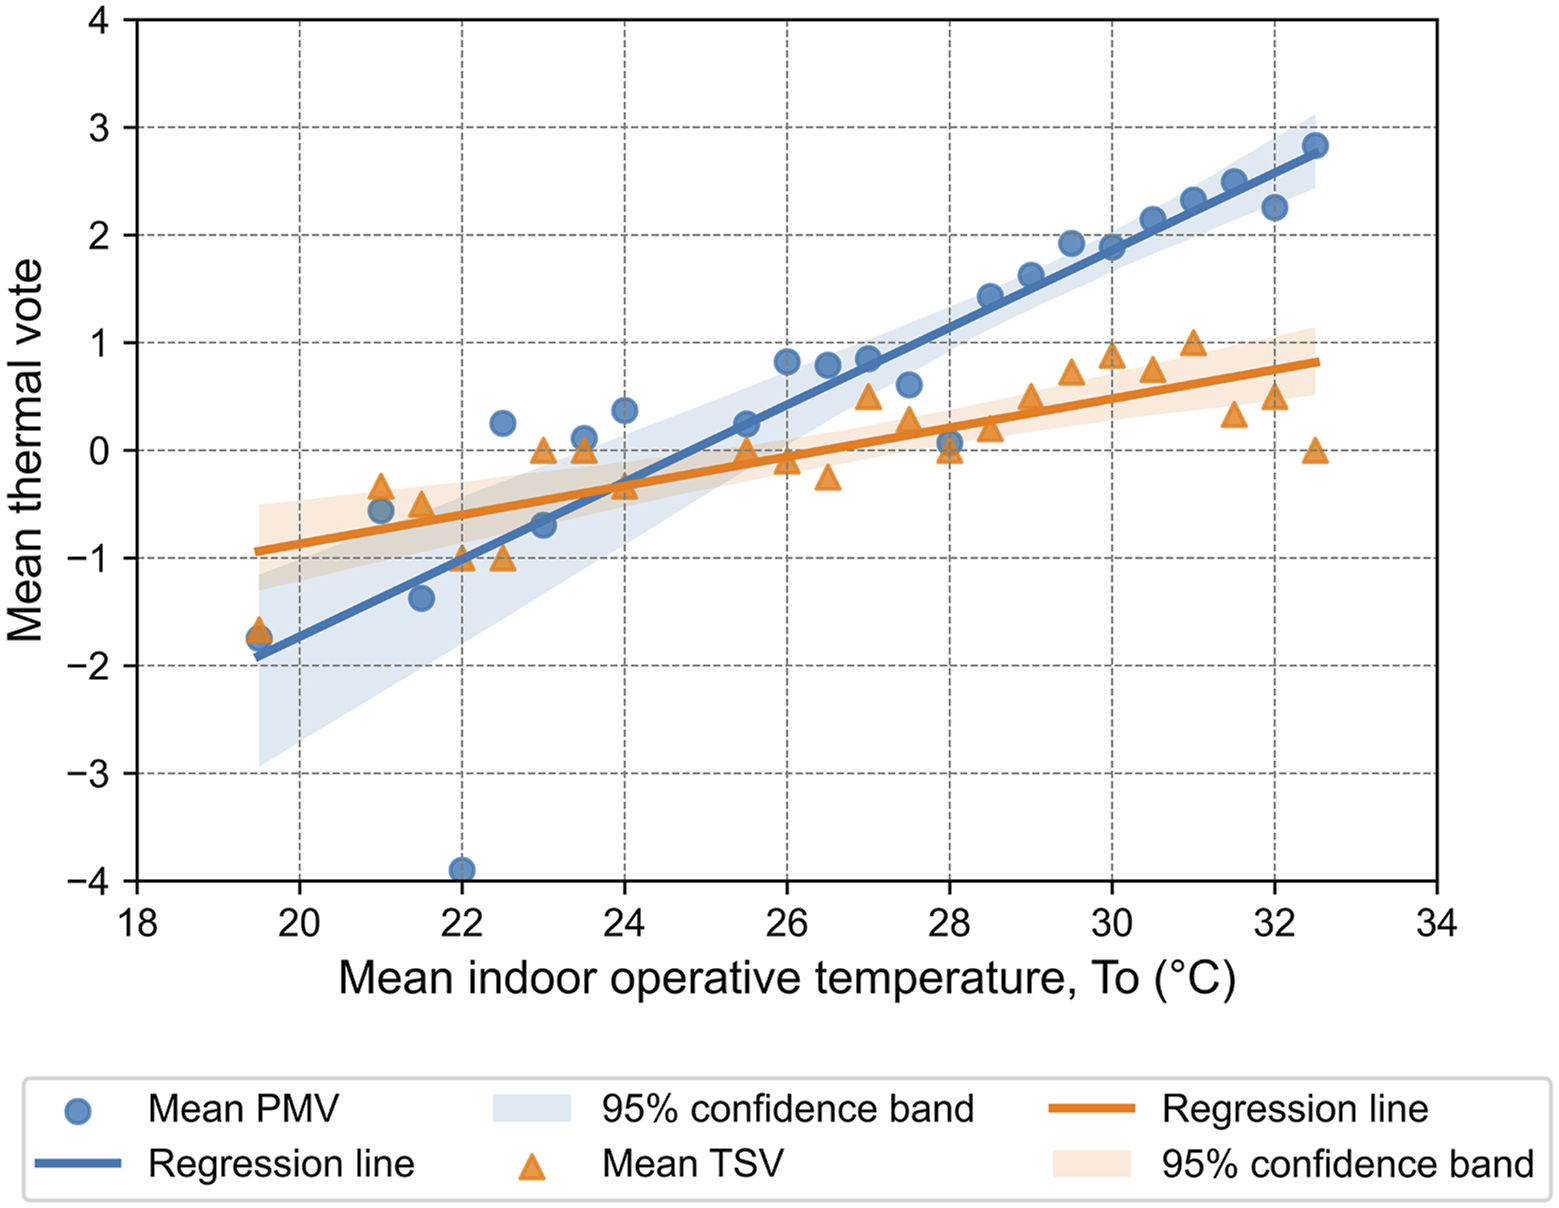
Griffiths’ method
Some of the neutral temperatures calculated using linear regression (Tnr) of the subgroups represent a low coefficient of determination which signals less confidence in the accuracy of the derived neutral temperature of those sub-groups. Four of the 11 subgroups have a coefficient of determination that is less than 50%. This is evident in the Jordan subgroup in the summer (0.45) and in the Peru-Highlands (0.26), Peru-Rainforest (0.25), and Jordan (0.49) subgroups in the winter. Consequently, Griffiths’ method is used as well to calculate the neutral temperature for each subgroup. Before using the Griffiths’ method to derive the neutral temperatures, Jihye method is used to calculate Griffiths’ constant.
48
Thus, the mean thermal sensation
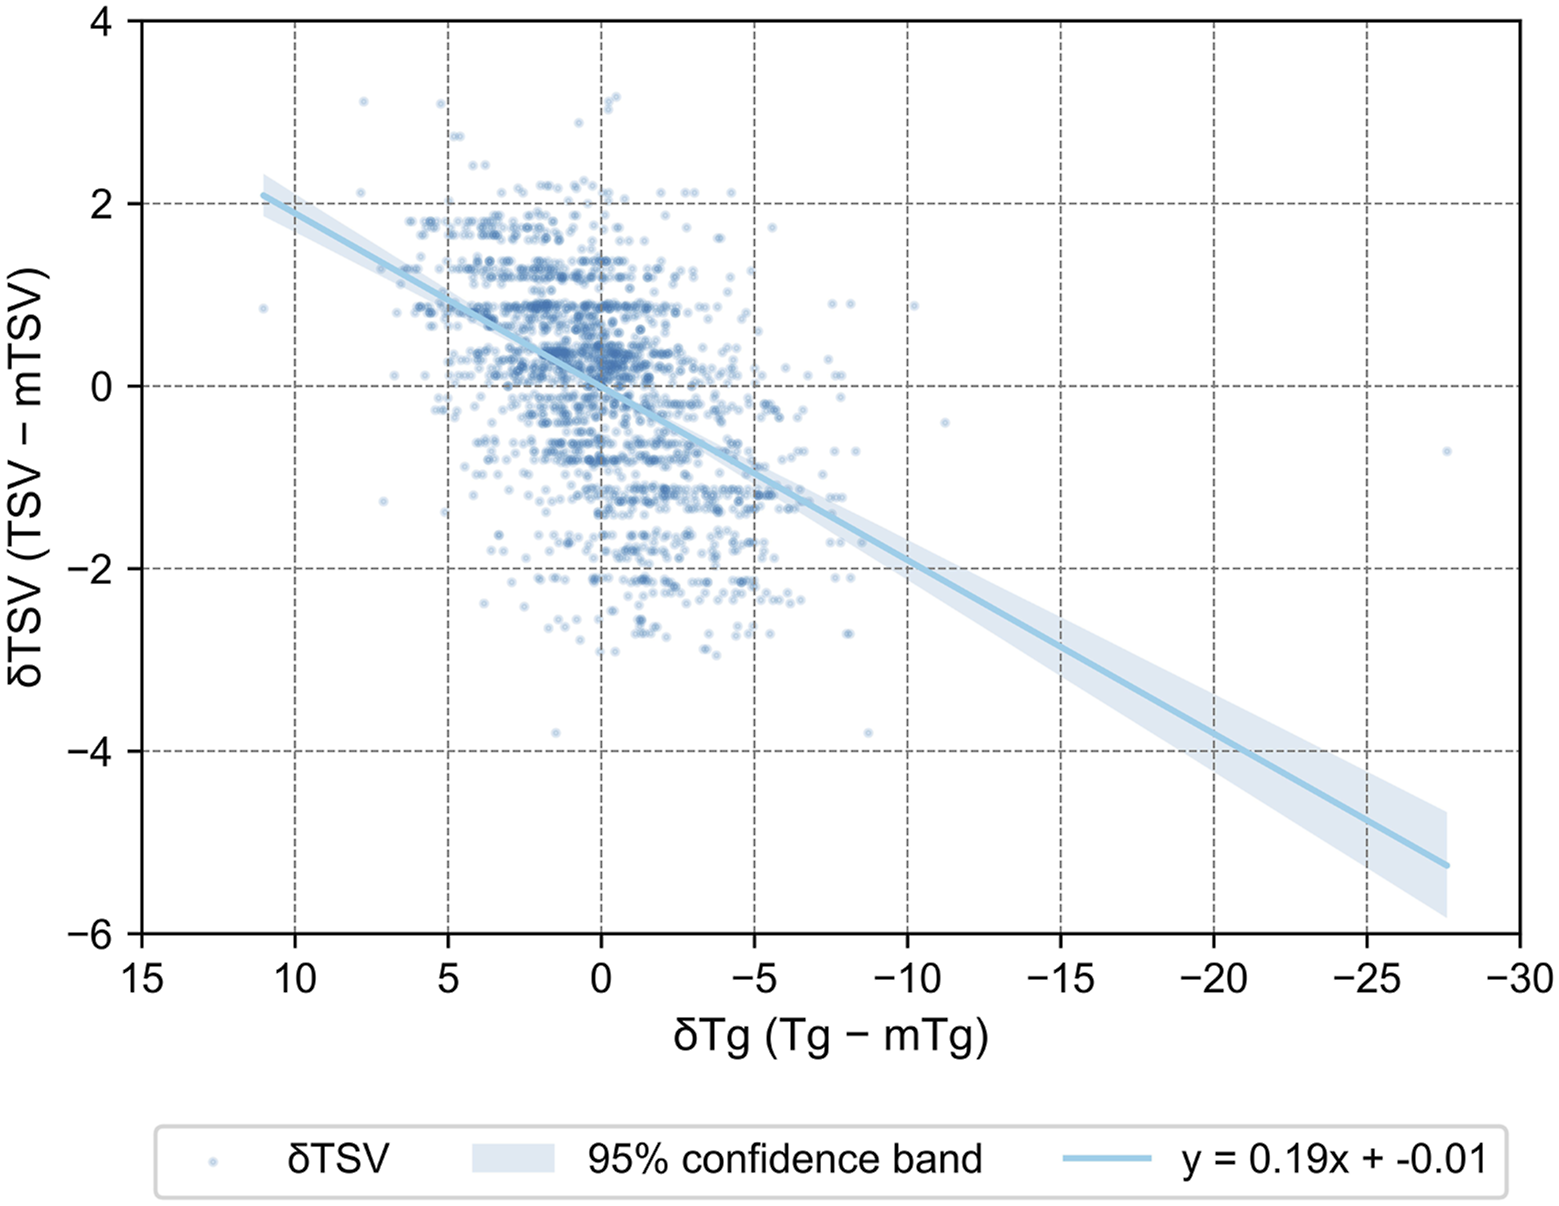
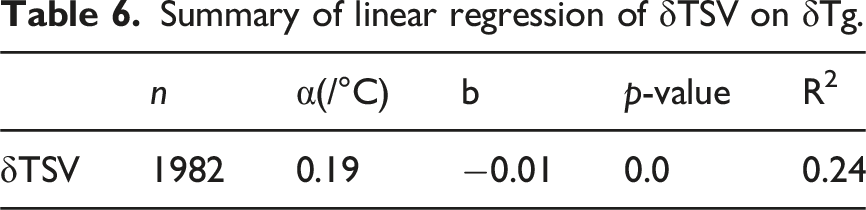
Equation (8) is obtained from δTSV and δTg regression line (Figure 8, Table 6). The calculated Griffiths’ constant is 0.19/°C. The adjusted constant for possible errors in measurement of the globe temperature is calculated using equation (8). Linear Regression between δTSV and δTg with 95% confidence band. Summary of linear regression of δTSV on δTg.
Thermal neutralities using the adjusted regression coefficient.
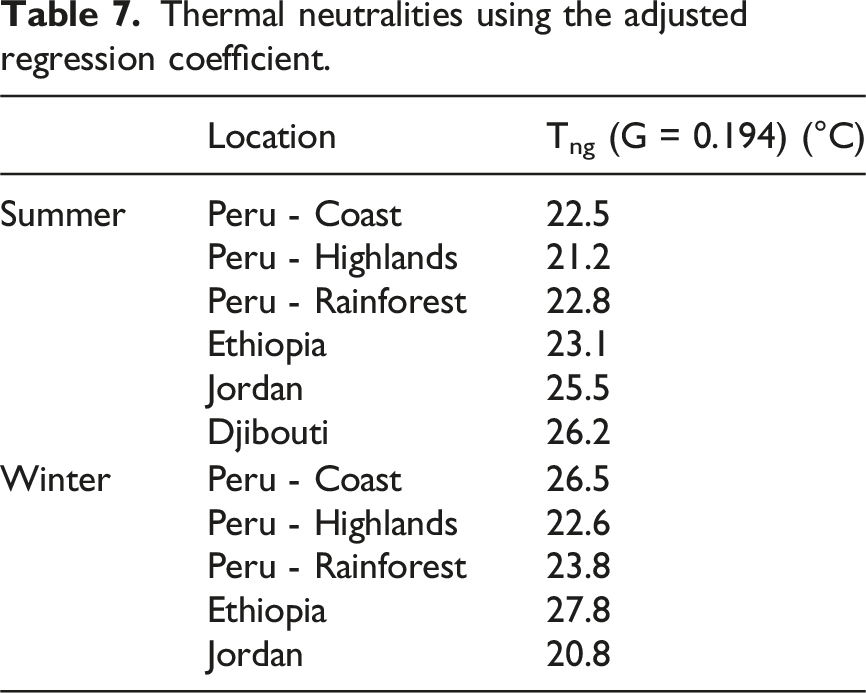
Comparison with ASHRAE standards
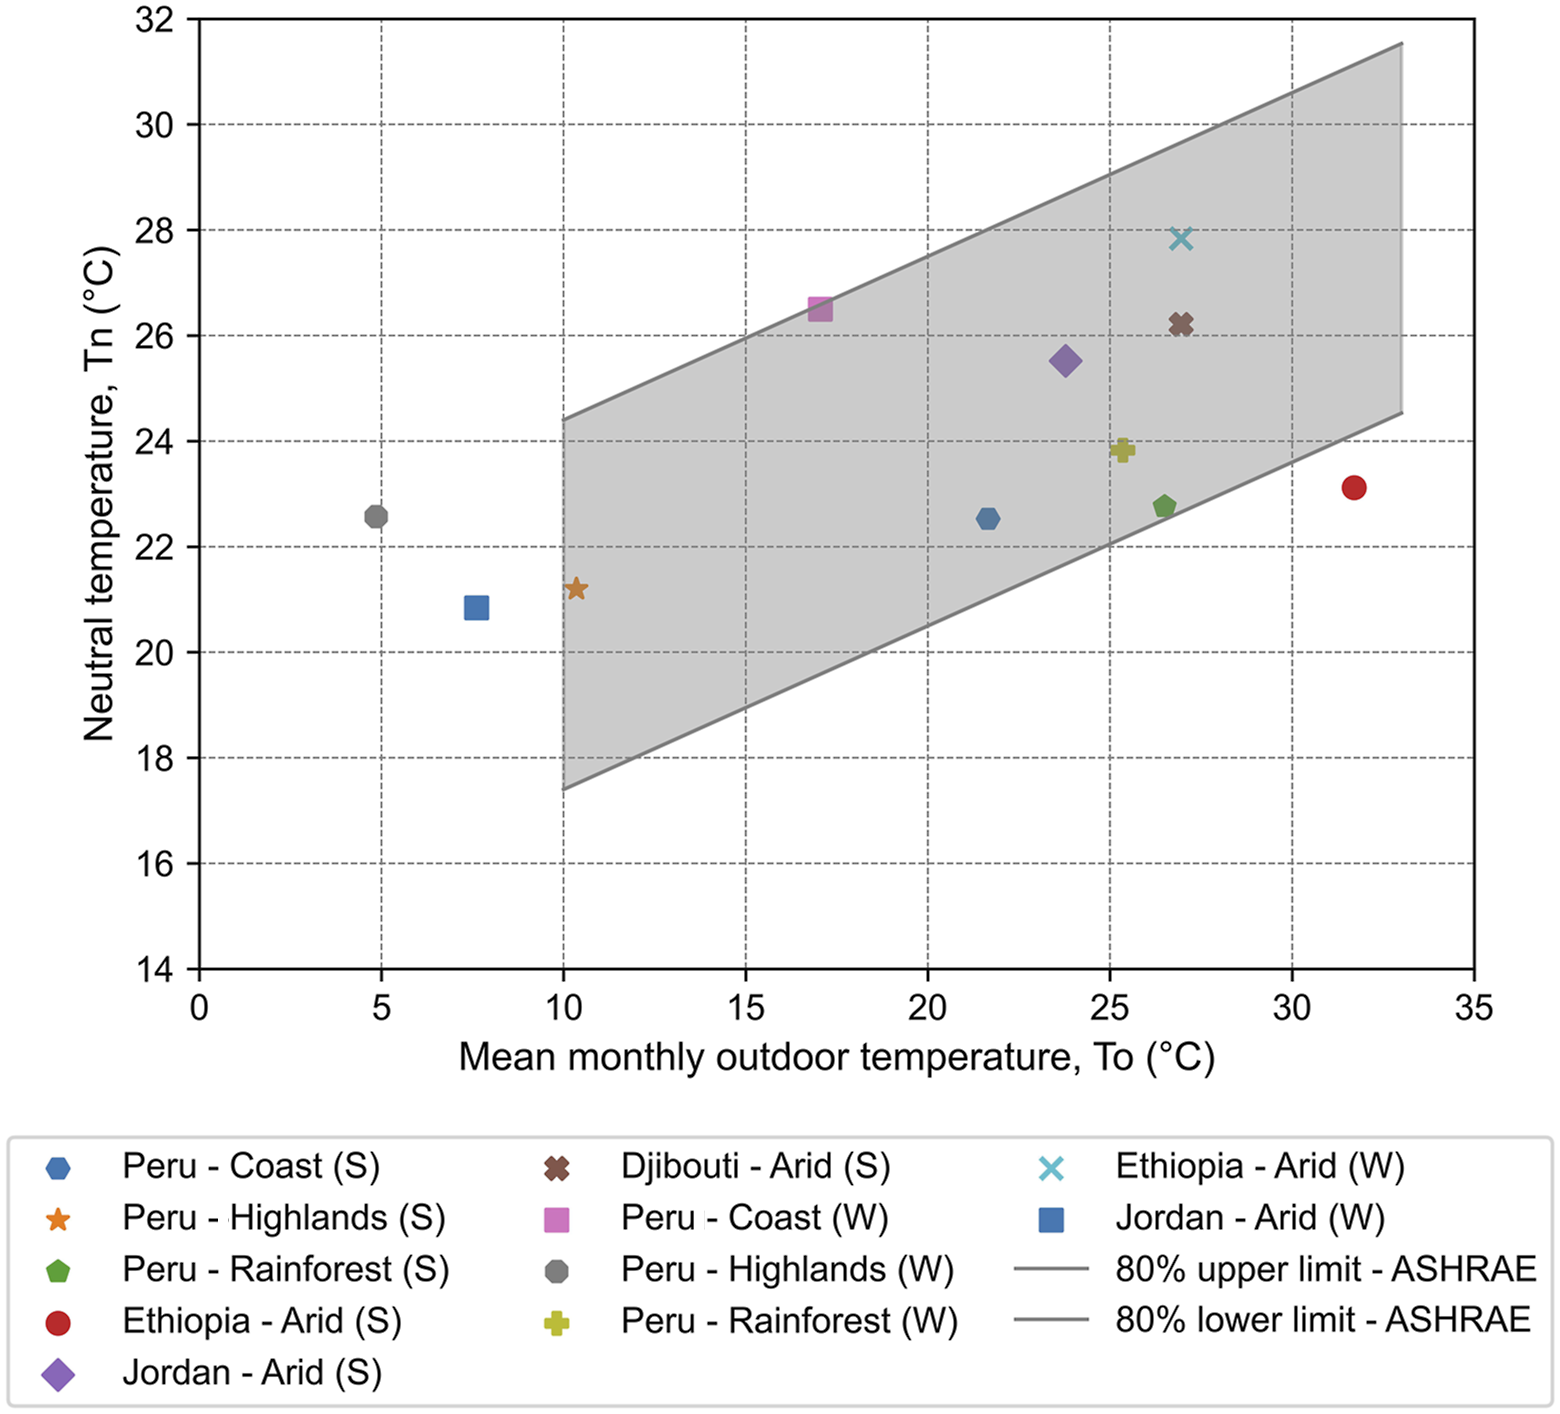
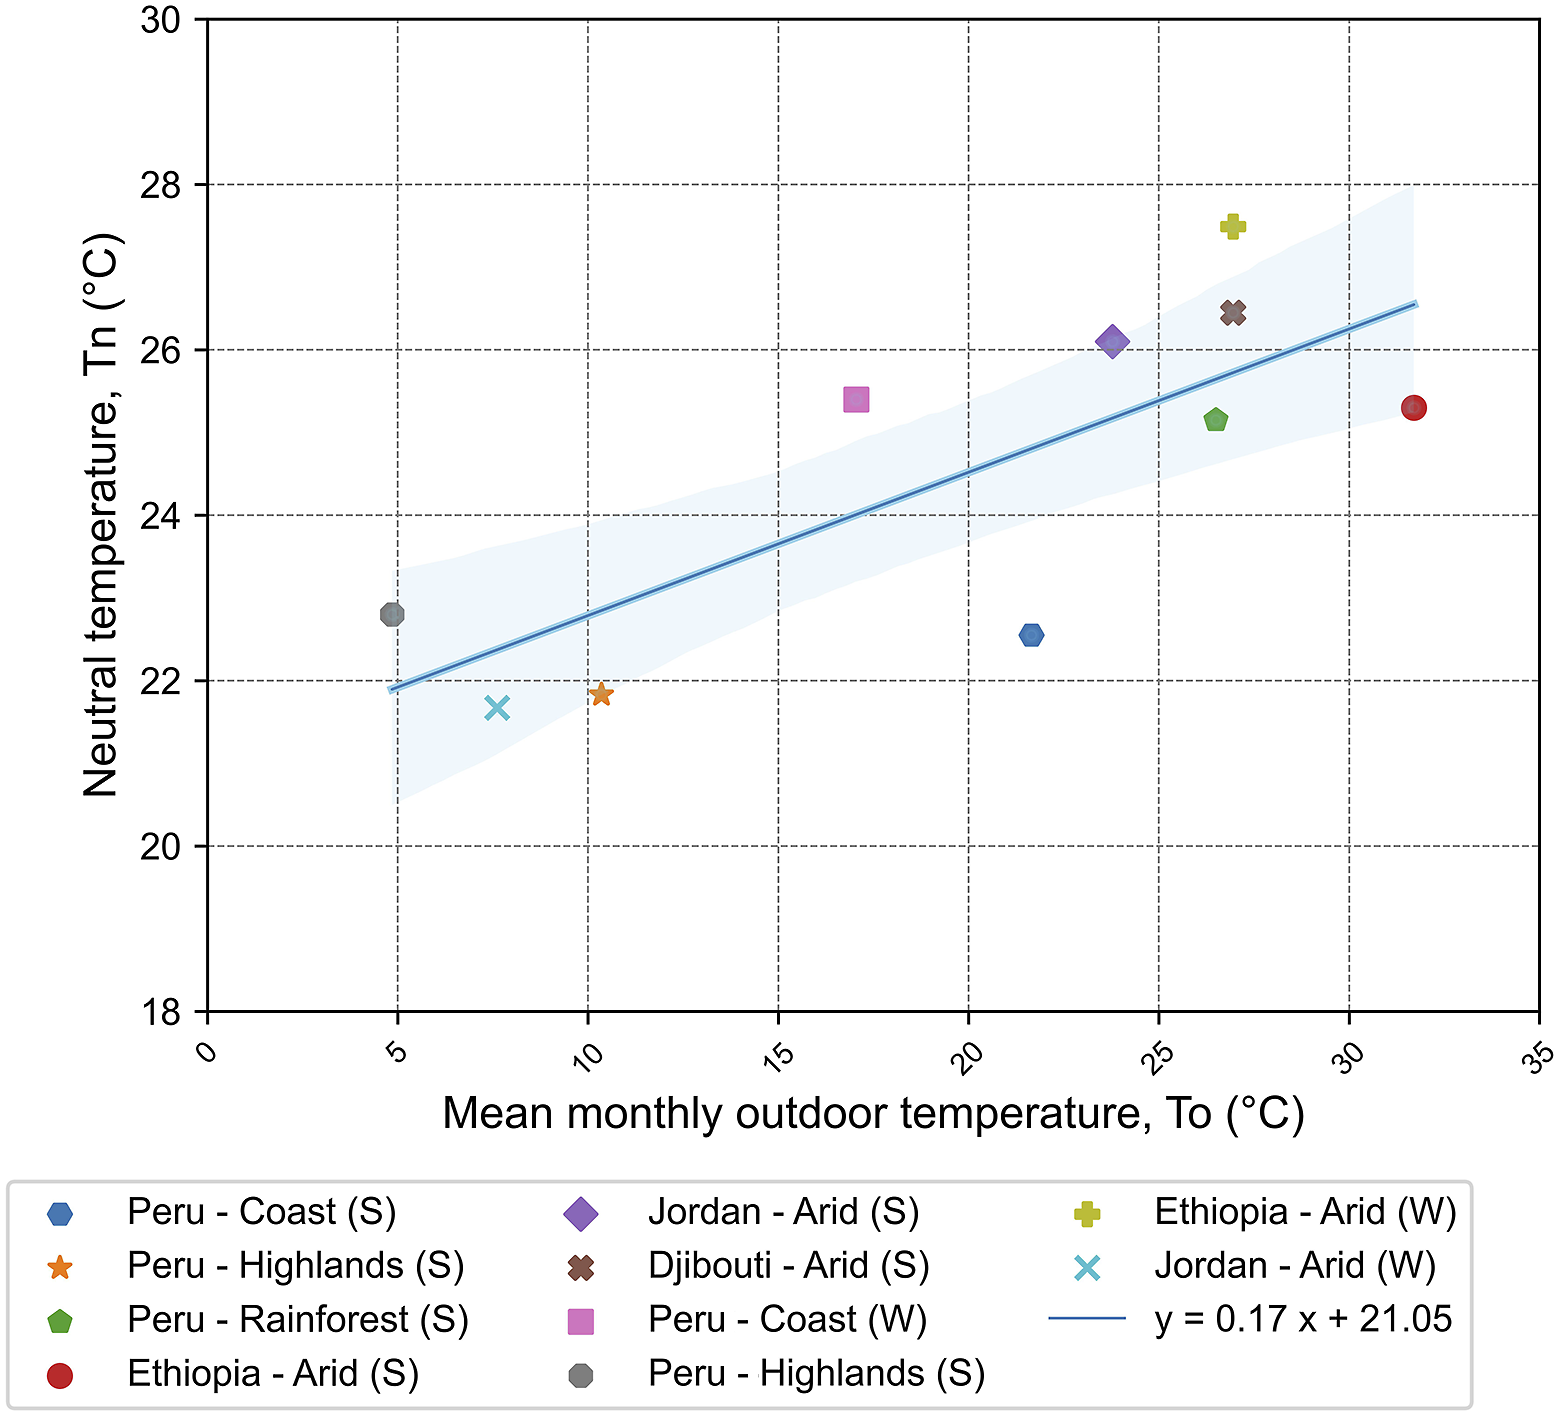
A comparison of the neutral temperatures (calculated using both the regression and Griffiths’ method) and ASHRAE-ATCM is shown in Figures 9 and 10. Because the neutral temperatures evaluated from the linear regression and the Griffiths’ method are close to one another, the two graphs are similar. Using the linear regression Tn, each season falls within the ASHRAE-ATCM acceptable limit of 80% (Figure 9). However, both the regression and Griffiths’ method derived neutral temperatures are close to the limits of the ASHRAE-ATCM. This is notably true for the neutral temperatures computed using the Griffiths’ method, where for a number of locations, the calculated neutral temperature was not within the ASHRAE-ATCM (Figure 10). This suggests that living in poverty is associated with a greater tolerance and adaptability to a broader range of temperatures than is indicated by the ASHRAE-ATCM. With the neutral temperatures falling near the edge of the ASHRAE-ATCM comfort band, this means the need for a wider comfort band to account for 80% acceptability. Fitted regression model of the neutral temperatures of each study calculated using the linear regression method compared to the mean monthly temperature that was present during the data collection. Fitted regression model of the neutral temperatures of each study calculated using the Griffiths method (G = 0.19) compared to the mean monthly temperature that was present during the data collection.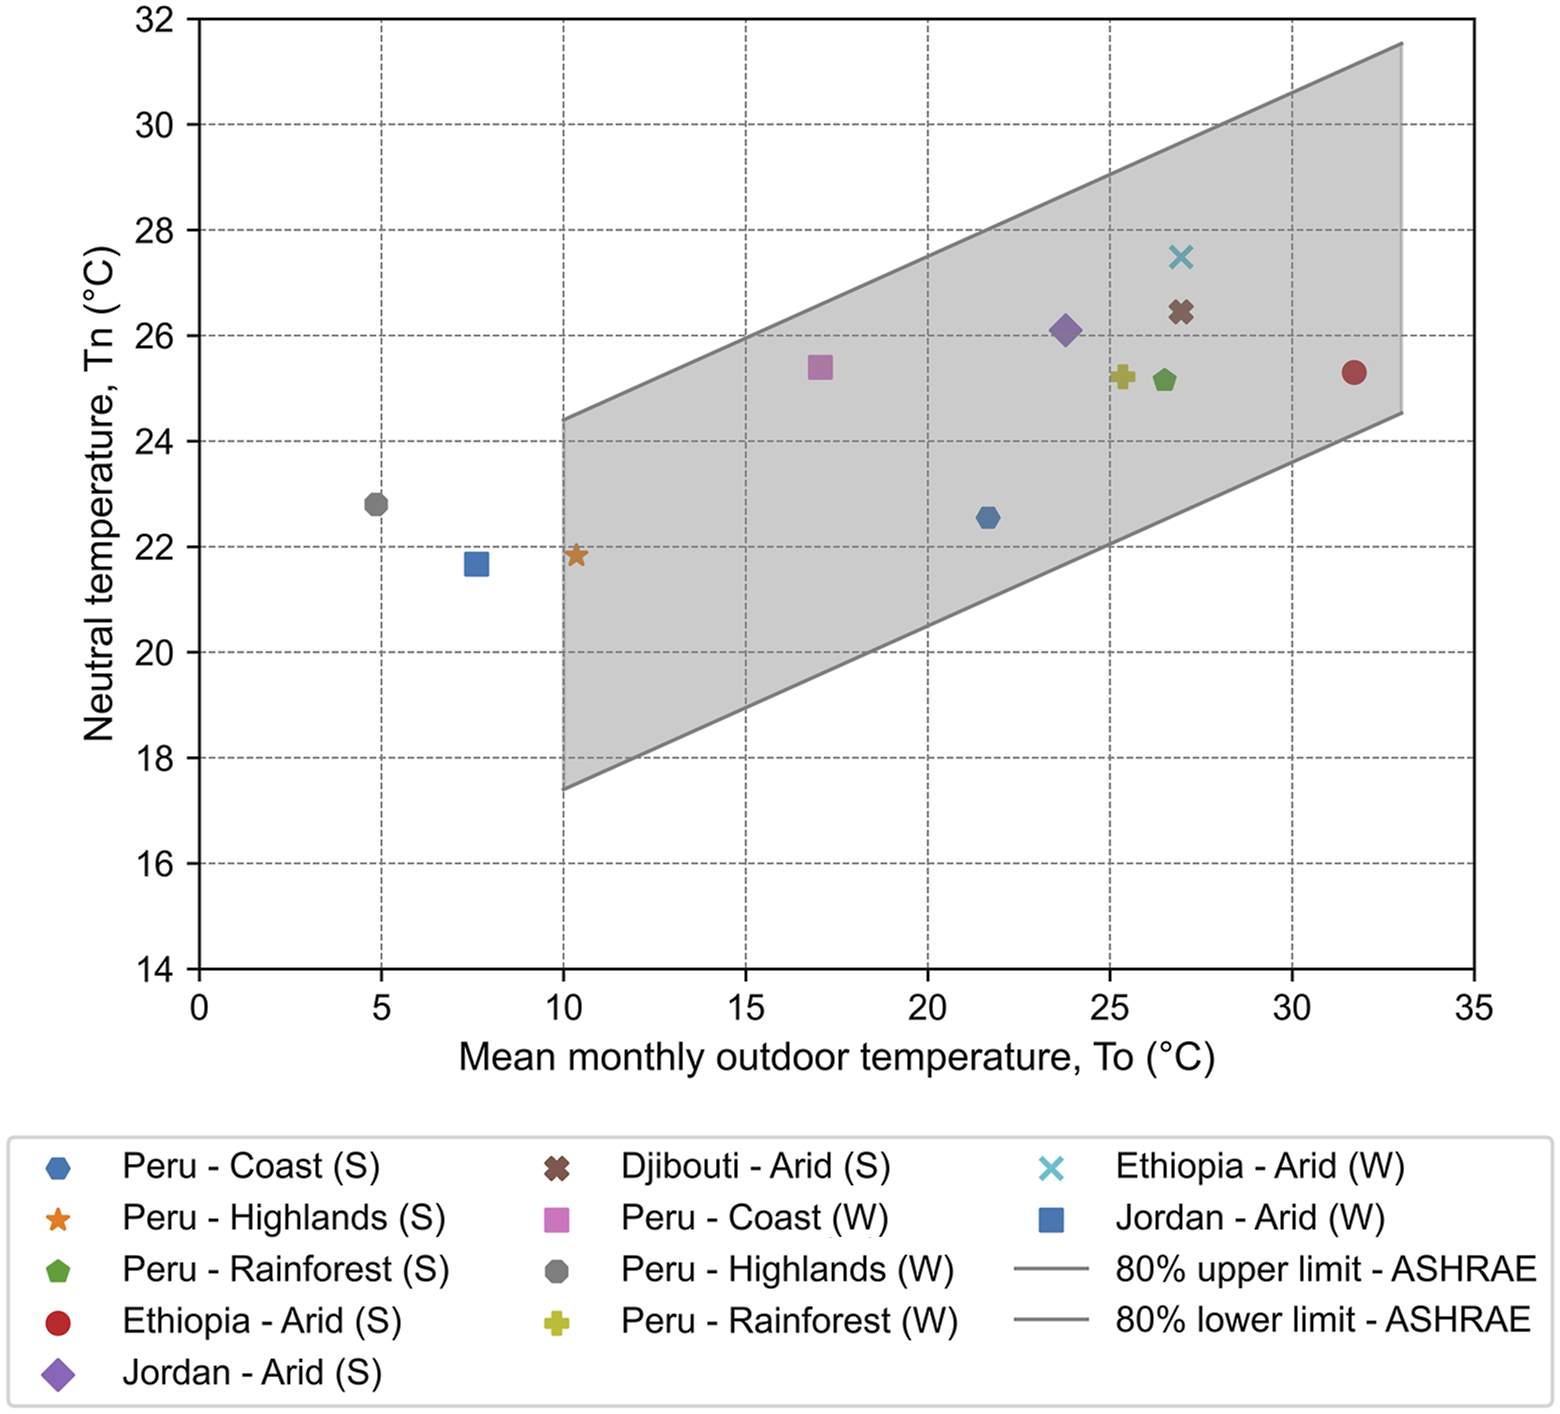
A new adaptive thermal comfort model
The ASHRAE Standard adaptive thermal comfort model (ASHRAE-ATCM) is derived using a simple linear regression of neutral temperatures against the outdoor temperatures. The present study produced two adaptive equations using the neutral temperatures derived from the regression method (Tnr) and Griffiths’ method (Tng). The neutral temperatures calculated using linear regression (Tnr) and the historical mean monthly outdoor temperatures Tout are fitted in a regression relationship, except the Tnr value of Peru-Rainforest in winter (Figure 11). This is because it has a low coefficient of determination (R2 = 0.25) which signals less confidence in the accuracy of the derived neutral temperature and a p-value of 0.07 (>0.05). The calculated adaptive model is presented in equation (9) (R2 = 0.6 and p-value = .005), (Table 8). Fitted regression model of the neutral temperatures of each study calculated using the linear regression method compared to the mean monthly temperature that was present during the data collection. Summary of simple linear regression of Tnr on Tout.
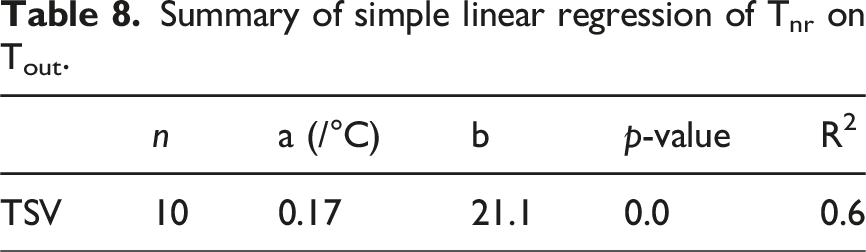
The regression gradient indicates that for approximately each ±1°C change in the outdoor temperature changes indoor neutral temperature by ± 0.17°C, which is an adaptability to outdoor temperatures less than that of ASHRAE adaptive model at ±0.31°C. A simple linear regression between neutral temperatures calculated using Griffiths’ method and concurrent mean monthly outdoor temperatures Tout is calculated and represented in equation (10) as shown in Figure 12 and Table 9. Fitted regression model of the neutral temperatures of each study calculated using the Griffiths method (G = 0.19) compared to the mean monthly temperature that was present during the data collection. Summary of simple linear regression of Tng on Tout.
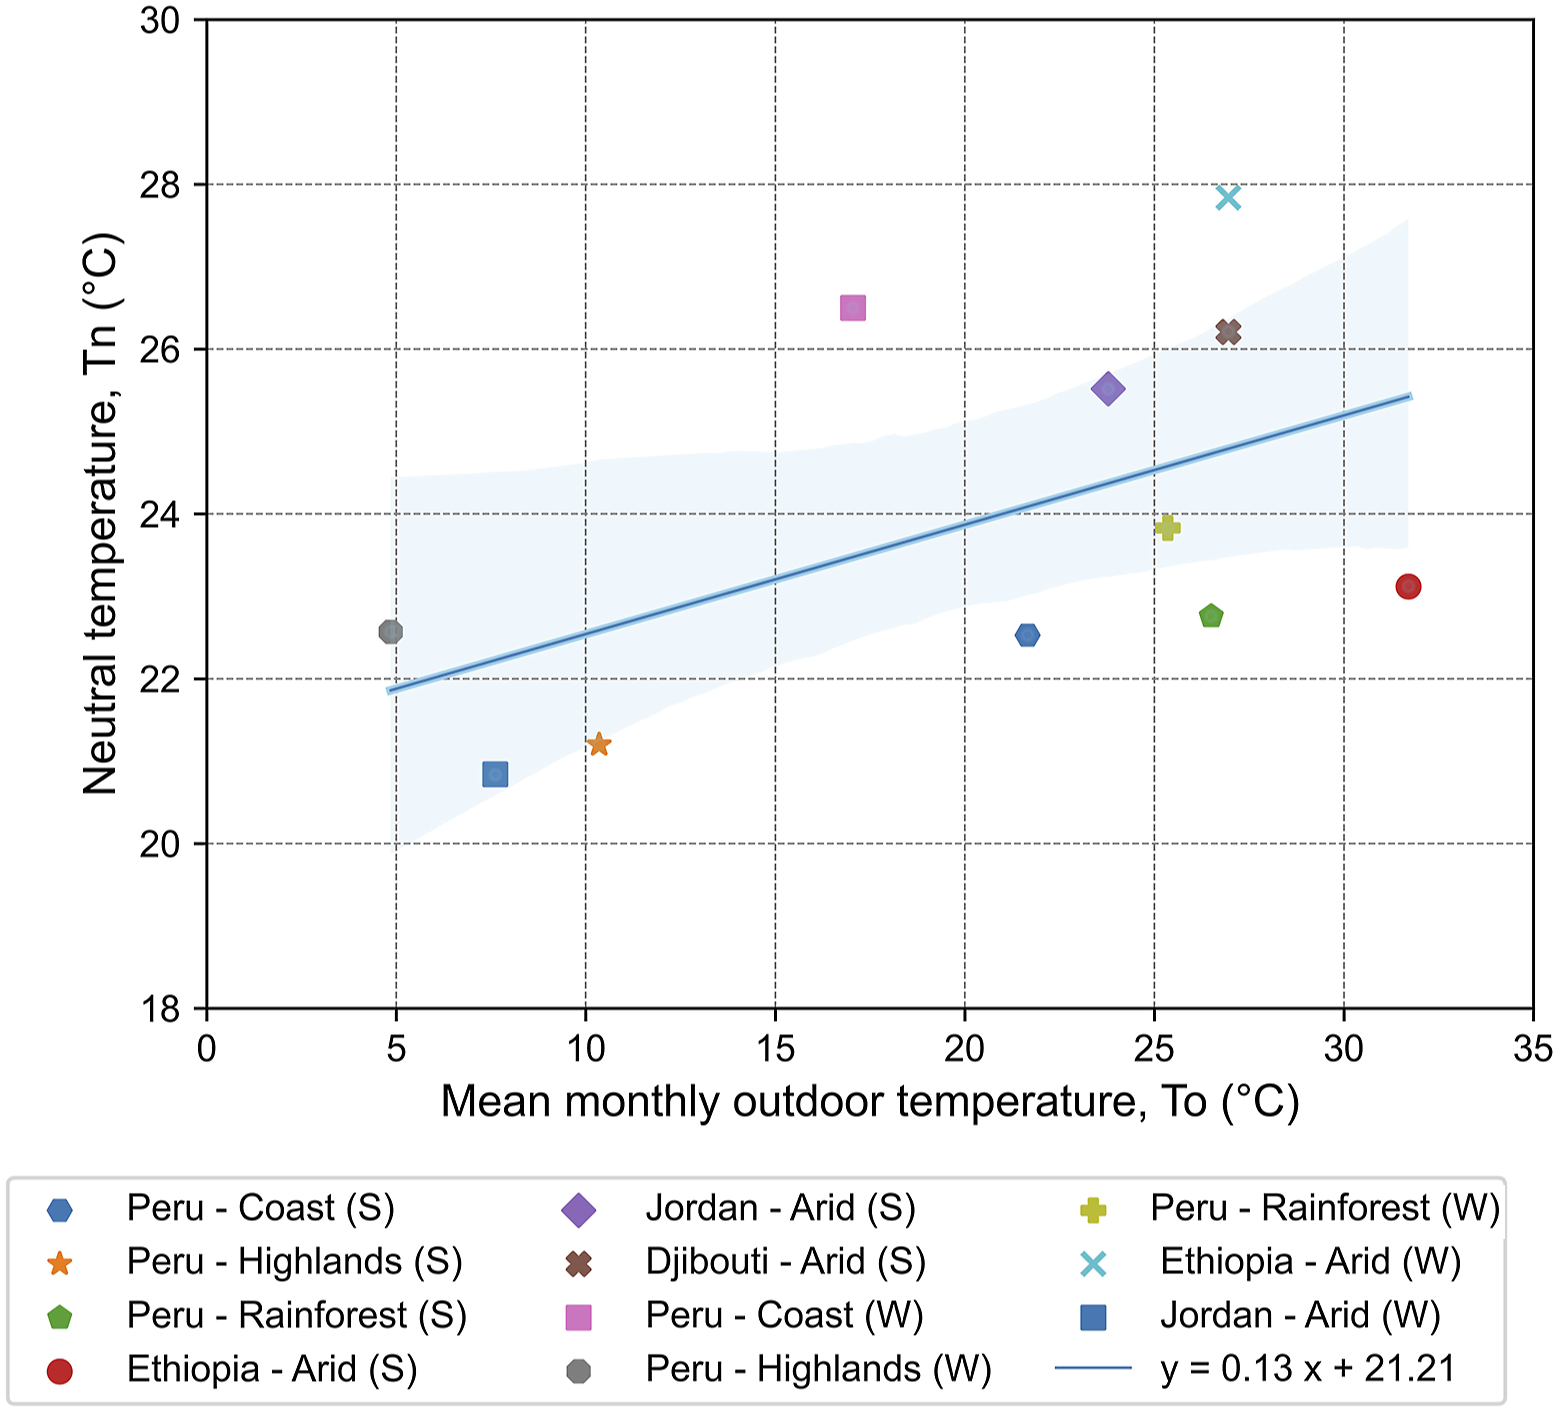
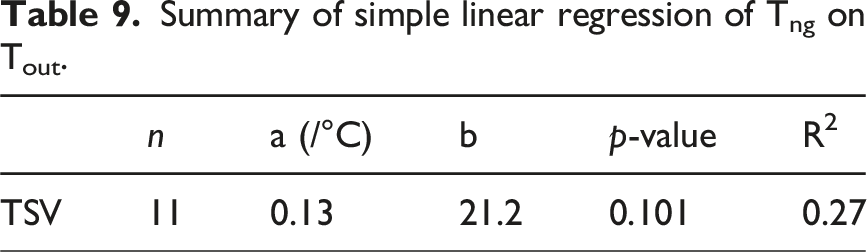
The low coefficient of determination (R2 = 0.27) derived from this regression model with a p-value of 0.101 reveals a weak correlation between the comfort temperatures (based on Griffiths’ method) and the outdoor temperatures. Thus, the model produced using the regression method equation (9) is believed to best represent the data because it is statically significant. Therefore, it is adopted to define 90% and 80% acceptability limits and used in the following analysis and discussion.
Comfort bands are the range of temperatures that are deemed ‘acceptable’ and are defined as 80% acceptability, which corresponds to a TSV between −0.85 and 0.85. This is based on Fanger’s PMV-PPD relationship in which PPD (Predicted Percentage Dissatisfied) equals 20% when the group mean thermal sensation (PMV) equals −0.85 and +0.85 on ASHRAE seven-point scale.
49
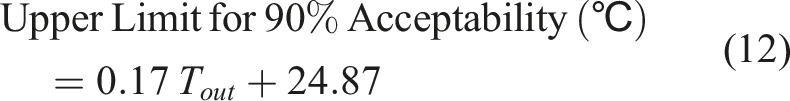
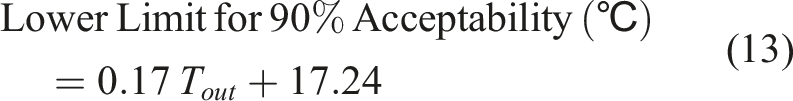
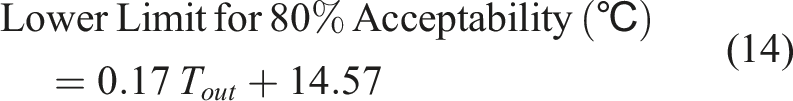
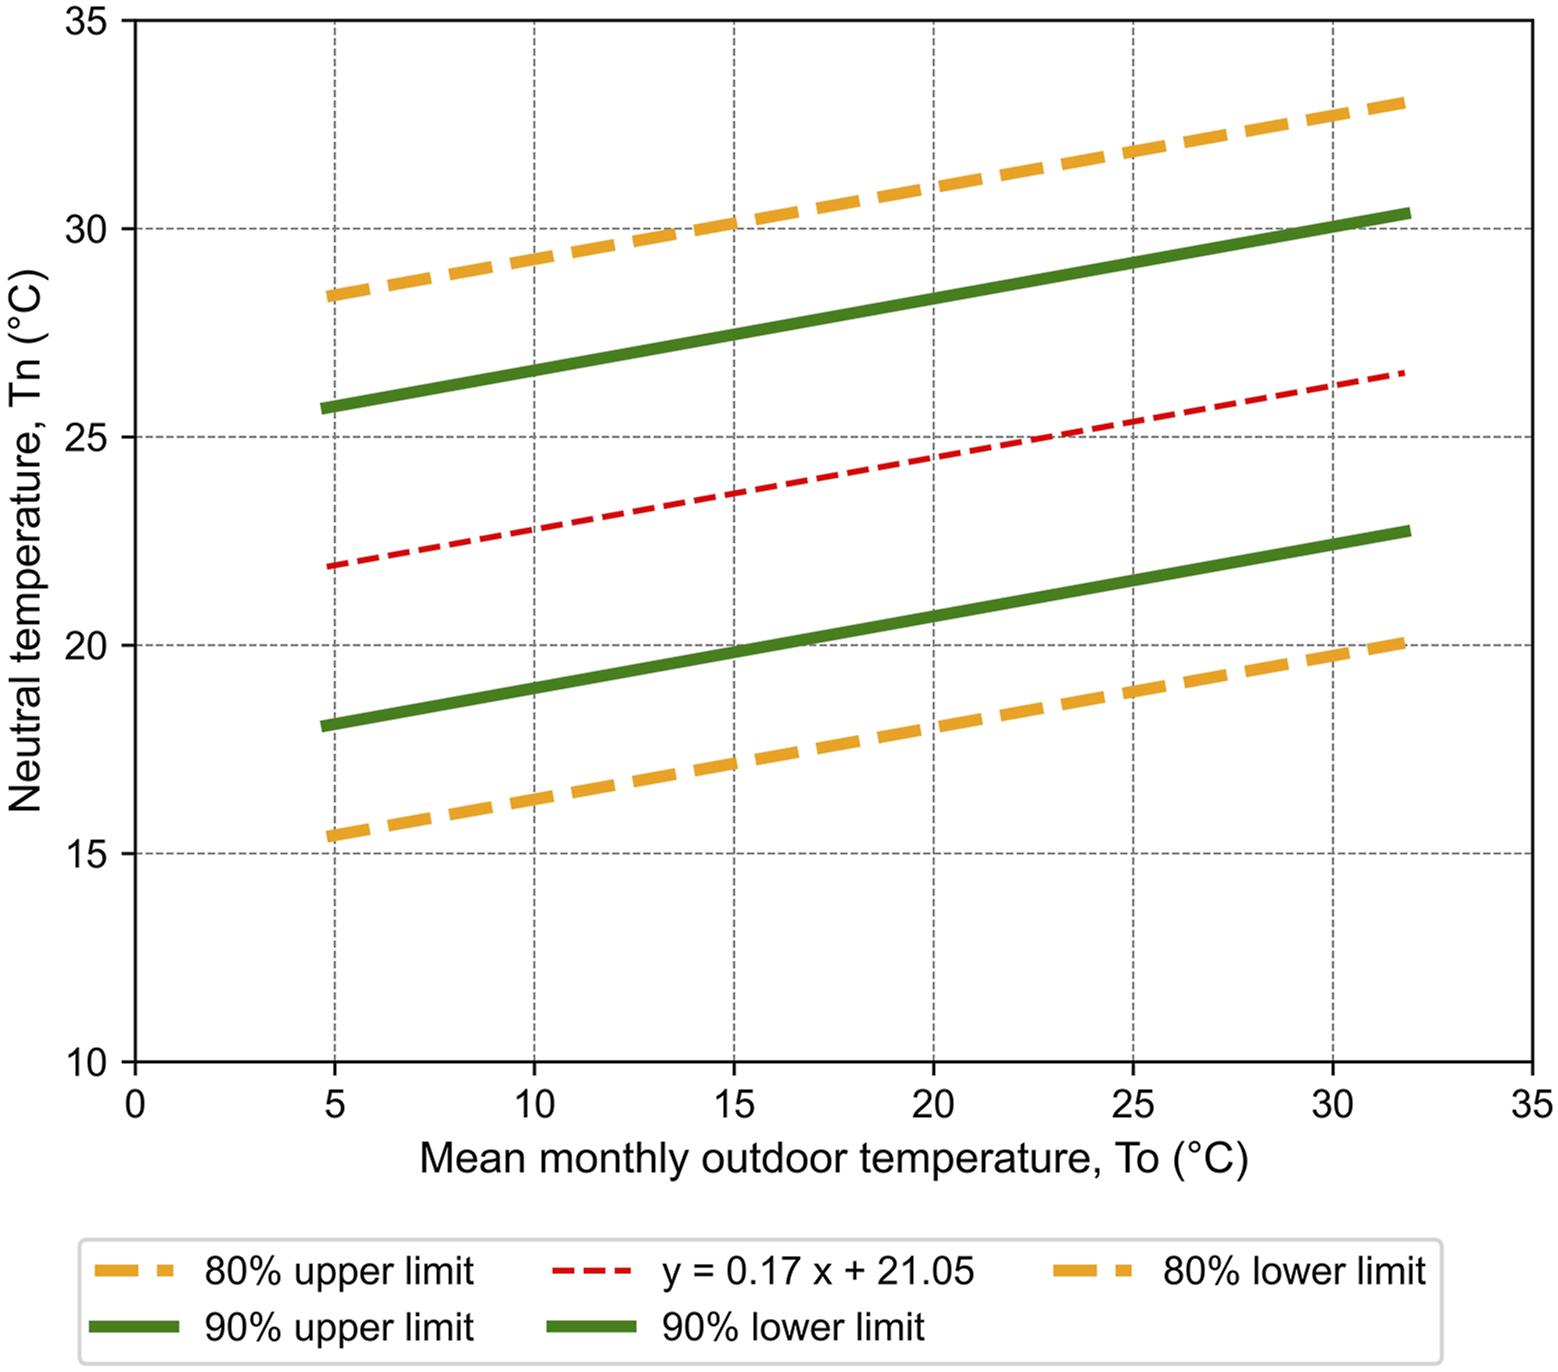
Likewise, 90% acceptability limits can be defined by solving the regression model for TSV of −0.5 and +0.5. Once the adaptive equation has been selected, acceptable temperature limits are determined. As illustrated in Figure 13, the 90% and 80% acceptability limits of equation (9) are calculated. For each sub-group was developed, the 90% and 80% comfort bands are calculated by applying the 0.50 and 0.85 criteria to each sub-groups’ regression model of thermal sensation as a function of indoor operative temperature. 90% and 80% acceptability limits for the new adaptive model.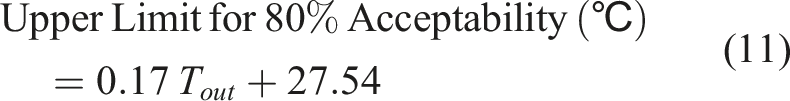
The 80% acceptability range derived from the analysis on informal settlements and refugee camps samples, compared against that of ASHRAE-ATCM, is depicted in Figure 14. The slope of the equation proposed in this analysis, equation (9) (±0.17°C) is shallower than that of the ASHRAE-ATCM (±0.31°C) by a difference of ±0.14°C. This suggests that occupant’s adaptability to outdoor temperatures that is less than that of the ASHRAE-ATCM. The 90% and 80% acceptability ranges derived from this analysis are compared against ASHRAE Standard 55. The width of 90% acceptable comfort zone is around 8°C and width of the 80% acceptable comfort zone around 13°C. The new model has significantly extended the comfort boundary of the current adaptive model of ASHRAE. A comparison between acceptable operative temperature ranges for naturally conditioned spaces of ASHRAE Standard 55 and the derived model.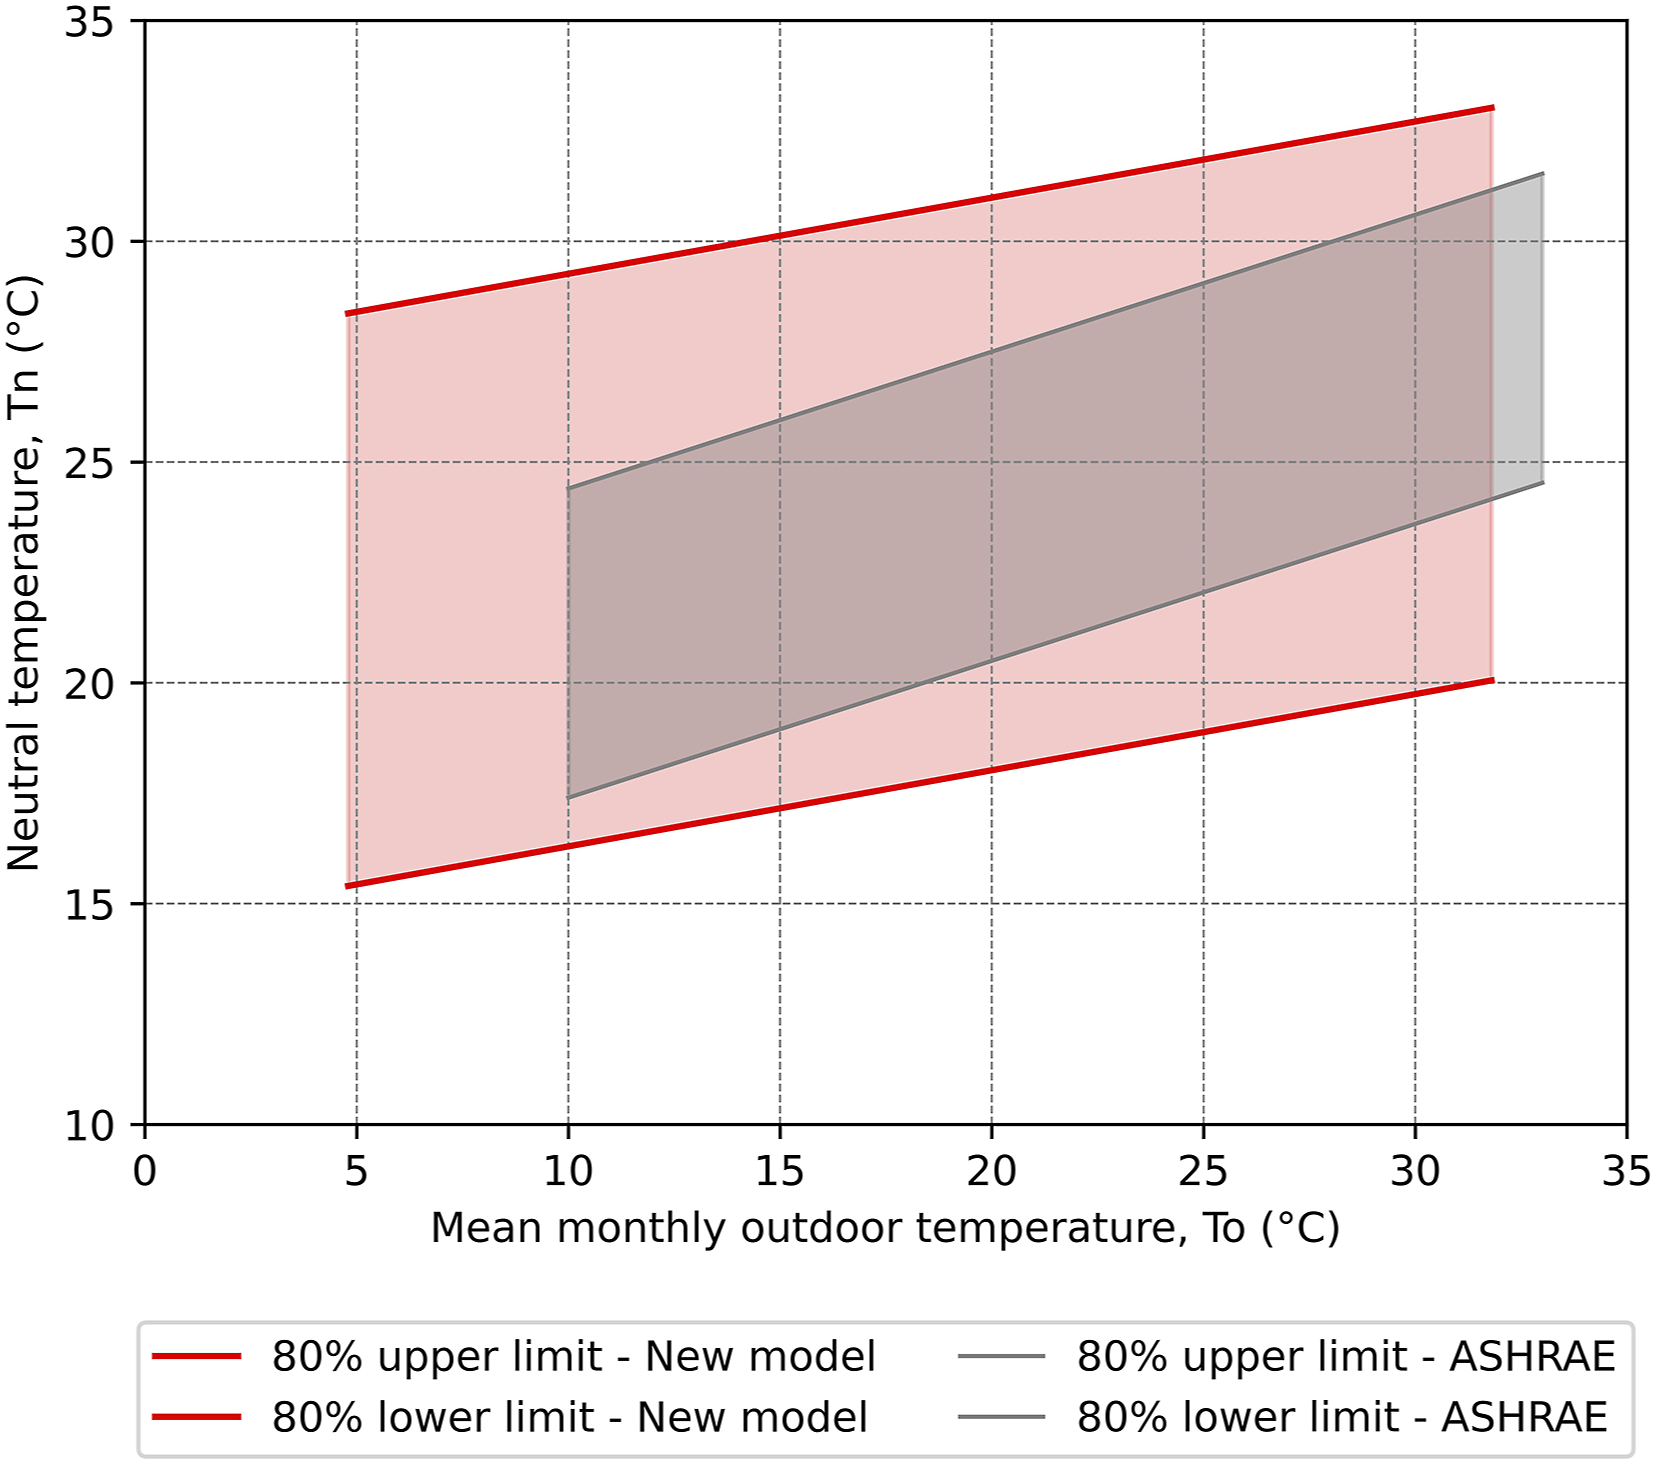
As the extent of the acceptability ranges derived from this analysis is wider, when overlaid with that of the ASHRAE-ATCM a significant overlap in the comfort range of the two models is observed, in the mid-temperature range between 10°C to roughly 32°C (Figure 14). Although the extent of the acceptability ranges derived from this analysis are greater than ASHRAE-ATCM, the slope of the derived model suggests less adaptivity of the occupants in extreme temperature ranges which are warmer than 30°C. In general, for derived adaptive thermal comfort models sampling occupant populations in warmer climates living a significant portion of their lives without any means for active climate control, greater adaptability is observed. Generally, a reduced adaptability is observed when considering populations that are acclimatized and accustomed to means of active climate conditioning indoors. This indicates the issue of tolerance against comfort especially as our derived model implies that there is less fluctuation in Tn to expected outdoor temperatures, which is less adapting when compared to ASHRAE-ATCM and can be explained by the displaced nature of the occupants.
The slope of the equation given in this analysis differs from the ASHRAE-ATCM by 0.14°C. However, the increase in the 80% acceptability range between the equation proposed in this analysis and that of the ASHRAE-ATCM is much greater. From this work it is probably safe to conclude that being in lower economic groups such as in informal settlements and refugee camps increases climate tolerance and adaptability beyond the ASHRAE-ATCM, but harder to conclude comfort is or is not being achieved.
Discussion
Analysis revealed that both the new equation and the ASHRAE-ATCM indicate a consistent rise in the neutral temperature corresponding to the average monthly outdoor temperature. Although, the slope of the new equation differs from the ASHRAE-ATCM by 0.14°C.
In a study conducted to develop a new adaptive comfort model for low-income housing in Chile 23 ; the slope of the model when the prevailing mean outdoor temperatures over 6.5°C is 0.678, and 0.115 when the prevailing mean outdoor temperature falls below 6.5°C and is above 5°C. This shows that the subjects are more tolerant to cold temperatures too. This is justifiable as the temperatures in the warmest months in Chile is below 22°C and the average temperature in coldest months is above 0°C. Moreover, the high tolerance of the occupants was considered to be a result of fuel poverty and cultural adaptation. In the humid subtropical climate of Eastern Australia, a study was conducted to develop a residential adaptive comfort equation (12). Occupants of these residential buildings showed greater thermal adaptability. A slope (gradient) of 0.26°C was achieved. The span of 80% acceptability in indoor temperatures was 9K, which is close to the 80% acceptability limit in this study. However, the difference in the slope is believed to be a result of building type and population characteristics. The subjects in the current study have distinctive features; (A) their shelters are not capable of maintaining minimum thermal comfort conditions indoor, (B) do not have access to artificial acclimatization devices despite extreme climate conditions. Thus, they tend to increase their thermal tolerance and possibly lower their comfort expectations to adapt to their environment.
The distinction between tolerance and comfort clearly warrants further investigation, particularly in the context of informal settlements and refugee camps. Understanding these differences and their effects on the well-being of people in such settings will help to inform the development of more targeted and effective interventions and mitigate the potential health risks associated with prolonged exposure to extreme temperatures. Furthermore, thermal comfort is a complex concept that is influenced by several psychological and physiological parameters. People displaced due to war and natural disasters, are not only impoverished but they have to adapt to a new living condition, sometimes in new countries; they will certainly have aggravated psychological conditions that may or may not affect their thermal adaptability. All these factors warrant further studies into thermal comfort of displaced people. However, this study represents a significant contribution in this understudied topic, and whilst it uses simple methods these are sufficient for the purpose of understanding the overall thermal boundaries and inform the design of shelters.
Conclusions
This paper has completed the first in-depth study of thermal comfort for displaced populations across multiple countries and climates. As average residency in a refugee camp has grown to at least a decade,
58
providing suitable accommodation is key to quality of life and dignity. A large dataset collected by field measurements in extremely difficult and potentially dangerous settings covers a range of climatic zones in Jordan, Djibouti, Ethiopia and Peru. This was used to construct a new adaptive thermal comfort model that represents the conditions in informal settlements and refugee camps. For such populations, the new model is likely to be a more accurate than the currently used international standards. The main findings are: 1. Low-income groups, in particular displaced people, may consider themselves comfortable (or at least tolerant) of a wider range of indoor temperatures than stated in ASHRAE-ATCM. 2. The slope of the adaptive equation (0.17) is less steep than that of the current ASHRAE adaptive model (0.31). 3. 80% acceptability band width is 13 K, and 90% acceptability band width is 8 K – much wider than in international standards. 4. As discussed earlier, tolerating high temperatures does not necessarily mean occupants are comfortable.
42
However, living in shelters that are not capable of maintaining normal thermal comfort conditions leads occupants to have lower thermal comfort expectations and to adapt to their environment.
A computer tool was developed based on the new model and is currently being applied by aid agencies to refugee camps in Afghanistan to allow for the rational design of shelter. As the new model suggests a wider than previously thought tolerance, this allows for a reasonable shelter design that is based on refugee and displaced people’s thermal adaptability and expectations; rather than imported ideals that are impossible to achieve in such settings, and thereby designers neglecting thermal comfort standards all together.
Supplemental Material
Supplemental Material - Thermal comfort in lower economic groups: The applicability of the ASHRAE-55 adaptive standards in informal settlements and refugee camps
Supplemental Material for Thermal comfort in lower economic groups: The applicability of the ASHRAE-55 adaptive standards in informal settlements and refugee camps by Rawia Ibrahim, Dima Albadra, Abdulla Alnuaimi, Noorullah Kuchai, Alejandra Acevedo-De-los-Ríos, Daniel Rondinel-Oviedo, Sukumar Natarajan and David Coley in Building Services Engineering Research & Technology.
Footnotes
Acknowledgments
Declaration of conflicting interests
The author(s) declared no potential conflicts of interest with respect to the research, authorship, and/or publication of this article.
Funding
The author(s) disclosed receipt of the following financial support for the research, authorship, and/or publication of this article: This study is supported by Engineering and Physical Sciences Research Council; EP/P029175/1.
Supplemental Material
Supplemental material for this article is available online.
References
Supplementary Material
Please find the following supplemental material available below.
For Open Access articles published under a Creative Commons License, all supplemental material carries the same license as the article it is associated with.
For non-Open Access articles published, all supplemental material carries a non-exclusive license, and permission requests for re-use of supplemental material or any part of supplemental material shall be sent directly to the copyright owner as specified in the copyright notice associated with the article.