
Abstract
Swimming pools are critical public health infrastructure that provide benefits to diverse user groups. However, they are also energy-intensive and expensive to operate. Therefore, national policies regarding swimming pool circulation requirements need to balance these factors to ensure multi-dimensional sustainability. We develop a methodology to gather quantitative information to support industry-wide policy recommendations. We use openly-available data from 6433 non-domestic swimming pools in England to estimate national-scale energy use, cost and carbon footprint associated with swimming pool circulation. Our results show that total annual energy use for pool water circulation, assumed to be operating within national guidelines, is 369,000 MWh at a cost of £100M. A further 109,000 MWh (£6.33M) is associated with filter backwashing processes. The combined annual carbon footprint from energy and water use is 98,400 tCO2e. We investigate three industry-recognised interventions to reduce energy use in pool water circulation, which would not typically compromise water quality or safety, and demonstrate these could reduce costs by up to 70%. Differences between national guidelines on pool circulation also suggest overly cautious requirements for certain pool types. The results demonstrate the substantial impact changes to policy guidelines could have on the financial and environmental sustainability of non-domestic swimming pools.
Practical Application
This paper provides building services engineers with evidence of how operational interventions within swimming pool pumping systems can substantially reduce energy usage, running costs and emissions.
Introduction
Swimming is a popular form of exercise globally, due to its low cost, low impact and high accessibility. For example, the percentage of the population swimming more than once a fortnight is 5.6% in the UK 1 and 9.8% in Australia, 2 while approximately 15% of adults in the USA swim at least six times a year. 3 Due to the popularity of swimming, there are over 6000 non-domestic swimming pools used for recreational or competitive swimming in England, 4 a total of 4.4M public and private swimming pools in Europe 5 and an estimated 309,000 public pools in the USA. 6 The health benefits of swimming represent preventive medicine that, in the UK, saves the National Health Service £357M per year. 7 Thus, public swimming pools are critical public health infrastructure. However, they are also resource-intensive. A leisure centre with an indoor pool can require around seven times more energy for every square metre of building area compared to an average commercial office building and consume up to 1000 Ml of water each year. 8
Over half the running costs of premises (not including staff) for a typical 25 m swimming pool facility are spent on energy, 9 which in addition to heating, ventilation, and air conditioning (HVAC) includes a significant but poorly quantified amount used to circulate water around the pool via the water treatment plant. Increasing energy prices are putting enormous financial pressure on pool operators, with many commercial pools currently under threat of closure. 10 Thus, measures to reduce energy use are coming under intense scrutiny by pool operators and regulators with a view to minimising operating costs as well as reducing the carbon footprint. 11 However, it is essential that any changes to normal operations, for example adjusting water circulation rate using variable speed pumps, 12 should not compromise water quality and bather safety. Therefore, national guidelines, for example UK PWTAG 9 and German DIN, 13 provide guidelines on acceptable limits of water circulation to ensure bather safety. However, the impact of these guidelines on energy consumption and economic sustainability has not been studied in a systematic way. The complexity and variety of indoor pool facilities has resulted in limited progress in the development of performance indicators to measure, compare and benchmark their consumption of energy and water. 14 Kampel et al., 15 proposed normalising energy use of swimming facilities in relation to number of visitors or water surface. However, such information only provides an overview and may not reveal how energy performance of any individual indoor pool facility can be improved.
The aim of this paper is to examine the environmental and economic impact of current swimming pool circulation guidelines by focussing on a metric common to all indoor pools: namely the energy used to pump water from the pool to the treatment plant (for filtration, heating, chemical dosing and non-residual water treatments such as UV and ozone) and return to the pool,16,17 and the water and associated heating costs used for backwashing filters. Taking a national case-study approach, we use an openly-available database of non-domestic swimming pools in England to estimate the energy used if pools are circulating water in accordance with current guidelines using a typical amount of energy to circulate each m3 of water, and to normalise this in relation to water circulation (m3/h). We then explore opportunities for managing this energy cost through changes to policy guidelines using two examples of technical guidelines relating to current best practice for pool water treatment from UK 9 and Germany. 13
Materials and methods
Swimming pool data, geometry and volume
Data for 6433 non-domestic swimming pools across England used primarily for sport or recreational swimming were collated from the open access Sport England Active Places database.
4
This is a live database and therefore results reflect the status of the database on 6 January 2025. The database contains information on pool geometry (length, width, minimum depth and maximum depth) as well as opening times, specified on a spectrum from a single general period for the whole week through to seven individual daily, multi-slot periods. No information was available regarding swimming pool depth profile or planform shape. Therefore, several assumptions were applied to estimate pool geometry and hence pool area and volume from the available data. These assumptions impact upon the circulation rate requirements for pool water in accordance with the UK and German guidelines. First, the pool area was assumed to be the product of the length and width information provided. Second, two distinct depth-profiles were applied to estimate pool water volume. For pools with maximum depth <2.5 m it was assumed that the pool had a volume calculated assuming a simple rectangle plan with a floor sloping gradually from the shallowest to the deepest areas of the pool (Figure 1(a) and (b)). Thus, the estimated pool volume for the profiles in Figure 1(a) and (b) is the product of the width, length and the average of the minimum and maximum depths. Schematic of the three characteristic depth profiles assumed for sloping pools. Example 1 (a) and example 2 (b) are equivalent in cross-sectional area. Example 3 (c) shows a pool with gentle slope and then a steeper slope to a diving area. The width of the diving area (either 7 m or 10 m depending on length) is taken to the mid-point of the steep slope, for calculating pool area.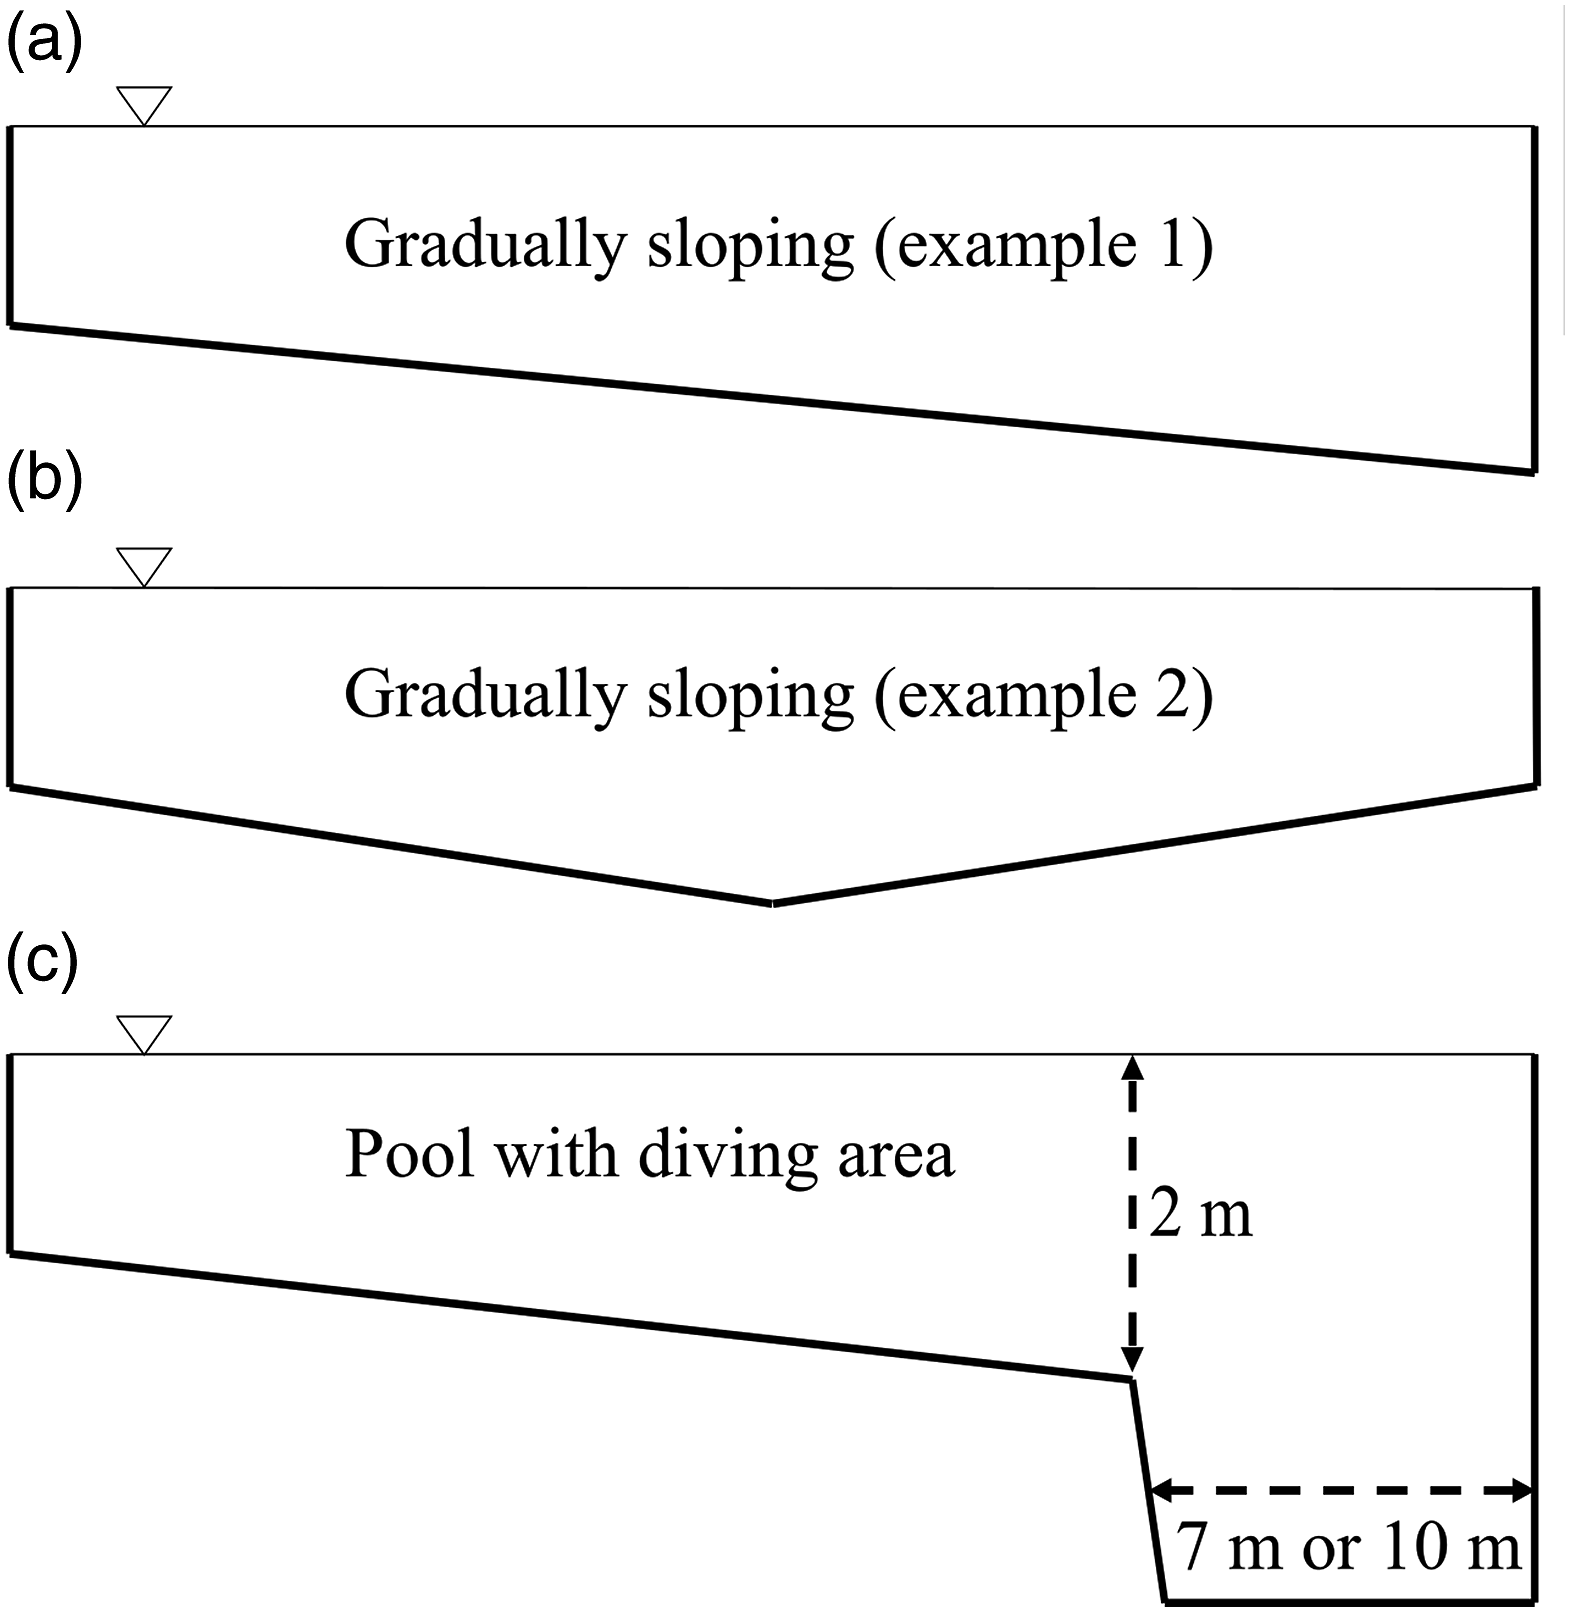
For pools with a shallow end <1.5 m and a maximum depth >2.5 m the pool is assumed to have a diving area contained within the pool rectangle with depth equal to the maximum depth information provided. These pools represented <10% of the total dataset. The diving area is assumed to be located within an area extending 7 m from the deep end of the pool (or 10 m from the deep end for a 50 m long competition pool) as depicted in Figure 1(c). The remaining pool floor is deemed to comprise a gently sloping floor from the shallow end of the pool to the start of the diving area where there is a steep ramp extending down to a flat floor at the maximum depth. We assume the depth at the start of the ramp is 2 m, and that the centre point of the ramp is seven (or 10 m) from the deep end. Pool volume is estimated from the sum of the volumes calculated for each of the distinct pool areas (gently sloping area and diving area). We note that diving areas not contained within the main pool rectangle are included as separate ‘Diving pools’ within the database for which the pool volume is calculated using the standard approach of multiplying average depth by the pool length and width. Pools within the database that were missing complete geometric information were excluded from the analysis.
Flow rate calculations
The swimming pool data do not contain information on flow (circulation) rate of pool water. The approach we adopt here to estimate flow rates from the available pool data is to presume that the pools are being operated in accordance with UK PWTAG 9 or German DIN 13 industry guidelines with respect to the rate at which water should be circulated for treatment purposes. We recognise that this approach will not perfectly reproduce actual flow rates at individual pools; this is not the purpose of the study. Instead, these methods permit use of openly-available national data to quantify the impact on energy use of compliance with two different national guidelines.
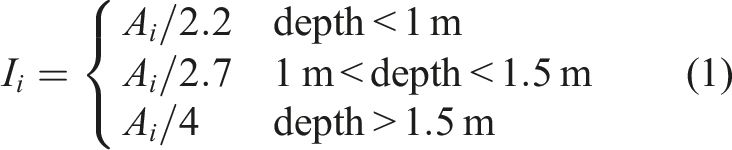
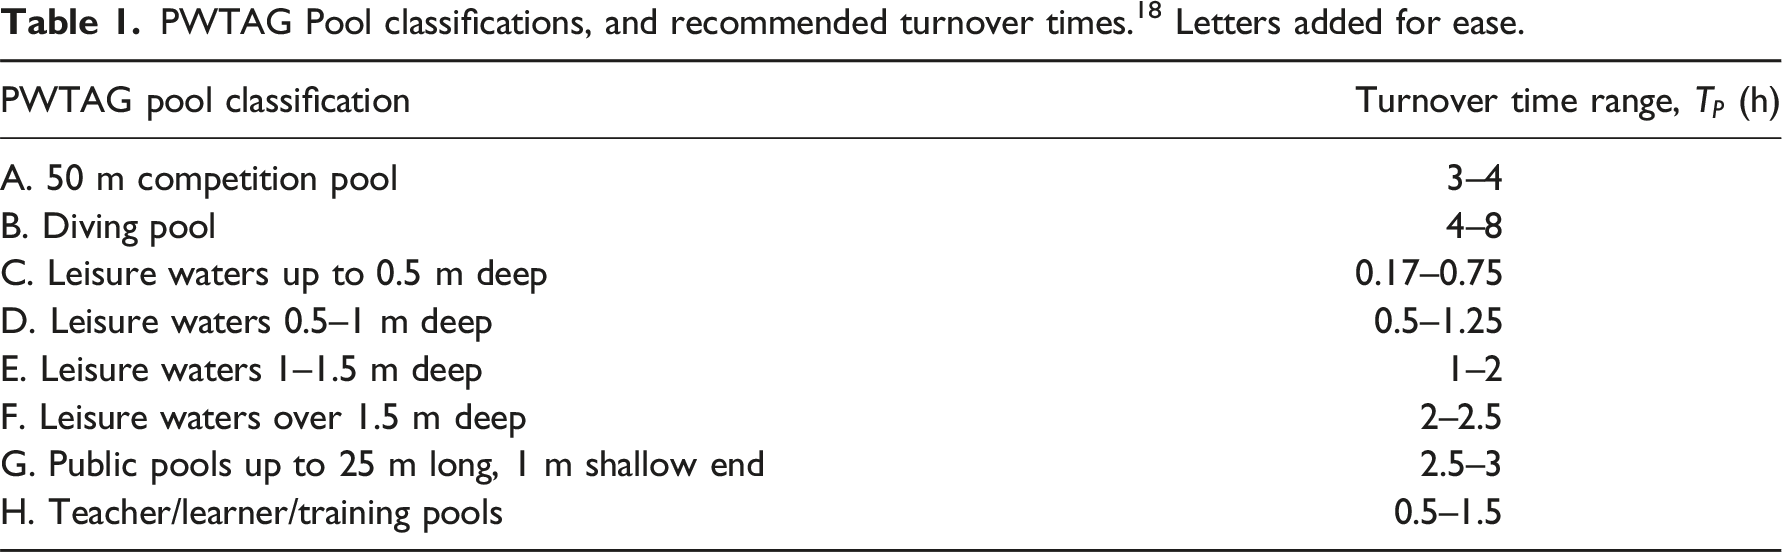
Water turnover times - PWTAG method
PWTAG Pool classifications, and recommended turnover times. 18 Letters added for ease.
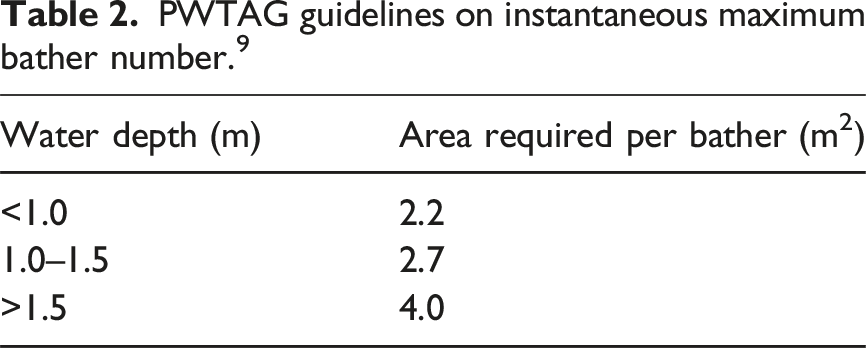
PWTAG guidelines on instantaneous maximum bather number. 9
The pool volume, V, is divided by this required treatment capacity expressed as water circulation rate (m3/h) to give a turnover time, 
When the calculated turnover time, 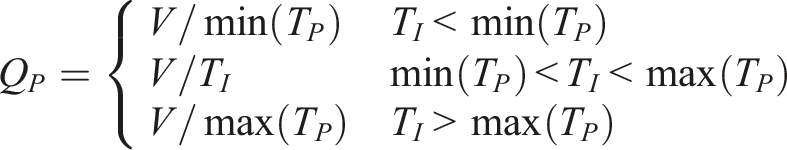
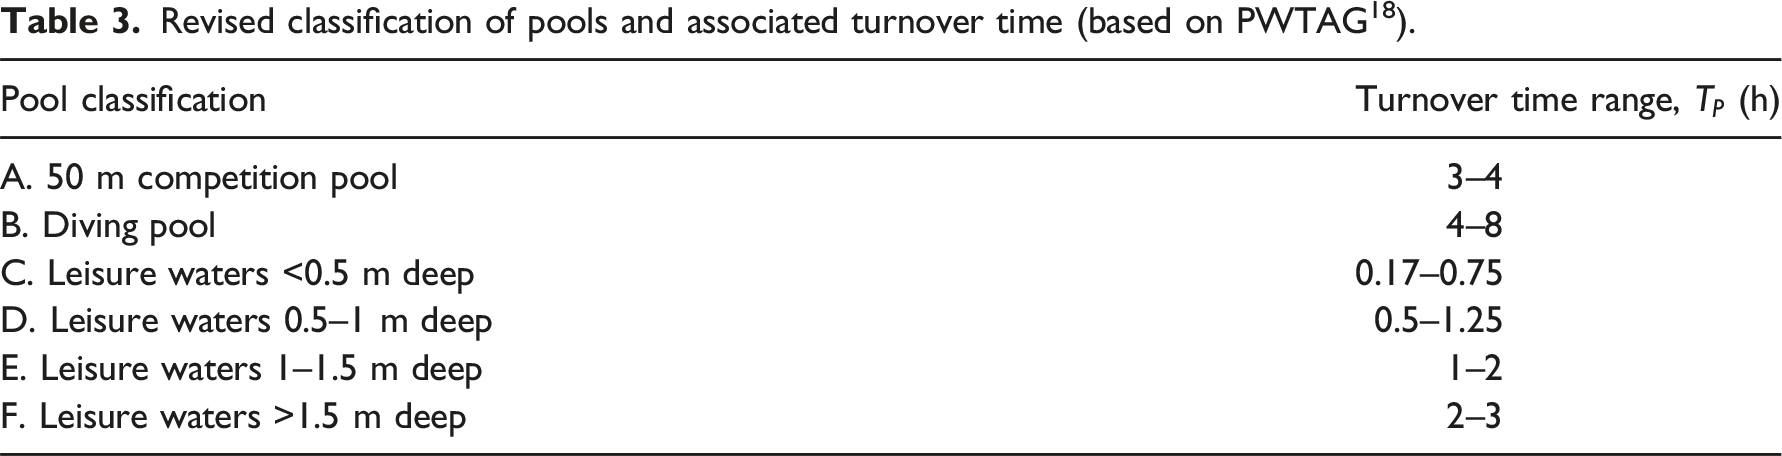
Because of the ambiguity in the PWTAG classifications (Table 1), with some pools falling in more than one category with differing turnover guidelines, two simplifications are made to the PWTAG classification to enable pools to be categorised unambiguously using just the available geometric data: (1) Category G is subsumed into category F with a resulting turnover time range of 2–3 h. (2) It is assumed that pools in category H are already accounted for within the existing categories and that the purely geometric classification suffices.
Revised classification of pools and associated turnover time (based on PWTAG 18 ).
Water turnover times – DIN method
To extend the findings beyond the UK, a comparison is also made between estimating the energy used in pool water circulation assuming compliance with UK (PWTAG) guidelines
9
and using the German DIN standard.
13
The DIN standard uses maximum number of bathers per hour (or bather load, intensity), calculated using the instantaneous maximum, 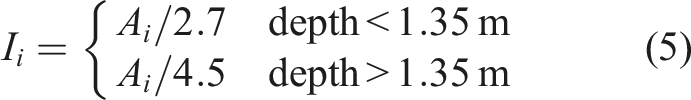
Energy requirements for circulating water
The energy requirement for circulating water is estimated by calculating the annual energy consumption that would be required to sustain the required flow rates calculated in the previous section for 24 h a day throughout the year (slowing of pumps during periods when the pool is closed is not explicitly advocated in the PWTAG guidelines 9 ). This is achieved by making assumptions about the energy required to move each m3 of water (i.e., the electrical power required to circulate each 1 m3/h of flow). Recent Passive House guidelines for the energy-efficient operation of swimming pools 19 suggest that the power requirement for circulation should be no more than 40 W/m3/h, and preferably closer to 25 W/m3/h (i.e., in the range 0.025-0.040 kW/m3/h). However, a recent survey of UK pools based on measured flow rates and the corresponding pump power consumption data showed that only a small proportion of pools were achieving even the least challenging Passive House target of 40 W/m3/h. 11 The flow-weighted average value within the survey of 110 pools was 59.3 W/m3/h with some pools exceeding 120 W/m3/h. The analysis presented here will assume the flow-weighted average of 59.3 W/m3/h. Finally, the financial cost is calculated using the latest annually-averaged data for non-domestic UK energy prices at the time of pool data download (Q4 2023 – Q3 2024), for which the average tariffs for electricity and gas were £0.270 per kWh and £0.058 per kWh respectively. 20 We note that this assumes a fixed rate and does not include the potential variation in energy cost between peak and off-peak times. However, producing a representative national-scale variable tariff was not possible with the data available.
Water use for backwashing filters
Backwashing is the process by which filters are cleaned regularly to remove debris and maintain performance. 16 In most pools the water used for backwashing is also the predominate source of dilution of pool water by incoming mains water. The amount of water used in backwashing can be estimated from the designed rate of circulation of water for the pool plant. Assuming conventional sand (or similar media) filtration, the PWTAG guideline 9 is that the velocity of flow through the media in normal filtration should not exceed 25 m3/h of flow per m2 cross-sectional area of filter (i.e., 25 m/h average velocity). Hence, we calculate the minimum PWTAG-compliant filter area for each pool as the minimum area required to achieve the flow rate through the filter of 25 m3/h of flow per m2.
According to PWTAG guidelines, these types of filters should be backwashed at least once a week, though more frequent backwashing might be necessary if filter differential pressures rise to the point where backwashing is deemed necessary. Most design specifications state a required backwashing velocity of 30–40 m/h in order to achieve effective fluidisation of the bed (e.g., PWTAG 9 ). Here we assume a rate of 35 m/h. We calculate the annual water use for backwashing assuming backwashing is carried out weekly, with a typical backwash duration of 6 min. 18 National average data on water cost are not available, so the cost of the water used is estimated conservatively as £3 per m3 for the import and disposal of water based on metered water imported to the pool system.
We also consider the cost of heating the water from the incoming mains water temperature (∼8–12°C) to the pool water temperature (∼28–32oC) which we approximate as a temperature rise of 18°C. As the volumetric heat capacity of water is 4.2 MJ/K/m3, this heat requirement is 76 MJ/m3 (=0.021 MWh/m3). We use the value of 0.021 MWh/m3, assuming near-100% efficiency, which is appropriate for a modern condensing boiler. However, we note that assuming typical boiler efficiency of 88% for standard boilers and 5% loss of heat from pipework, this figure could be 20% larger (0.025 MWh/m3). Conversely, use of an air to water heat pump, with a coefficient of performance (COP) of five would reduce the energy use for water heating by 80%.
Carbon footprint of swimming pool water treatment
In 2024, the average carbon emissions for electricity and gas were 0.207 and 0.183 kgCO2e per kWh respectively. 21 Similarly, UK carbon emissions associated with water supply averaged 0.153 kgCO2e/m3 and wastewater treatment averaged 0.186 kgCO2e/m3 giving a total carbon footprint of water used by pools of 0.339 kgCO2e/m3. 21 These figures are applied to the calculated water and energy costs to estimate the carbon footprint of swimming pool water treatment and circulation.
Scenario-testing
Current UK guidelines not only provide the basis for ensuring safe and attractive water, but more recently also help encourage a reduction in carbon footprint consistent with maintaining excellent water quality. 11 To further build on this we test three intervention scenarios to demonstrate the potential impacts of changes to policy guidelines on energy usage and associated costs. Anecdotally, the authors are aware that some pools in England have already implemented some of these measures and the point of this paper is not to suggest these as novel ideas. Instead, we present a novel national-scale analysis for assessing the potential savings through adopting such measures nationally.
Reducing pump speed when pool is closed
As discussed by Simmonds et al., 17 over timescales relevant to over-night closure, most pools approximate to behaving as well-mixed bodies of water in which 63% of the water in the pool at the start of a turnover period will pass through the treatment plant by the end of the turnover period. Thus, if filters are effective, then just two turnovers of water during the closed period will remove 86% of the particulate/colloidal material (specifically that material which can be removed by filtration) present in the pool water at the end of an open period. Given that most of the dirt input from bathers will have already been removed during the period when the pool is open, 17 this suggests that more than two turnovers of water would be of very limited benefit in terms of the recovery of pool water quality during the closed period. Indeed, if pumps are slowed to allow just two turnovers when closed, there might be an additional benefit of improved filter removal efficiency as many pools following PWTAG guidelines are likely to be operating with filtration velocities that are relatively high and are therefore compromising filter efficiency. 16
The impact of reducing pump speeds for each pool in the study during times when the pool was closed assumes a reduction in the turnover time to 4 h using variable speed drives to control pump speed. It is further assumed that the reduction in pump speed is proportional to the reduction in flow rate, and that the power consumption by the pump varies with the cube of the pump speed in accordance with the affinity laws for pumps. 12 For example, operating the pumps at 80% of the full speed reduces the power consumption to 80% × 80% × 80% = 51% of that required at full speed. The affinity laws have been shown to give a reasonably accurate prediction of the impact of pump speed on power consumption in the case of swimming pools where the work being done by the pumps is predominantly due to frictional resistance in the system hydraulics. 11
Open and closed times are available for 5441 pools within the database. For each of these pools the estimated annual energy requirement with pump speed setback deployed during the closed period is calculated using an adjusted flow rate corresponding to a 4 h turnover time for the period when the pool is closed. To generalise potential savings to all pools within the dataset, average percentage savings from the 5441 pools with opening times data are applied to all 6433 pools. We note that our assumption of a fixed energy tariff may over-estimate cost savings due to energy saving during off-peak periods when electricity is cheaper. However, this does not affect the quantity of energy or carbon savings.
Reducing pump speed when pool is open
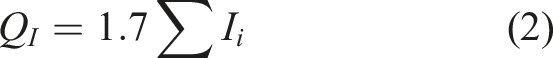
The DIN standard 13 links circulation rate directly to bather frequency (this is termed ‘pollution load’ and assumes bathers are the main source of filterable pollution). Therefore, in principle it should be possible to manage the circulation rate during the open period according to pollution load, provided adequate concentration of disinfectant is being maintained throughout the pool at all times. PWTAG 9 recommend that if the capacity of the pool circulation system is less than that required to achieve the desired turnover time, then the bather number should be limited to ensure that 1.7 m3 of water is treated per bather (once again implying a link between bather frequency and required circulation rate). This offers the opportunity to base circulation rate of pool water on bather frequency.
The impact on energy use of reducing the pump speed during periods of low bathing load is assessed in a similar way to the closed period setbacks. However, few data exist regarding daily variation in bather load in pools. Hsu et al. 22 counted swimmer numbers every 15 min throughout opening hours of a city-centre public pool over 6 days and demonstrated substantial variability in load within and between days. Similarly, Stauder and Rodelsperger 23 demonstrated substantial daily variability in bathing load across a 4-week period for an outdoor pool, ranging from 200 to 11,000 bathers per day. While variations may be exaggerated for an outdoor pool where weather will play a more significant role it is reasonable to assume, based on practical experience, that for most pools, near maximum permissible bathing loads will only occur for relatively short periods. For many pools it is reasonable therefore to assume that bather numbers are less than half the maximum permissible for 75% of the time that the pools are open. Accordingly, we assume a cautious intervention for many pools would be to reduce the circulation rate to 80% of the design maximum for 75% of the open period. This represents a reduction in power consumption to 51% of that at full speed. Similar to closed period setback, the percentage saving from open period setback is calculated for the 5441 pools with known open times and then extrapolated to all pools in the dataset.
Improvement of pump efficiency
A recent survey showed that in the UK the median electrical efficiency of circulating pool water was 59.3 W/m3/h circulation. 11 The Passive House guidelines 19 proposed a target value of 40 W/m3/h for circulation of pool water; a target which is realistically achievable with good pool plant design and operation. If this target were achieved, this would accordingly reduce energy use by 32.5% on average, through pump and pipe network efficiency improvements alone, without considering any reduction in flow rate. Therefore, we apply a hypothetical 32.5% efficiency gain, indicative of pool plant meeting the Passive House performance guidelines, to estimate the potential savings from improvement in efficiency of pumps circulating pool water. However, we recognise that making the retrospective changes necessary to achieve this may not be practically or economically viable.
Results
Energy requirement to circulate water in swimming pools in England
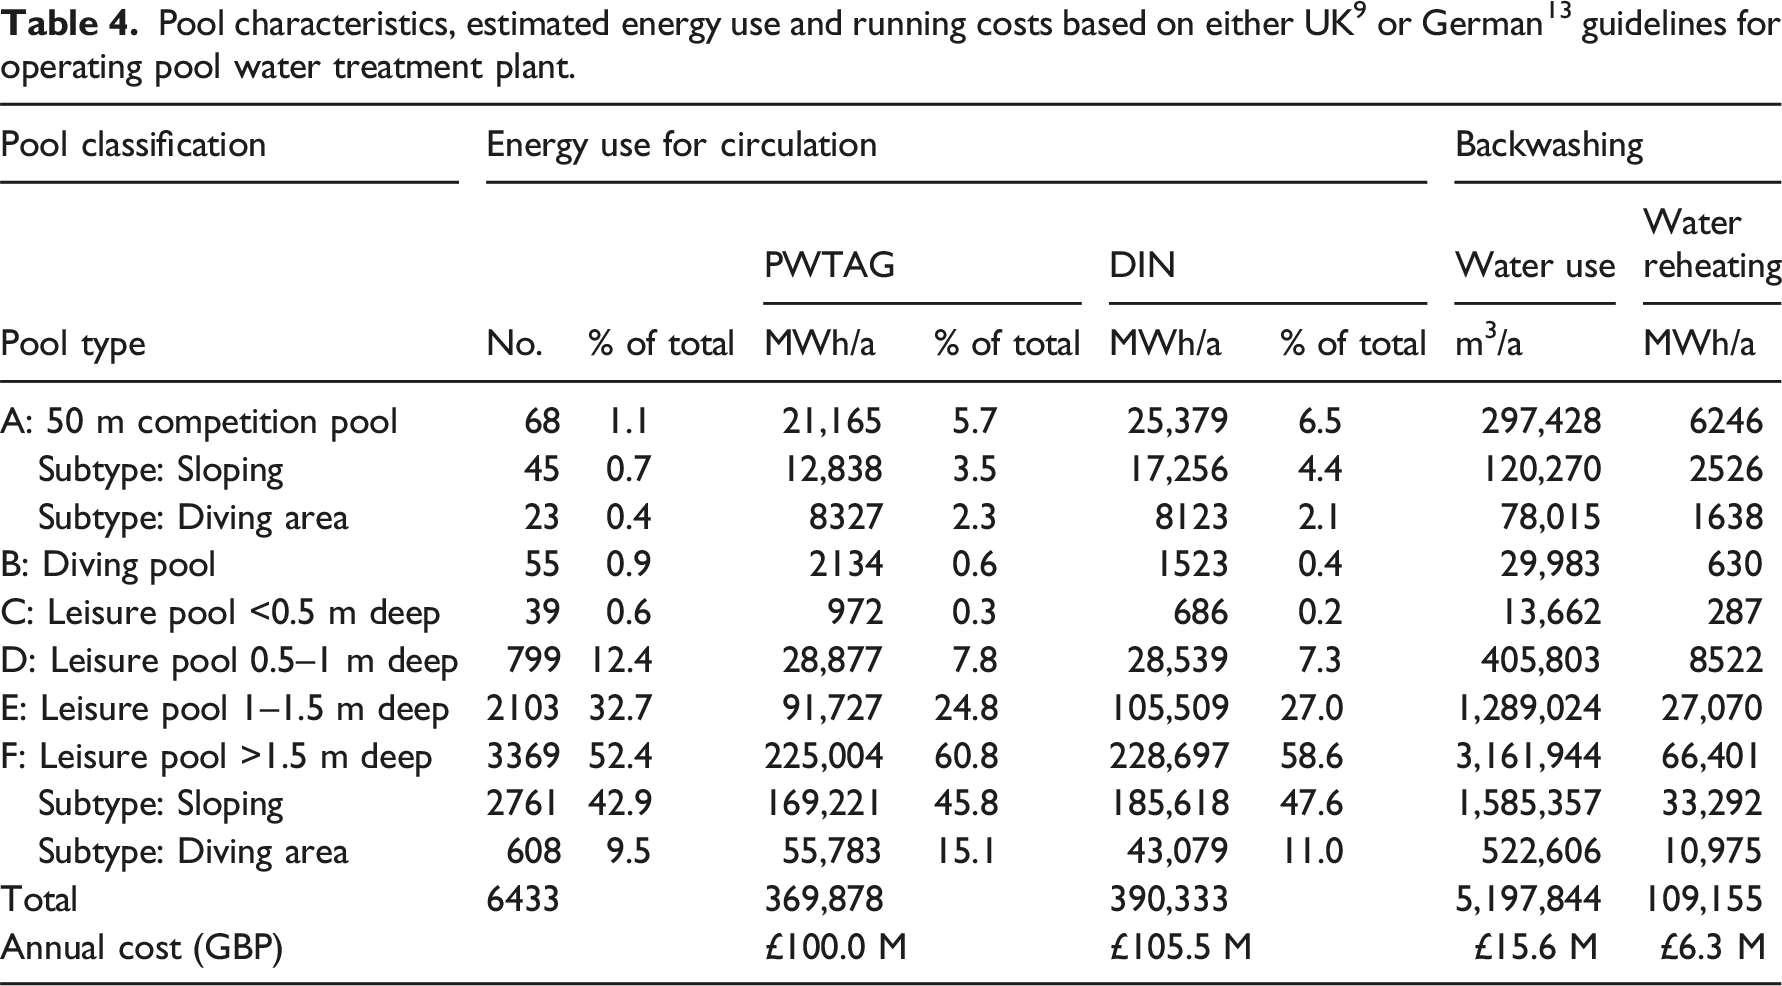
Comparison with DIN guidelines
Using the German DIN guidelines for pool water circulation increases the estimated energy use and cost by 5.5% (Table 4) compared to the estimates based on the UK PWTAG guidelines. This difference relates to the basis of the guidelines. When using the DIN guidelines the recommended circulation rate is based on pool area and hence maximum allowable bather number. When using the PWTAG guidelines circulation rate is based on either pool area (and bather number) albeit with slightly different values, or pool volume through the PWTAG turnover times (Table 3). This results in different requirements for circulation rate, which can vary by as much as two-fold either way (e.g., deep pools operating using PWTAG guidelines using up to twice the flow rate as DIN compliant pools), as indicated by the data shown in Figure 2. The impact of the average pool depth (and pool depth class, see Table 3) on the ratio of the recommended flow rates estimated according to DIN or PWTAG guidelines for leisure pool categories. The black line shows the theoretical relationship for constant-depth pools based on bather load (I) while the grey range illustrates the possible range of 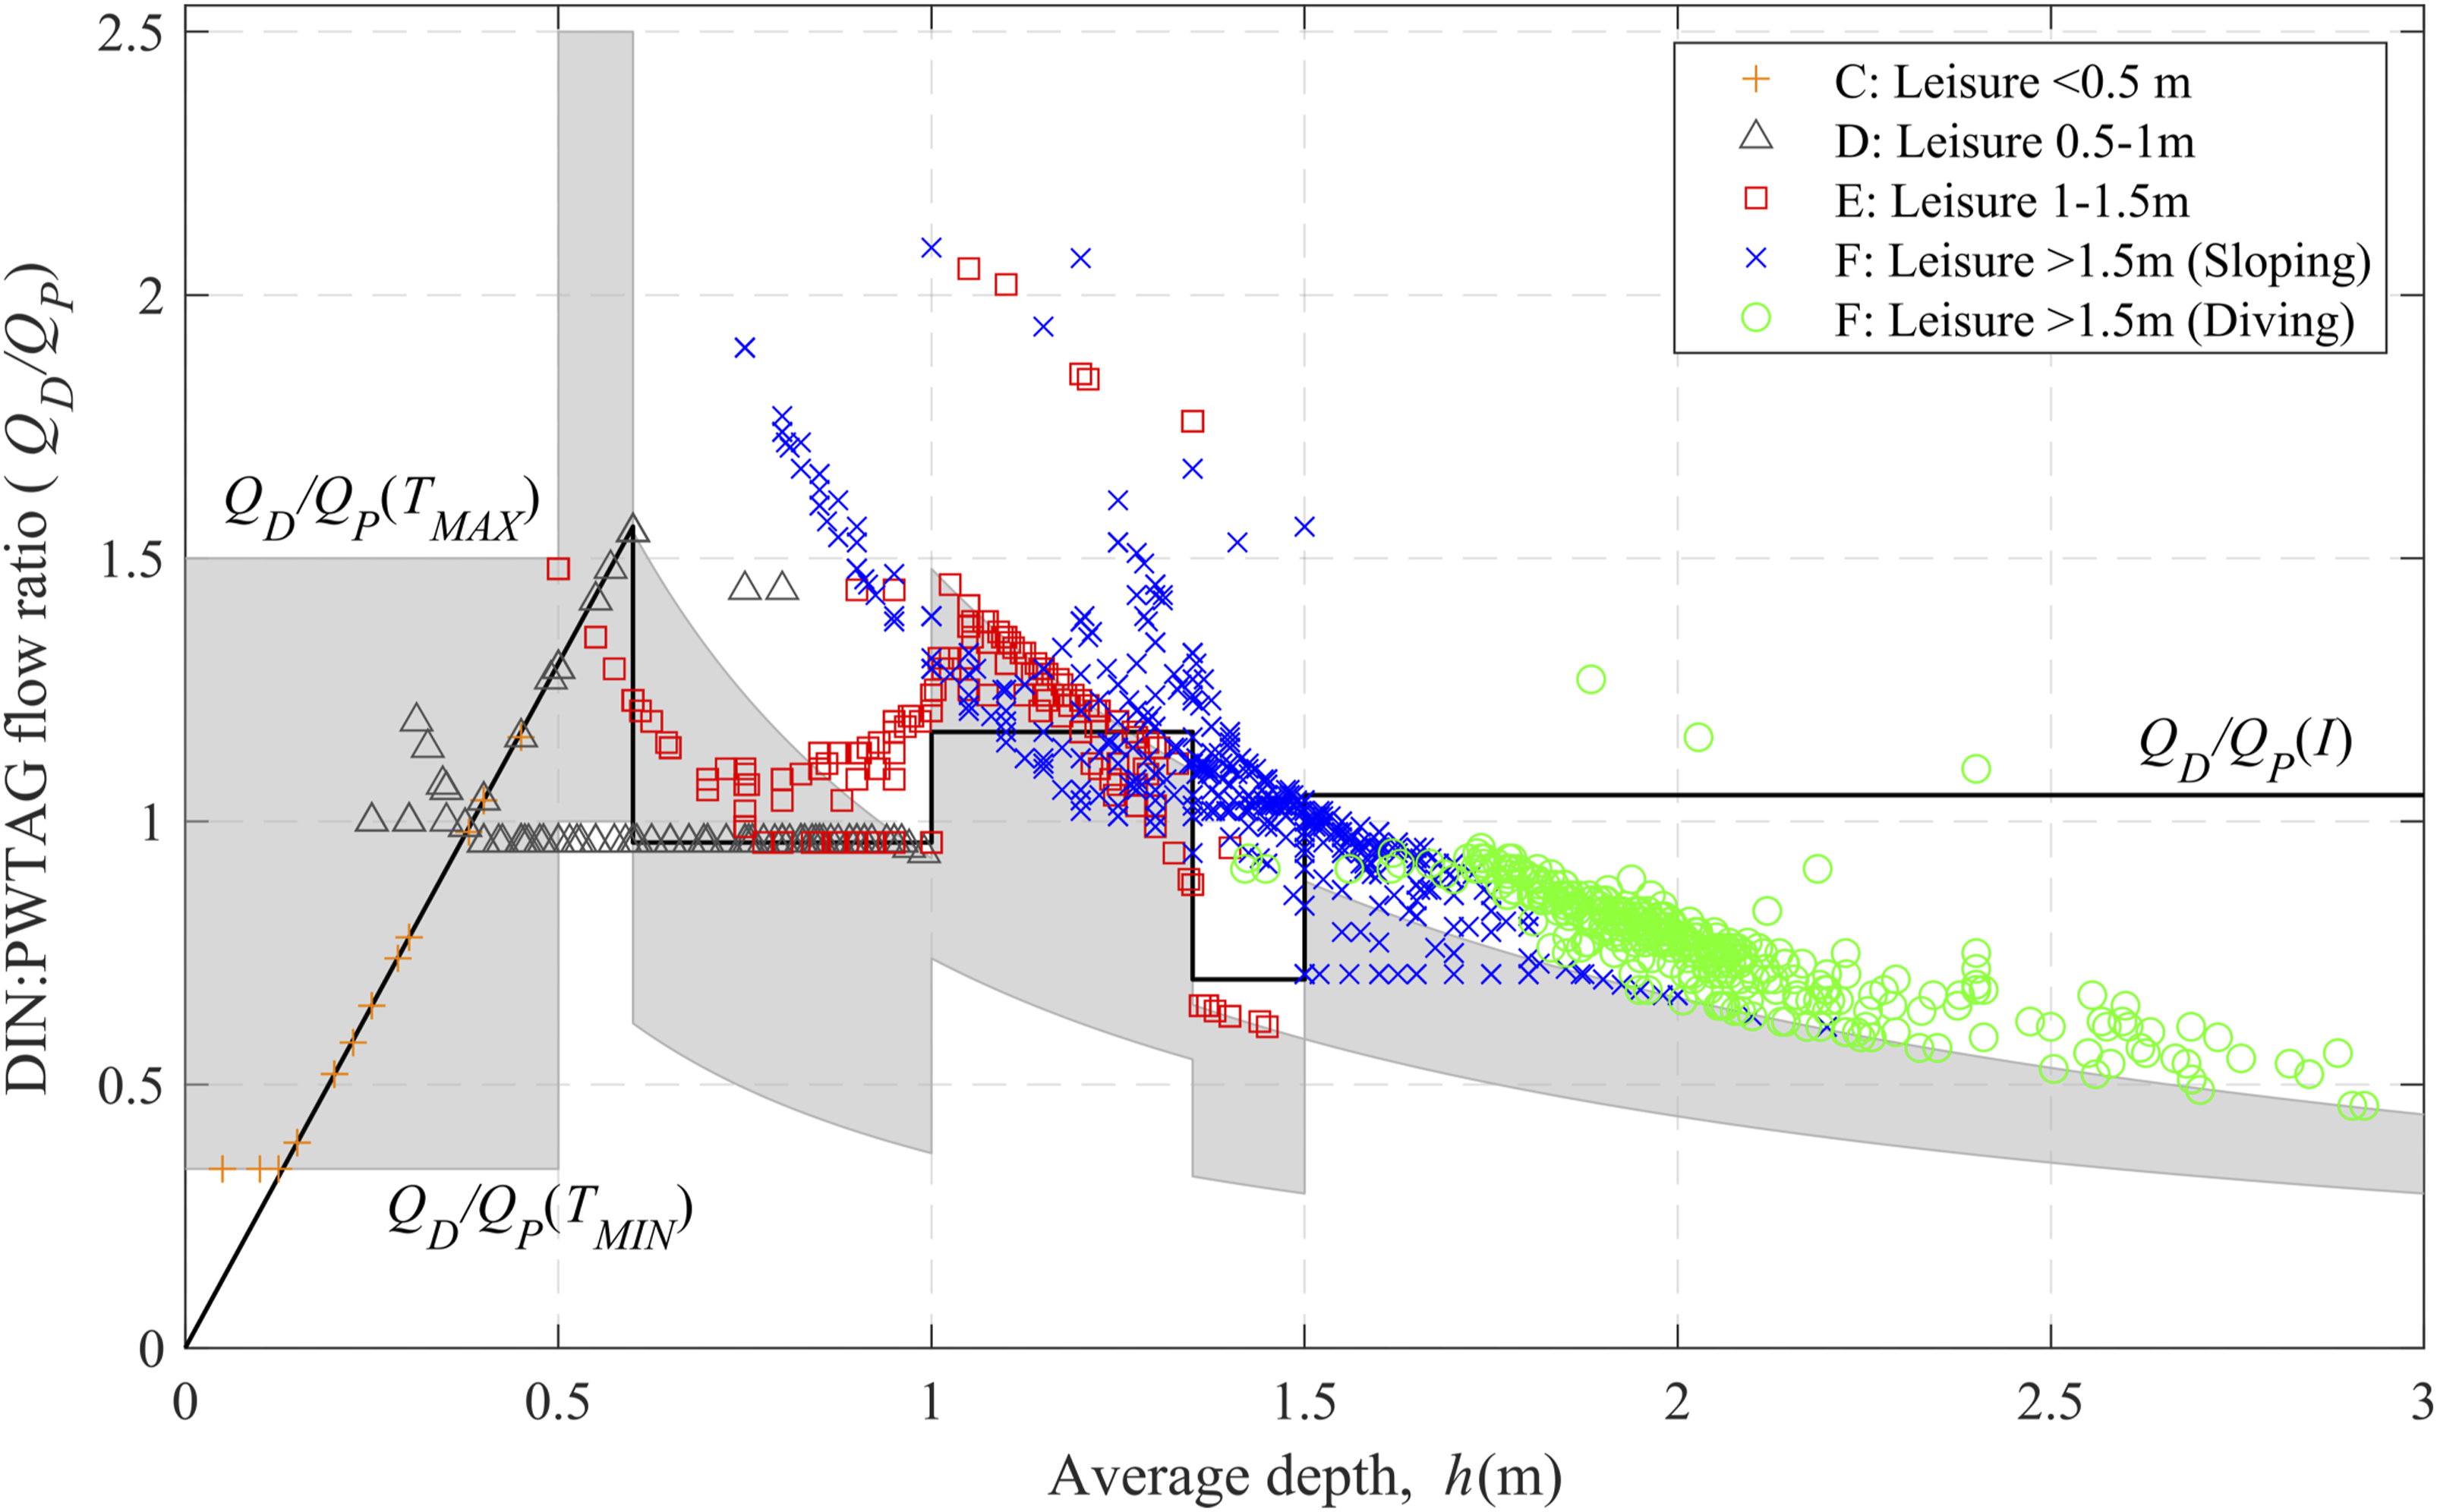
In very shallow pools (<0.5 m depth), the DIN guideline is for a turnover time of 30 min, whereas the corresponding PWTAG guideline for turnover time is 10–45 min. Hence
This inverse relationship breaks down for pools where the bather load based turnover time fell between the PWTAG lower and upper limits for the range of recommended turnover time. In this case, we presumed in our analysis that the flow recommended by PWTAG was based on bathing load,
Importantly, Figure 2 shows the disparity in most pools between the PWTAG and DIN recommended flow rates for a given pool, with DIN tending to recommend faster flow rates for pools less than an average of 1.5 m deep and PWTAG recommending faster flows in pools with greater average depth. Note that this disparity in flow rate was greater than 20% for >40% of pools, which would represent a difference of c.50% in energy use if the pump affinity laws apply to the relation between flow and energy consumed.
Backwash water used
The annual metered water cost (i.e., cost of buying in and of disposal) due to backwashing of pools in the dataset is estimated to be £15.6M (Table 4). The overall cost of backwashing increases to £22.0M annually including the associated £6.3M costs of heating the water. This calculation does not account for any backwashing that might take place more frequently than weekly, nor any additional dumping of water for additional dilution (some pools require additional dilution to keep the total dissolved salts within the acceptable range).
Carbon footprint of energy used for pool water circulation
The total estimated carbon footprint for the swimming pool water circulation for the 6433 pools in our database is 98,400 tCO2e per year. This includes electricity used by pumps for circulation (76,600 tCO2e), gas used for water heating (20,000 tCO2e) and water supply/disposal (1800 tCO2e).
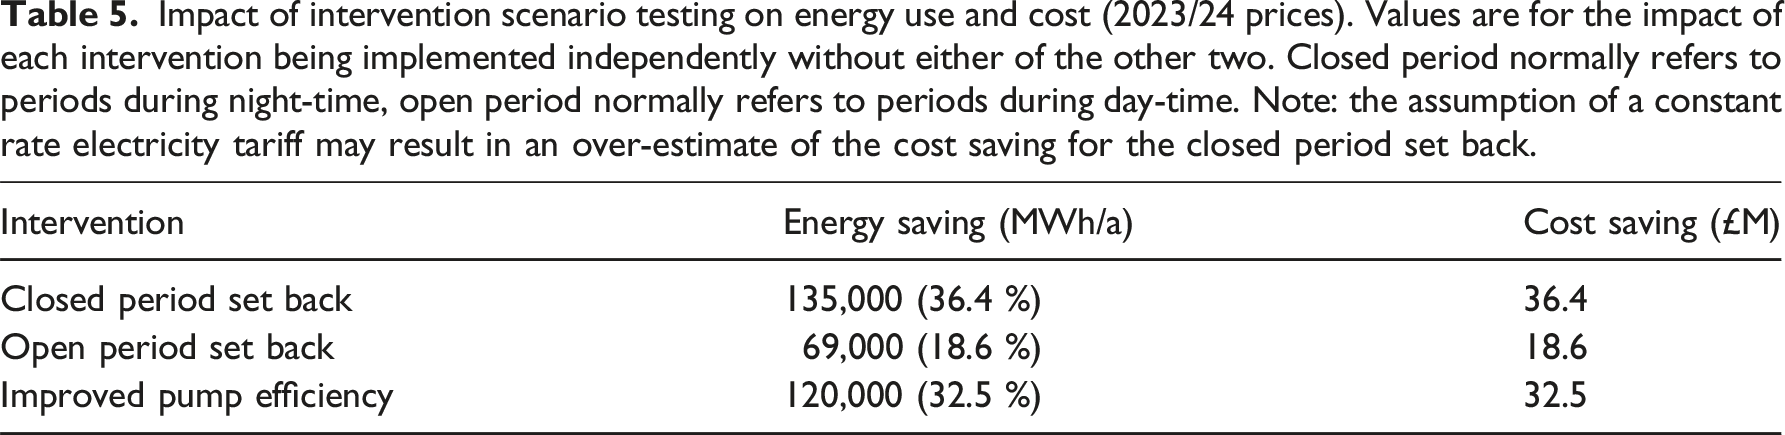
Energy saving policy intervention scenario testing
Impact of intervention scenario testing on energy use and cost (2023/24 prices). Values are for the impact of each intervention being implemented independently without either of the other two. Closed period normally refers to periods during night-time, open period normally refers to periods during day-time. Note: the assumption of a constant rate electricity tariff may result in an over-estimate of the cost saving for the closed period set back.
Discussion
The cost of swimming pool circulation
This paper uses the limited information available to quantify the national-scale industry-wide swimming pool energy use and costs that are associated with operating the circulation/filtration system of English non-domestic pools in accordance with current industry guidelines. This includes circulating water for treatment purposes, using water to backwash filters and heating the replacement water. Based on reasonable and conservative estimates, these combined costs amount to c. £121.9M for the 6433 pools used in this study. Many pools are operated by charitable trusts or not-for-profit organisations and run on tight budgets, and the recent surge in energy prices is likely to increase costs further and will likely lead to closure of pools with a predicted decrease in the number of UK facilities of more than 40% by the end of the decade. 10 Swimming is an accessible and low-impact exercise activity which can offer specific opportunities and advantages for a wide range of users in treating and preventing health issues. 24 Consequently, pool closure has a substantial social and economic cost. Reducing pool closure requires interventions that save money and energy, without compromising health and safety.
The impact of policy interventions: The case for improved operational guidance
Here, we examine three interventions based on current national guidelines, which have potential to reduce energy use and costs related to the circulation of pool water for treatment whilst also not compromising water quality. Two strategies are considered for reducing the energy consumed in circulating water: (i) reduction in the amount of water circulated, and (ii) reduction in the energy required to circulate each unit volume of water. Examples of reduction in the quantity of water being circulated include setback of pump speed when the pool is closed or open. This relies on simply reducing pump speeds whilst ensuring no deterioration in water quality and the maintenance of adequate disinfection throughout the pool. Neither of these are currently explicitly advocated within existing guidelines to which operators are expected to adhere, but they are alluded to as possible options within the guidelines used in this study. Current guidelines for water circulation (whether PWTAG or DIN) aim to ensure safe and attractive water in the worst-case scenarios of pools operating at maximum bathing loads for prolonged periods, and with relatively inefficient or ineffective pool plant and design (e.g., in terms of filtration efficiency and pool water mixing). For example, the PWTAG guidelines for circulation have been shown to maintain pool water turbidity within the acceptable upper limit of 0.5 NTU even in the case of relatively dirty bathers for example bathers using the pool 24 h a day at the maximum instantaneous bathing load and with filters having only 70% removal efficiency for turbidity. 17 This suggests there is scope for reducing circulation rates for pools where the performance of the filters and the pool hydraulics and the cleanliness of bathers is above average, or where pools have only a low bathing load, without negatively affecting the water quality. Therefore, we recommend that advisory bodies consider judicious relaxation of circulation guidelines in cases where pool operators are able to provide an evidence-based approach, through monitoring and assessment of system performance, that would allow pools with effective filters and circulation systems to substantially reduce costs whilst maintaining excellent water quality at all times. This would be consistent with Passive House advice 19 to consider reduction in speed of water circulation pumps when this can be done without compromising water quality and safety.
We note that there were differences between the PWTAG and DIN guidelines in recommended flows, sometimes by a factor of over two-fold, though both standards are based on expectations of safe and attractive water. This is perhaps indicative that the current guidelines are overcautious with respect to required flow rates. The comparison between the PWTAG and DIN guidelines for circulation rate showed that there could be large differences in recommendations for pools in our dataset that have a maximum depth >1 m (pool classes E and F in Table 3), which represent 85% of the dataset. Within these classifications of pool there was a tendency for the PWTAG guidelines to give a higher flow requirement than the area-based DIN guideline when the pools had an average depth >1.5 m and vice versa for shallower pools. Both sets of guidelines were adopted in the belief that they provide for safe and attractive water in pools that are well run. Our analysis shows that adherence to DIN guidelines increases circulation costs by 5.5%, but that if each pool adopted the lower of the PWTAG and DIN recommended circulation rates there would have been an overall 6.1% reduction in the energy used to circulate water compared to using the PWTAG guidelines exclusively.
The third intervention, improving pump efficiency to meet Passive House energy targets, relates to the physical pool infrastructure. This involves a combination of reducing the hydraulic power required to achieve a given circulation rate by reducing the hydraulic head requirement, and increasing the efficiency with which pumps convert electrical power into hydraulic power. 11 However, in pool applications where hydraulic heads tend to be low, these two approaches can be in conflict. Reducing the hydraulic head at the pump discharge will normally reduce operating efficiency for pumps being used in swimming pool applications. 11 Therefore, it is recognised that achieving Passive House standards across the industry will take a long time and substantial cost to implement, and there will be inherent defects in the design of certain existing pools that will make it unfeasible for targets in Passive House guidelines to be achieved in practice. Therefore, this intervention should be assessed at an individual pool level with emphasis on a holistic approach that considers the potentially negative interactions between hydraulic head requirement and pump efficiency. 11
The three intervention scenarios illustrate a methodology to assess the national-scale impact of changes to operational guidelines and pool infrastructure on the savings of energy and water used for circulating pool water for treatment. They also give a sense of the magnitude of these potential savings. In the illustrative scenarios above, the overall energy costs of circulating water alone could be reduced by 36.4% by setback of pump speed during the closed period, plus an additional 18.6% of the total cost by judiciously slowing the pumps during the open period when the pool is open but not heavily used. This gives a total combined saving of 55% (45% usage) compared with the consumption if fully compliant with current guidelines. This saving could be implemented very rapidly, as it only requires adjustment of pool operating procedures and the fitting of variable speed drives where necessary.
Variable speed drives are already fitted in some pools, however until now there has been no clear guidance on how this technology should be used in relation to water circulation. 9 The confirmation of the rationale for the recommended water treatment guideline of 1.7 m3 per bather 17 together with the estimated savings reported here resulting from the use of this guideline provide the basis for updating current national guidelines to enable savings to be achieved thereby saving money and reducing carbon footprint whilst maintaining water quality and bather safety in swimming pools. Combining use of variable speed drives with improved pump efficiency, to meet Passive House targets, the overall savings would increase up to 70%, compared to the baseline case used here.
In addition to the cost savings of the intervention scenarios, there is also an environmental imperative to reduce the carbon cost of swimming pool circulation. Our results show that the carbon emissions related to swimming pool circulation for water treatment in the pools analysed here (98 400 tCO2e) are equivalent to 3.9% of the total UK annual water supply/treatment emissions 25 and 0.02% of the UK’s total annual greenhouse emissions. 26
Limitations of the study and relative significance of the results
The case study interventions demonstrate how relatively small changes in pool operation guidelines can have a major impact on energy usage and costs and illustrate how these impacts can be assessed in terms of balancing risk and reward. There are many sources of uncertainty in the data, including for example, the individual pool geometry and infrastructure, utility tariffs, bather numbers and pool opening times. Furthermore, existing implementation (anecdotal evidence) of the measures investigated at specific sites will reduce the total achievable savings. Nevertheless, use of conservative parameter values means the results are likely underestimates rather than overestimates. Improving monitoring and data availability regarding pool characteristics, hydraulics and bather load would allow a more accurate estimate to be made for a particular pool.
Data from two example pools demonstrating the magnitude of savings achieved from open period and closed period set back.
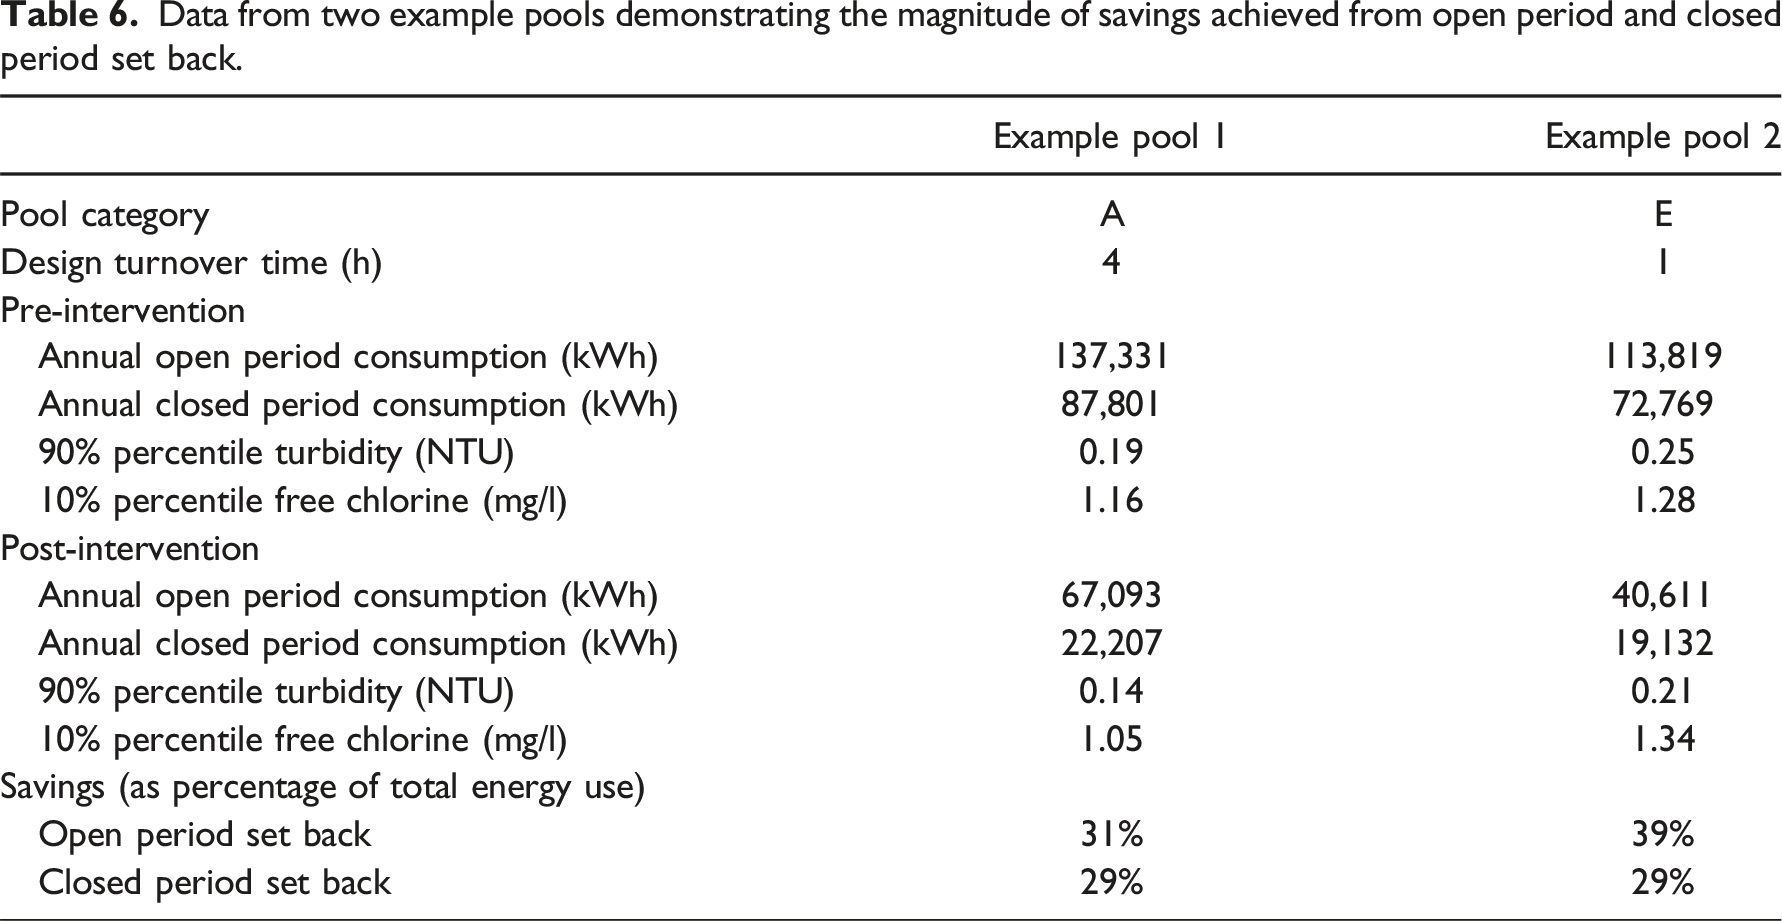
Finally, water circulation costs are only one aspect of energy use within swimming pool facilities. Some studies have suggested pumping costs may be approximately 9% of energy consumption with HVAC and pool water heating the other substantial components.14,27,28 Assuming this to be correct, our results suggest that the first two interventions (set-back of pump speed) provide low-cost, readily achievable energy use reductions of up to 5% of the total operational energy use, which is comparable with the proposed savings of ∼7–20% from HVAC and pool heating interventions. 29
Conclusion
Swimming pools represent critical public health infrastructure but are energy intensive due to the requirement for heating, ventilation and water treatment. In this study we have used a national-scale methodology to quantify energy and water use in circulation for water treatment for a database of 6433 non-domestic swimming pools across England. Our results show that the total annual energy use for water circulation is 369,000 MWh at a cost of £100M. A further cost of £22.0M is associated with water supply, heating and disposal associated with filter backwashing. The total carbon footprint of water circulation for treatment in these swimming pools is 98,400 tCO2e per year.
We have shown that adjusting operational guidelines to permit reducing circulation during pool closure and periods of light use could reduce energy use by 55%. Furthermore, improving pool infrastructure to reduce the energy required in pumping to meet Passive House guidelines could reduce energy use by 32.5%. Together, these interventions could reduce total energy used for water circulation and the associated carbon footprint by up to 70% without compromising water quality and bather safety.
Footnotes
Author contributions
Declaration of conflicting interest
The author(s) declared the following potential conflicts of interest with respect to the research, authorship, and/or publication of this article: LS and MW are both employed by PoolSentry Ltd. All other authors have no competing interests.
Funding
The author(s) received no financial support for the research, authorship, and/or publication of this article.
Data Availability Statement
Swimming pool data were obtained from the open access Sport England Active Places Data © Sport England.
Appendix
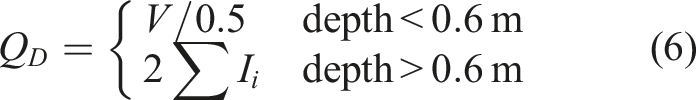
Using equations (1) to (6), it is possible to derive theoretical relationships between
For example, for depths below 0.5 m taking
Alternatively, taking
Finally, taking
For each distinct depth range (defined by the PWTAG and DIN depth intervals), the possible relationships between Ratios between the DIN discharge (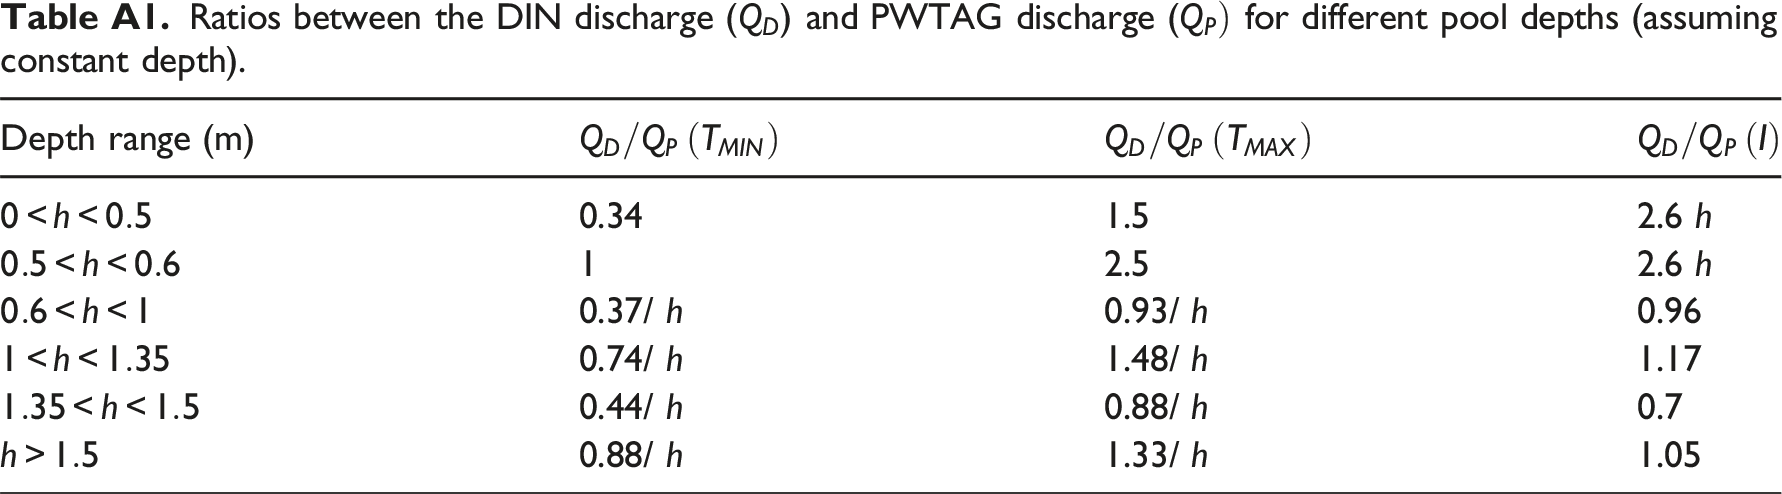
Depth range (m)
0.34
1.5
2.6 h
1
2.5
2.6 h
0.37/ h
0.93/ h
0.96
0.74/ h
1.48/ h
1.17
0.44/ h
0.88/ h
0.7
0.88/ h
1.33/ h
1.05