
Abstract
Until recently, reducing the energy required to service a building (the operational energy) was the main aim of controlling carbon emissions from the built environment. It is now recognised that the energy required to make a building (the embodied energy) also has a crucial role in creating a net zero carbon future. The methodologies for quantifying embodied carbon are less developed than those for operational carbon, and more research is required to refine the embodied carbon metrics used when a building’s whole-life carbon emissions are calculated in a Life Cycle Assessment (LCA). One such metric is the Environmental Product Declaration (EPD), a document which can be used in different countries to quantify a product's environmental performance. EPDs are crucial data for conducting an LCA study of a building. However, despite recent efforts to standardise them, there are still inconsistencies between EPDs produced by different countries or manufacturers, even for materials with similar thermal and physical properties. This study considered some of the reasons for variations in EPDs for one product type, expanded polystyrene insulation (EPS). Factors such as (i) the LCA databases and software generators used for the EPDs, (ii) material mixes and manufacturing methods, (iii) country energy production mixes, and (iv) transportation distance from material source to the factory were considered in the analysis. As a case study, this paper examined the effects of selecting different EPDs for expanded polystyrene insulation on the final LCA results from the retrofit of a mid-rise residential building in Turkiye. Differences in EPDs demonstrated a fourfold difference between the highest and lowest upfront carbon impact results of building retrofit. This size of discrepancy indicates the need to choose the most appropriate EPD for a building/location when performing an LCA.
Practical Applications
Selecting an EPD when conducting an LCA for a new building or retrofit is generally left to the assessor’s judgment and knowledge, which varies greatly depending on the assessor’s background, especially in the construction sector. This study suggests an informed decision-making method over an example of EPS insulation material when the EPD options were none or limited to building locations like Turkiye.
Keywords
Introduction
Current trends
Historically, and driven by the high energy demand of buildings, efforts to measure carbon and energy use in buildings have primarily focused on operational carbon (OC) emissions. Accordingly, the focus has been on improving the building fabric and decreasing operational energy consumption. Two key strategies to achieve this are to lower the external envelope’s thermal transmittance (U-value) and to improve airtightness, particularly in colder climates. This can be accomplished by following strict thermal standards such as the Passivhaus Standard.1,2 While significant reductions in operational energy demand have been achieved using these methods, new approaches, like the Net Zero Building (NZEB) concept, take reducing operational energy demand to the next level by introducing zero or energy-positive buildings.
Recent research shows that, with the latest developments in reducing operational energy demand, the most significant contributor to the Life Cycle Impact (LCI) of a building can be the materials used to construct the building.3,4 Therefore, there has been a shift in research focus toward the embodied carbon (EC) impacts of materials. EC impacts tend to be higher in low or zero-energy buildings than in traditional construction. This is due to the high material usage required to achieve low U-values and better airtightness in the building fabric to reduce energy demand during the operational stage. This highlights the need for the building sector to take more significant steps to reduce embodied impacts by selecting low-impact construction materials.
The building sector is a critical player in global efforts to address climate change, but some countries, like Turkiye, are lagging behind in this regard. While Turkiye has introduced regulations and guidelines, such as TS:825: Regulation for Insulation in Buildings 5 and Energy Performance Certificates (EPCs) 6 for both new and existing buildings, these measures have not been enough to drive significant progress. Although Energy Performance Certificates (EPC) have led to some improvements in the energy efficiency of existing buildings through external wall insulation, there has been little progress in retrofit scenarios. The current EPC system only requires new buildings to achieve at least Band C, while existing buildings need only obtain the certificate without any further requirements. 7 Furthermore, the certification approach is based on the mechanical and electrical systems selected for the building rather than on energy calculations or kWh energy demands.
While there have been some efforts to lowerZ operational energy demand, there are currently no regulatory requirements relating to embodied carbon emissions from building materials and components. This lack of focus on EC regulations makes it challenging to conduct a reliable life cycle assessment (LCA) of a retrofit building, as there is often limited information available on the embodied carbon data of materials. As a recent signatory to the Paris Agreement, 8 Turkiye needs to focus more on its building sector, which is responsible for 50% of the country’s energy demands. 9 Consequently, this study used the case study of retrofitting a mid-rise residential building in Turkiye to investigate the deviations in LCA results that occur when no Environmental Product Declarations (EPDs– will be explained in the next section in detail) are available for the case study location to calculate the carbon emissions of the materials in order to set an example regarding the issues in LCA results in the countries with similar limitations. EPDs are reports that comply with standards such as EN15804:2012 and/or ISO14025. They provide information about a product’s environmental impact across various categories, including Global Warming Potential (GWP), Ozone Depletion Potential (ODP), Acidification Potential (AP) of land and water, Eutrophication Potential (EP), which is the potential to cause over-fertilisation of water and soil, and the Photochemical Ozone Creation Potential (POCP). Each EPD is valid for a limited time and must be updated every 5 years to reflect changes in manufacturing methods and raw material source changes. EPDs can be accessed through basic internet searches, databases, and web tools.
Life cycle assessment and environmental product declarations
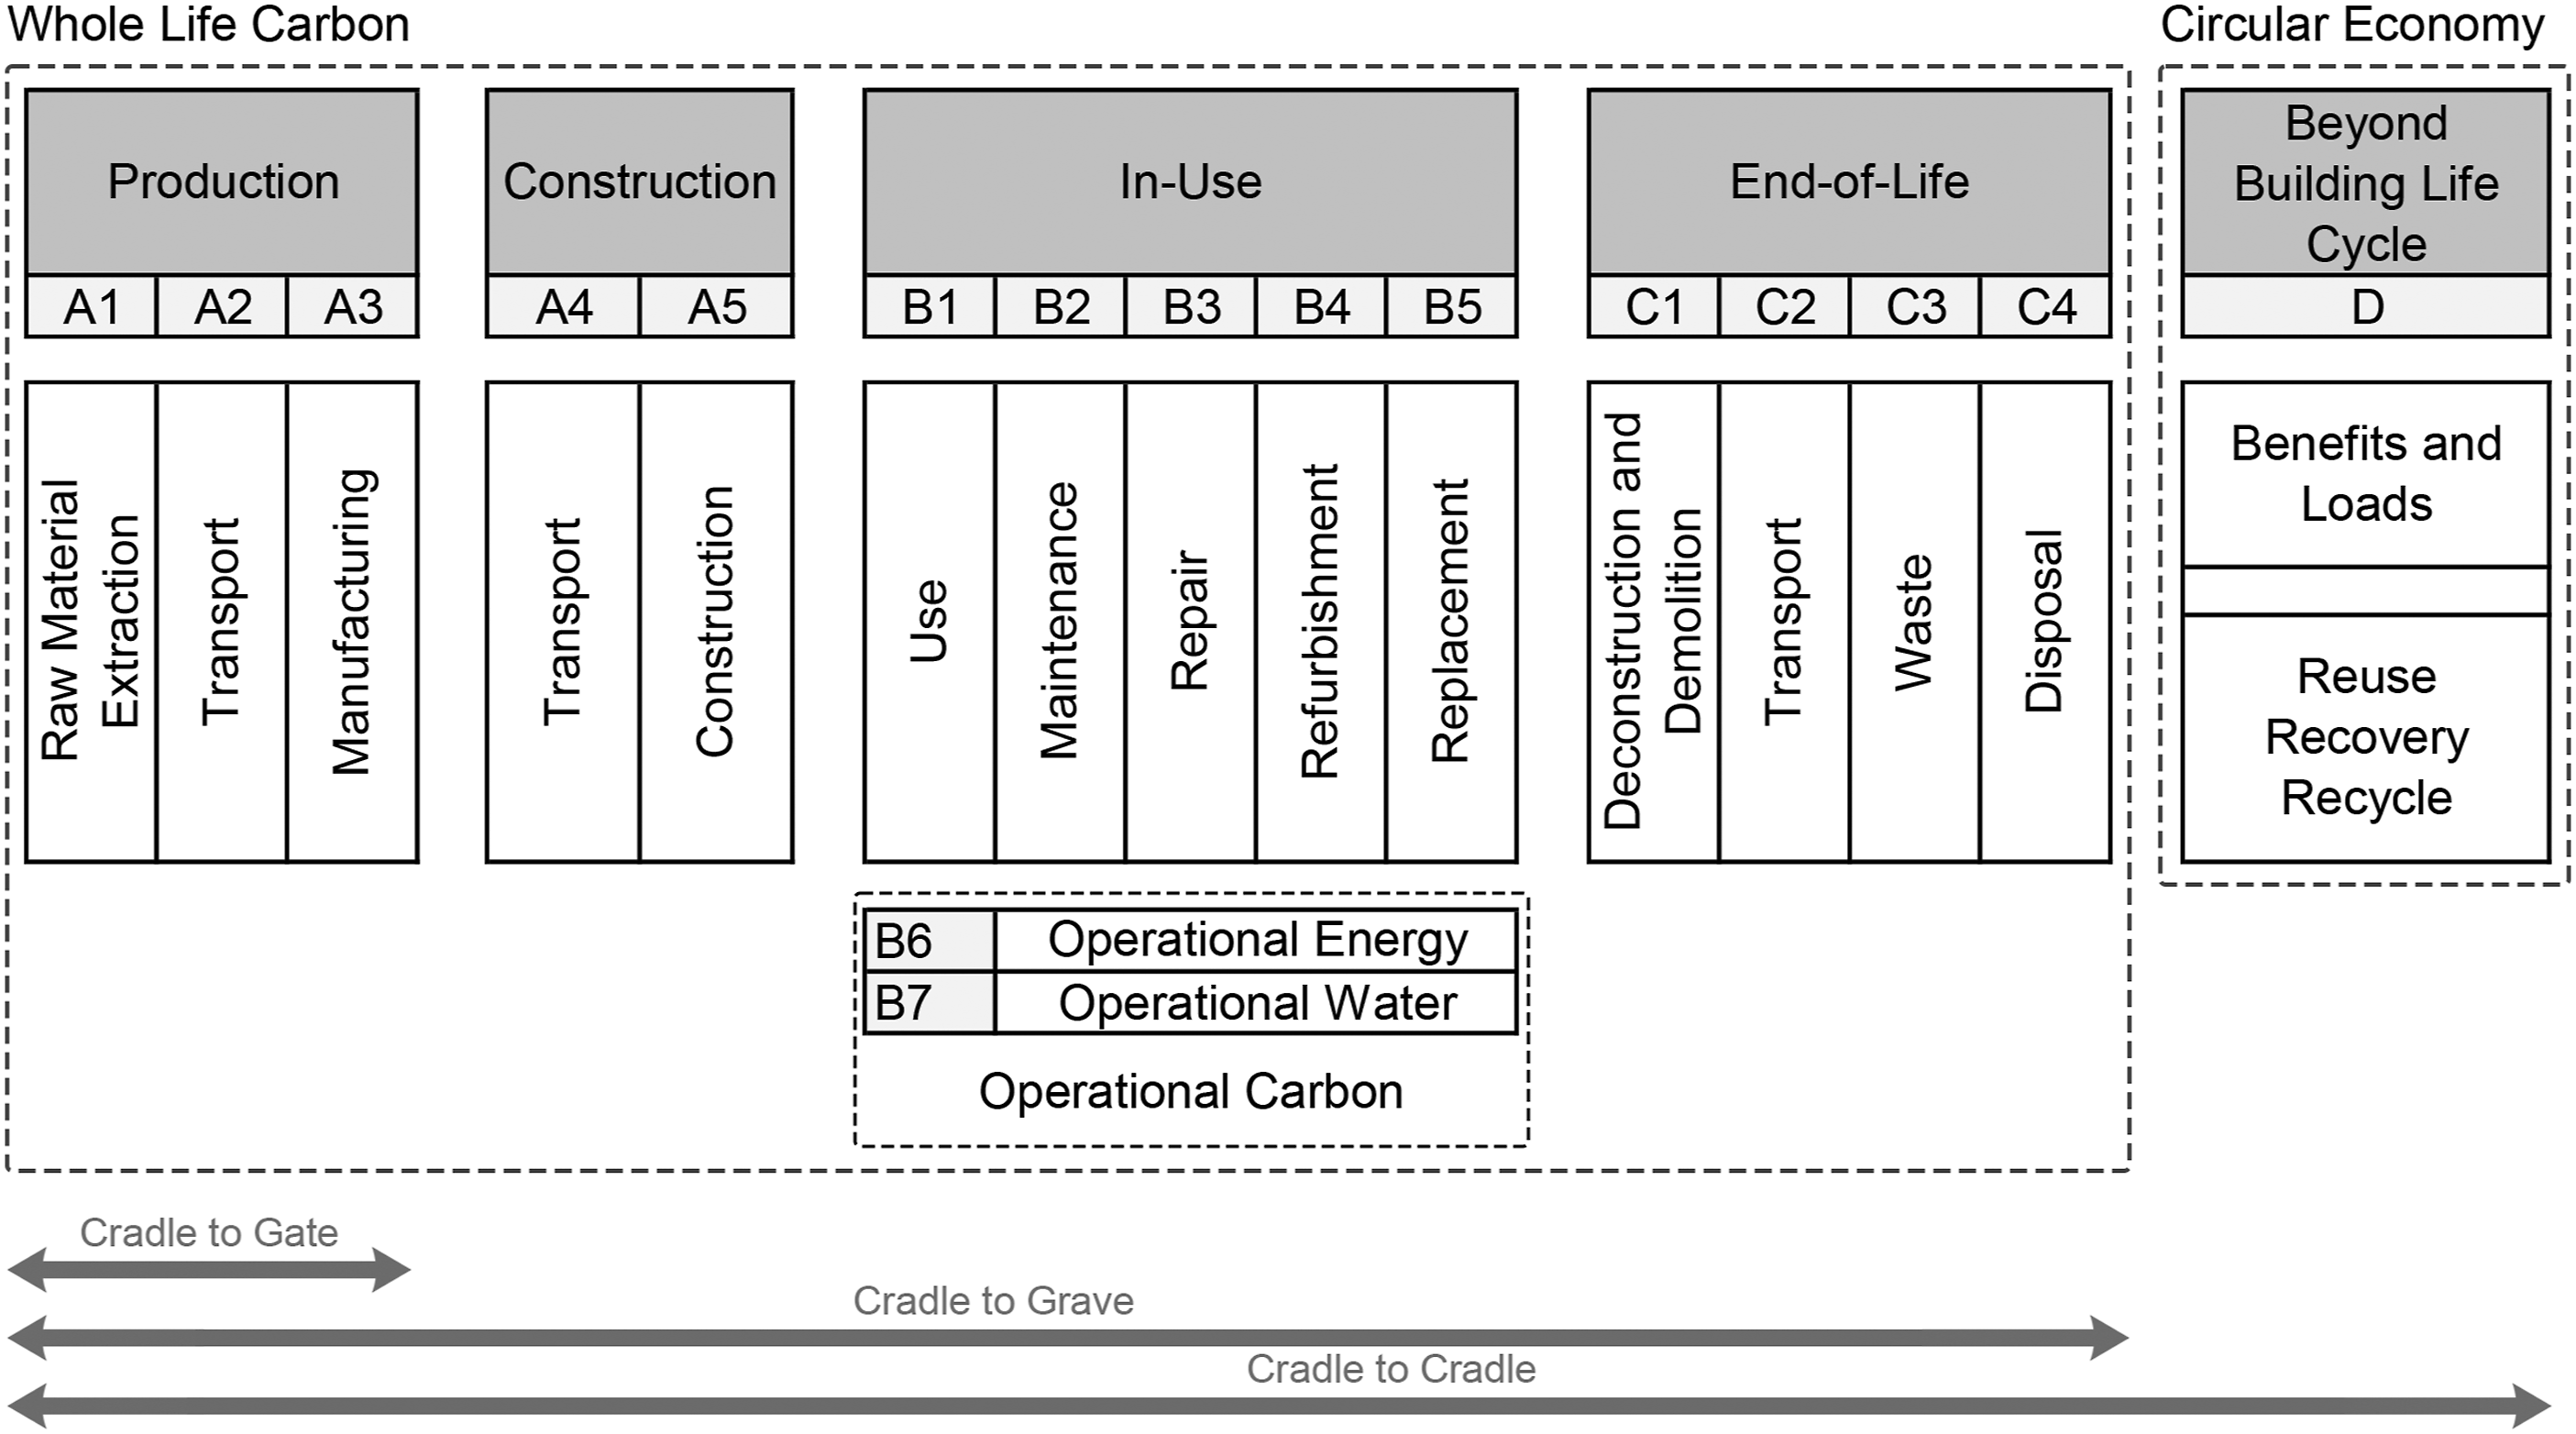
The embodied carbon emissions of a building are typically calculated using an LCA study. An LCA consists of four modules, as illustrated in Figure 1:
10
• Module A represents carbon impacts from material production (A1 to A3) and construction (A4 to A5). • Module B covers impacts from the building's in-use stage (B1 to B5), such as material replacement and maintenance, and operational energy and water demand (B6 to B7). • Module C deals with the carbon impacts of a material's end-of-life (C1 to C4). • Module D covers carbon emissions beyond the material end-of-life, such as reuse and recycling. LCA stages based on EN 15978:2011.
To conduct an LCA for a building, Environmental Product Declarations (EPDs) can provide useful carbon impact figures for each module. Although EPDs have made the LCA process more manageable, there are still issues regarding their comparability and consistency. EPDs are based on Product Category Rules (PCRs) under the EN15804 standard, and provide step-by-step LCA calculation methodology for a product by defining the scope of the calculation, functional units, and possible end-of-life scenarios. Any system operator can develop their own PCRs, which can result in dissimilar rules in LCA methodologies and different PCRs for products in the same category.11,12 Despite efforts to harmonise and standardise PCRs under EN15804, success has been limited.13–16 Furthermore, declared functional units in EPDs are not standardised for all materials or even for the same product category. Functional unit represents the per unit carbon results given, such as kgCO2e per m2 of an insulation panel, per m³, or kg of an insulation material, therefore variation of the units hinders comparability of EPDs. To address these issues, more work is needed to harmonise and standardise PCRs under EN15804. Additionally, there needs to be more standardisation of declared functional units to improve comparability across EPDs.17,18
Another issue with current EPDs and databases is that they do not provide detailed information about particular product features necessary for dynamic simulation tools and LCA analysis, such as reflectance, vapour diffusion resistance factor, specific heat capacity, and fire resistance. These features are also important in passive energy reduction strategies. For example, the reflectance of an exterior wall is important for the wall's solar absorptance and subsequent operational energy savings. High reflectance surfaces can reduce cooling load by up to 80% depending on the prevailing climate. 19 Typically, EPDs only provide information on density and thermal conductivity and, as a result, it is not always possible to use the exact product or material in energy simulations and LCA studies of building projects.
Although the Global Warming Potential of materials often receives the most attention in EPDs, because of the explicit link to climate change, other EPD environmental impact categories can play significant roles in an LCA depending upon the material. For example, while GWP can have up to a 73% share in cement's total environmental impact, Abiotic Depletion Potential (ADP), which is the depletion of non-living natural resources from the earth, can be up to 92% of the impacts of glass wool insulation. 20 This means that GWP should not be the only focus when ADP, Ozone Depletion Potential (ODP), Acidification Potential (AP), Eutrophication Potential (EP), and Formation potential of Tropospheric Ozone Photochemical Oxidants (POCP) can have more severe climate impacts, depending upon the material.21,22
Finally, selecting an EPD can be difficult when a specific product’s EPD or a country average’s embodied carbon figure is unavailable for an LCA. This is particularly problematic for countries like Turkiye, which have limited insulation material options. While selecting an EPD or an average figure for construction materials is necessary for completing an LCA, it can also compromise the reliability and accuracy of the results due to data variations. These issues have implications for the effectiveness of measurements taken to address the climate emergency.
Insulation materials and EPDs
Building fabric insulation is an effective way to improve energy efficiency in new and renovated buildings. However, a trade-off exists between reducing operational energy demand and increasing embodied impacts. Studies by Rosello-Batle et al. 23 and Stephan 24 indicate that the lower the heating demand in retrofitted buildings, the higher the embodied impact.
As insulation materials make up a significant proportion of a building’s embodied impact, they require more attention. Previous studies have typically focused on comparing different insulation materials rather than assessing differences between the declared LCA or embodied carbon figures for a single type of insulation material. Hill et al. 15 compared embodied energy and carbon figures for 1 kg of glass wool, mineral wool, XPS, EPS, polyurethane foam, foam glass, and cellulose, while Grazieschi et al. 25 analysed a more comprehensive range of insulation types and compared embodied energy and carbon figures against density and functional units. The latter study found that density and functional unit comparisons showed consistent data trends and variations.
Environmental Product Declarations for insulation materials can vary due to factors such as the pattern of insulation, country-specific energy mixes (fossil fuels/renewables) during manufacturing, material mixes (including the percentage of raw and recycled content), and transportation distance from the source to the factory. These variations can occur between the same insulation material produced at different factories. Therefore, this study aimed to examine the reasons for EPD variations in one material, expanded polystyrene insulation materials, specifically concerning (i) LCA databases and software tools used to generate the EPDs, (ii) material mixes and manufacturing methods, (iii) country energy mixes, (iv) transportation distance from material source to the factory, and (v) the impact of selecting different EPDs on the LCA results for a retrofitted mid-rise residential building in Turkiye using the LCA software One Click LCA web tool.
Methodology
EPD review and selection criteria
Insulation materials play a major role in many retrofit projects, and studying the impact of common insulation materials is important when reviewing EPDs. After insulating new buildings became legislation in Turkiye 5 in 2008, extruded polystyrene (XPS)/sytropor, EPS, and Rockwool were the most popular insulation products and were incorporated into several building energy and cost analyses in Turkiye.26–28 In practice, the XPS and EPS insulations are preferred to other options due to their availability and low cost. Therefore, EPS was selected for this EPD study.
This study aimed to highlight the issues related to material selection in LCA tools. The software One Click LCA was chosen for the study because it is a leading LCA and EPD software and contains the world’s largest construction LCA database. Consequently, the EPD scanning in this research was limited to the materials available in the One Click LCA web tool as of April 2022. However, One Click LCA has a variety of EPD databases worldwide, including EPD International, INIES, Baubook, and EPDItaly. The scope of the environmental impact of the insulation materials examined in this paper was limited to the manufacturing phase [A1-3] – see Figure 1. Unlike previous studies that focused solely on Global Warming Potential (GWP) and Primary Energy Demand (PER),15,25,29 other environmental impact categories were also included in this study.
At the time of the study, 380 EPDs for EPS insulation were available in One Click LCA globally to be potentially selected for analysis. This vast number of EPDs would not be manageable, and so an elimination process was initiated, with the knowledge that Turkiye was the case study country.
In the first stage, some EPDs were eliminated according to their geographical location. EPDs originating from outside Europe were excluded due to the case study’s location and their functionality. The second elimination criterion was the planned use of materials, and since the retrofit scope was to insulate just the external façade of the case study building, only products suitable for wall insulation were selected. These criteria narrowed the dataset for the analysis from 380 to 230 EPDs.
Then, the EPDs were sorted according to the parameters that define the insulation materials' functionality in building energy performance, which were the thermal conductivity and density values that were available in the EPD databases. Thermal conductivity defines the rate at which heat is transferred by conduction through a material, and it obviously should be very low for building insulation materials. For an average EPS insulation material, the thermal conductivity value ranges between 0.031 and 0.041 W/mK.15,25,29
Density is another key feature affecting the thermal performance of insulation materials.30,31 The typical density value of an EPS insulation varies between 18 and 50 kg/m³.29,32 Therefore, looking at thermal conductivity and density is essential when selecting an insulation material. Since no regulated figures for the thermal conductivities and densities of construction materials are specified for Turkiye, the most repeated thermal conductivity and density values in the One Click LCA database were selected for this analysis. The thermal conductivity values of 230 EPDs varied between 0.029 and 0.046 W/mK. The most common thermal conductivity value was 0.031 W/mK; other EPDs with different thermal conductivities were eliminated.
Then, 52 EPDs were sorted according to the most common density value, which was 15 kg/m³, and 35 EPDs with density values either below or above 15 kg/m³ were eliminated.
One Click LCA gives a warning when adding an EPD that has expired or its expiration date is close. This needs to be checked manually when analysing the EPDs in detail.
Hence, another parameter to look for in EPDs is the time validity of the declared LCA figures, which can be checked from the issue date of the reports. This meant that 17 EPDs left from the thermal conductivity and density selection process were checked for validity, and EPDs from before 2017 were excluded due to the 5-year expiration date.
Also, EPDs should comply with the ISO and EN standards for the LCA study. Otherwise, the declared LCA figures are not valid or reliable regarding the calculation methods applied. Although the One Click LCA initially checks the compliance of EPDs to ISO and EN requirements, the EPDs were checked manually by the authors for ISO and EN compatibility and, as a result, there were only 15 EPS insulation materials’ EPDs left for the sensitivity analysis.
Lastly, during the detailed analyses, some EPDs were excluded due to presenting their density information as an overall value rather than for each insulation product within the EPD, or they were eliminated as EPD reviewing categories, such as - Material mixes and manufacturing methods of the insulation material were not available in the material's database, - The LCA figures were populated based on different manufacturers' products, - And information for a single product could not be drawn, - Excluded for having identical information with another EPD, - The expiry date was earlier than 2022.
Therefore, after these elimination steps, the final detailed analyses were carried out for eight EPDs in total from France, Italy, Ireland, Germany, and Slovakia (Figure 2). Flow chart of EPD elimination process, moving from left to right.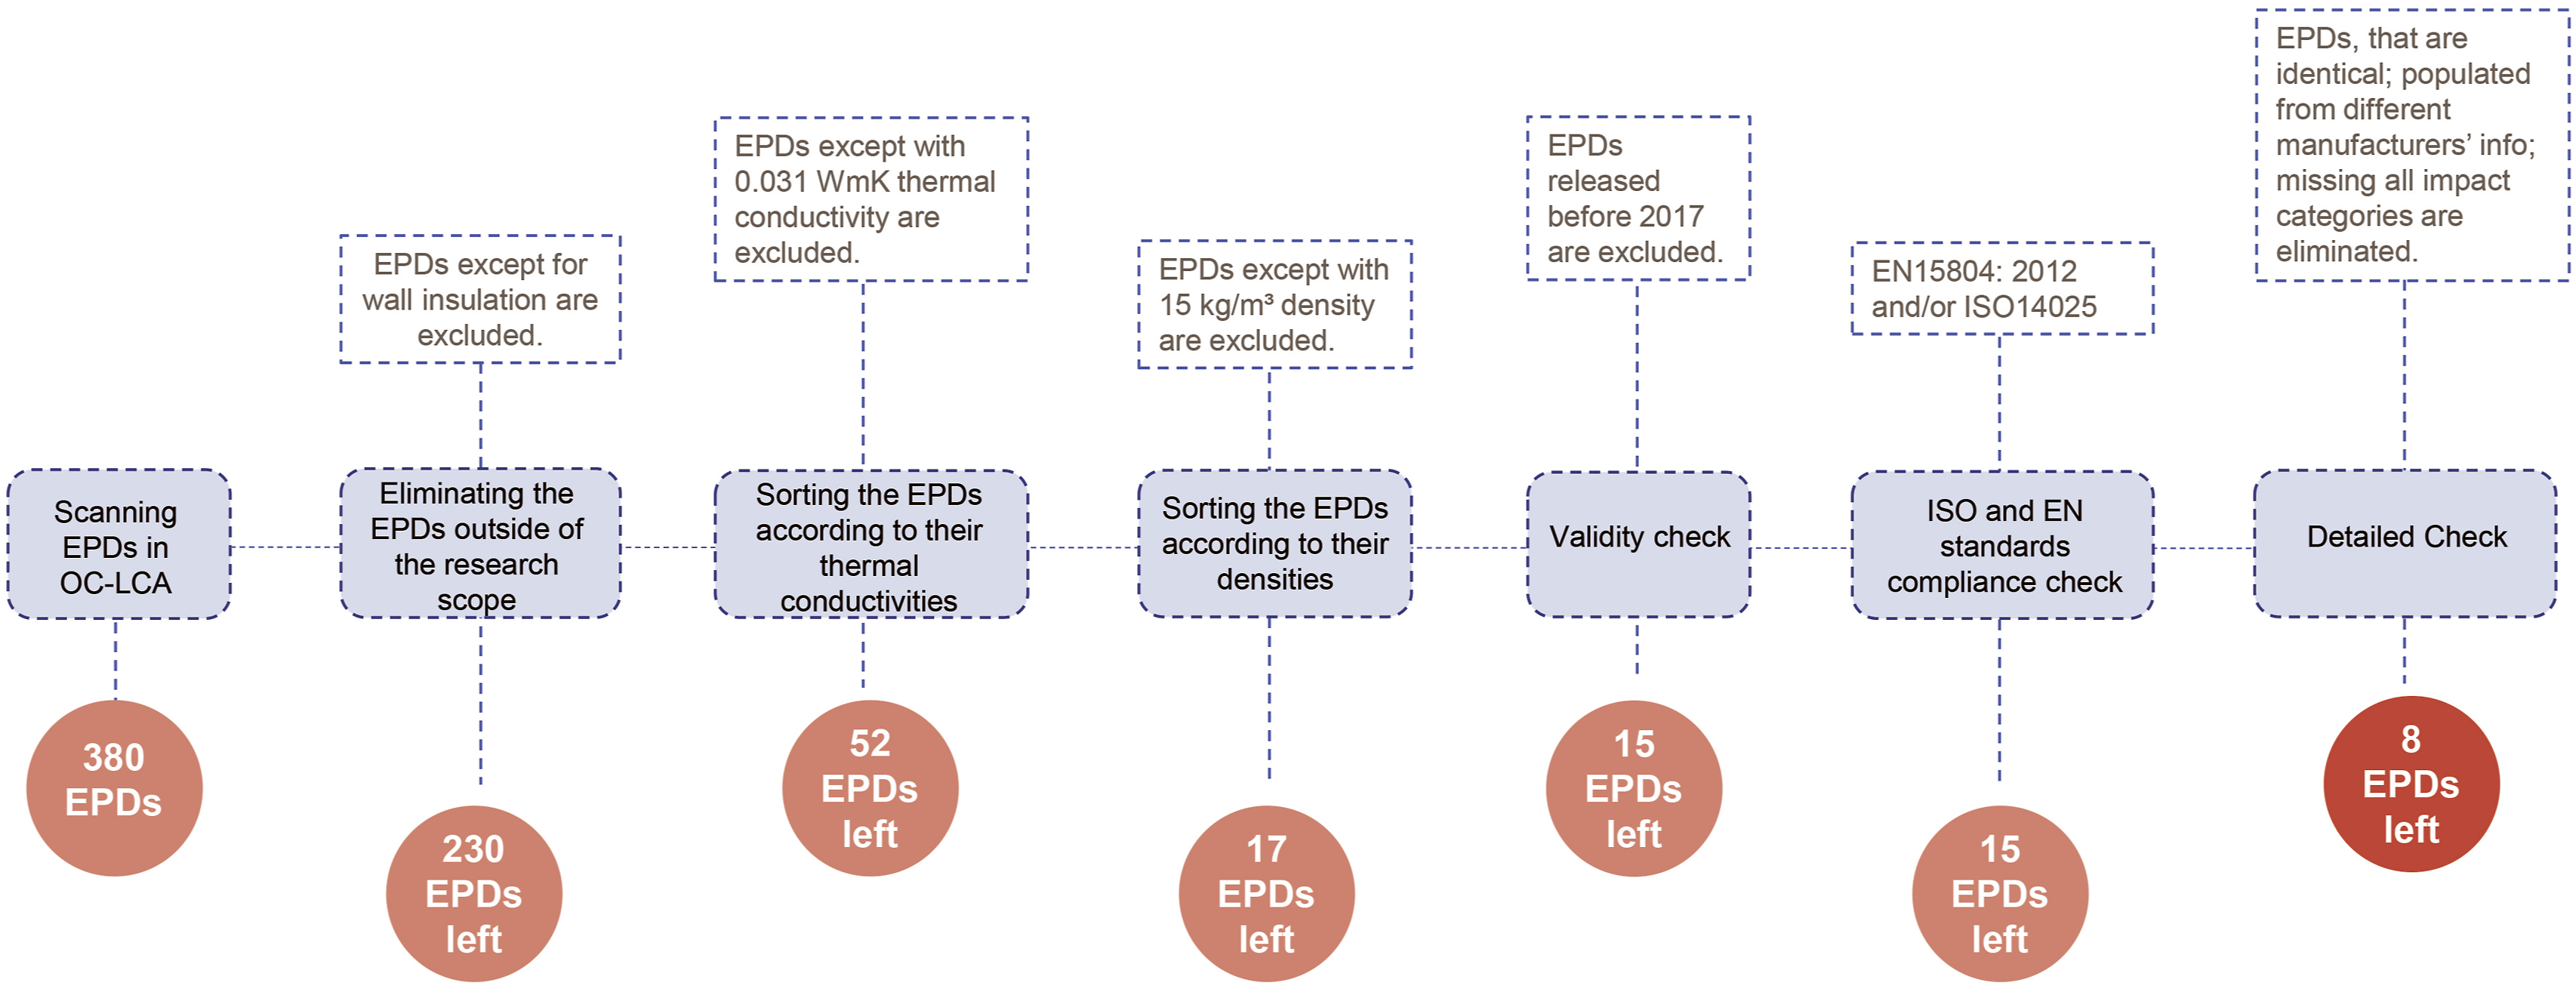
This study's functional unit (FU) was m³ since half of the EPDs declared the results in m³ FU while others were based on panel sizes or 1 m2.
According to previous studies, the environmental impact results of insulation materials are affected by the properties of
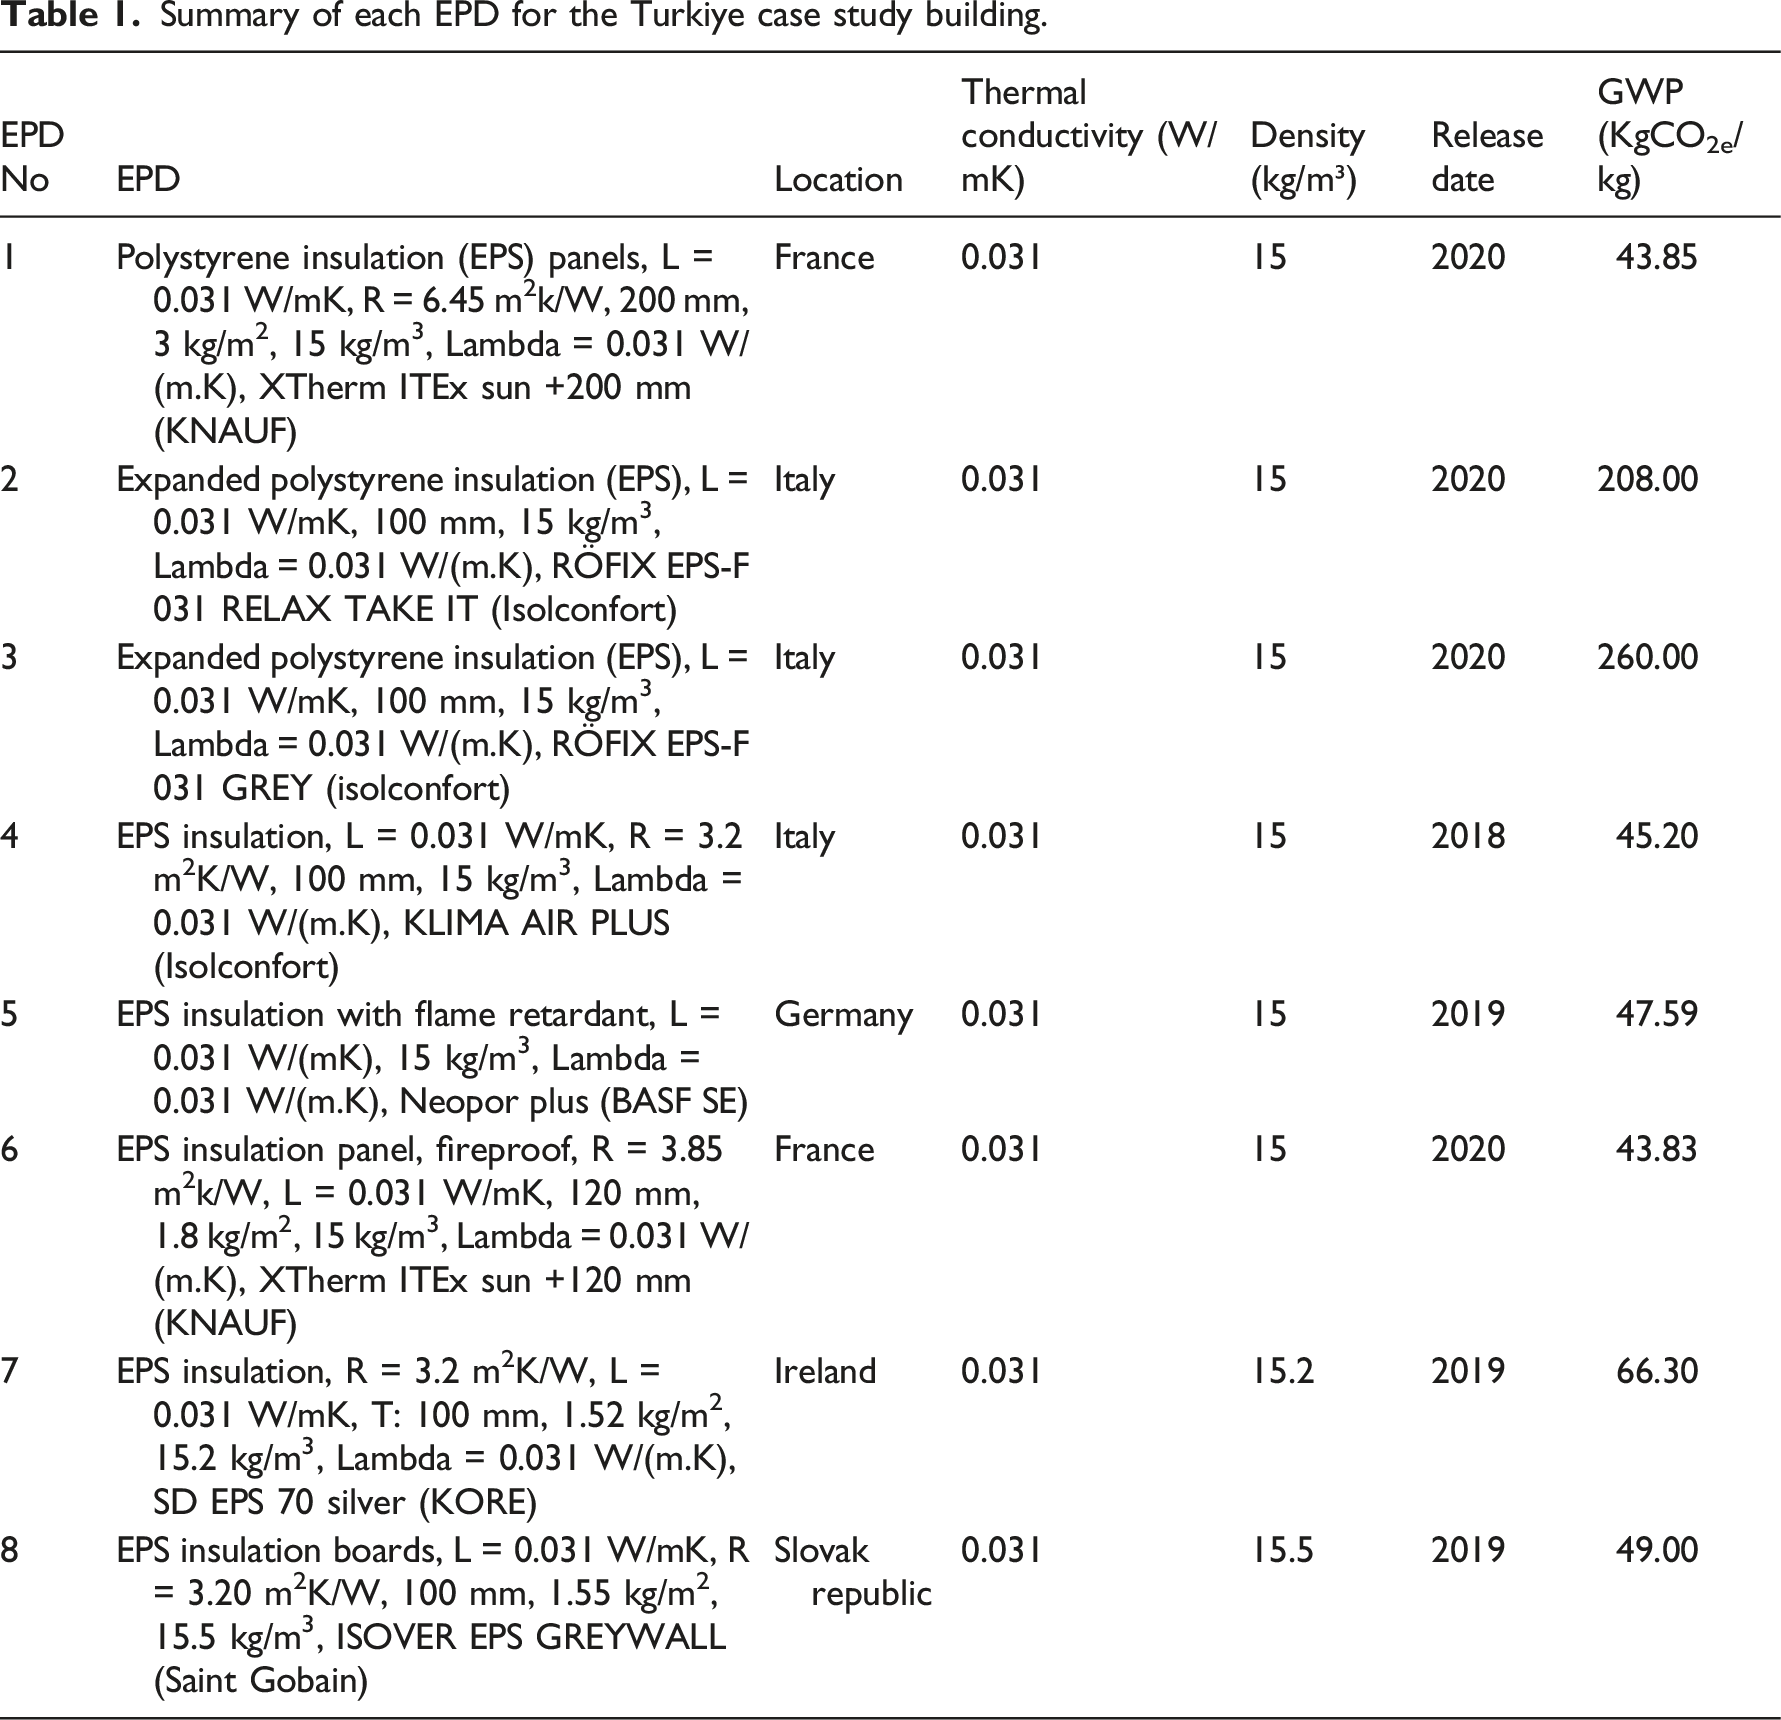
Summary of each EPD for the Turkiye case study building.
Case study and localisation factor
The case study was an apartment block in Istanbul, Turkiye, in a five-storey building with two apartments on every floor, and common areas like storage and utilities placed in the basement. The apartment block represented a typical example of a Turkish construction style in urban areas (Figure 3). The existing building components walls are hollow clay brick with plaster on both sides and mosaic tile finishing on the exterior face. The windows are double-glazed PVC frames. The roof is a clay roof tile finish with timber substrate without insulation. Each flat in the building has a separate condensing boiler sourced from natural gas for heating. There is no active cooling system designed. However, two flats have air conditioners. The ventilation is operated with windows. Case study apartment building.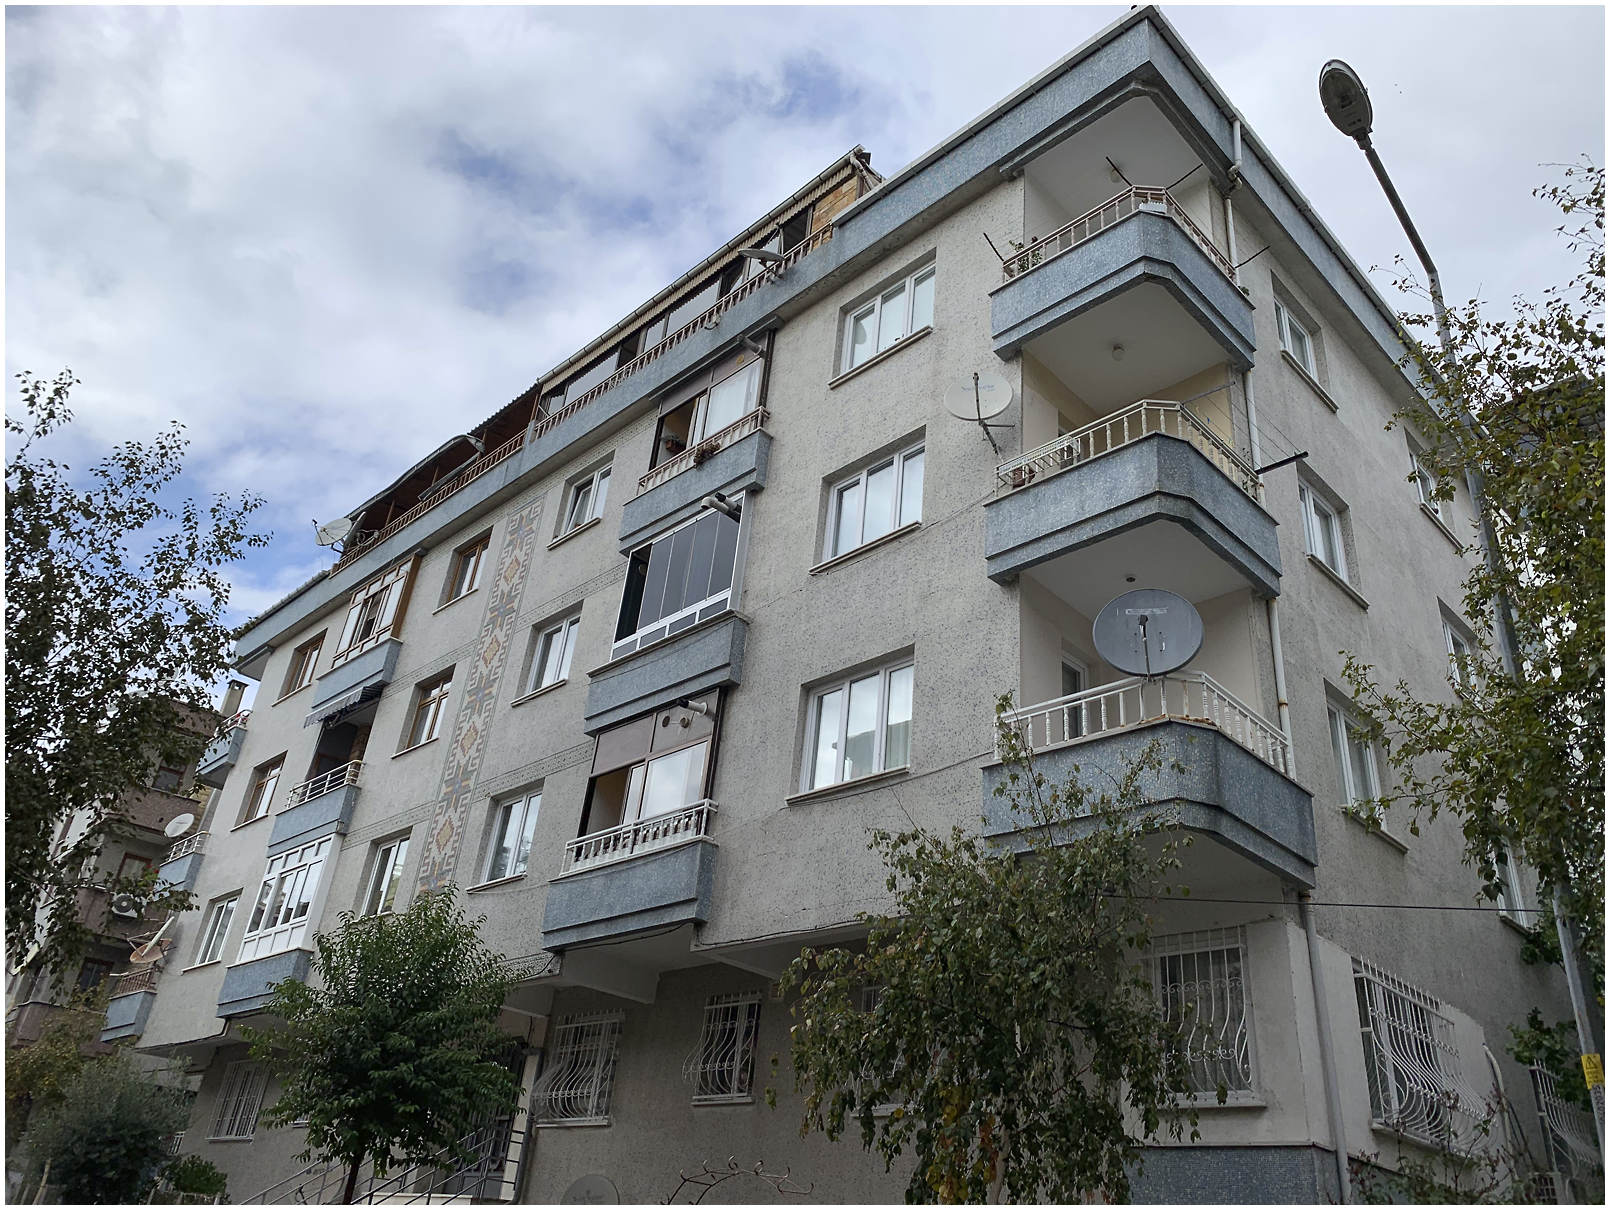
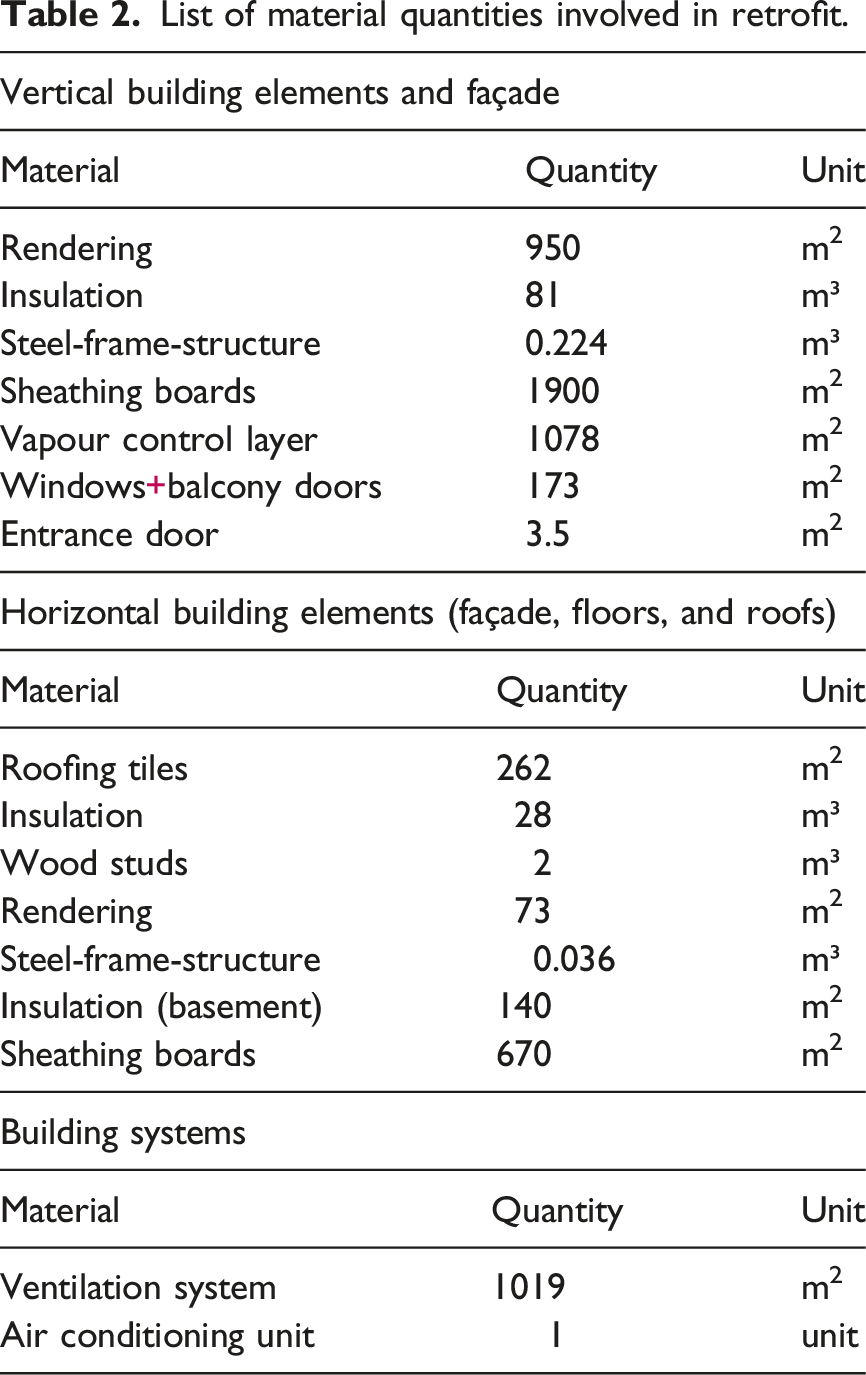
The façade upgrade was chosen as the initial step in an energy retrofit strategy, with the aim being to achieve the Passivhaus retrofit standard (EnerPHit) performance. Passivhaus involves the design of very low energy new buildings involving high levels of insulation, no thermal bridging, airtight construction, mechanical ventilation with heat recovery and high-performance glazing. The EnerPHit retrofit standard requires a thermal transmittance U-value of 0.3 to 0.5 W/m2K for external walls. Therefore, considering the commonly used and standard construction materials in Turkiye, the retrofit components consisted of 12 mm sheathing board (OSB), 90 mm insulation (EPS), 12 mm sheathing board (12 mm) and 50 mm finishing layer of cementitious-based (Figure 4 and Table 2). Details of the retrofit external wall construction. List of material quantities involved in retrofit.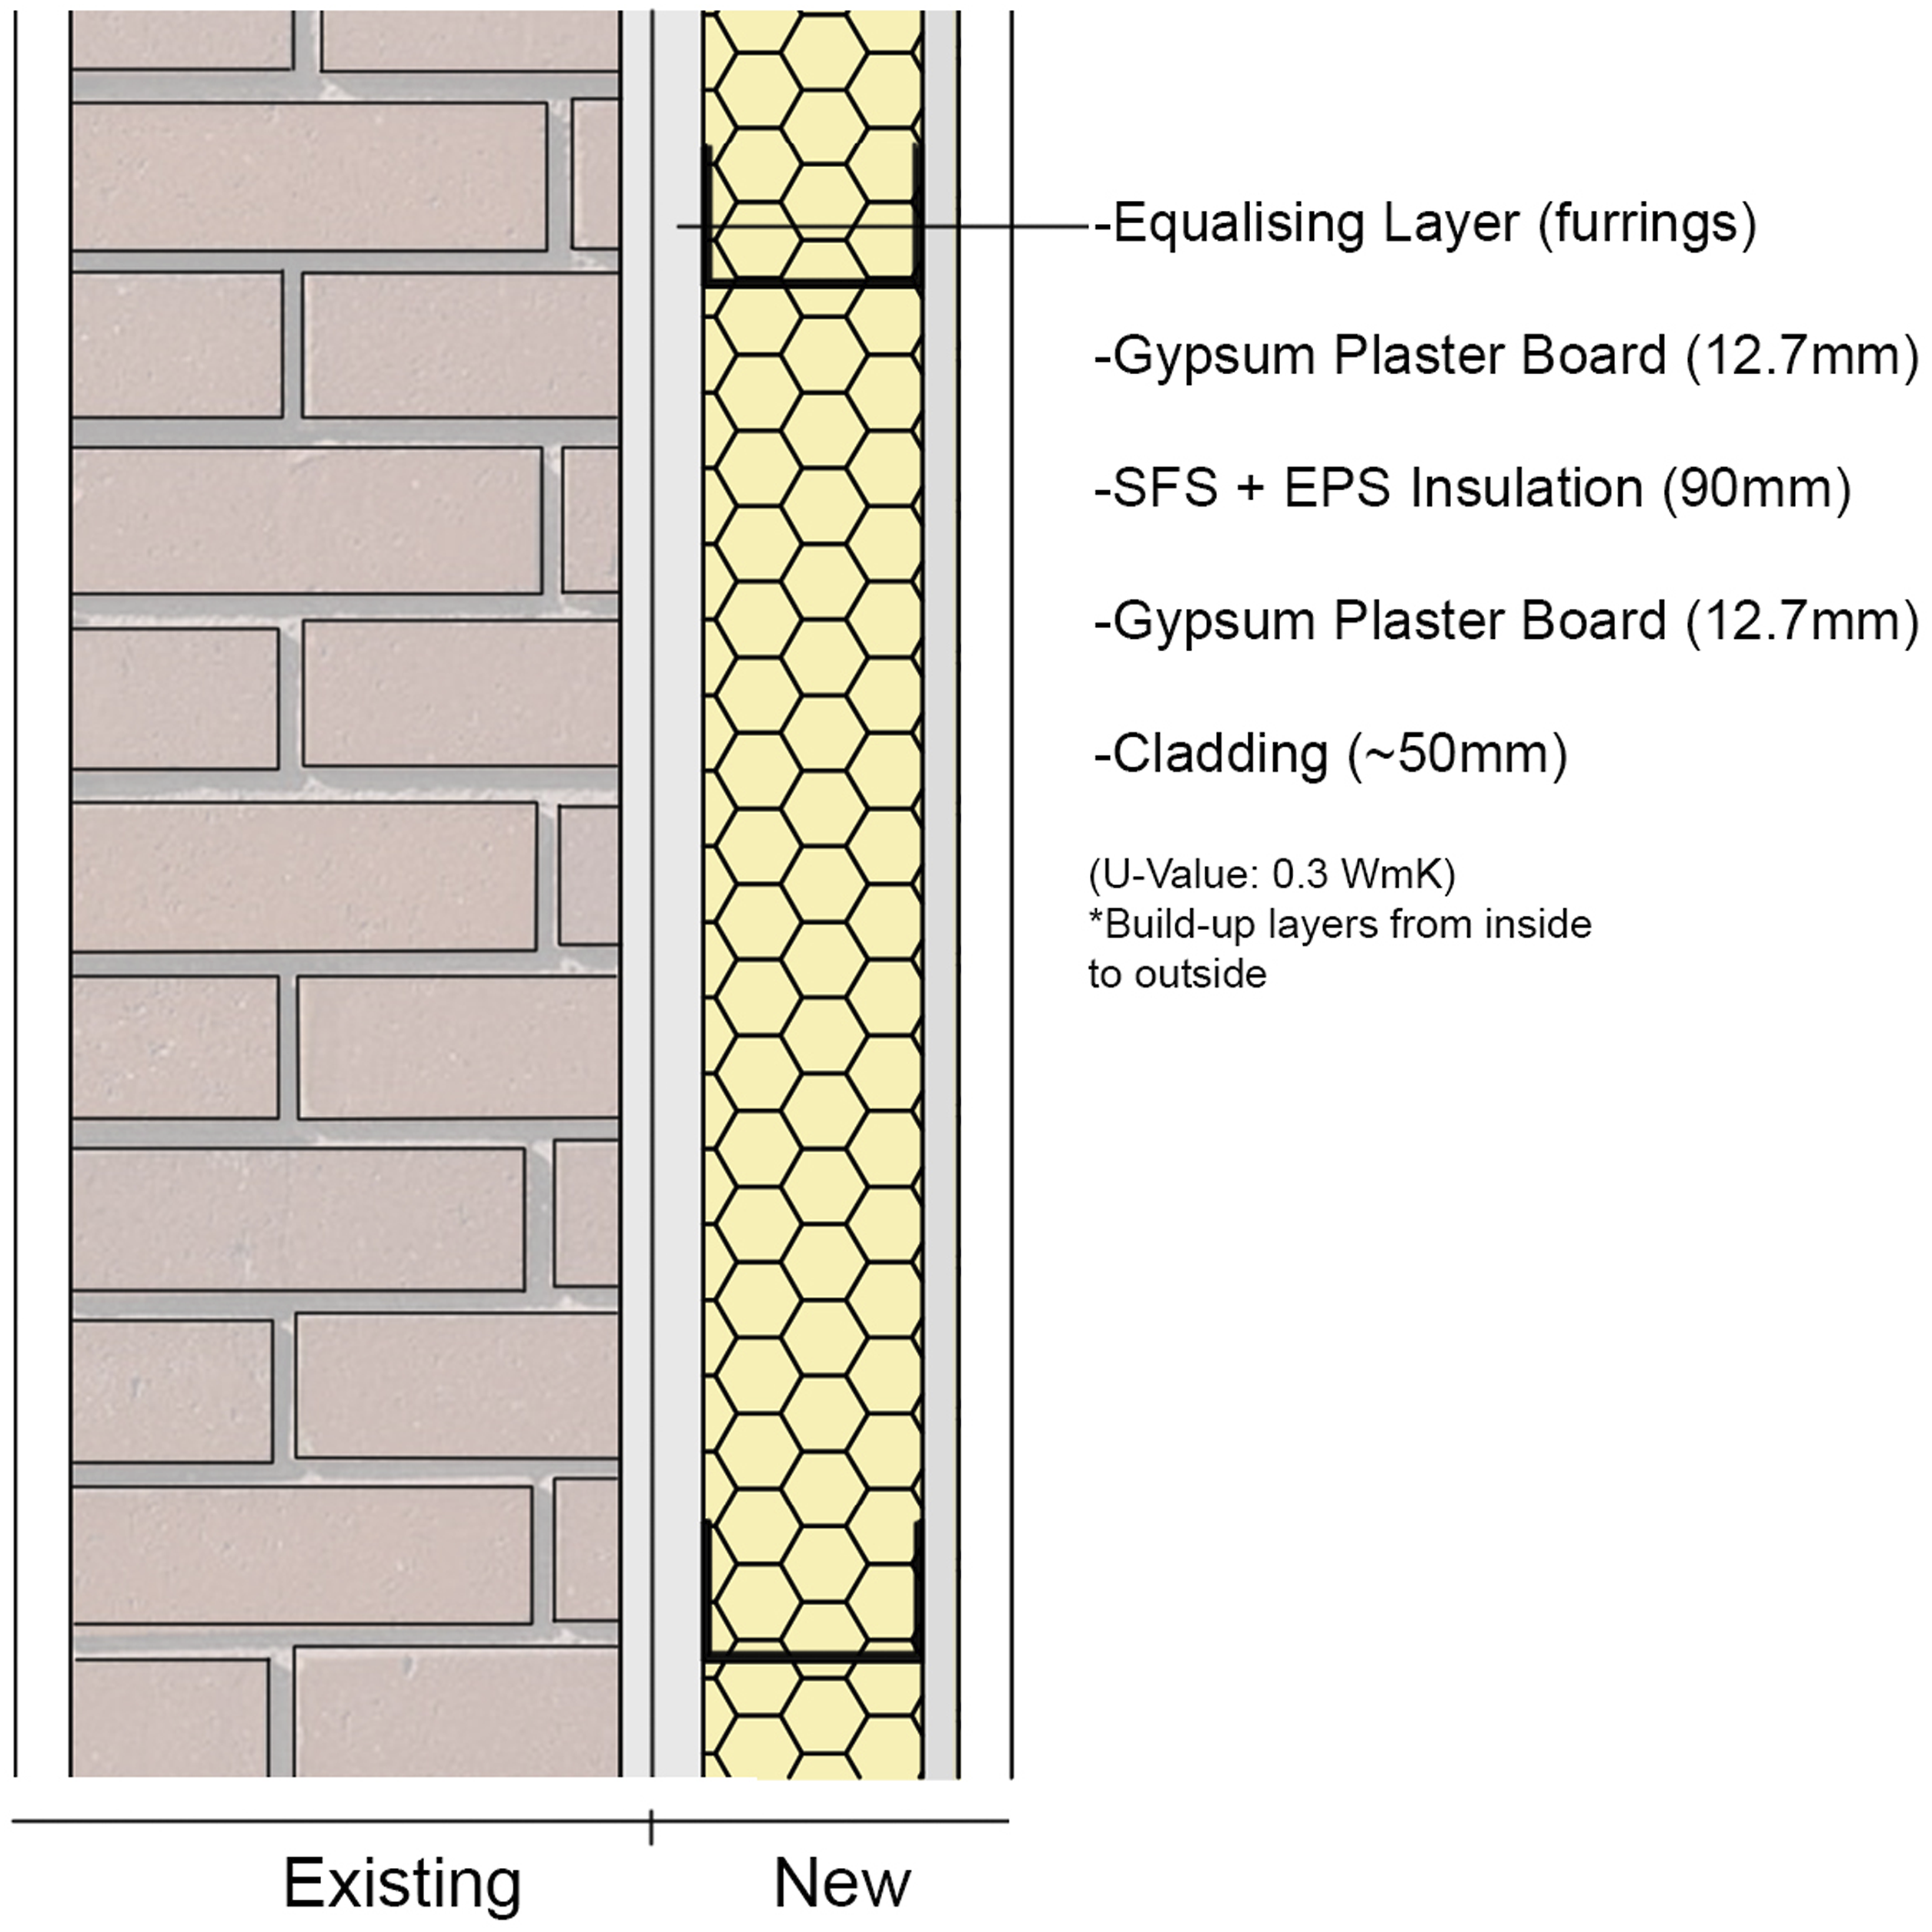
To see the effect of insulation material selection, the eight selected EPDs were applied to the LCA of the case study building in One Click LCA. There is a localisation option in the software for manufacturing when an environmental profile is not available for a case study's region. The method is based on changing the electricity grid carbon coefficients of the original country profile with the case study location coefficients – see equations (1) and (2).
33
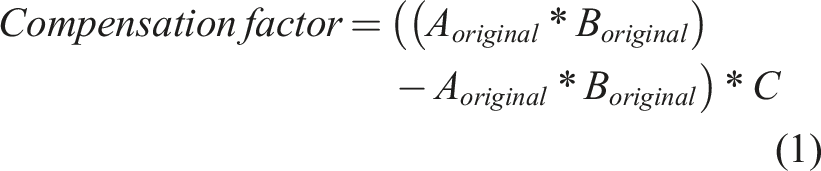
A = Electricity use efficiency, B = Electricity impacts, kg CO2-equivalent,
C = Required electricity for the manufacturing of this material subtype, Kwh.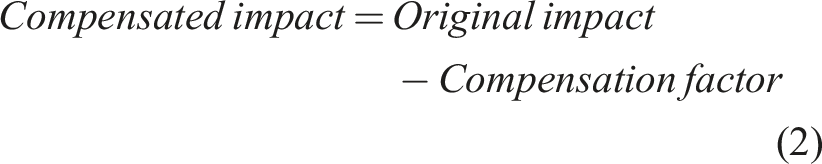
The localisation is to give more illustrative results because the method is just applicable for the productions based on electricity, not other sources like gas or oil. 34 So, localisation might not always be the option for every environmental profile in the tool or the databases. Therefore, this study aimed to reveal the differences between the LCA results with and without the localisation factor.
Results and discussion
EPD data variation in up-front impacts
Environmental impact category results of each EPD.
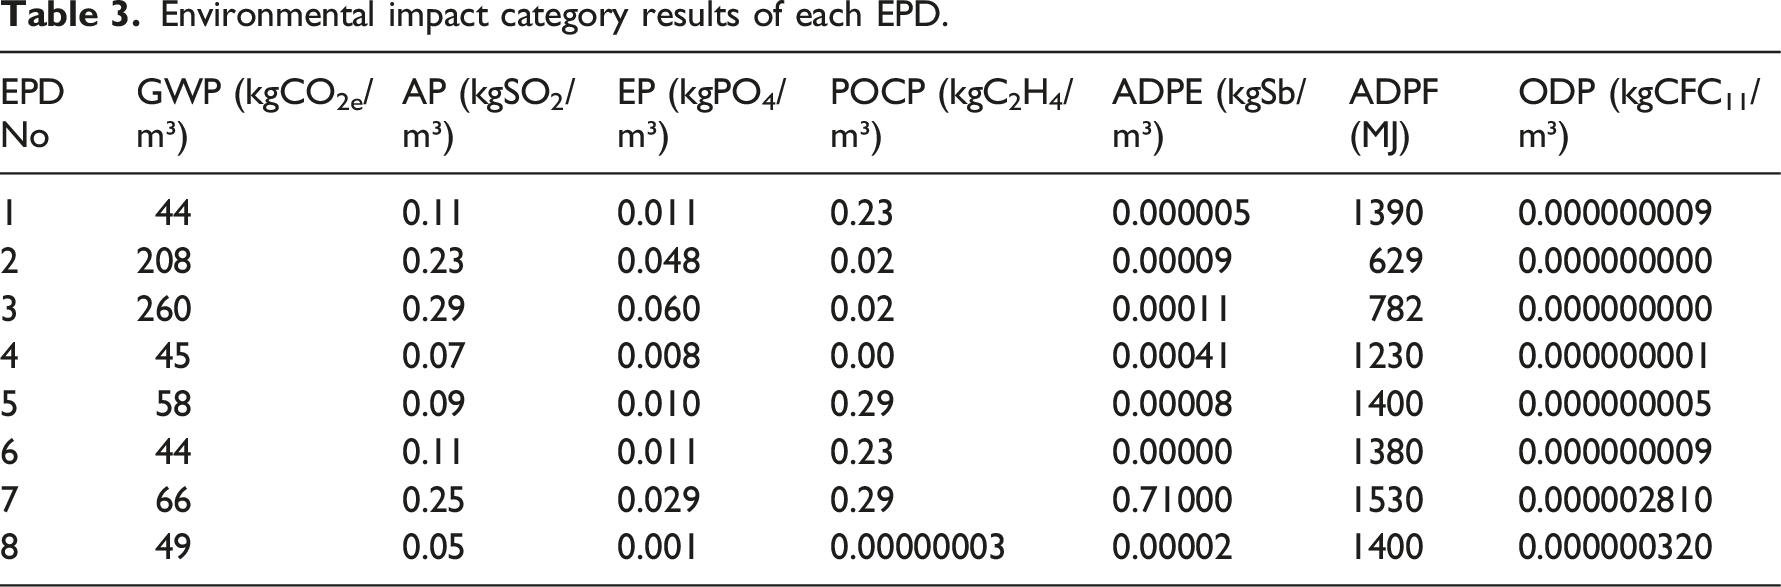
Further, the phosphate release (Eutrophication Potential - EP in Table 3) in EPS production was the highest in EPD 3 at 0.0597 kgPO4/m³, and the lowest impact was from EPD 8 at 0.001 kgPO4/m³. Although EP shows a similar trend with GWP among the EPDs, differences were found for EPD 7 and EPD 5.
The Photochemical Ozone Creation Potential (POCP in Table 3) represents gasses like carbon monoxide formed by vehicles when transporting raw materials to the factory. The variation of between EPDs was not significant. The lower impact EPDs 2, 3, and 4 originated from the same country, Italy, and the same manufacturer. Based on the EPDs subjected to this study, it might be possible that the fuel used in the A2 module of EPS material in Italy is cleaner compared to France, Germany and Ireland.
Table 3 shows that for the Turkiye case study building’s EPDs, the highest impact value of the abiotic depletion potential for fossil resources (ADPF) category was 1530 MJ and the lowest was 629 MJ in EPD 7 and EPD 2, respectively. Figure 5 shows that the energy spent on transporting the raw materials is higher for manufacturers with low-impact production.35,36 Distribution of environmental impact categories for A1-3 stages.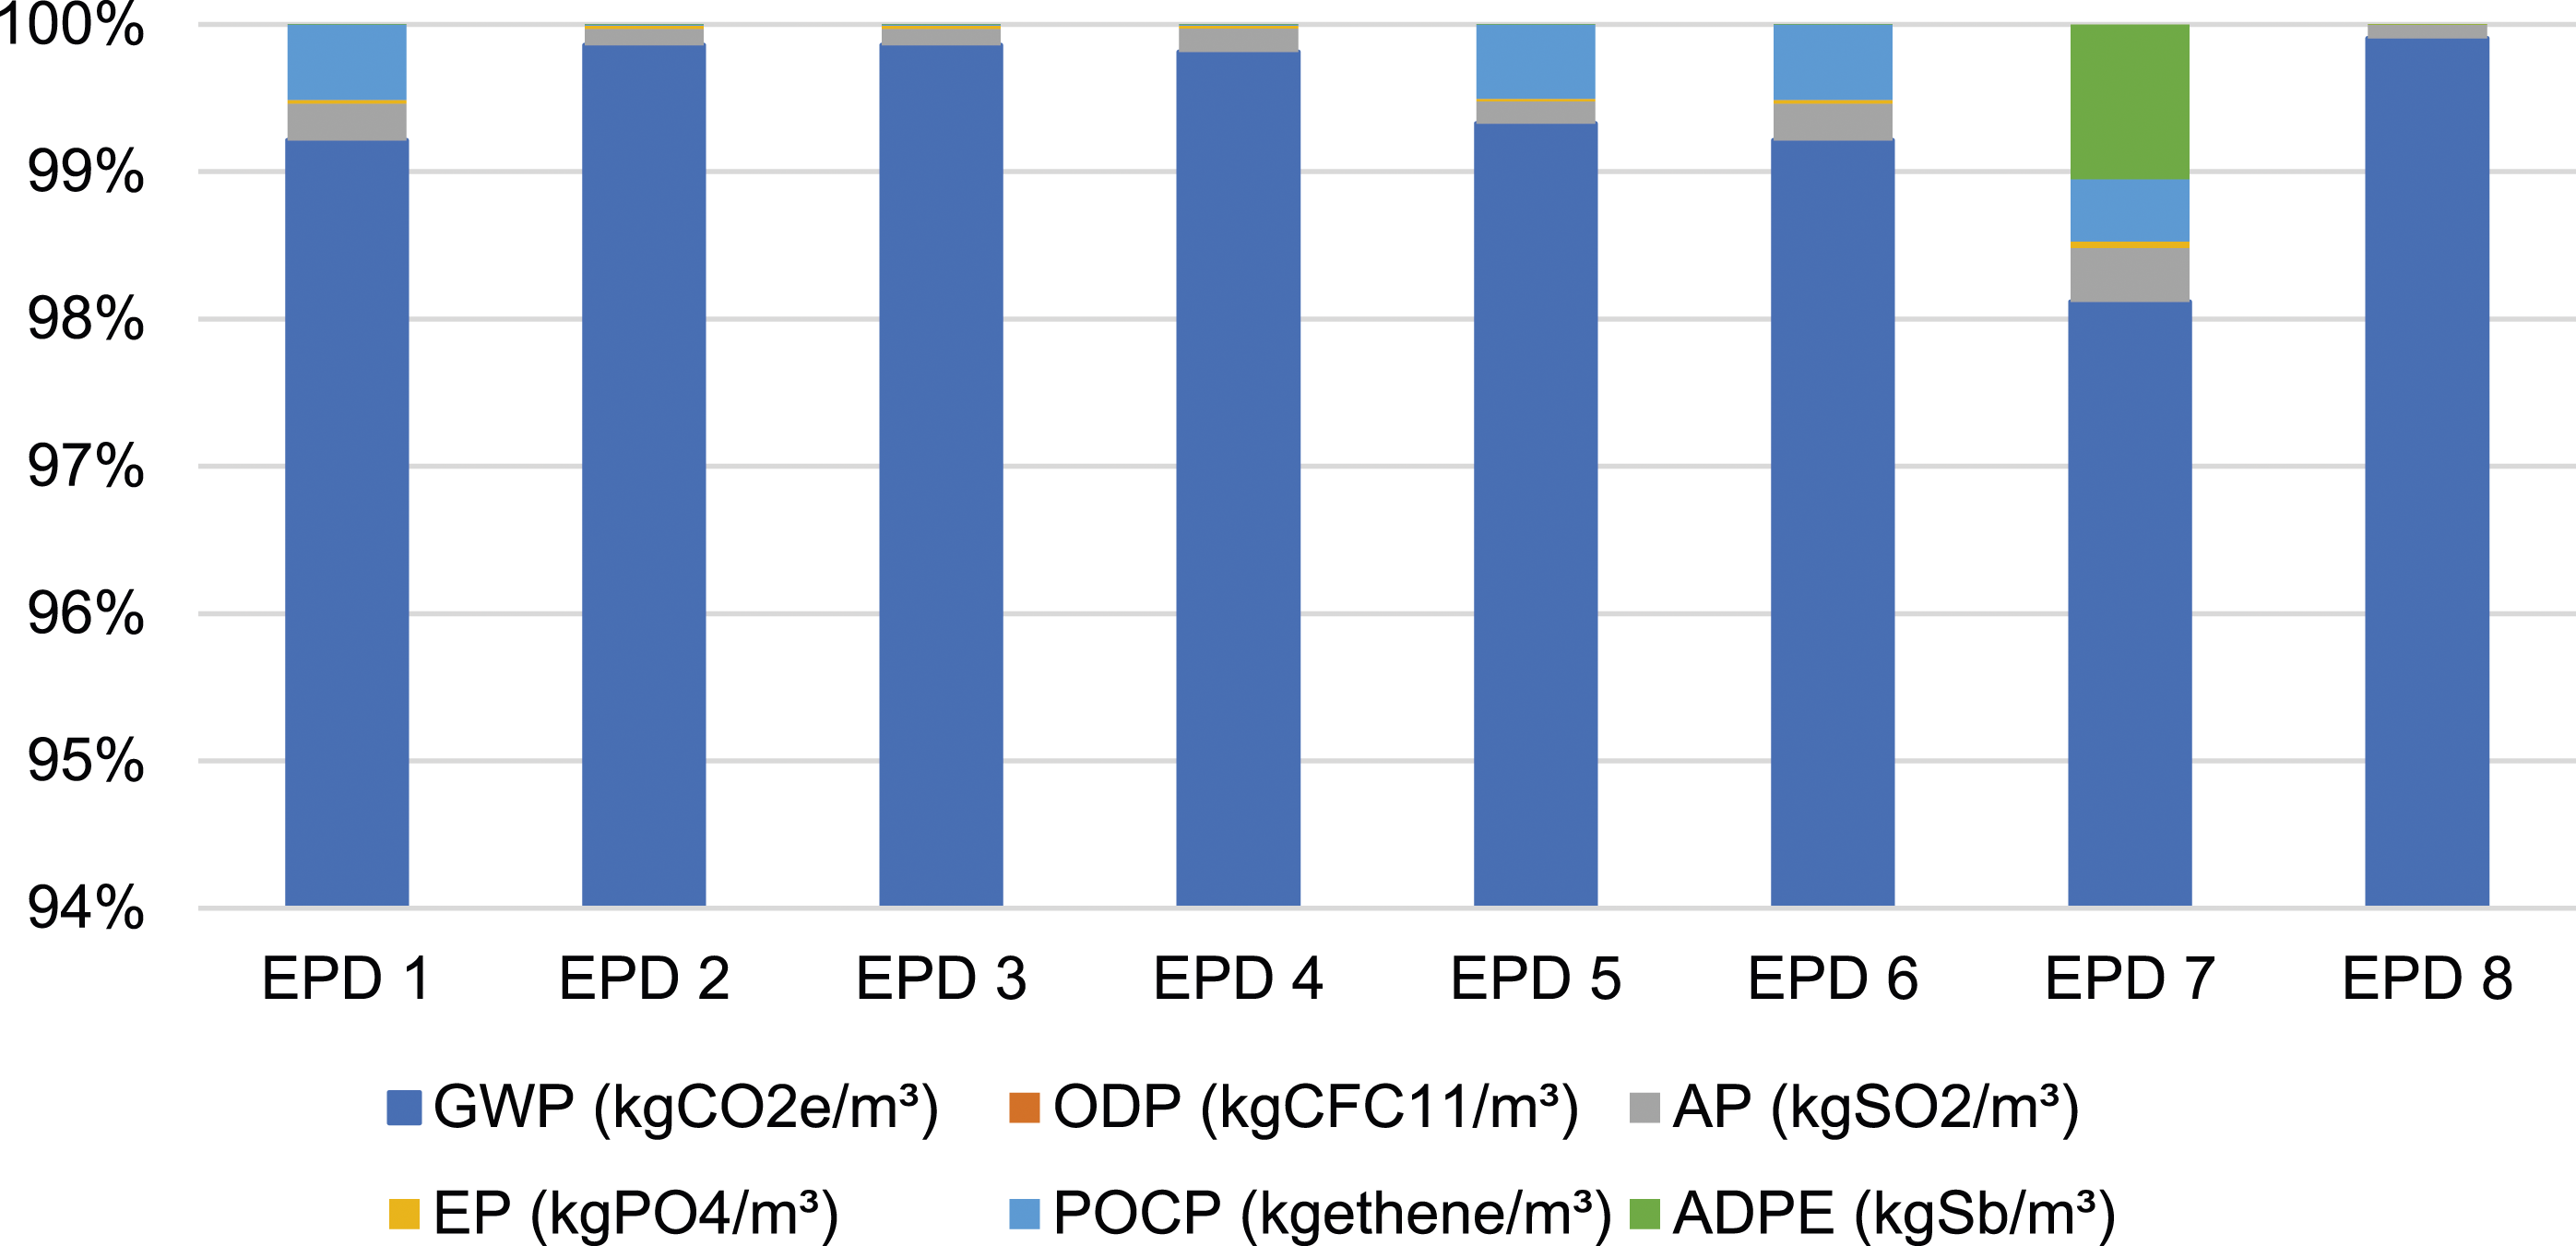
Table 3 shows that, in general, the abiotic depletion potential for non-fossil resources (ADPE in Table 3) did not exhibit noticeable fluctuations between EPDs, with values between 0.000412 and 0.00000471. The only exception was EPD 7, with a value of 0.71 kgSb/m³, which indicates that the manufacturer of EPD 7 used more raw materials than an average EPS production. This can lead to source depletion in the future.
The Ozone Depletion Potential (ODP in Table 3) of the selected EPDs corresponds to the substances causing ozone-depletion that are released into the atmosphere during raw material extraction.35,37 The ODP numbers in this study were generally small, at around 0.0000028 kgCFC11/m³, except for EPD 7, meaning that this product is the most harmful to the ozone layer among the EPDs selected.
Figure 5 shows that the Global Warming Potential (GWP) is still the primary contributor to global warming for the overall LCA. Among the eight EPDs, GWP had more than 99% of the impact (except for EPD 7, where the figure was 98%). ADPE has the most significant impact after GWP in EPD 7 with 1%, while ADPE is less than 0.0001% in the other EPDs analysed. Another noticeable category is AP, which has a 0.1%–0.3% impact on overall embodied impacts. Considering the decarbonisation in material production in the future, ODP, AP, EP, POCP, and ADPE may be the only other impacts to be declared in the EPDs. Therefore, the main priority will be to lower their impact. However, their impacts will still be less than 1%, and the main focus for tackling climate change in the built environment still belongs to GWP.
EPD data variation in LCA stages
Life cycle impacts come from the production stage [A1-3] since the impacts from other modules (B, C and D) are either not declared or are only partially declared in the EPDs. This situation hinders the comparability of the LCA of EPS products from different manufacturers and/or countries. When adding the environmental impacts involved in A4, A5, and Module C, the EPS LCA figures could be very different in total due to the different transportation and end-of-life scenarios. According to Hernandez et al.,
19
emissions from A4, A5, and Module C are not significant for overall LCA results; however, it can be seen from the LCA results of EPD 4, 5, and 8, presented in Figure 6, that carbon emissions from stages A5, C3, and C4 affected the results of the EPS materials LCA of the case study building. While the carbon emissions of EPD 7 are higher than EPD 4, 5, and 8 at the production stage, they are much lower in terms of the total LCA results. This is because EPD 7 has not declared the emissions correlated in stages A4, A5, and Module C (Figure 6). GWP impact of LCA Stages for each EPD (the not declared modules are not presented).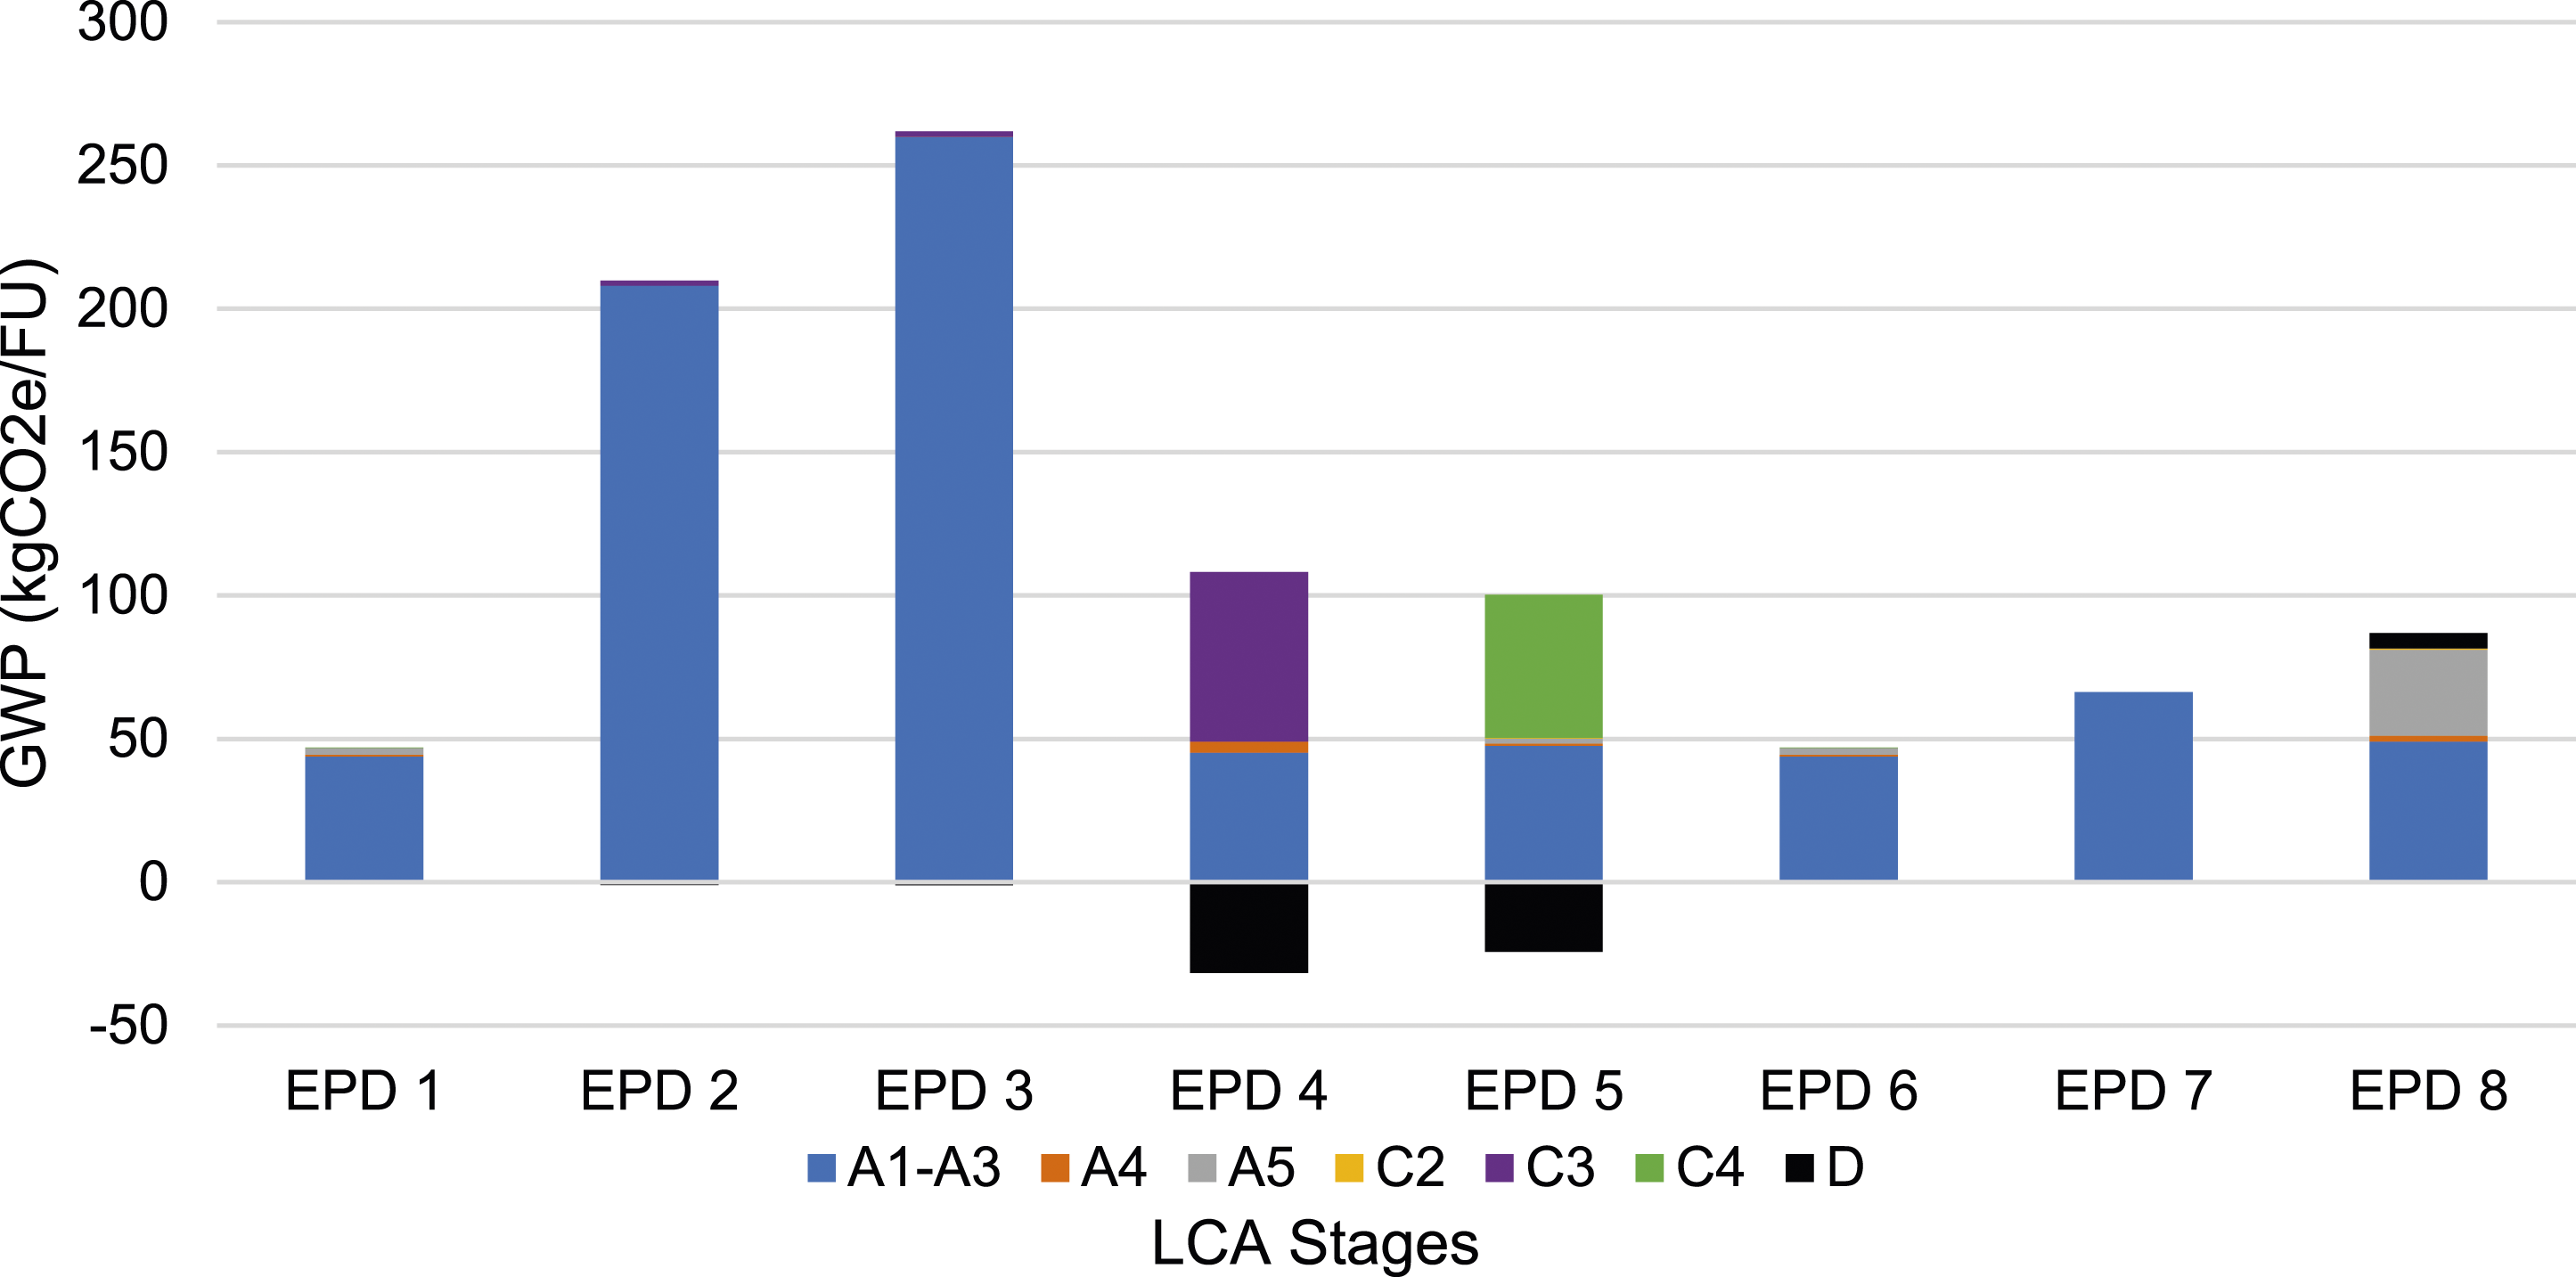
Hence, omitting A4, A5, and module emissions might be a viable option when conducting a more complex LCA study, like in buildings, but it can have considerable impacts on a material’s assessment.
LCA database and software
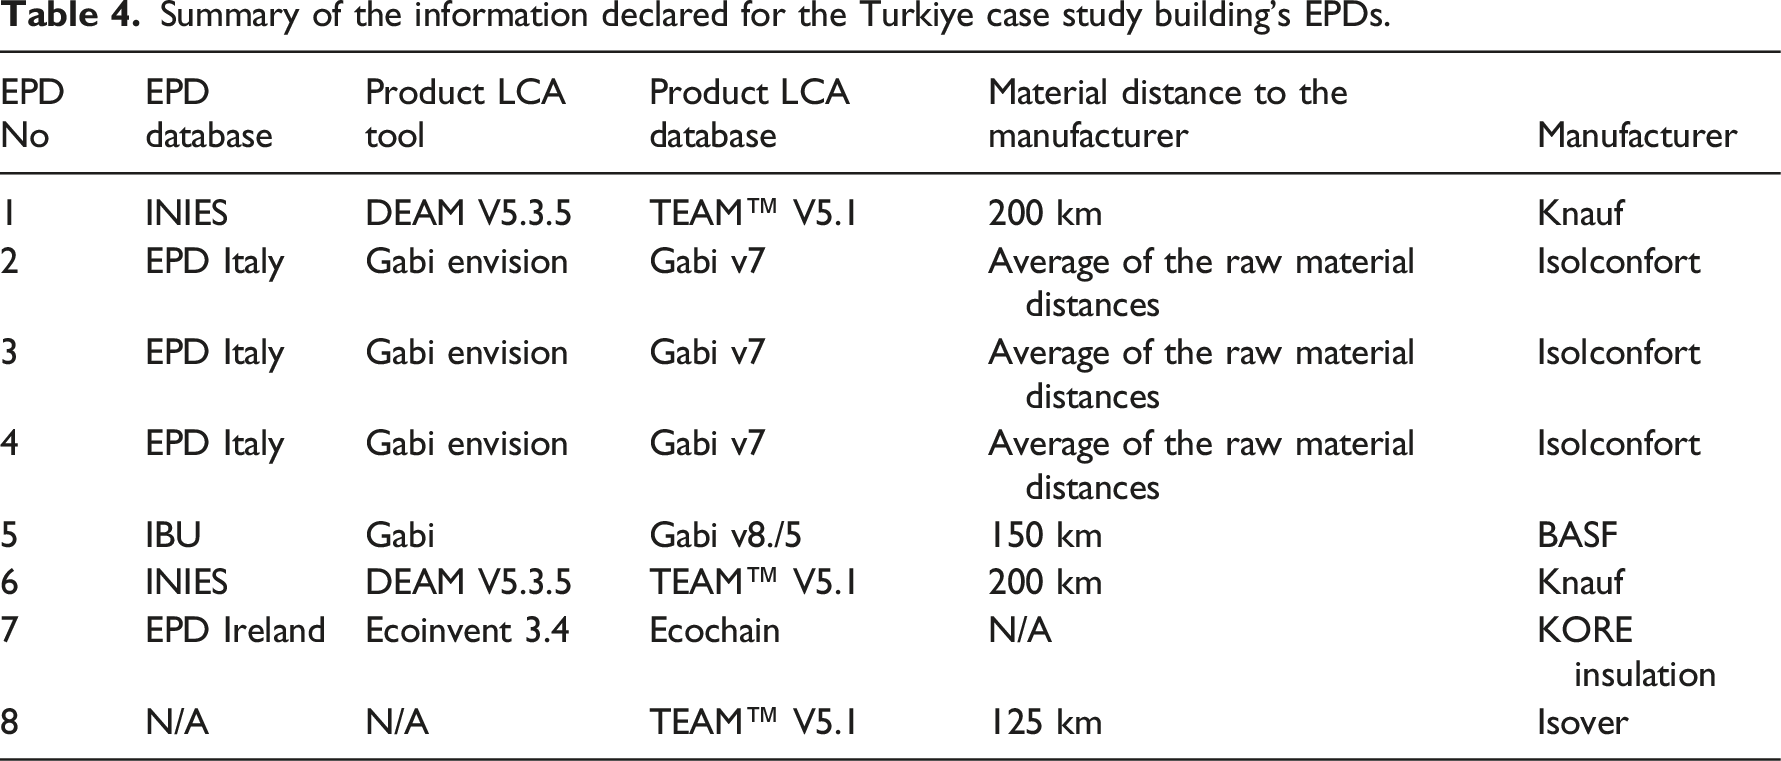
Summary of the information declared for the Turkiye case study building’s EPDs.
For this study, it has been shown that different software might lead to different environmental impact results for the same material with the same production process inputs. This can be due to the errors in material and production databases used and characterisation factors, which is the source of potential errors in the calculation.38–40 The deviation in characterised results between two different LCA tools for material and production can display significant differences for some impact categories, such as GWP and POCP, while the variations can be almost zero for other impact categories. 40 However, more information is needed regarding the input and the software methodology to conclude this parameter analysis in EPDs. This will allow for a thorough exploration and understanding of the impact of LCA tools on the EPD results and embodied carbon results.
Material mixes and manufacturing methods
For the EPDs used in the LCA of the Turkiye case study building, the material mixing/ingredients and manufacturing information were available for just three EPDs. EPD 5 consisted of polystyrene (87% by mass), pentane gas (up to 5.5% by mass), and granulated flame-retardant polystyrene (polymer FR) with up to 1.1% mass. Petroleum and natural gas are used as energy sources during production. For EPD 7, the EPS boards are produced from polystyrene beads derived from different manufacturers, expanded up to 40 times in steam machines and moulded as boards. EPD 5 is produced by foaming solid beads of expandable polystyrene with saturated steam into blocks, which are then cut into individual boards. During this process, the beads increase their volume by 20 to 50 times their original volume. Pentane is used as a blowing gas during the expansion process. 33
It can be concluded that, even though EPDs 5, 7, and 8 are from different countries, Germany, Ireland, and Slovakia, respectively, the materials used to produce the EPS insulation board and the manufacturing processes employed are relatively similar. EPD 5 gives instructions for an EPS board mixing that cannot be compared to other EPDs in the analysis. Also, the process of expanding the polystyrene beads differs between EPD 7 and 8, and the time spent in the steam machine and the energy used could affect the overall results for Module A in the LCA.
Country energy mixes
The EPDs analysed for the Turkiye case study building were from five countries: France, Germany, Ireland, Italy, and Slovakia. Currently, around 40% of France’s energy is based on nuclear power and is supported by natural gas, solar, hydro, and wind power. Owing to nuclear power, France has very low carbon emissions compared to other countries (Figure 7).41,42 Therefore, the products in France are expected to have a lower environmental impact than in other countries. Countries’ energy sources and mix percentages in 2020 (Charts were populated from the references given in the text).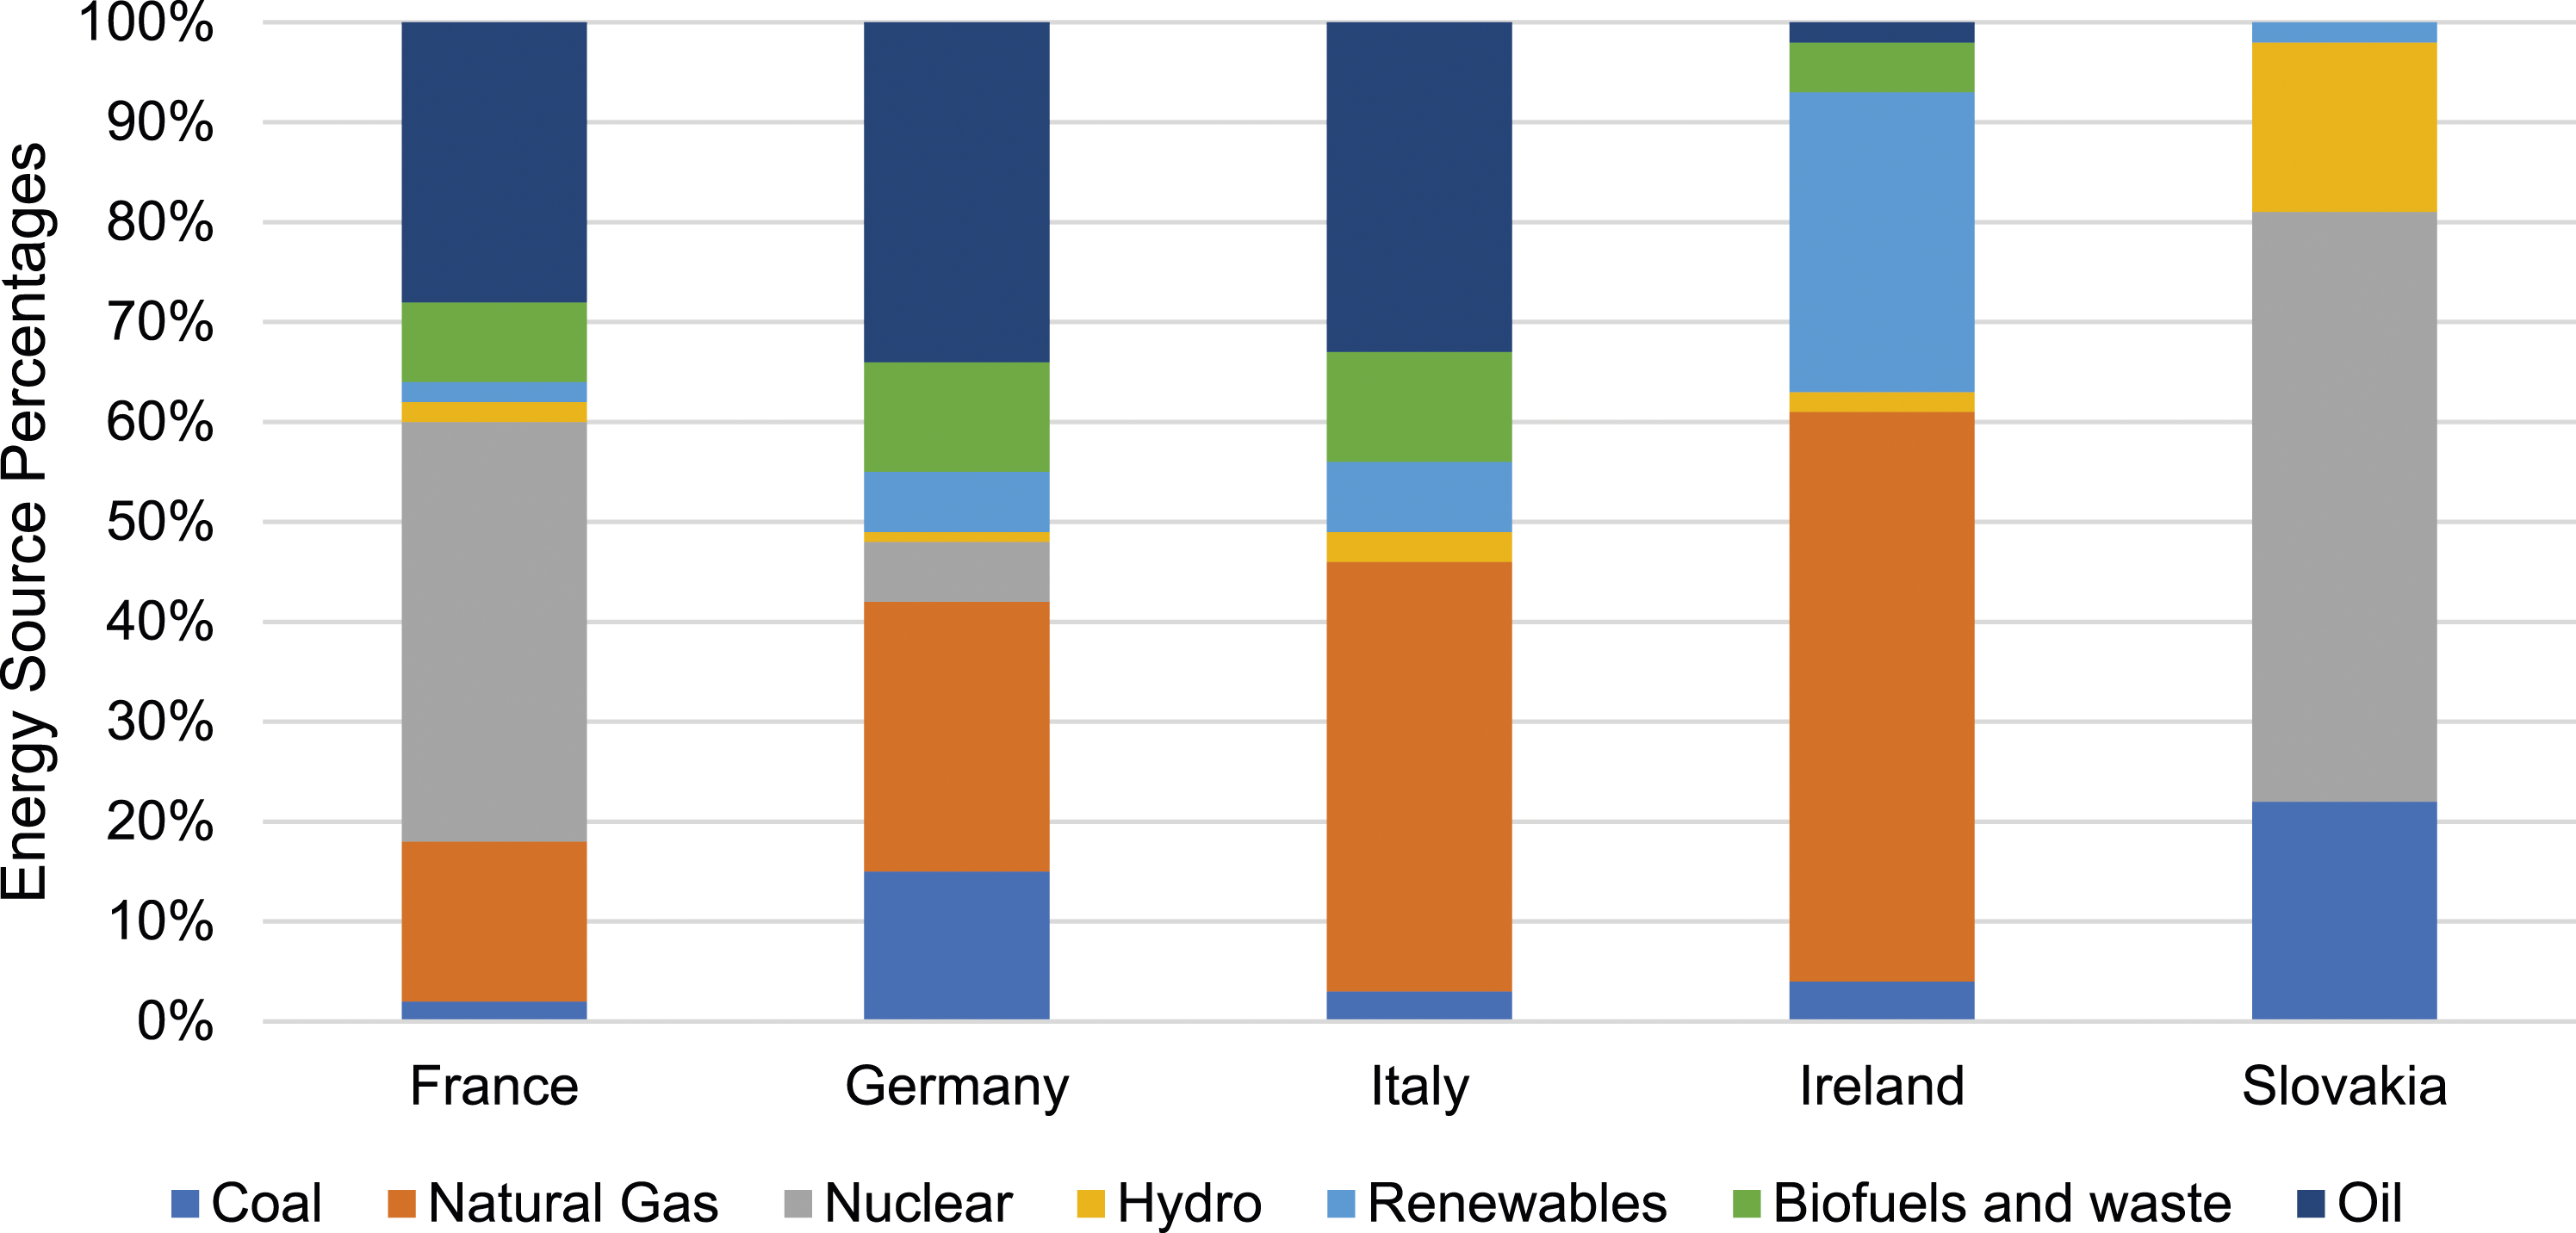
As can be seen from Figure 8, EPD 1 and 6 from France have the lowest embodied impacts. Unlike France, EPDs 4, 5 and 7, from Italy, Germany and Ireland, respectively, show a significant difference between the carbon intensity of the grid and the GWP of their products. Considering their similar production methods, the deviations seen here might originate from the energy sources used during the production of these products. Energy carbon intensity of the EPD’s country of origin and the GWP values of the products.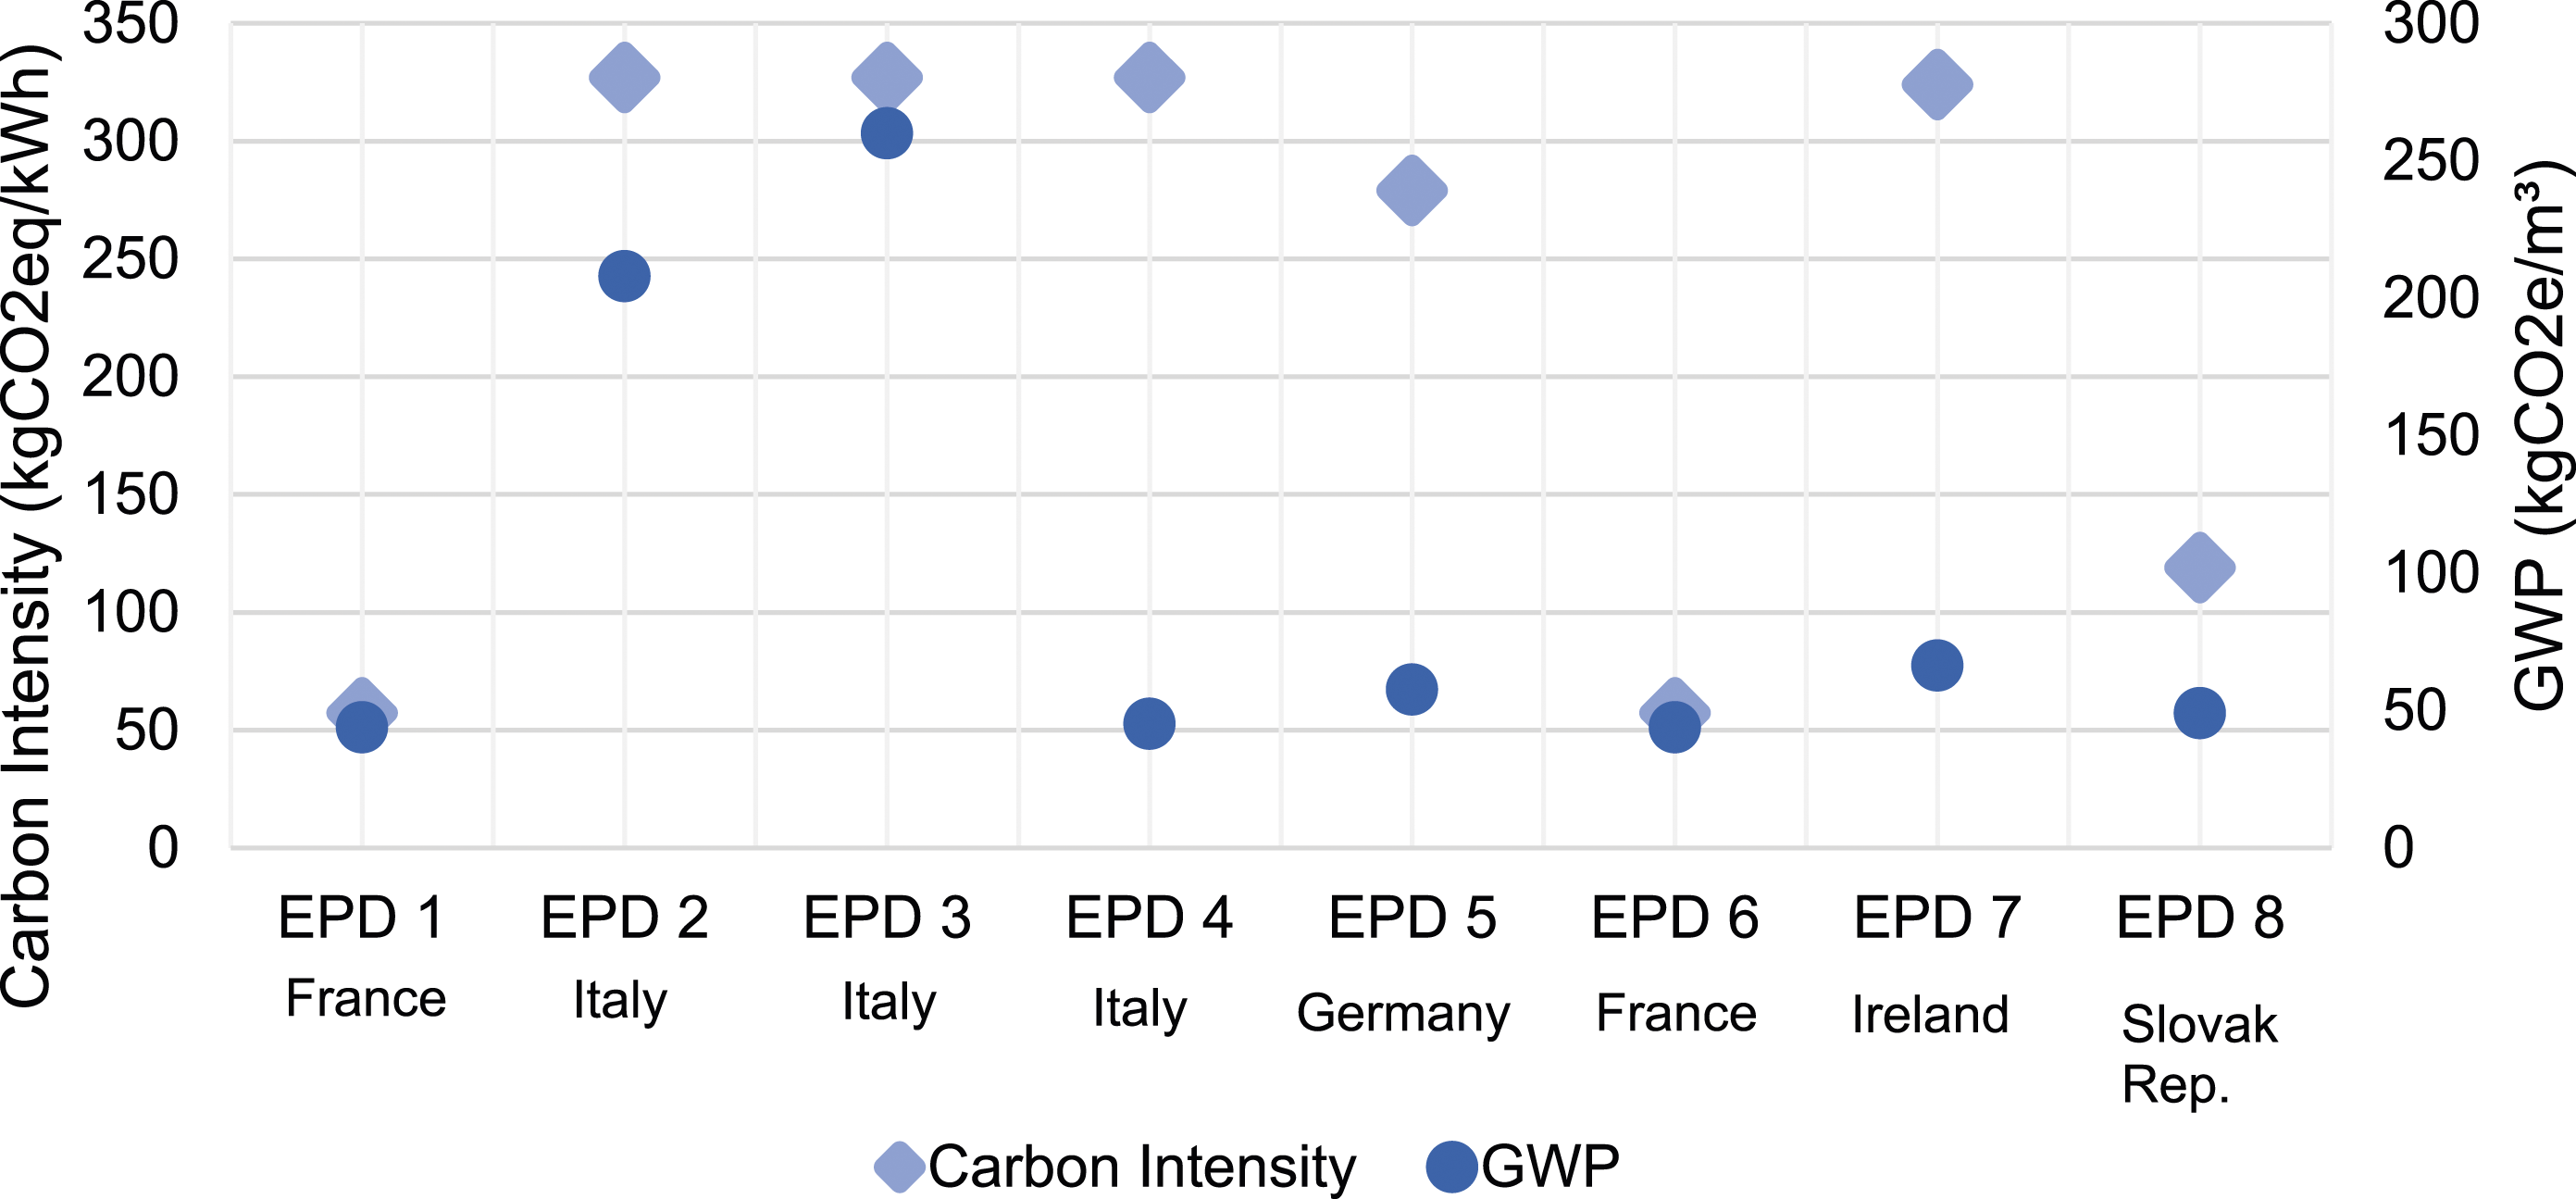
This can also be understood from the difference between EPD 2, 3, and 4. While EPD 2 and 3 show similar trends between national grid carbon intensity and GWP, EPD 4 shows a significant difference. However, this might not just be related to the energy sources but also to the material source location, distance and raw material manufacturer differences between the different products of the same insulation material manufacturer. These factors are considered in the next section.
Figure 9 compares the primary energy renewables PER, the primary energy non-renewables PENR, and the GWP of each EPD. PENR draws the opposite course with GWP. The lower the renewable energy used during material manufacturing, the higher the embodied carbon emission is. Considering the carbon impacts from the non-renewable energy involved in the A1, A2, and A3 stages, especially for EPD 2 and EPD 3 from Italy, high carbon emissions are expected to correspond to high non-renewable energy use. Anderson and Moncaster
43
revealed that, depending on the renewable energy used in the grid, the energy demand might differ due to transmission losses and lower thermal efficiency therefore, the energy demand might vary based on different electricity grid systems. Therefore, even though the PER was higher in EPD 2 and 3 from Italy than in other EPDs, their GWP results were one of the highest, which might be related to the non-renewables involved during the material production, which may have higher primary energy demand due to transmission losses hence higher embodied impact. GWP, PER, and PENR comparison of the reviewed EPDs.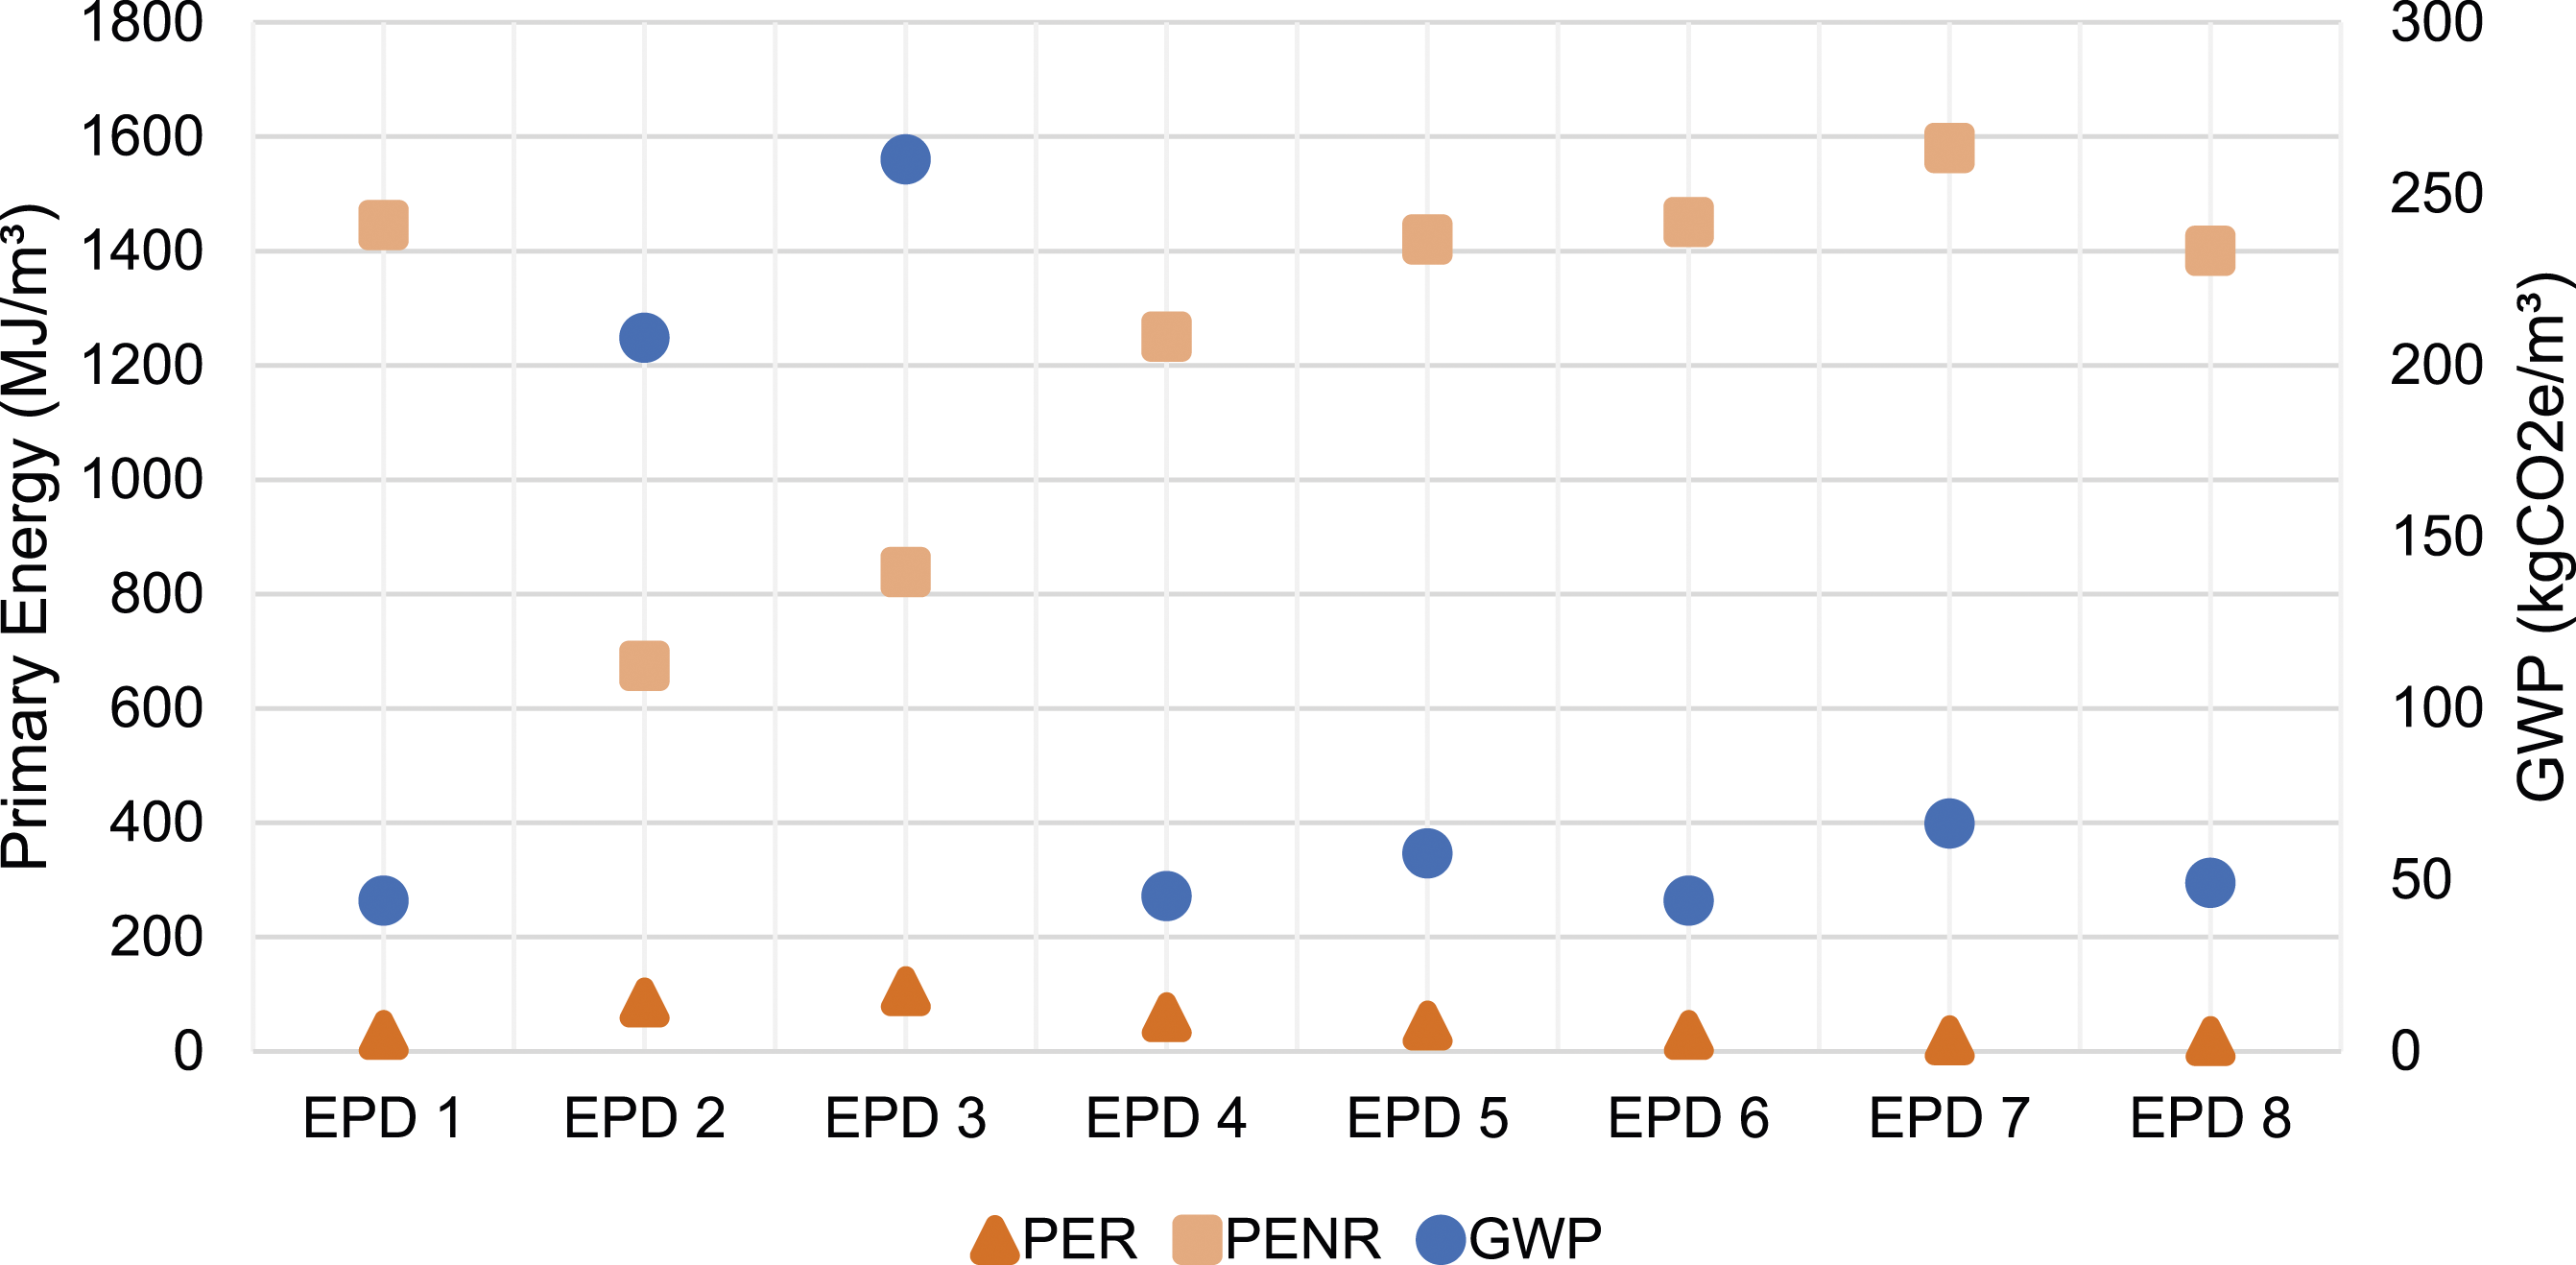
Transportation distance
Four of the eight EPS manufacturers studied for the Turkiye case study building declared their distance to raw material sources, which varied between 125 and 200 km (see Table 4). EPD 7 does not mention the transportation distance in their analysis. In contrast, EPD 2, 3 and 4 claim that the raw material source distance is the weighted average of the product's annual distribution in the country’s various regions. Considering that all the manufacturers must carry the raw materials by trucks from the extraction site to the factory, the environmental footprint of material sourced from 200 and/or 150 km distances weights 20%–60% more emissions compared to a material sourced within the shortest distance (125 km for EPD 8).
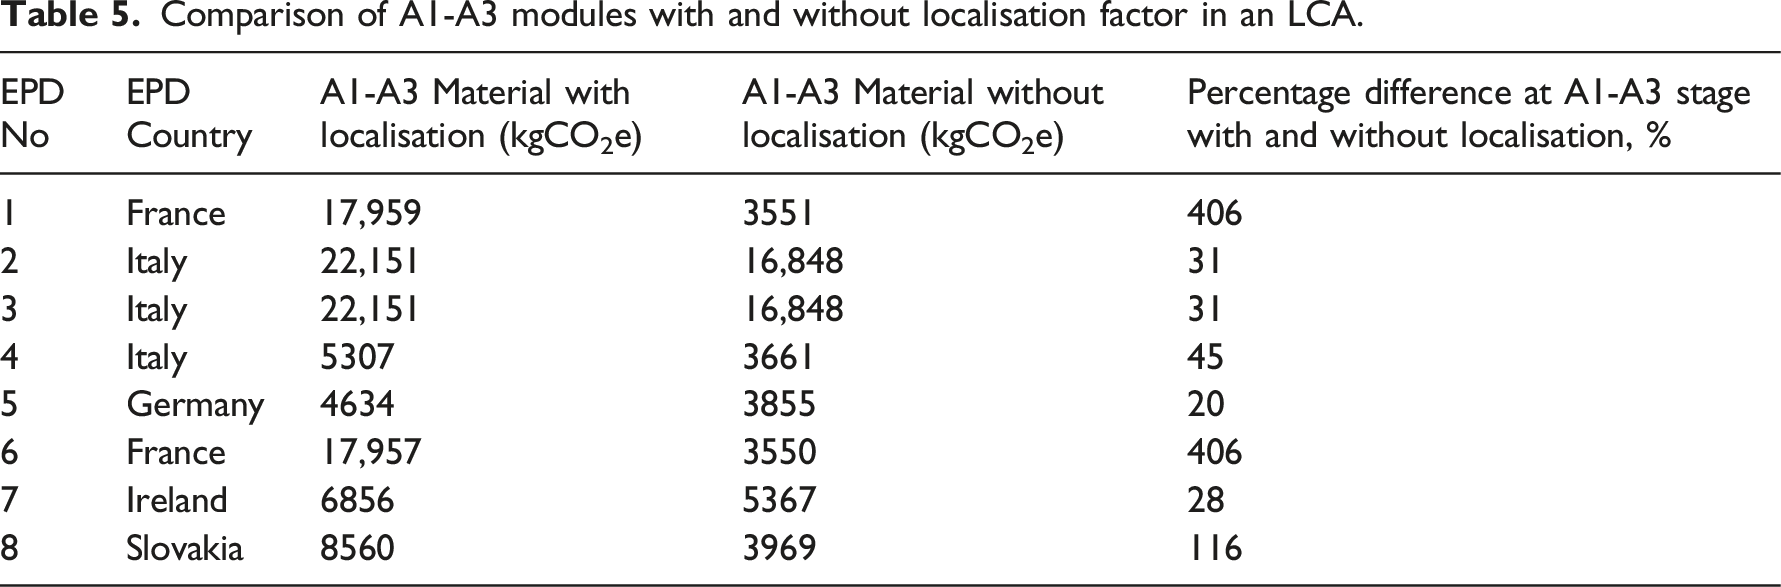
Table 1 shows that, while six of the EPDs have similar results, EPDs 2 and 3 have four times higher embodied carbon results in stage A1-A3 than the others. Although EPD 4 is from Italy and even from the same manufacturer as EPD 2 and 3, the main difference comes from the material sourcing, given that the production methods, fuel mixes, and LCA calculation methods are the same. This comparison shows how important using raw materials from local sources is in the LCA of a material. As stated in a study by Soust-Verdaguer et al., the transportation information in EPDs is still based on representative scenarios; hence, the inclusion of the actual transportation distances in the EPD reporting was explicitly suggested in order to avoid neglecting the consequences of the relevant impacts. 44
LCA retrofit results for the Turkiye case study building
This part of the EPD study aims to examine the impact of selecting different EPDs with identical material properties on the LCA assessment of a retrofit project in Turkiye. In each scenario, all the retrofit materials remained the same, while the Expanded Polystyrene (EPS) material profile was changed using the EPDs analysed in this study. To ensure consistency in the LCA analysis related to transportation distance and energy mix in different countries, One Click LCA offers the option of “localisation” when a specific product or material is unavailable in the case study region or country. Figure 10 shows that even with the localisation option enabled, significant differences exist between the A1-A3 results obtained from the LCA of the retrofitted case study building. However, the gap between the LCA results slightly narrows when the localisation option is excluded (Figure 10). WLCA results with/without localisation factor enabled in one click LCA (left hand Y-axis) and product GWP, A1-A3 (right hand Y-axis).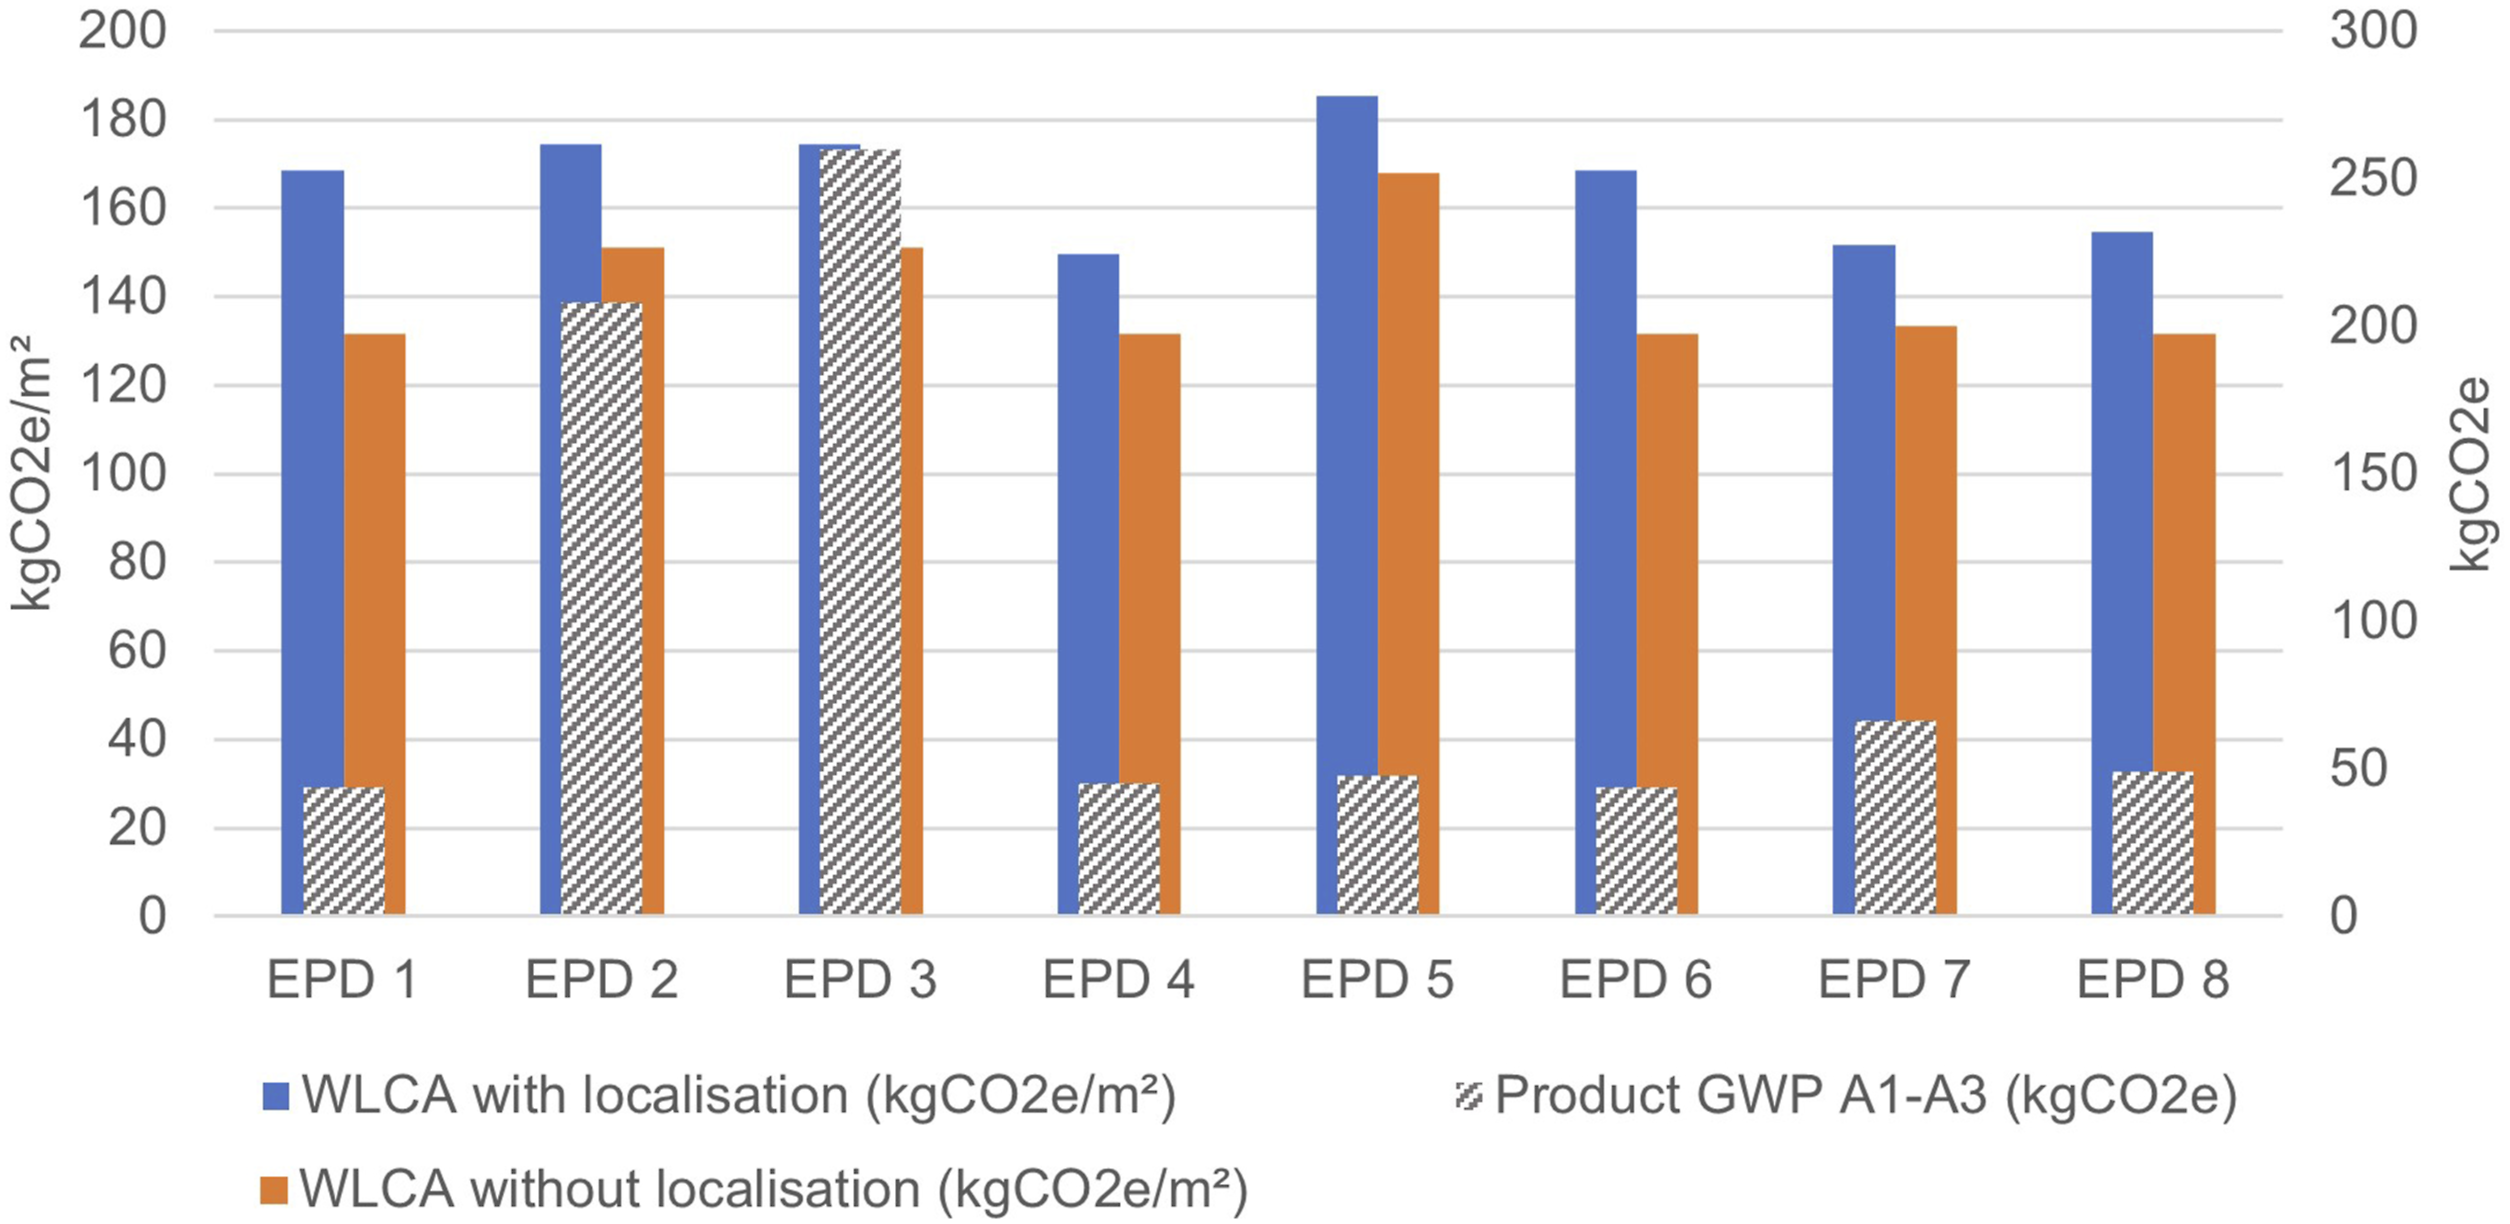
The carbon impacts in WLCA results of the building were coming from just A1-A3 and B1-B5 stages, the impact from other stages was not given in the results in One Click LCA. This means that the actual distance between the manufacturer and the case study area in Turkiye was not taken into account, which may not always be stated in rules and legislation. Given that the tool assigned similar product replacement and maintenance scenario for each EPS product, it can be understood that the localisation factor is only influential in the A2 stage in the building lifecycle, which should be considered when interpreting the results, considering the localisation factor.
The Localisation factor also showed the countries’ energy profile relationships with the case study context and the material source distance to the factory. It can be seen from Figure 11 that the difference between the highest and lowest impact EPS materials is approximately 80%. This variation is reflected in the whole life cycle assessment (WLCA) results, with a 5% variation with localisation and a 21% variation without localisation factor. This is because of the material portion involved during the retrofit. Insulation accounts for 17% of the total impacts in LCA, while OSB (wood) accounts for 38% (Figure 11). GWP by building element category.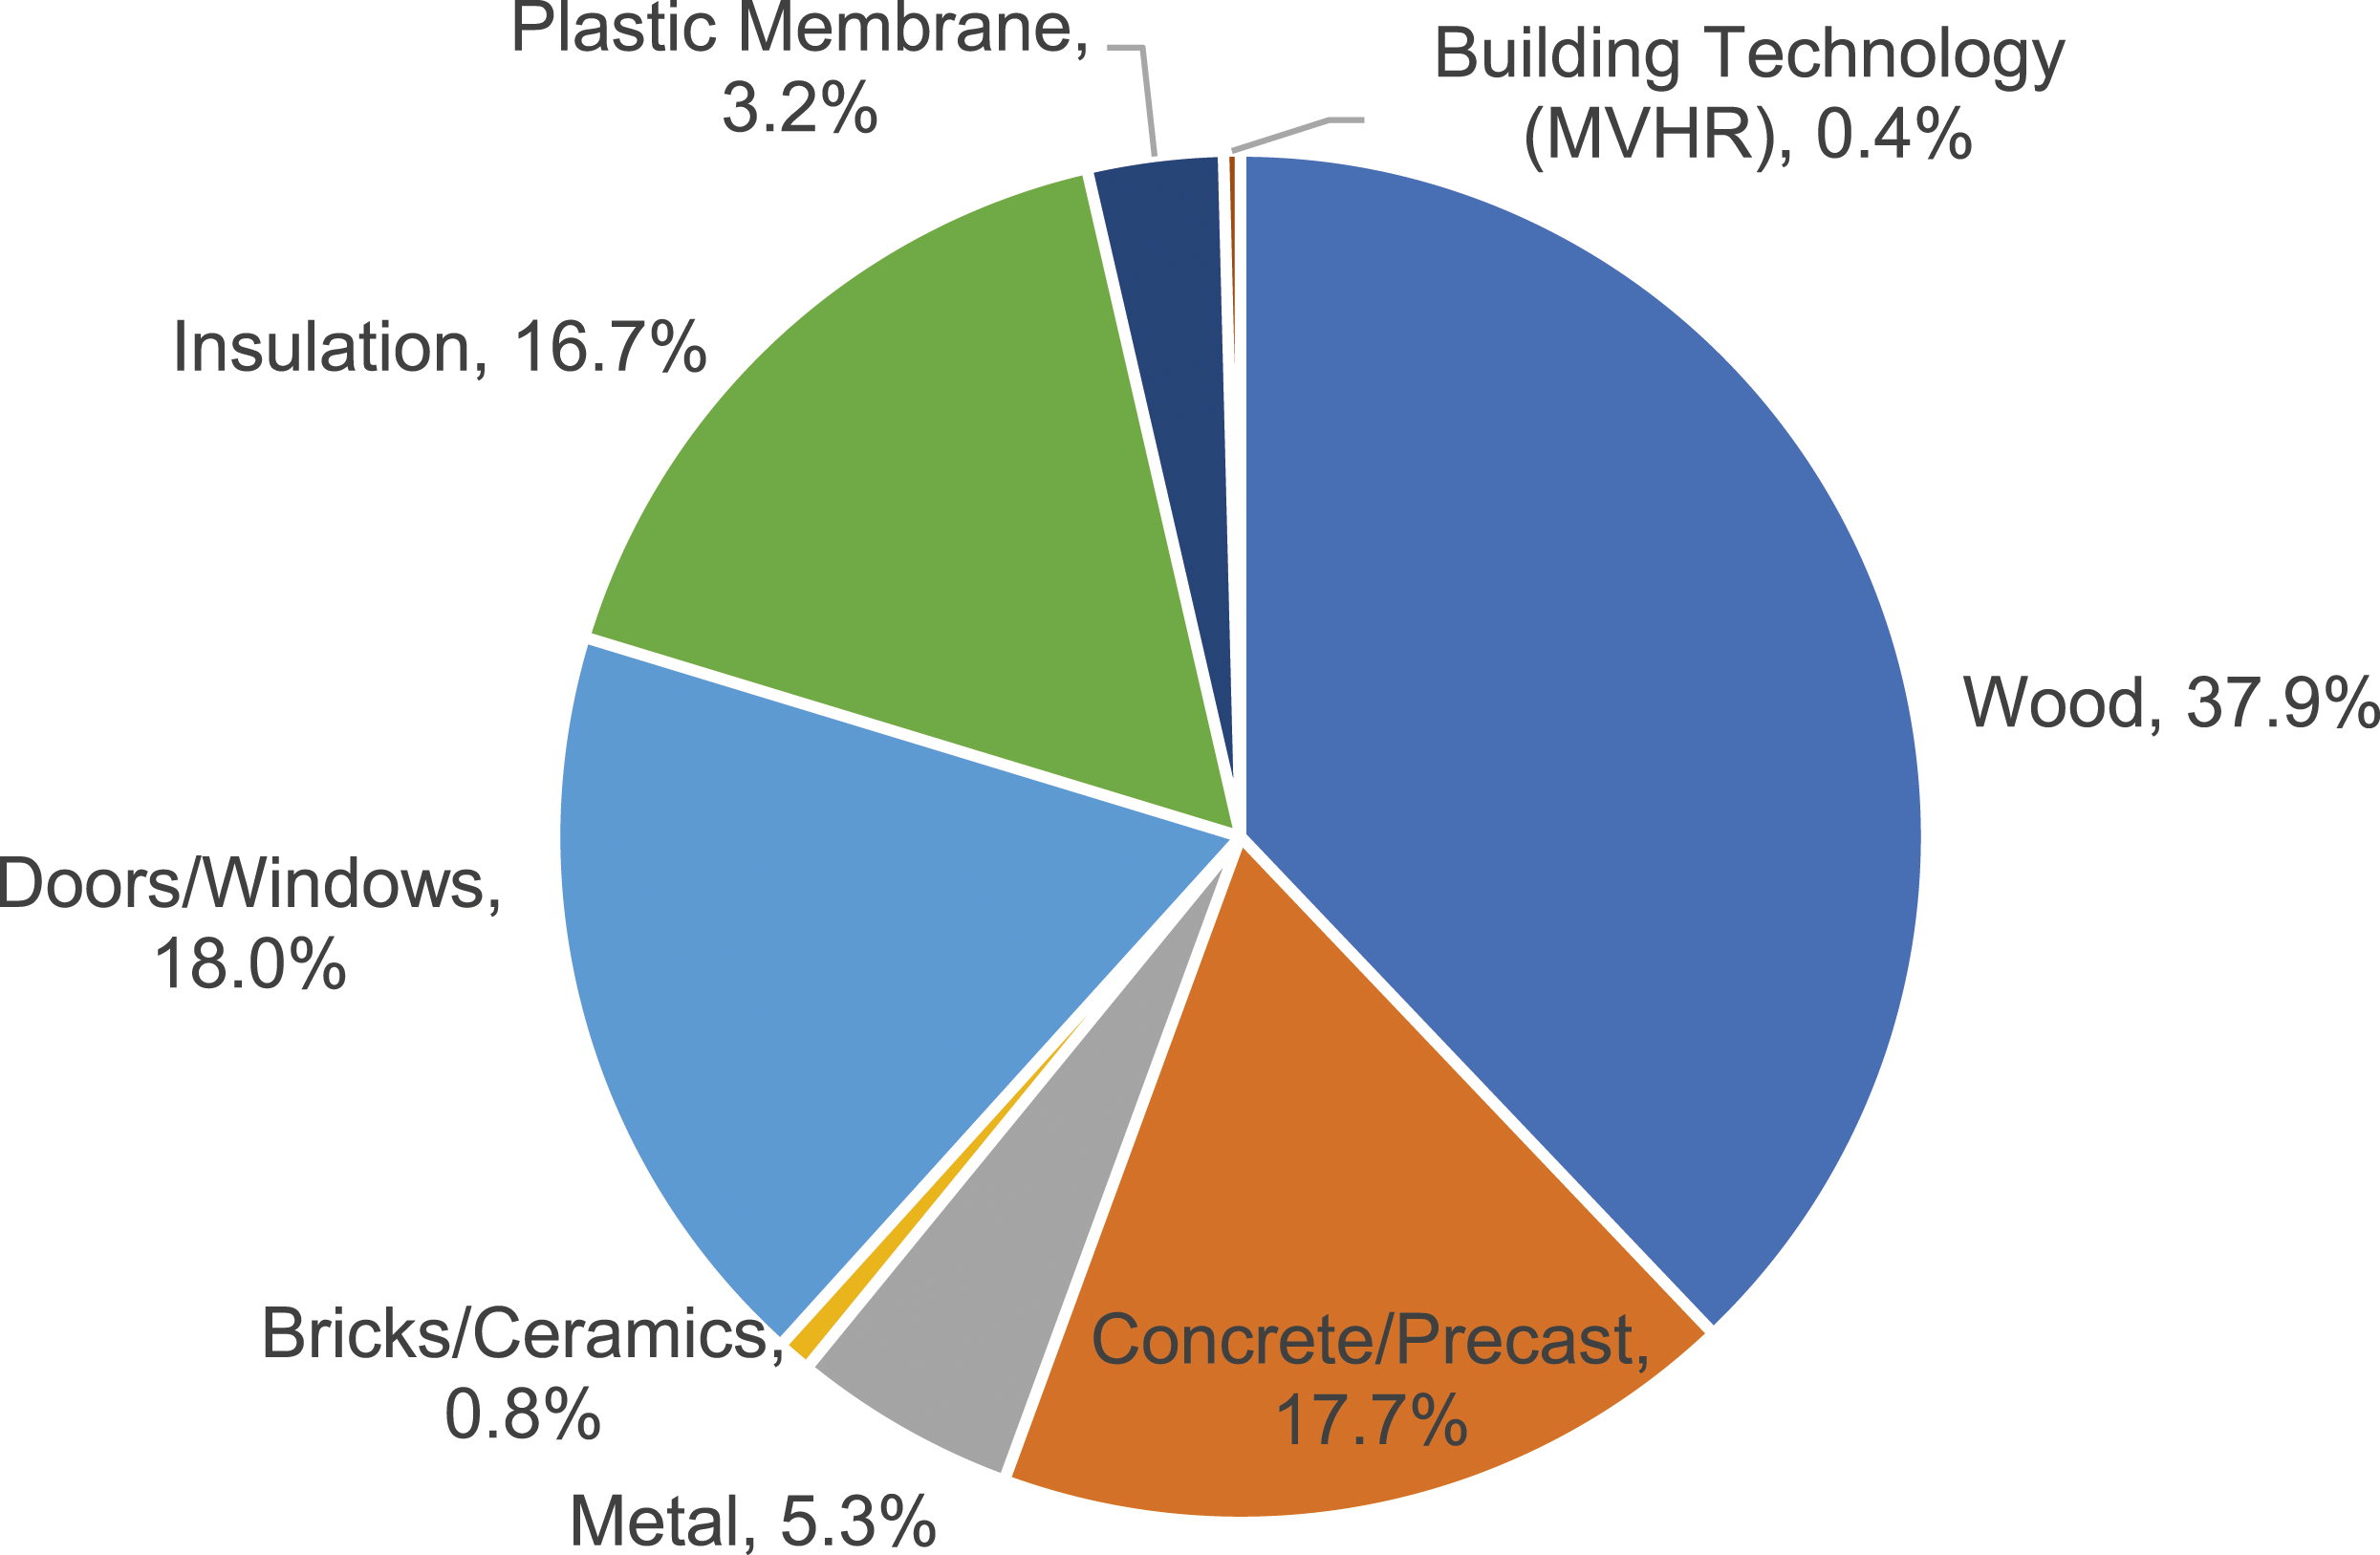
Comparison of A1-A3 modules with and without localisation factor in an LCA.
Discussion and summary
\While the literature studies looked into the variations between EPDs in different insulation materials,24,32 this study aimed to fill a gap by conducting a sensitivity analysis for the insulation materials with the same characteristics. An EPD selection methodology was also introduced based on the parameters viable for the LCA study and the validity of the EPDs (Figure 12). The functionality, thermal and physical properties of a product, especially for insulation, are important parameters in the methodology of selecting EPD for the calculations in order to fit the material purpose in building construction where these parameters can change for concrete, such as strength and mixture ratios become more prominent for the purpose of the material. This analysis showed that although there have been efforts to standardise EPDs to obtain more accurate results, differences between EPDs, even for materials from the same manufacturer, still cause significant variations in LCA results. These variations could impact retrofit decisions regarding carbon emissions compared to carbon savings during the building’s operational stage. This means if an insulation material was selected for a WLCA just based on its thermal and physical properties, without looking at whether it is low or high-impact material, at further steps, the carbon payback time could be very high, thereby questioning the ‘worthiness of retrofitting’ the building by the occupants or investors in order to lower carbon emissions which might be misleading. The LCA results and payback time in retrofit projects also represent a parameter to define the effectiveness of the retrofit methodology therefore, lower results are more desired.45–47 For the Turkish retrofit case, while the carbon payback time was 8 years in the lowest impact scenario, the payback time rose to 11 years in the highest impact EPD option. Suppose an uninformed decision on an EPD for a single material adds up to 3 years to the carbon payback time of a project. In that case, care should be taken when multiple materials are missing in an LCA context. EPD selection decision-making method.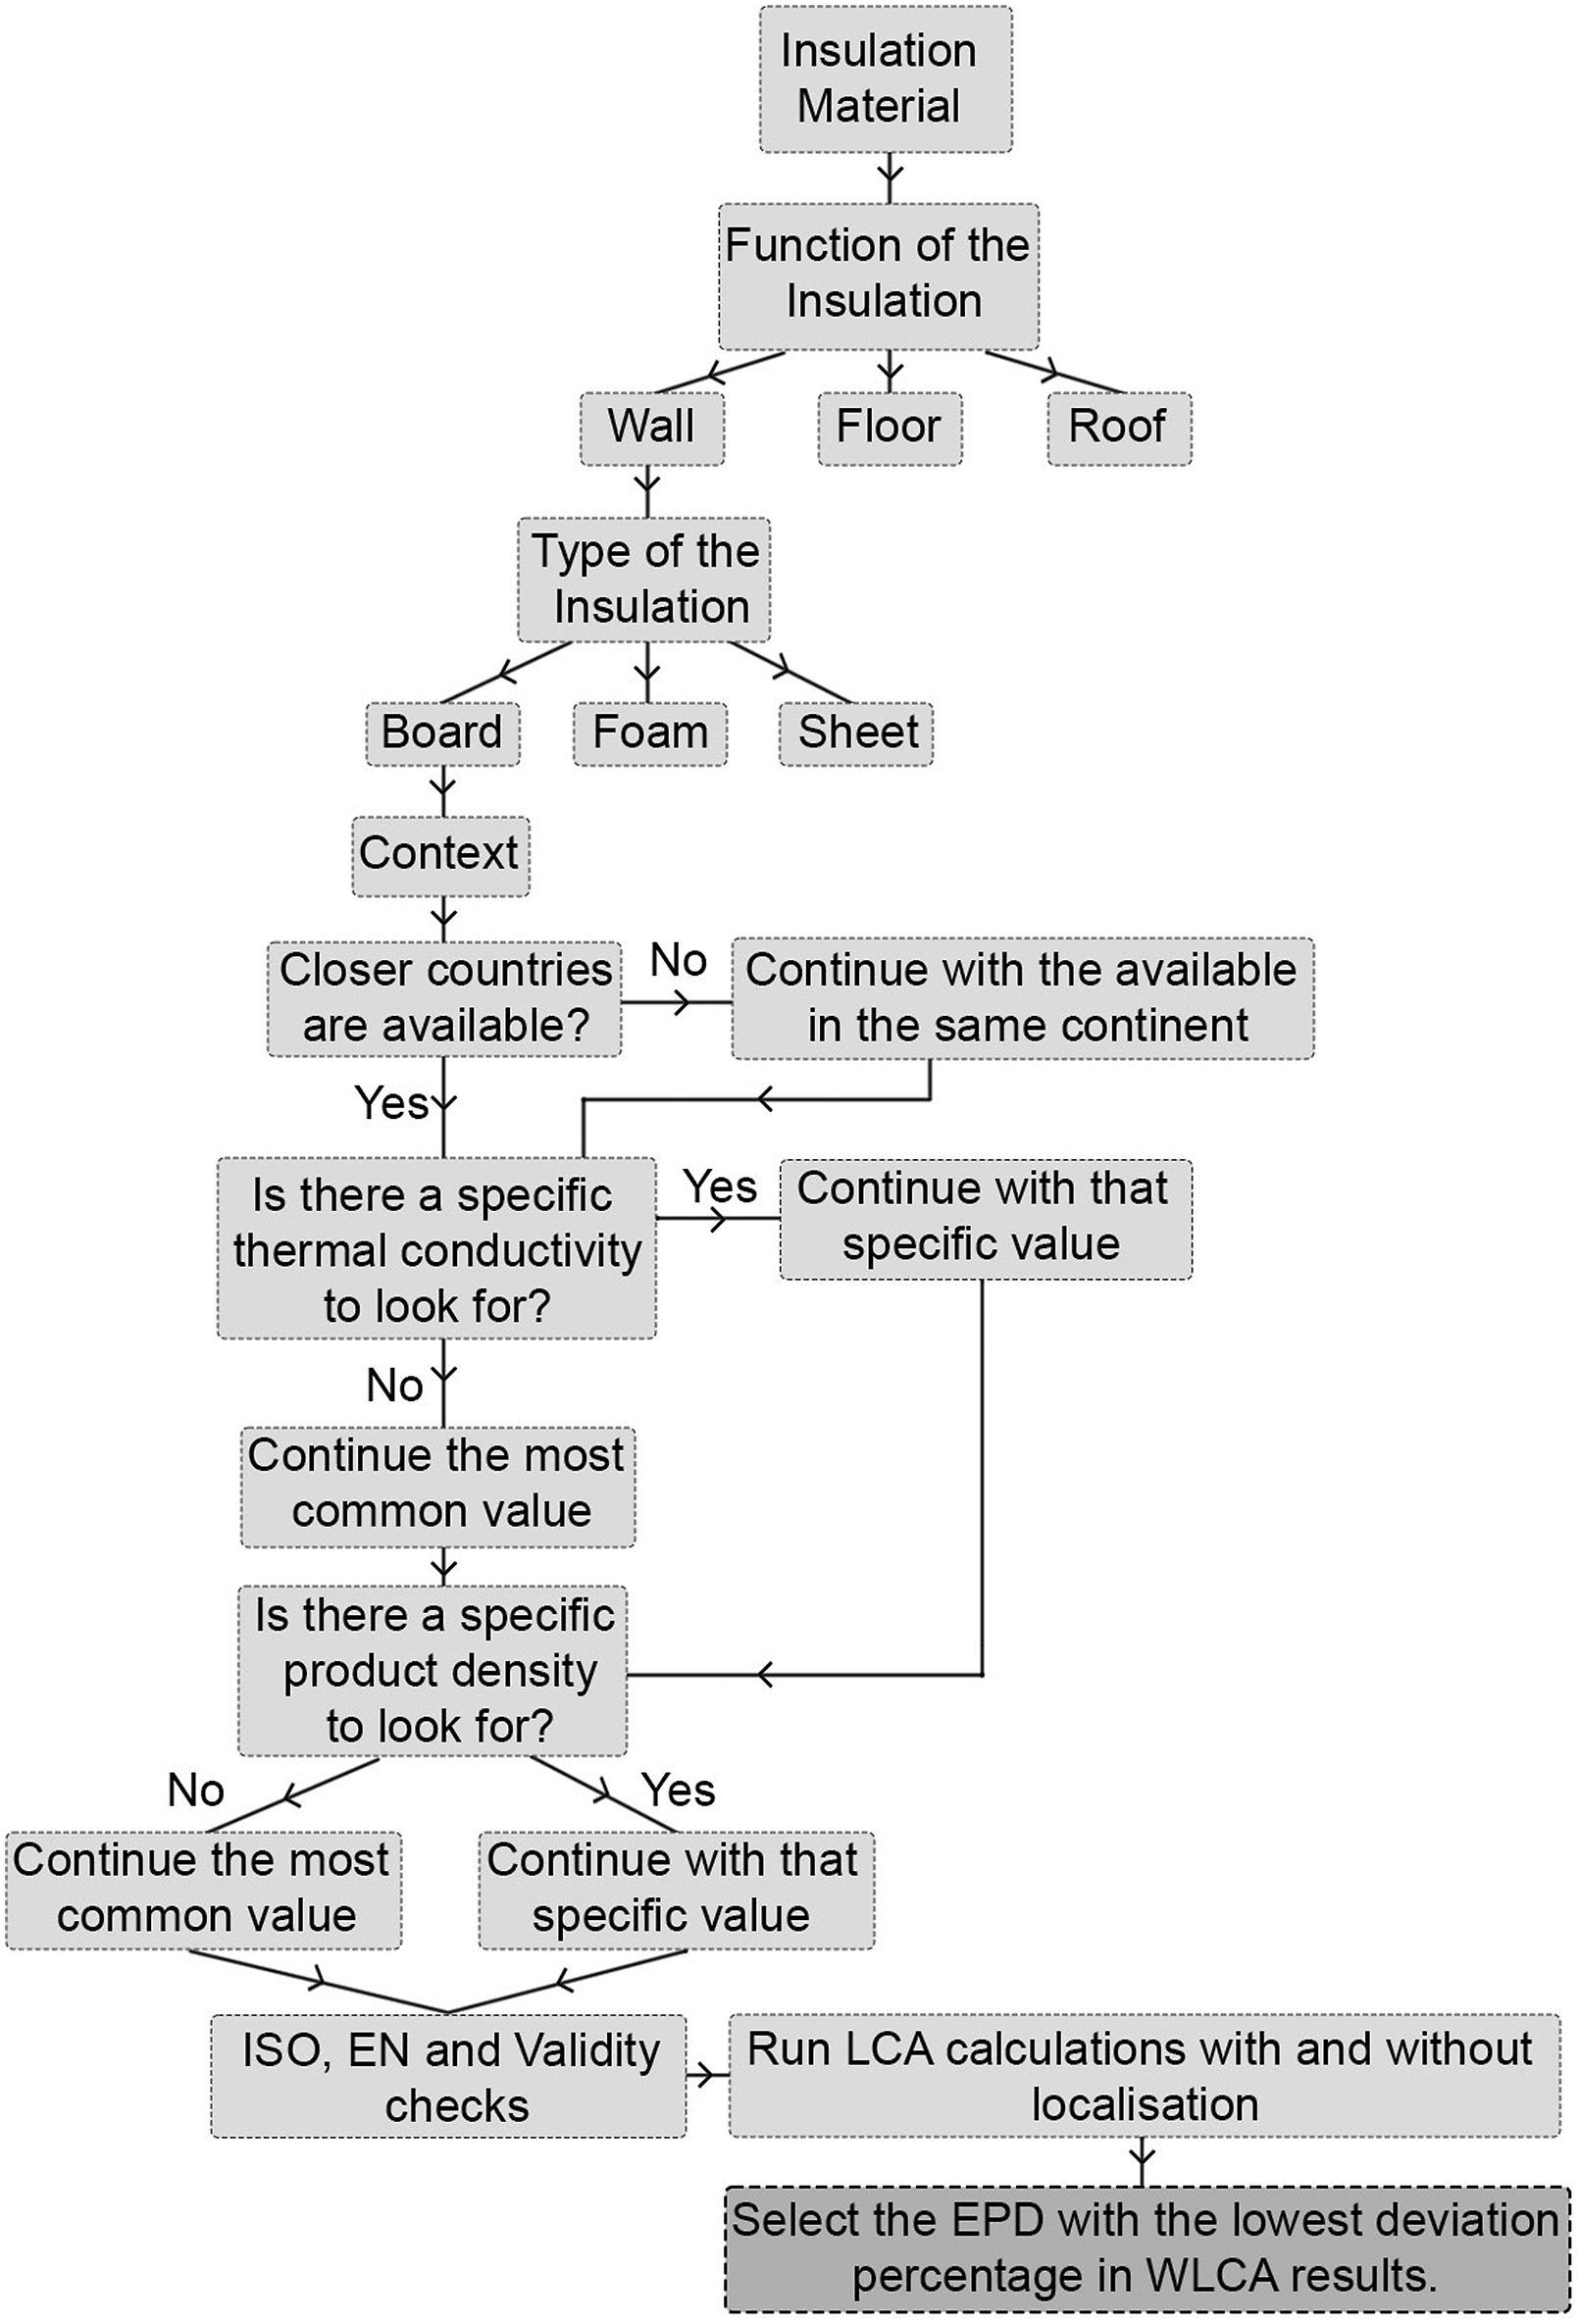
Choosing EPDs for a Turkish retrofit case study from countries such as Italy, Germany, and Ireland with grid carbon intensities similar to Turkey’s could provide more reliable results due to the lower deviations between the localisation factor enabled and disabled than EPDs from countries with relatively low grid carbon intensities like France. Lower deviation between localisation enabled or disabled shows that EPD is less affected by project location; thus, presumably a better option among other EPDs when EPDs are limited to a country location. However, this is not the only parameter to consider, the raw material transportation methods and distances could be similar to the Turkiye context that the deviation was much lower for these EPDs as well. Yet, comparing localisation factors during an LCA is essential in selecting EPDs one over another when they are unavailable in the case study country or region, regardless of missing information and not enough clarity in EPDs
Conclusion
Environmental Product Declarations (EPDs) are useful in conducting Life Cycle Assessment (LCA) studies to aid in making energy-efficient and low-impact decisions in the built environment. This study investigated the variations in EPDs for expanded polystyrene (EPS) using a widely applied LCA tool and its database. The results of the study led to the following conclusions; • Having a methodology for selecting EPDs when the LCA databases lack materials’ carbon information in the country of study helps decision-making. • The methodology checkpoints for insulation materials include product functionality, form, LCA context, thermal conductivity, density, ISO and EN compliance, and valid expiry date. Then, localisation factors for the selected EPDs were enabled and disabled to find the lowest deviation EPD among them for LCA calculations. • Differences in embodied carbon in EPDs can demonstrate a fourfold difference between the highest and lowest building impact results for the EPS insulation materials. • Whole life cycle assessment results displayed a 5% variation with the localisation factor and a 21% variation without the localisation factor, showing the effect of the emissions at the A2 stage (raw material transport) in LCA. • A material accounting for 17% of the total impact of a building can affect the embodied carbon impact results of around 400% when using a product EPD from another country’s origin. • Lastly, the results showed that the EPDs have not reached their full potential in terms of transparency and comparability to conduct LCA.
While the parameters that impact LCA results in EPDs have been identified,25,33 the information available in EPD reports is not sufficiently transparent to enable valid comparisons between EPDs for all parameters, particularly regarding material mix, energy mix used in extraction and production, manufacturing method, cut-off criteria, material source, and distance. Without this information, it is uncertain which parameter impacts the overall LCA most, making it difficult to explain the significant differences found in some LCA calculations. Although some improvements have been introduced, such as EN15808 + A2, which divides the Global Warming Potential (GWP) calculation into fossil, biogenic, and land use categories, other impact categories are still absent from EPDs. Therefore EPDs should move away from vague and descriptive content and should contain more comprehensive information that affects the LCA results. Given the current information and tools available, LCA studies represent estimates rather than absolute values. This is important at the building design stage for the LCA assessors to guide the design team regarding low-impact material selection from the practitioners' perspective.
Consequently, LCA results can show significant differences even for the same construction product when used outside its original manufacturing country. This affects material selection from one over to another without knowing what is happening in the background. As an approach to selecting EPDs, a quick sensitivity check between the localisation factors applied to EPDs from different countries and selecting the one most similar to the case study is likely to provide the most reliable results. However, this might be time-consuming, considering more than one material is unavailable to the LCA study context. Therefore, an additional feature in the LCA tools conducting this sensitivity analysis in the background and suggesting EPDs according to the location might be useful.
Further studies could investigate more detailed localisation factors that involve changing energy mixes at every step of an LCA, rather than just stage A4, to explore the effectiveness and validity of the method and possible improvements in results. Additionally, as this study was based on just one material, a future study could explore the variations in LCA studies when multiple materials are unavailable in a case study region or country.
Footnotes
Declaration of conflicting interests
The author(s) declared no potential conflicts of interest with respect to the research, authorship, and/or publication of this article.
Funding
The author(s) disclosed receipt of the following financial support for the research, authorship, and/or publication of this article: This research was funded by the Republic of Turkiye Ministry of National Education, Directorate General for Higher & Foreign Education, who supports one of the authors (DA).
CRediT author statement
Dilek Arslan: Conceptualization, Methodology, Software, Writing- Original draft preparation. Haniyeh Mohammadpourkarbasi: Writing, Reviewing and Editing. Steve Sharples: Writing, Reviewing and Editing.