
Abstract
The relationship between thermal comfort, building floor levels, and HVAC energy consumption in tropical high-rise residential buildings remains unclear. These buildings face heavy cooling demands due to their immense height and volume, as well as hot-humid weather found in the tropics. Architects and building developers understand that an increase in a building's floor count increases its energy requirements, but the impact on occupant thermal requirements and AC energy consumption needs further investigation. This study aimed to evaluate the relationship between passive thermal comfort, AC energy consumption, and floor levels in tropical high-rise residential buildings through survey and experimental methods. The results showed a significant relationship between thermal sensation votes and building floor levels, as well as AC energy consumption and floor levels. The study also found a strong correlation between thermal sensation votes and predicted mean votes, AC energy use, and predicted people dissatisfied. The optimal cut-off floors for thermal dissatisfaction according to (TSV) are 22nd floor and 8th floor in summer and monsoon seasons respectively. With a 90% sensitivity and 92% specificity. This research highlights the importance of addressing thermal comfort in high-rise buildings to improve energy efficiency and thermal comfort in tropical climates.
Highlights
• Floor level significantly influenced the occupant’s thermal sensation votes (TSV) and PMV • There is a significant positive relationship between TSV and AC energy consumption • There is a significant relationship between TSV and PMV but this is stronger in Summer • Floors 22nd and 8th emerged as the cut-off floors where most occupants voted for dissatisfaction during summer and monsoon seasons respectively • The following regression model is derived for predicting new values of predicted mean vote during summer Predicted mean Vote = 2.897 – 0.070*Floor level
Practical Application
The findings of this study applies for an optimal design, the high AC energy consumption in high-rise residential buildings during summer can be reduced when the buildings are designed with the identified discomfort thresholds in mind. Also, since higher floors provide more opportunity for passive comfort, lower floors could benefit from a prioritized, passive façade design allowing for greater comfort as against the typical same design from down to up.
Introduction
The definition of a high-rise building can vary depending on factors like region and purpose. The Council on Tall Buildings and Urban Habitat (CTBUH) defines it as a multi-story structure with a height that creates unique design, construction, and usage challenges. 1 The US National Fire Protection Association (NFPA) defines it as a building typically over 75 feet tall, requiring elevators for vertical transport. 2 The International Building Code specifies it as a building over 75 feet with occupied floors above street level. 3 Further, The CTBUH further categorizes tall buildings as “tall” (under 300 m), “super-tall” (300 m or more), and “mega-tall” (600 m or more). 4 In India, the national building code defines a “high-rise” as a building over 15 m in height from the ground to its highest point. Ultimately, high-rise buildings are characterized by multiple vertically stacked floors and can have various uses.
Thermal comfort is described as the mental state indicating contentment with the surrounding temperature conditions. 5 It is determined through subjective assessment and pertains to one’s satisfaction with the thermal environment. 6 Several factors, both environmental and physiological, can impact the indoor thermal comfort in a given space. According to Fanger, 7 it represents a person's sense of well-being in relation to the thermal conditions, influenced by variables such as air and radiant temperature, air movement, humidity, and individual factors like clothing level and the body’s metabolic rate at the specific moment. Predicted Percentage Dissatisfied (PPD) is an index that establishes a quantitative prediction of the percentage of thermally dissatisfied people who either feel too cool or too warm in a building. For the purposes of ISO 7730, thermally dissatisfied people are those who will feel “hot” (+3), “warm” (+2), “cool” (−2) or “cold” (−3) while thermally satisfied people are those who will feel “fairly warm” (+1), “normal” (0) or “fairly cool” (-1) in a given indoor space. Predicted mean vote (PMV) is a widely used index that predicts the mean vote of a group of people voting on how comfortable they are in an environment. PPD is generally regarded as a function of PMV.
HVAC (which stands for “heating, ventilation, and air conditioning”) refers to the technology and systems used to provide thermal comfort and improve indoor air quality in buildings. The US Department of Energy defines HVAC as systems that are used to provide thermal comfort and acceptable indoor air quality in buildings and other enclosed spaces. 8 The heating/cooling component of HVAC systems is responsible for maintaining a comfortable temperature and humidity levels within a building, while the ventilation component is responsible for providing fresh air and removing stale air, smoke, and odors. HVAC systems can be found in residential, commercial, and industrial buildings, and are designed to improve the comfort and health of occupants, as well as the energy efficiency of buildings.
Background to the study
High-rise dwellings have become a popular option for meeting the increasing demand for urban housing. While tall buildings offer many advantages, they also present unique challenges related to thermal comfort and energy consumption. Tropical climates are characterized by high temperatures, high humidity, and intense solar radiation. 9 In such environments, maintaining thermal comfort can be a significant challenge. The human body has a natural tendency to maintain a core temperature of around 37°C 10 and when the external environment exceeds this temperature, we experience discomfort. This discomfort can result in decreased productivity and a higher risk of heat-related illnesses. 11
Thermal comfort in a high-rise building can be achieved by a wide range of factors, including proper building orientation, use of atriums, use of external shading devices, use of efficient air conditioning systems, use of energy efficient lighting and appliances, use of renewable energy sources, and adaptive occupant behaviors amongst others. 12 Optimal thermal comfort could be achieved where these factors are intentionally and carefully balanced. However, in many tropical regions, intensive air-conditioning is used instead, to maintain comfortable temperatures, which results in significant energy consumption and associated greenhouse gas emissions. Passive design strategies are design approaches that can be used to minimize the impact of external environmental factors on indoor temperatures. 13
The subject of achieving thermal comfort passively in high-rise buildings has been considered increasingly in recent research works. Popular high-rise Architect and researcher, Ken Yeang has proposed, designed and developed ‘bio-climatic’ high-rise structures that attempt to take flora from the ground level up to the sky to create an unbroken connection. Yeang’s works also adopt massing strategies that ensure the entire tall building internal environment are broken down into smaller self-sufficient ecosystems as they tower up the sky. Yeang’s designs integrate sky courts, the peripheral positioning of service cores as solar buffers and the use of natural ventilation in transitional areas - such as the lift and ground floor lobbies. These ‘bio-climatic' forms also use vertical vegetation and sun shading to minimize heat gain and thus reduce demand for HVAC. The question of whether a high-rise building can be naturally ventilated and to what floor level this is possible is a currently relevant one, especially for developers looking to implement passive technologies in high-rise apartment towers. The Council On Tall Buildings and Urban Habitats, CTBUH summarizes this as the “sustainability threshold” in 14 . This threshold would be the height or floor count level beyond which additional height would not make sense on sustainable grounds and likely cost grounds as well.
Several studies have evaluated the performance of the indoor environment with respect to the thermal comfort of the occupants at different floor heights. The air flow and heat exchange mechanism in high-rise buildings differ from that in low rise buildings because air pressure and wind patterns vary at different altitudes. High-rise buildings are exposed to stronger and more variable wind patterns than low-rise buildings due to their far reach into the atmosphere. In high-rise buildings, the stack effect becomes more pronounced due to the taller chimney-like structure. Warm air rises within the building, creating a pressure difference that can drive natural ventilation. This can be advantageous for exhaust and cooling purposes. Low-rise buildings also experience the stack effect, but to a lesser extent, as the height differential is not as significant. However, the boundaries of this difference remain yet unclear in many aspects. High-rise building developers are yet to understand fully how these variations tend to occur in different climatic regions. The question remains; “At what height or range of floor elevation within or beyond which it becomes impossible to achieve passive thermal comfort in a tall residential building?
Statement of research problem
Due to their significant height and size, as well as the presence of hot-humid weather, residential high-rise buildings in the tropics encounter a distinct energy challenge related to substantial cooling requirements. In tropical regions, with alternate wet and dry seasons and usually year-round intense sunlight, tall buildings demand more cooling energy to maintain a comfortable indoor temperature range due to several factors, such as high humidity levels 15 and intense sunlight. 16 Higher altitude wind speeds and turbulence also reduce the possibility of natural ventilation in tall buildings. 17 Overall, these factors contribute to increased cooling loads of tall residential buildings.
Recent studies have shown that high-rise buildings require more energy to build and operate. 18 Studies also show that this high-energy demand is highly associated with the heating, ventilation and air conditioning (HVAC) requirements of the buildings. 19 Researchers understand that an increase in a building’s floor count also increases its energy requirements but so far, there is no known floor threshold within which residential high-rise buildings can be passively cooled or beyond which it becomes impractical to cool without intensive use of air conditioning.
Aim of the study
The aim of this study was to evaluate the relationship between passive thermal comfort, AC energy consumption and floor levels in tropical high-rise residential buildings through an in situ field condition study with a view to determining the optimal height threshold for achieving passive thermal comfort and thus reducing AC energy consumption. The Objectives of the study include; • To determine passive thermal comfort in different floors of tropical high-rise residential buildings using thermal sensation votes (TSV). • To determine passive thermal comfort in different floors in tropical high-rise buildings using predicted mean votes (PMV). • To determine the relationship between TSV and PMV at different floors in tropical high-rise residential buildings. • To determine the relationship between TSV, AC energy consumption and PMV at different floors in tropical high-rise residential buildings. • To determine the optimal floor threshold for passive thermal comfort in tropical high-rise residential buildings.
Research design and methodology
Study area: Chennai
Weather
The cases for study are located in Chennai, India within the hot-humid tropical (Aw) climatic region. High temperatures, high humidity, and intense solar radiation are common conditions throughout the year.
Figure 1 above shows the average annual temperature of Chennai over a period of 10 years. From October through December, the city receives monsoon rains which makes the weather rather cool, while the remaining months of the year are hot and dry. Normally, the temperature is between 82°F and 104°F (28°C to 40°C), with significant humidity. The hottest months occur between May, June and July. Chennai Annual Temperature data. Source: EPW weather data from https://energyplus.net/visualized with Climate consultant.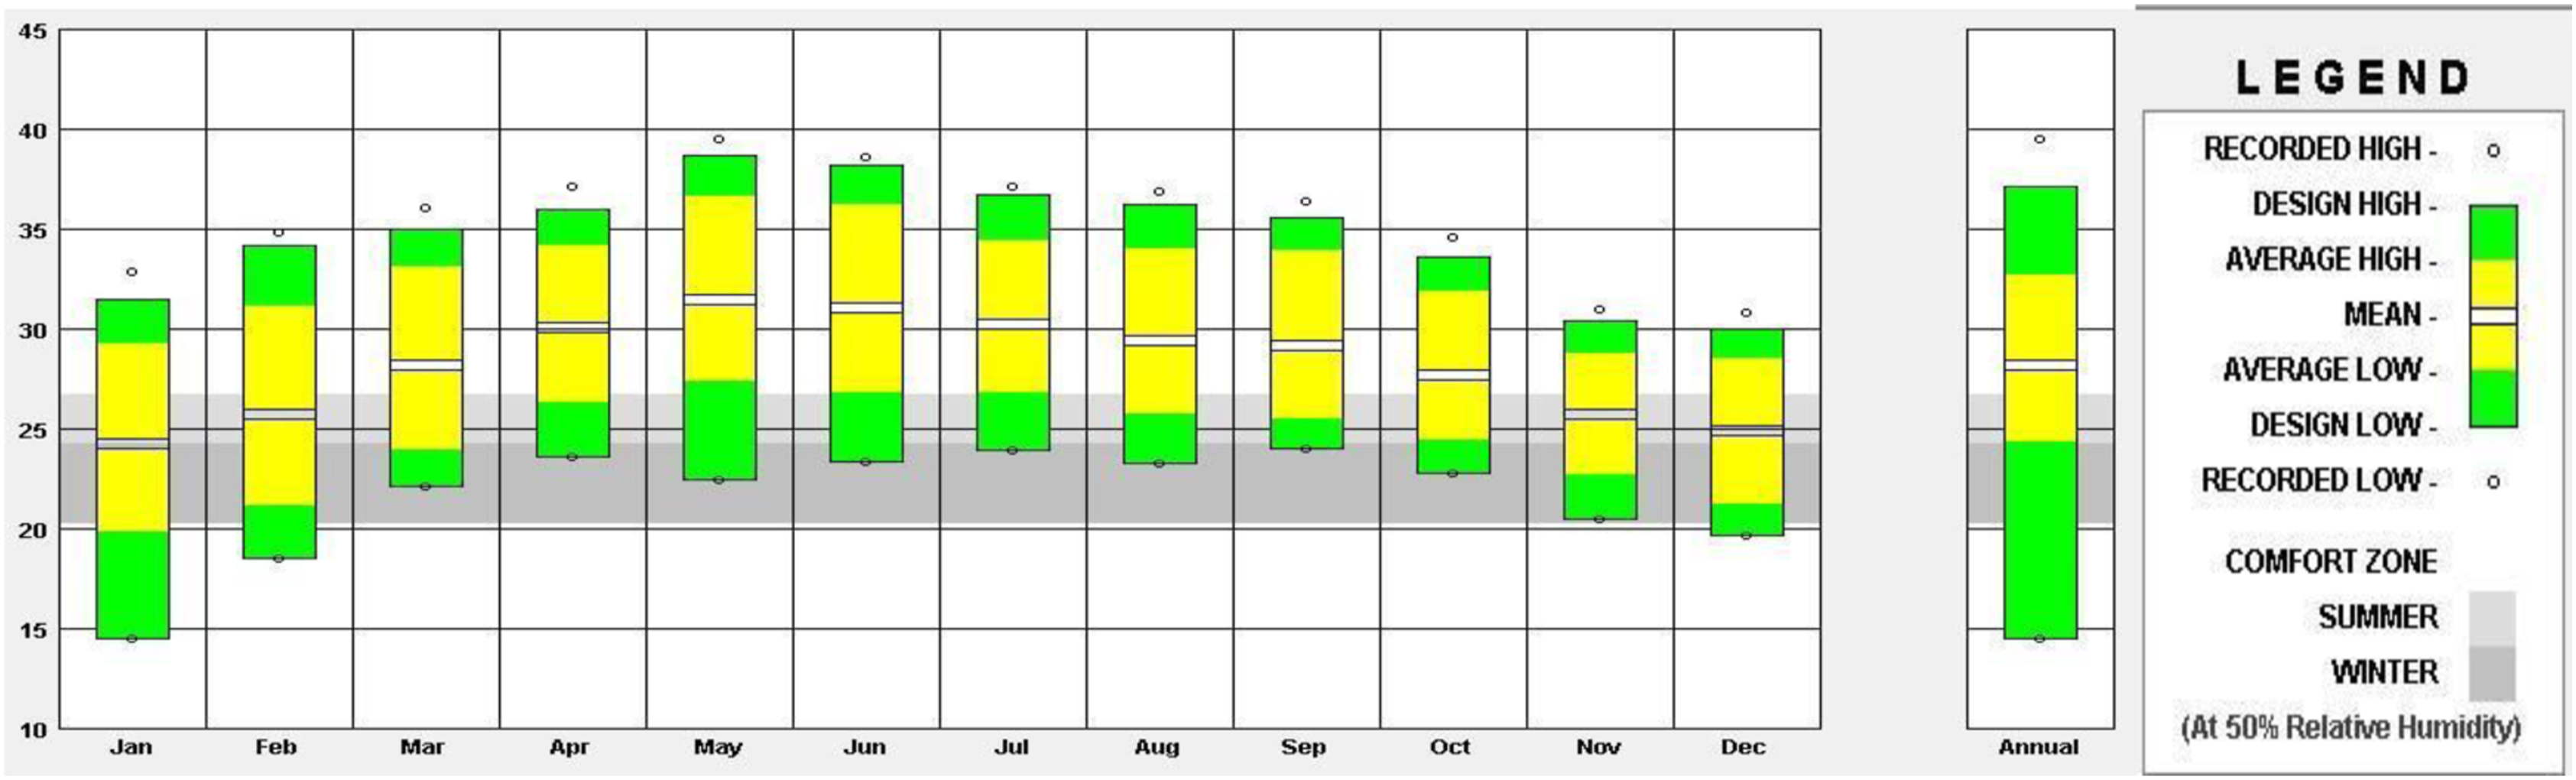
The prevailing wind direction in Chennai, India is from the north-easterly direction during the monsoon months (October to February) and from the south-westerly direction during the summer months of March to September. 20 The north-east monsoon winds bring rain to the region from October to December, while the southwest monsoon winds bring rain from June to September. Furthermore, the maximum value for surface wind velocity range for Chennai is recorded in July whilst the lowest values are recorded in January, October and November. 21 The average monthly day temperatures for the months of study (which are; December and May) in Chennai were 81°F and 90°F respectively while the average monthly wind speed and air humidity were Dec 2022 (10.1 mph, 82%) and May 2023 (9.4 mph, 75%). Chennai experiences generally dry weather with winds b lowing from either the north-east or south-west depending on the time of year. Hence, the impact of wind speed on indoor thermal conditions can be more tangible for the apartments towards the north-east or south-west orientations during the respective seasons. Thus, in order to ensure that the best case conditions are studied, responses from apartments in N-E and S-W orientations were prioritized for the study and recorded for the respective seasons.
Topography
Chennai is a city located on the east coast of India and has a mostly flat topography, with an average elevation of about six (6) meters above sea level. 22 The city of Chennai is characterized by a flat coastal plain with alluvial soil, interspersed with small hills and ridges of crystalline rocks. 23 The study assumed all the buildings to be on a plain for the purpose of floor level calculations.
Study population and sampling
The House of Hiranandani complex at Egathur, Chennai was selected as case study due to its ranking by the CTBUH as well as its convenience of study as a purpose-built gated community hosting multiple contemporary high-rise apartment buildings.
The study population consists of twelve (12) selected high-rise apartments within the gated community, with similar plan configurations and designed with a common theme. Figure 2 shows an aerial view of the complex. The Single–Stage Cluster Sampling Technique was used to select samples for the study.
25
The total number of occupied apartments was 1,424 as at this study. Aerial view; House of Hiranandani, Egathur. Source:
24
.
Distribution of sample buildings
Figure 3 shows the occupancy distribution of the studied buildings. Informed consent for access to the homes was sought and obtained from the apartment occupants. Clustered bar chart: Total Number of Apartments and occupancy distribution as at Dec 2022. Source; Field work.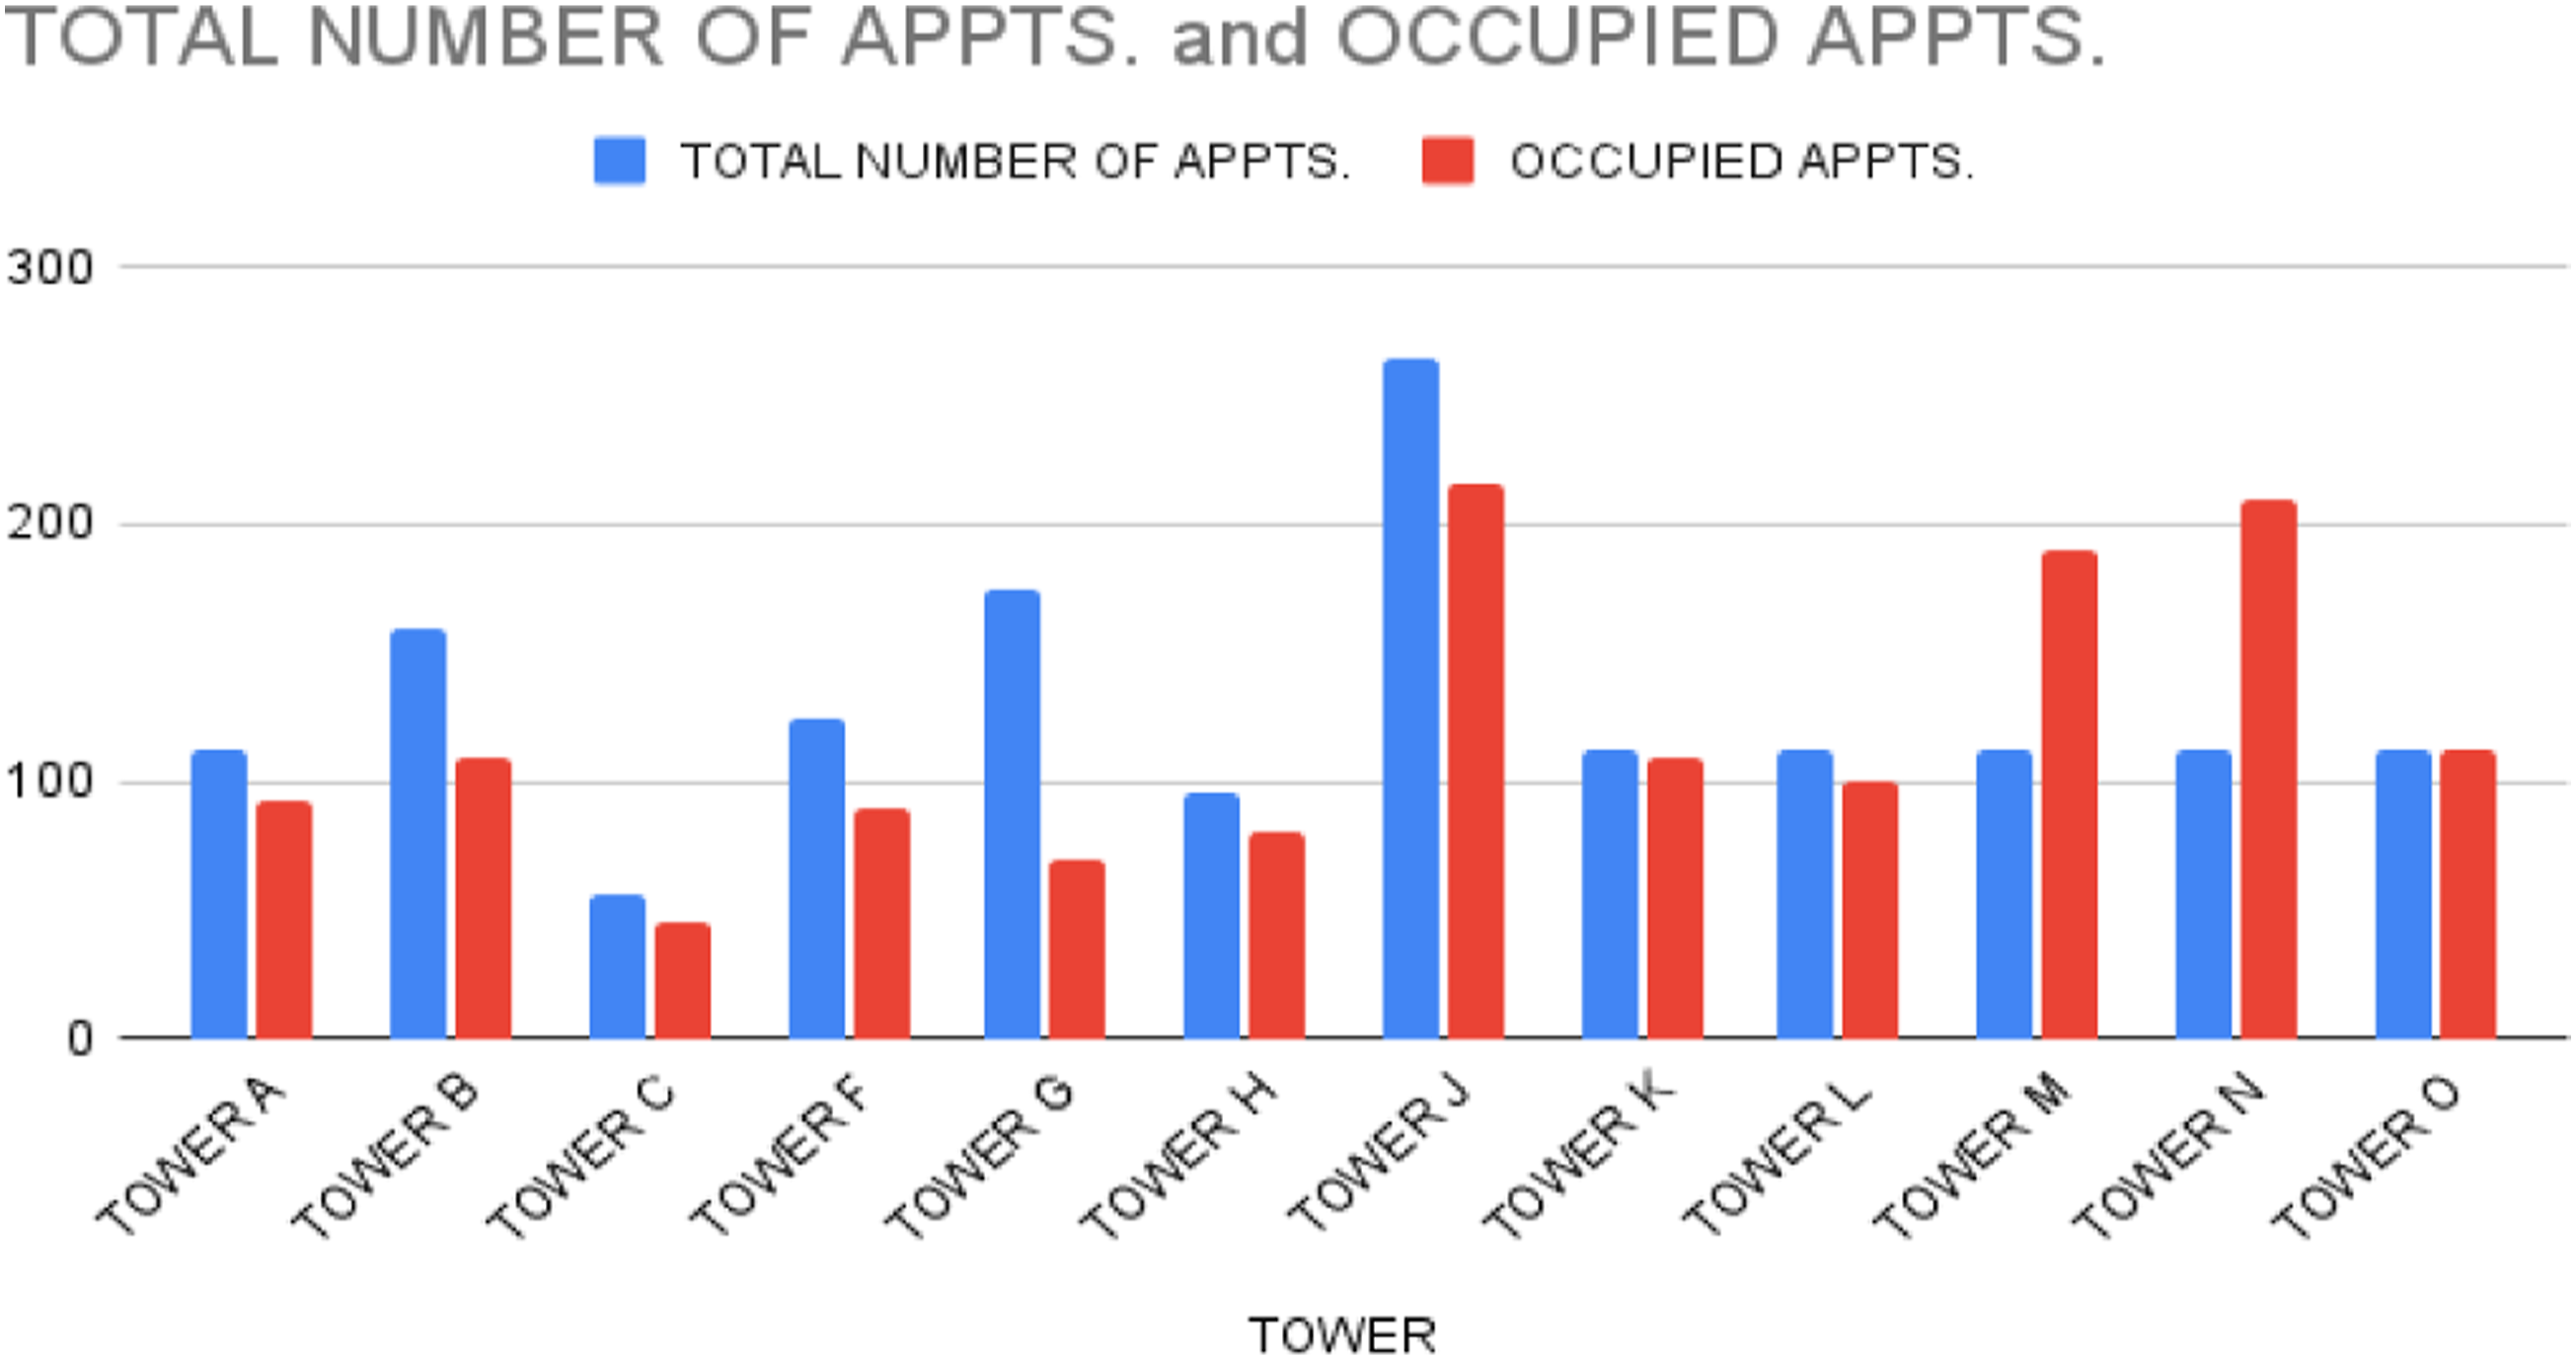
431 occupants gave their consent before the schedule of measurements were drawn up. A total of 384 valid responses were collected for the both seasons while a total of 47 homes were either not available, gave incomplete/incoherent responses or declined access at the time of the study.
Schedule of measurements
The study was conducted within a period of two (2) weeks in the months of December and May representing the cold and hot seasons of Chennai respectively. For each consenting household, responses and measurements were collected from two bedrooms in the chosen orientation for the given season.
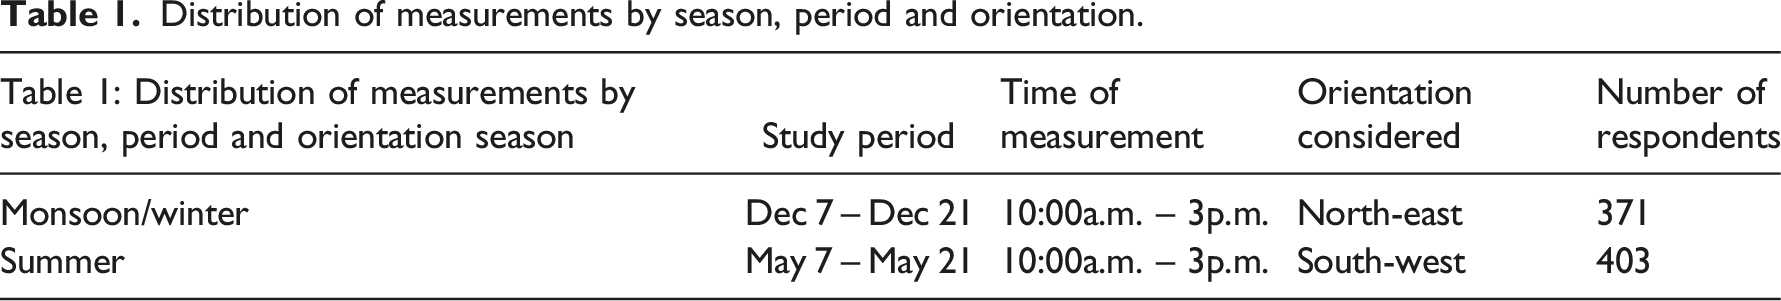
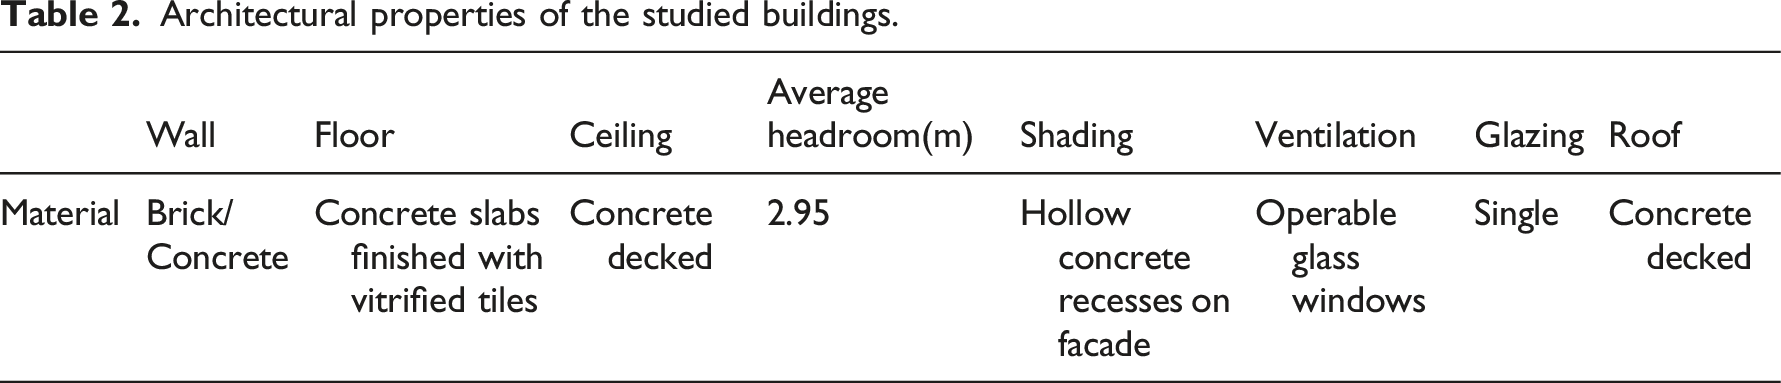
Plate 1 shows the distribution of floors studied across the twelve (12) towers in summer and winter. Table 1below is a chart showing the distribution of measurements by season, period and the orientation of the apartments studied while Table 2 shows the architectural properties of the studied buildings. Response distribution matrix for both seasons. Distribution of measurements by season, period and orientation. Architectural properties of the studied buildings.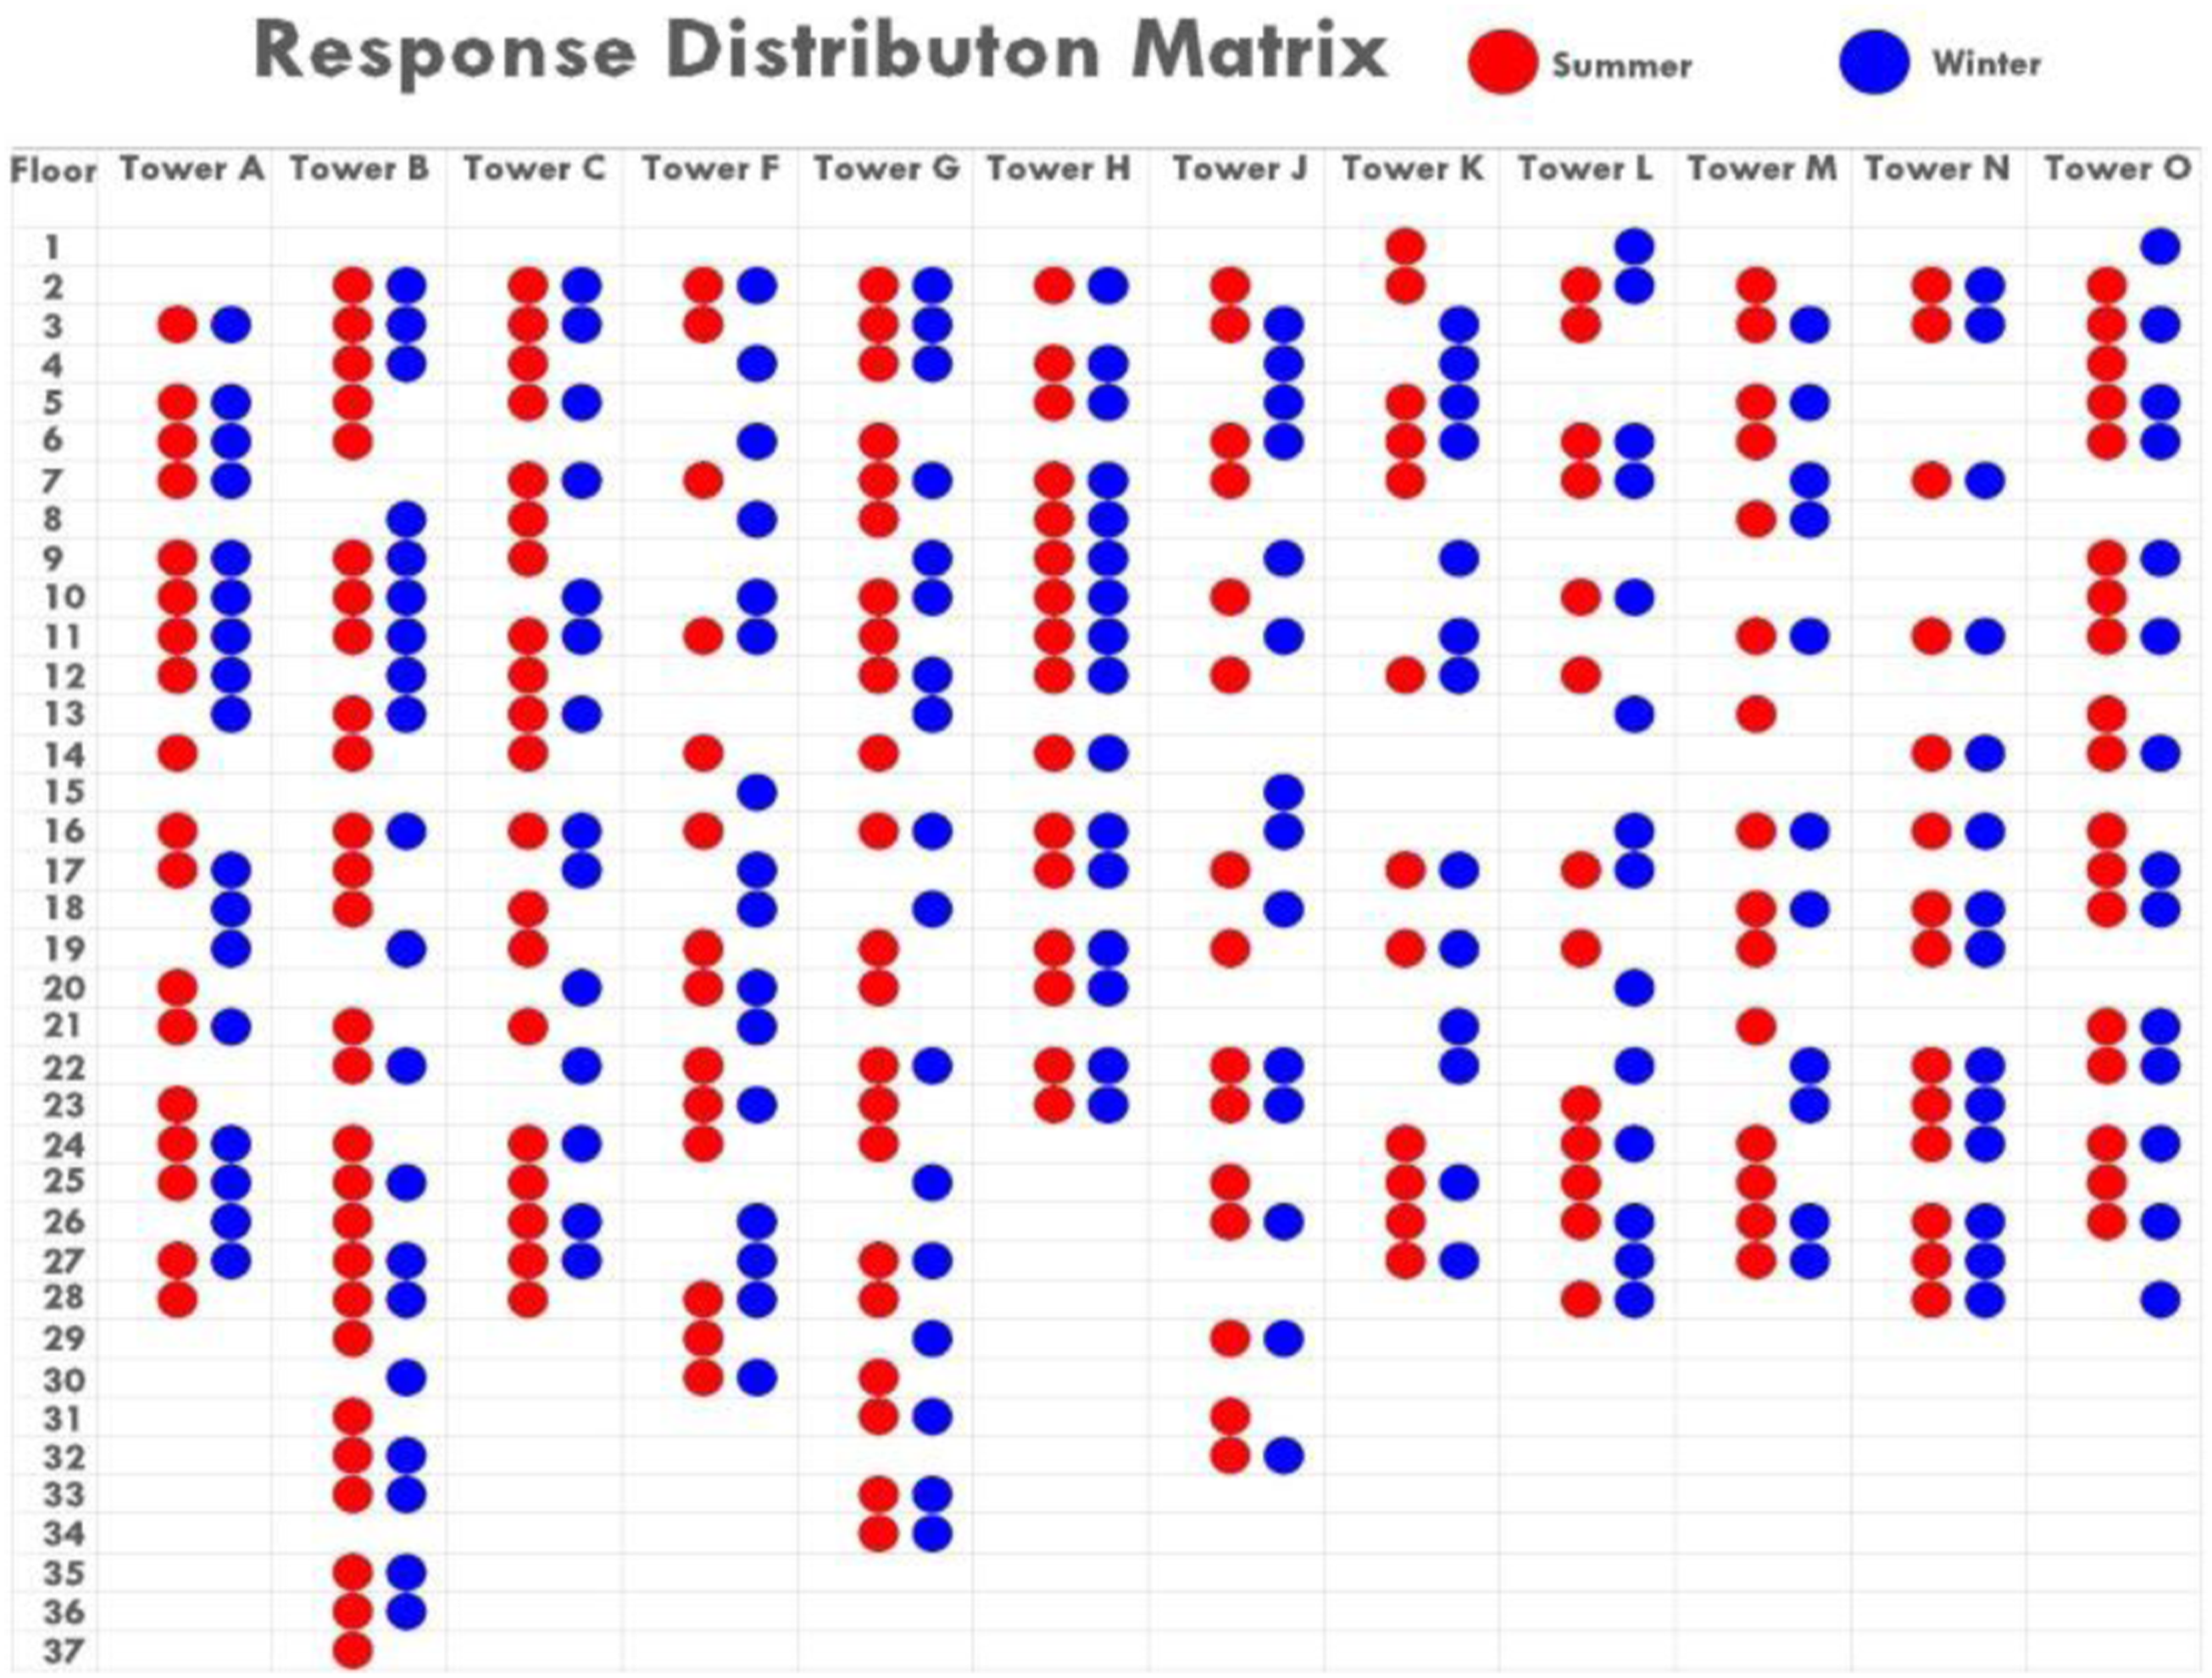
The subjects were made to respond to the survey while seating in a quiet (sedentary) position and wearing clothing they deemed most appropriate for their current thermal sensations. All mechanical cooling appliances (fans and ACs) including heat-producing devices such as televisions and laptops were turned off and all windows were kept open to ventilate the apartment naturally for about ten to fifteen (10-15 min before collecting the thermal sensation votes and PMV/PPD readings. Readings were taken at intervals of approximately fifteen (15) minutes between floors. Only one apartment was chosen from the best orientation on each floor for each season.
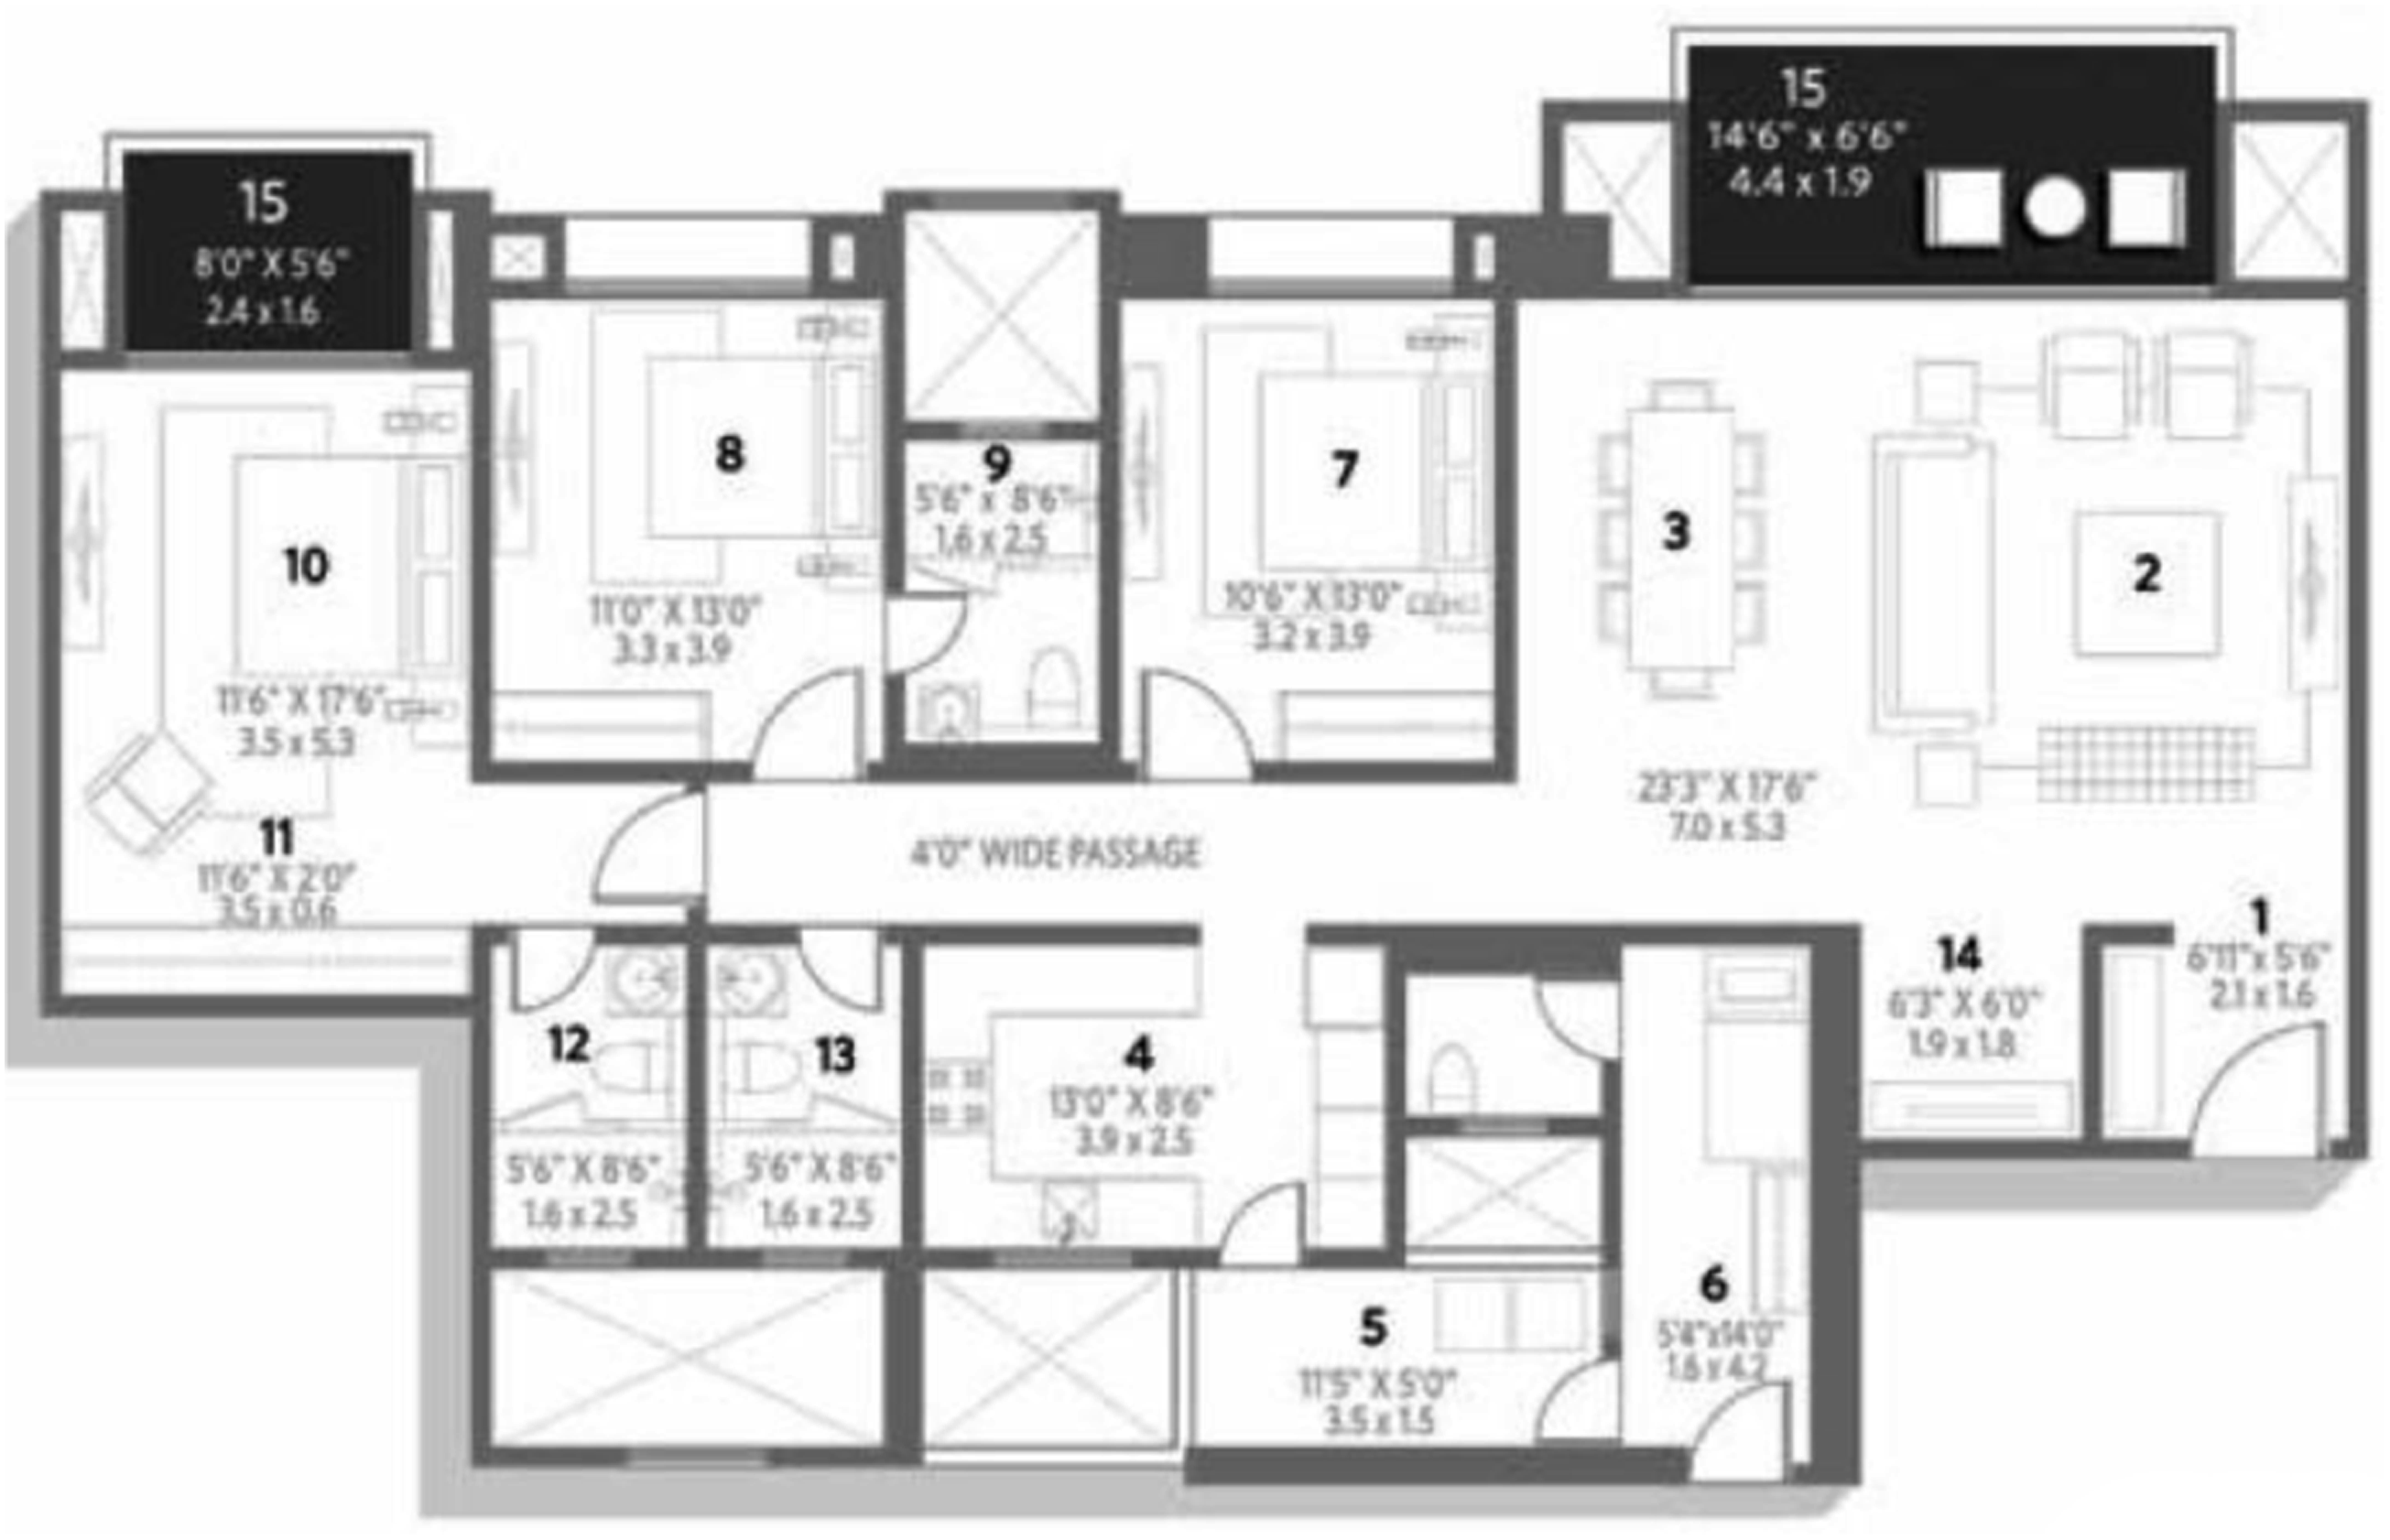
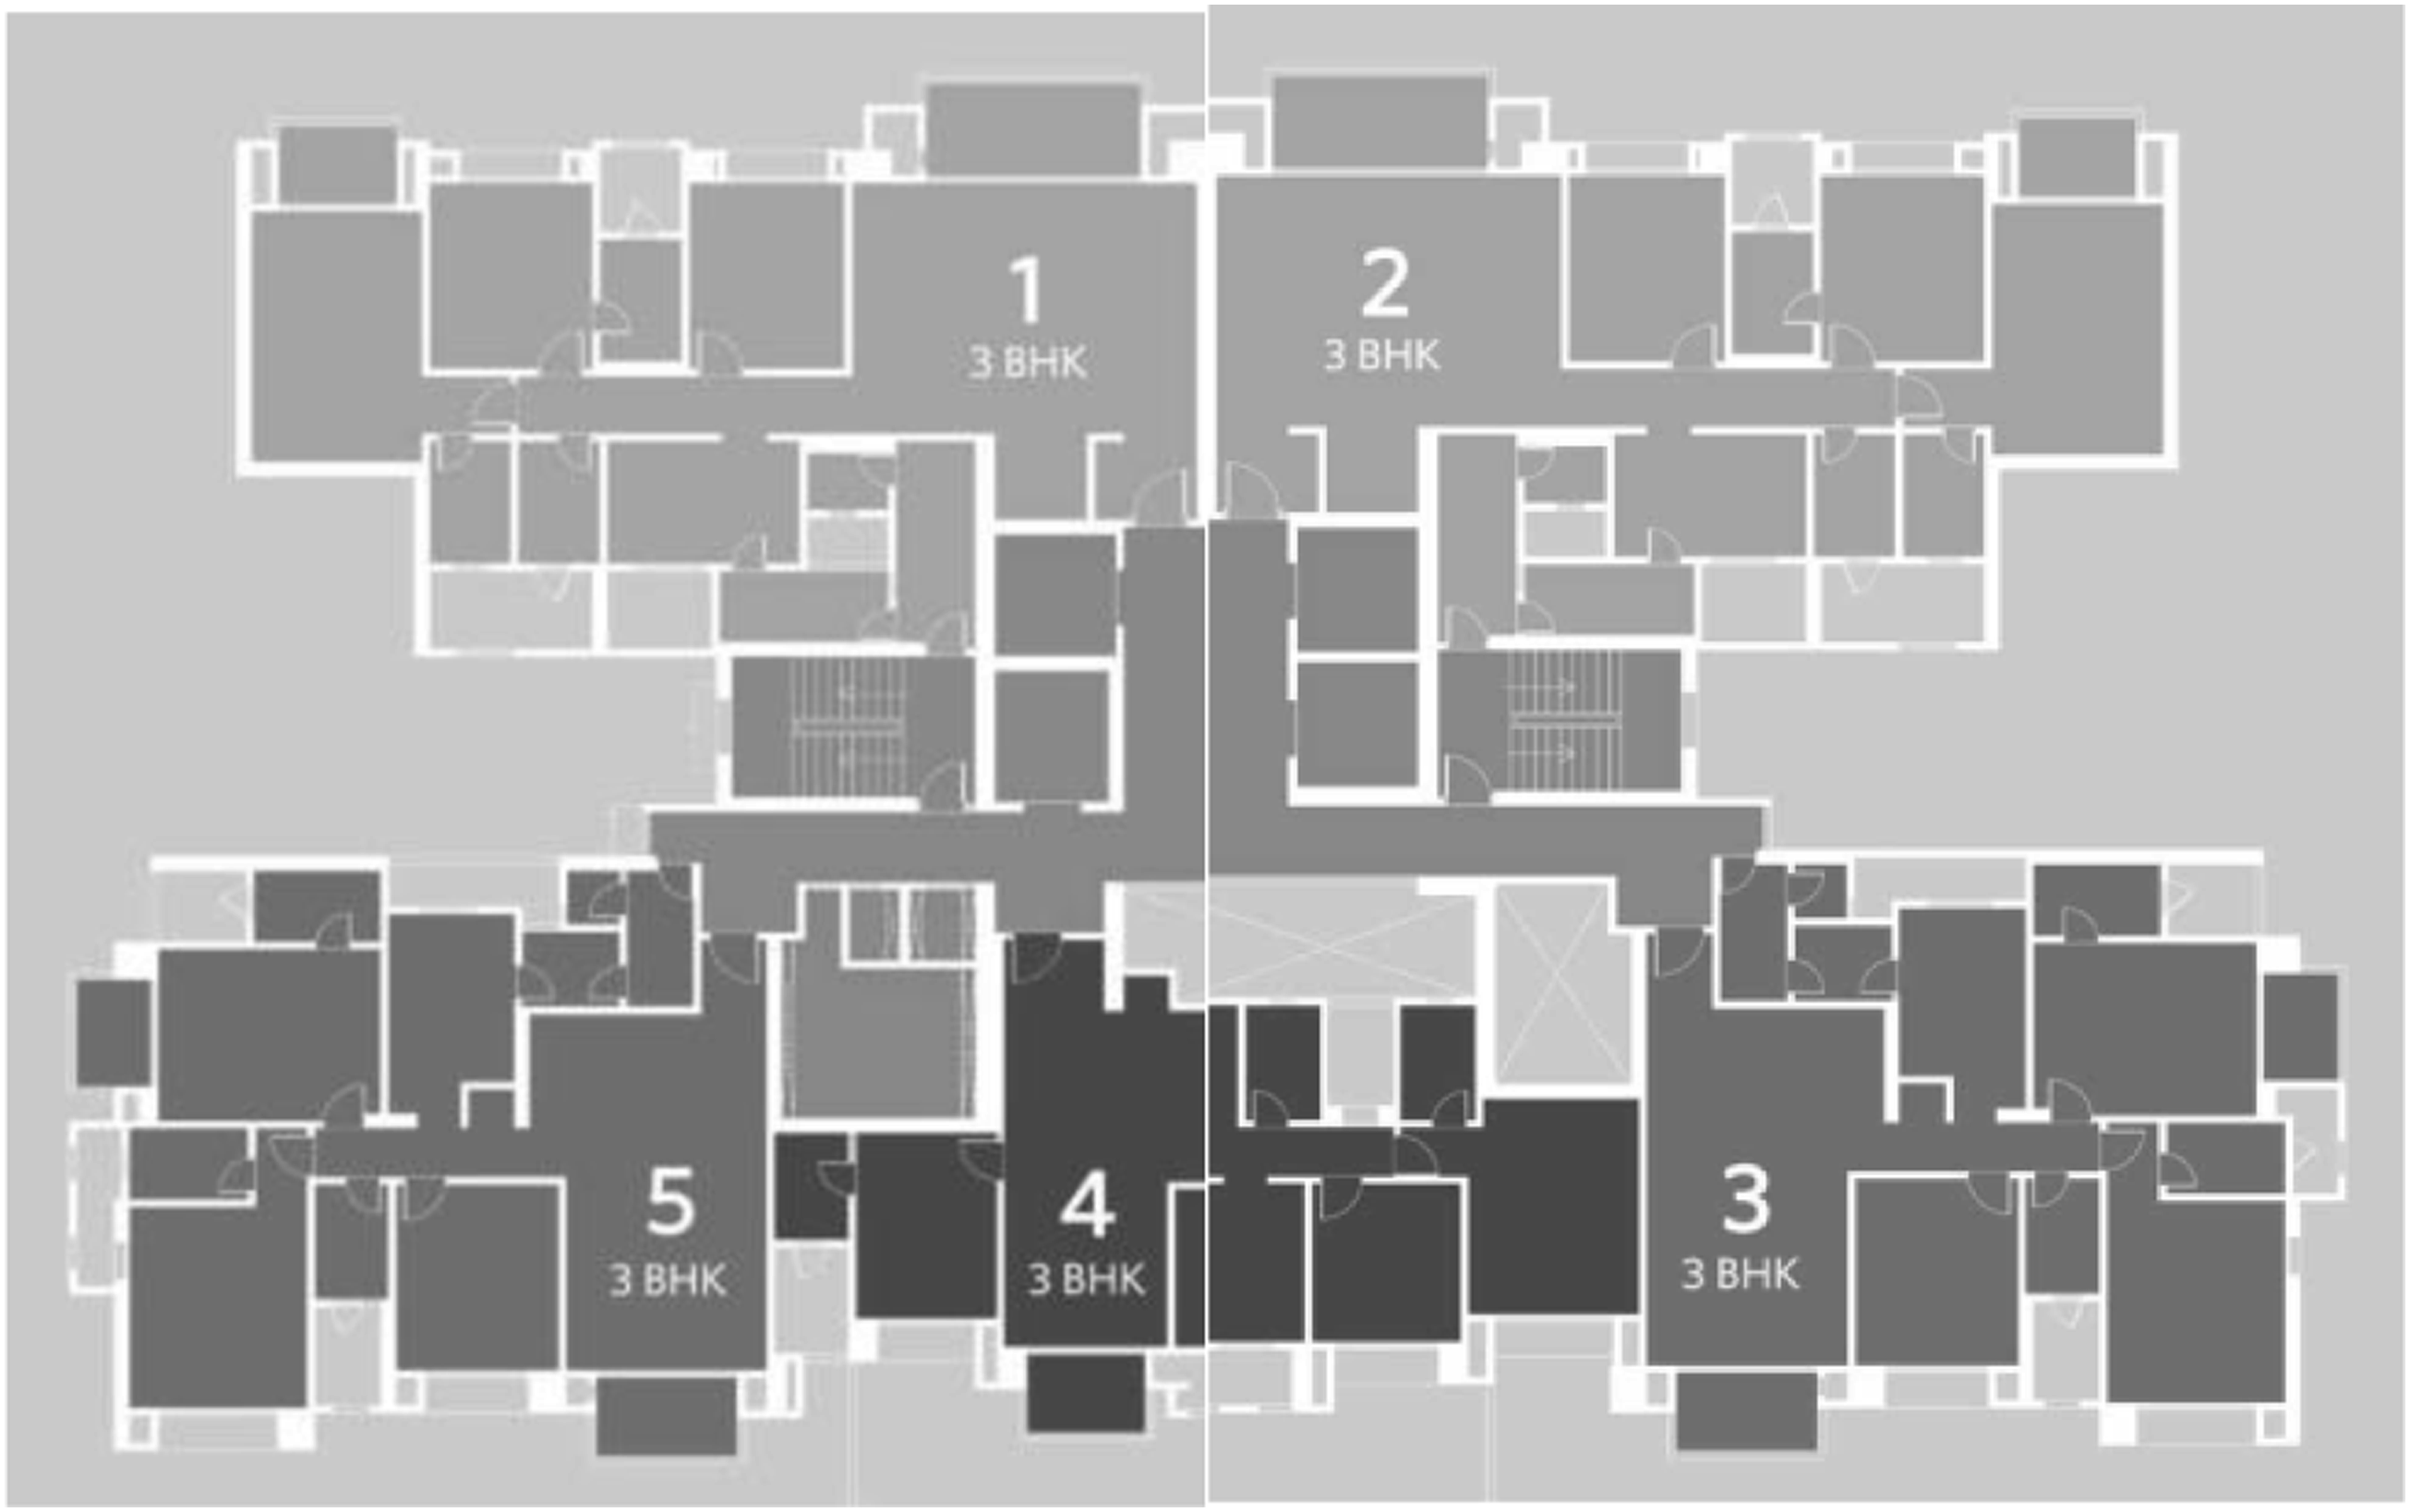
Figures 4 and 5 above show the typical floor plate for tower G and typical floor plan for the three bedroom apartments. Typical Three Bedroom Apartment Floor plan, Tower G. Source.
24
: Legend: 1). Entrance foyer 2). Living room 3). Dining 4). Kitchen 5). Utility 6). Maid’s room 7). Bedroom-1 8). Bedroom-2 9). Toilet 10). Master suite 11). Dresser 12). Toilet 13). Toilet. Typical floor plate, tower G. Source:
24
.
Calibration and acceptable ranges for measured variables
Daily AC energy use
The occupants were asked their duration of daily AC use for the previous four (4) weeks from a structured list. The estimated daily AC energy use was calculated using the formula:
The thermal sensation vote (TSV)
Thermal preference and thermal acceptability are widely used subjective approaches to evaluate occupants’ thermal comfort in indoor environments. The method involved asking occupants to rate their thermal sensation on the ASHRAE seven-point scale ranging from −3 (feeling cold) to +3 (feeling hot), with 0 being thermally neutral. The study assumed TSV readings between (−1 to +1) as “satisfied or thermal comfort” while readings outside this range were treated as “dissatisfied or thermal discomfort”. The Thermal Acceptability is a measure of whether the occupant is prepared to accept or reject their current thermal condition. It is an additional layer of probe to determine the severity of the occupants' thermal sensation. It is measured on a two-point scale thus; 1(Acceptable) or 0 (unacceptable). Also, Thermal Preference is a measure that goes a step further to understand the direction of the occupant’s desire despite their thermal sensation. It answers the question; Do you feel a need to improve the current thermal sensation in your apartment now usually measured on a three-point scale as shown below; “Want cooler”, “no change” and “want warmer”.
Predicted mean vote (PMV/PPD)
In order to comply with ASHRAE 55, the recommended thermal limit on the 7-point scale of PMV is between −0.5 and 0.5. ISO 7730 expands on this limit, giving different indoor environments ranges. ISO defines the hard limit for existing buildings between −0.7 and +0.7, and for new buildings ranging between −0.5 and +0.5. This study adopted −0.7 through +0.7 as the acceptable range for PMV. The Predicted Mean Votes (PMV/PPD) were recorded using HD32.3 Delta Ohm PMV/PPD indices meter mounted a height of 1.5 m above the bedroom floor. HD32.3 is designed for analysis of hot environments through WBGT index (Wet Bulb Globe Temperature) in presence or absence of solar radiation. It is also used for the analysis of moderate environments through PMV index and PPD index. Clothing level (0.5clo) and metabolic rate of (1.0met) were used for summer while (1.0clo) and (1.0met) were used during winter. This represents the typical summer and winter clothings as well as metabolic rates for subjects seated quietly according to ASHRAE Standard 55-2020.
The instrument is provided with three inputs for probes with SICRAM module having an electric circuit that communicates with the instrument. The average headroom was recorded as 2.95 m. Responses were limited to one (1) response per bedroom.
The data obtained was cleaned and analyzed using the International Business Machines–Statistical Package for Social Sciences (IBM – SPSS) version 26. Relationship between thermal sensation votes and AC Energy use was done using Pearson’s correlation while linear regression analysis was done to predict thermal sensation votes and estimated AC Energy using floor levels. Comparison of means of thermal sensation votes and estimated AC Energy between floor levels were done using independent samples t test. Determining the optimal height threshold for passive thermal comfort was done using the Receiver Operating Characteristics (ROC) where sensitivity and specificity were obtained at different cutoffs. All tests were significant at less than 5% level of significance and are presented in tables and chart below.
Results
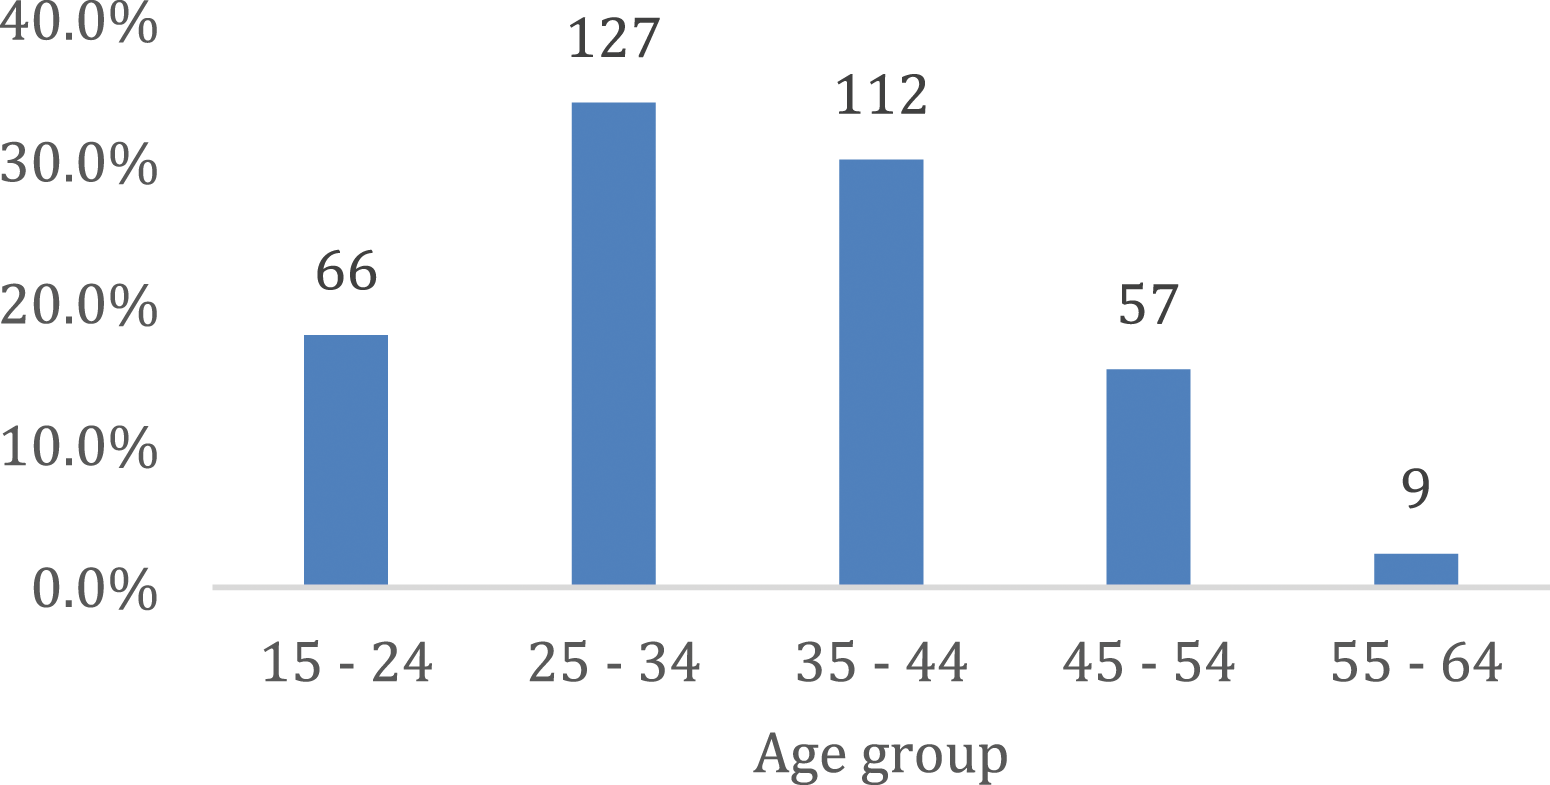
Figure 6 shows that 45.2% of the study participants in the summer are within the age bracket of 25 to 34 years, 25.8% within 35 to 44 years, 18.9% within 15 to 24 years, 9.4% within 45 to 54 years while 0.7% within 55 – 64 years of age. The mean age was 32.42 ± 8.35, the minimum age was 18 years while the maximum was 58 years Figure 7 shows that 34.2% of the study participants in the winter are within the age bracket of 25 to 34 years, 30.2% within 35 to 44 years, 17.8% within 15 to 24 years, 15.4% within 45 to 54 years while 2.4% within 55 – 64 years of age. The mean age was 34.71 ± 9.57, the minimum age was 15 years while the maximum was 59 years. Age distribution of respondents in summer. Age distribution of respondents in winter.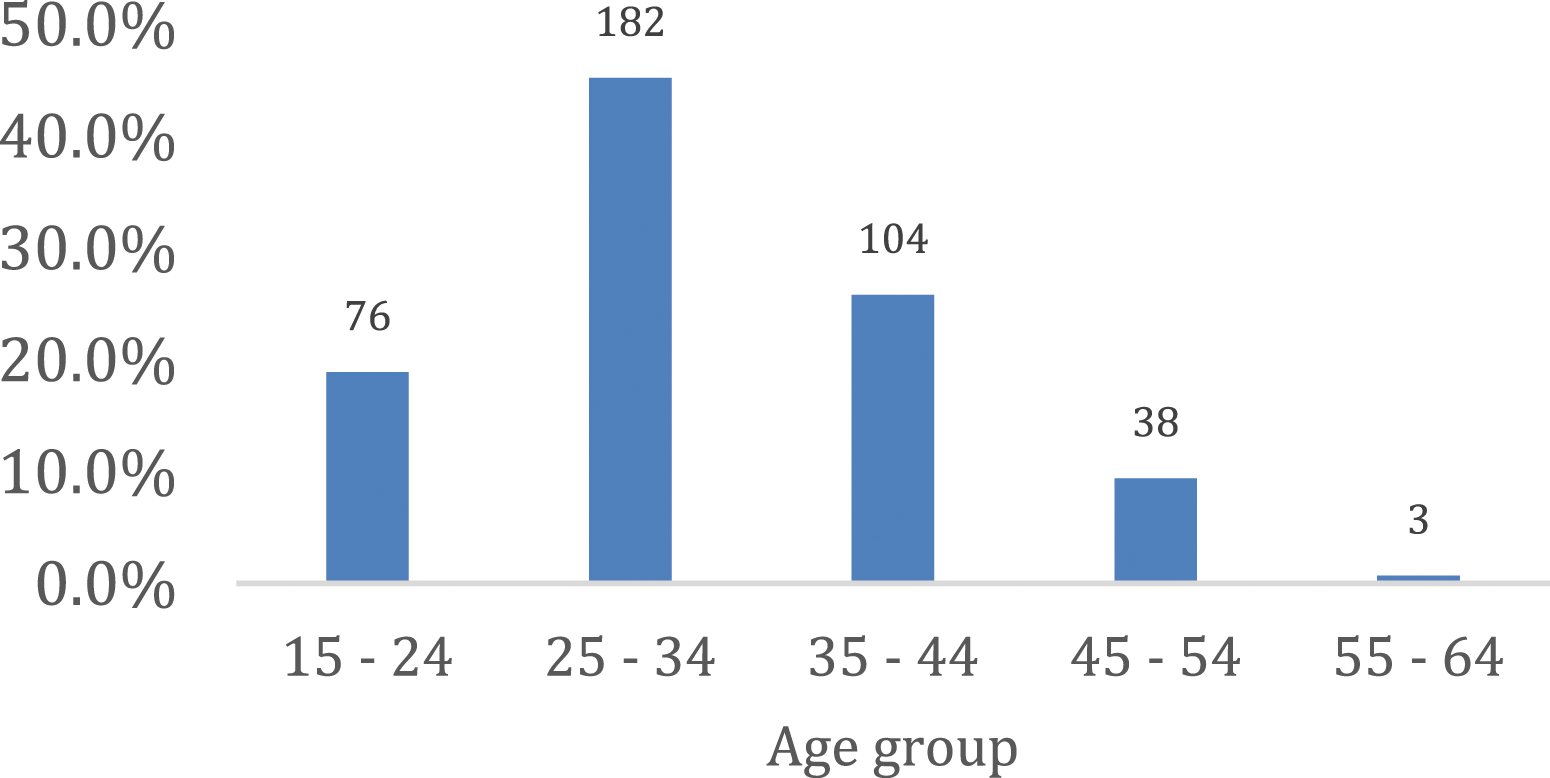
Comparison of passive thermal comfort (TSV) of the floor levels during summer.
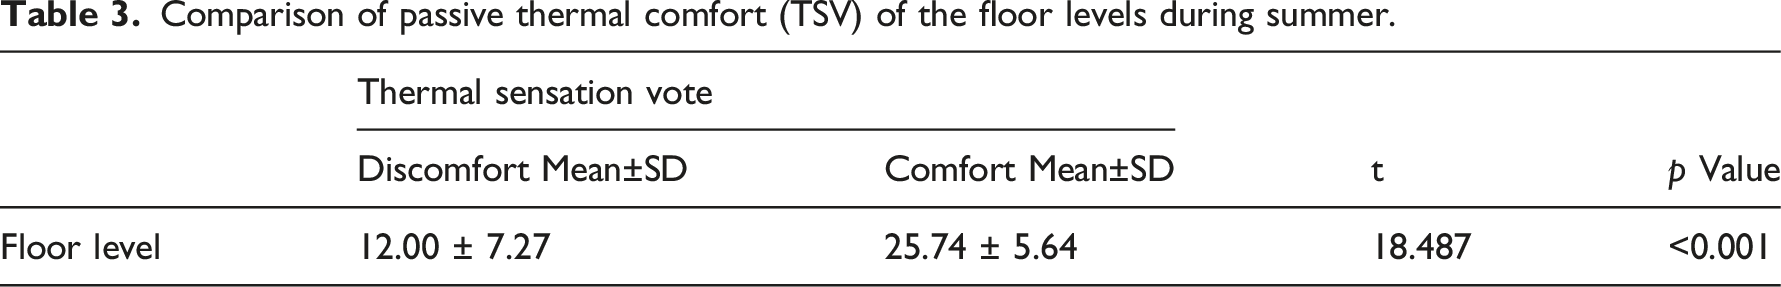
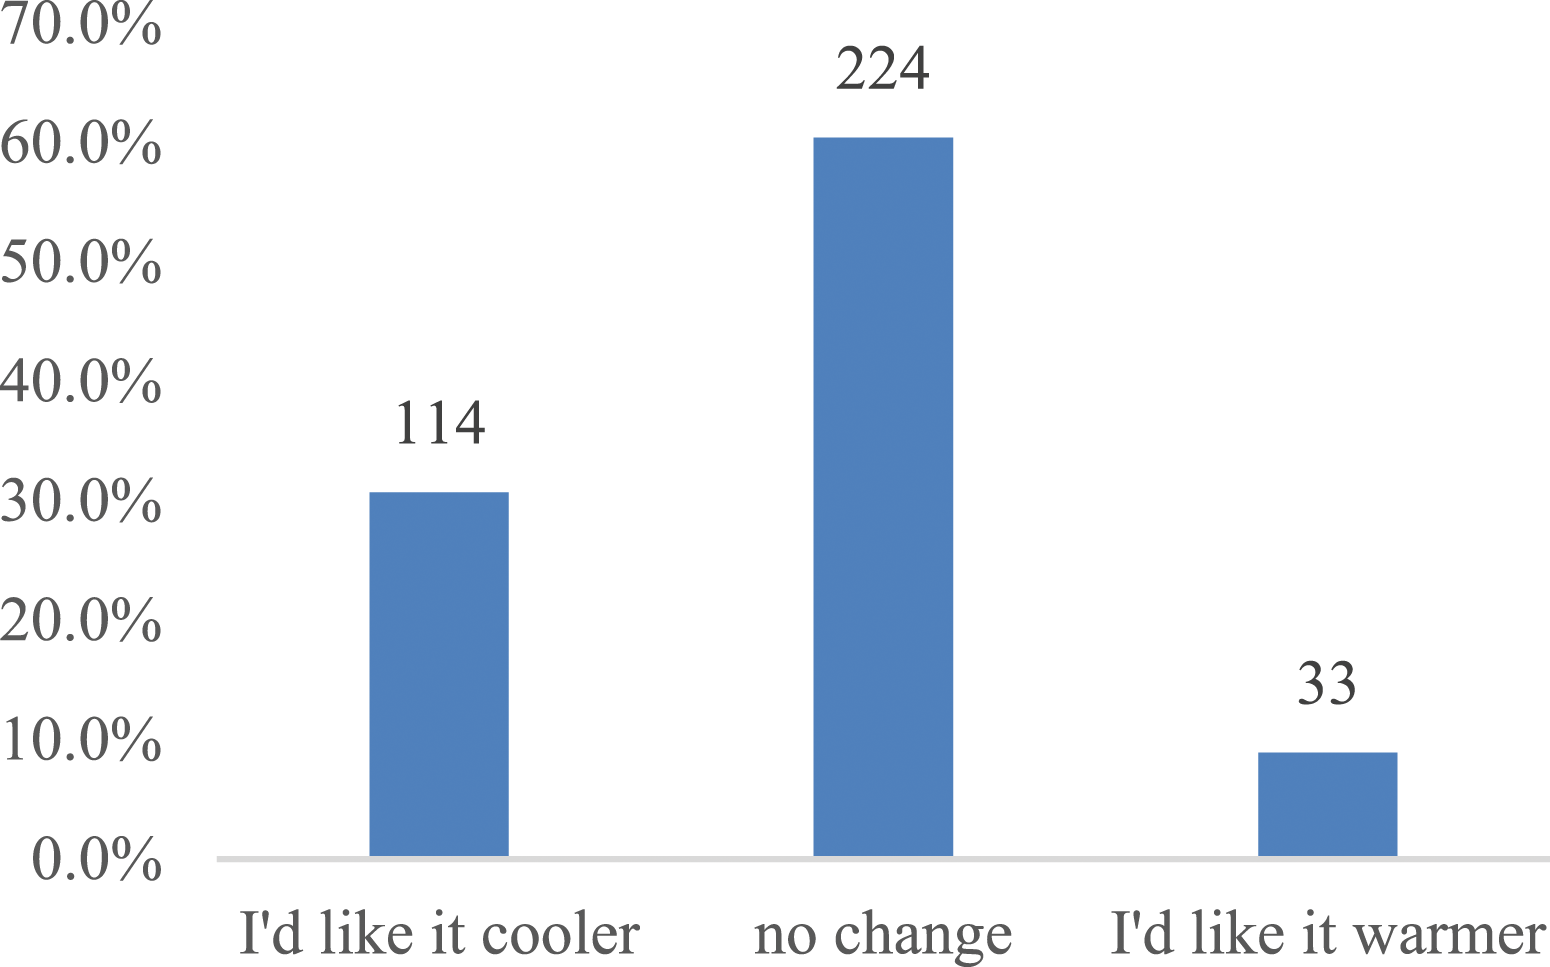
Figure 8 show that 78.7% of the respondents would like an improvement in their thermal sensation. They would like it cooler, 0.5% would like it warmer while 20.8% would prefer no change in their thermal sensation during summer. Figure 9 show that 60.4% of the respondents would prefer no change in their thermal sensation during winter. Whereas 30.7% would like it cooler, 8.9% would like it warmer. Thermal preference of the study participants during summer. Thermal preference of the study participants during winter.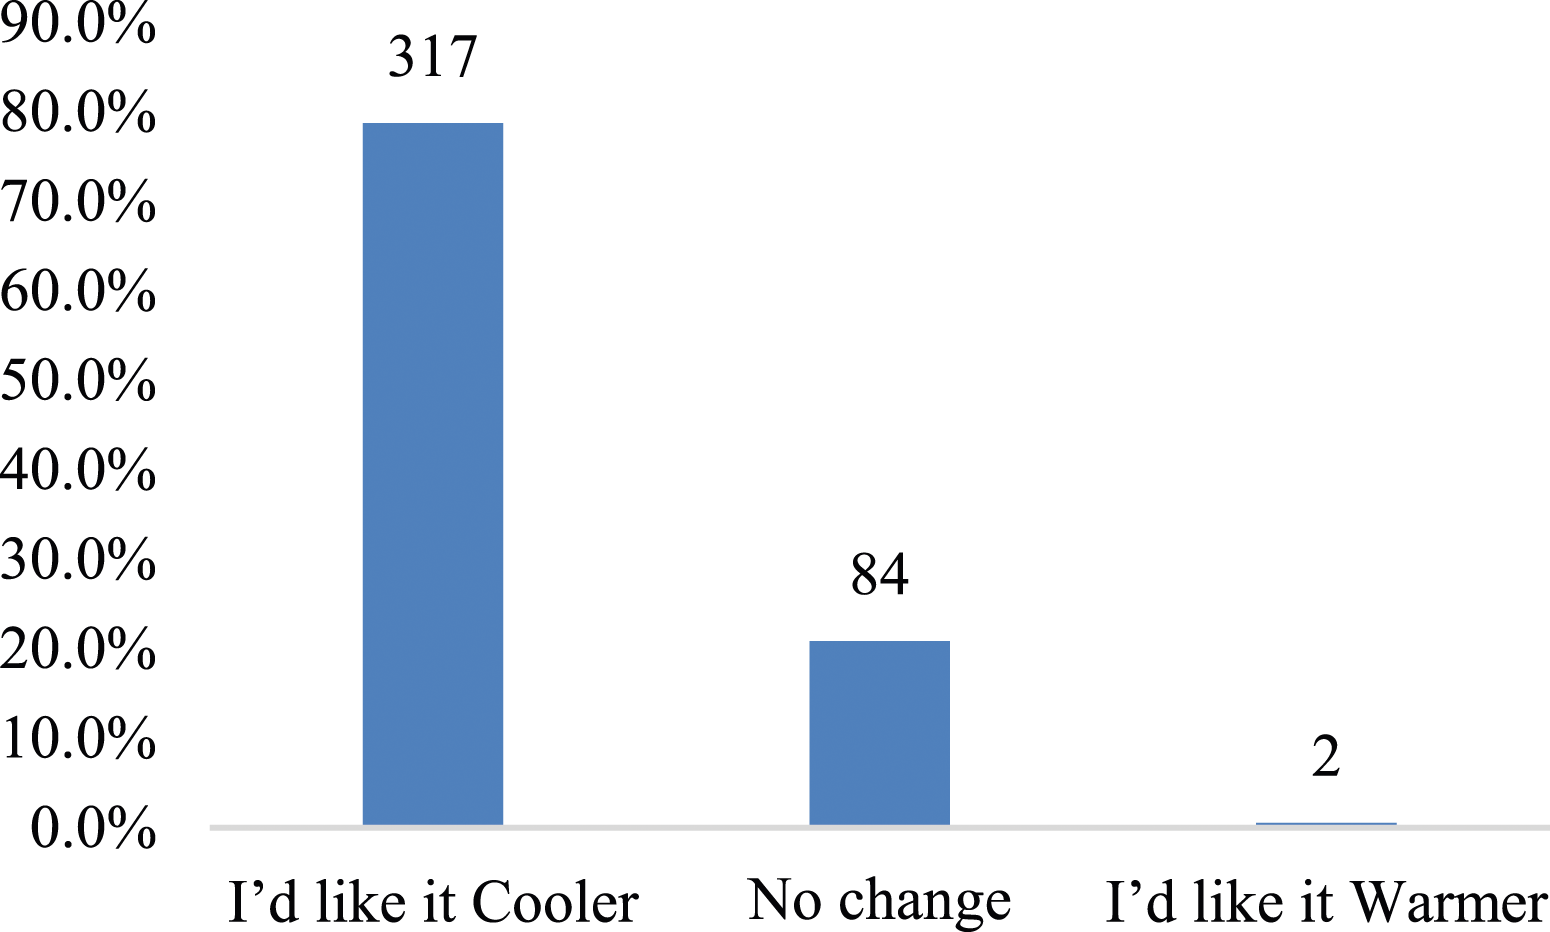
Comparison of thermal preference of respondents in different floor levels during summer.
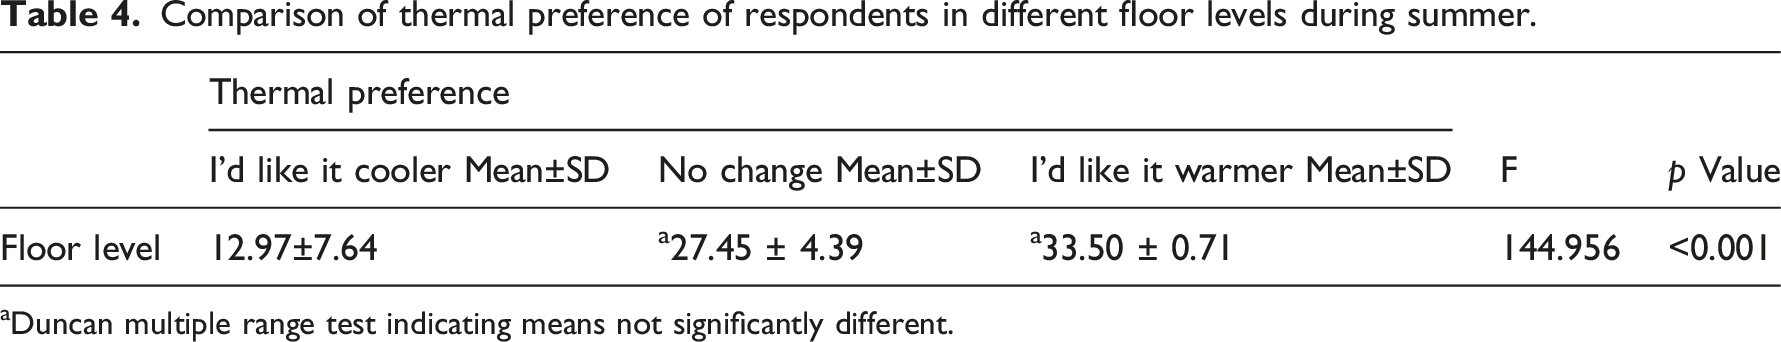
aDuncan multiple range test indicating means not significantly different.
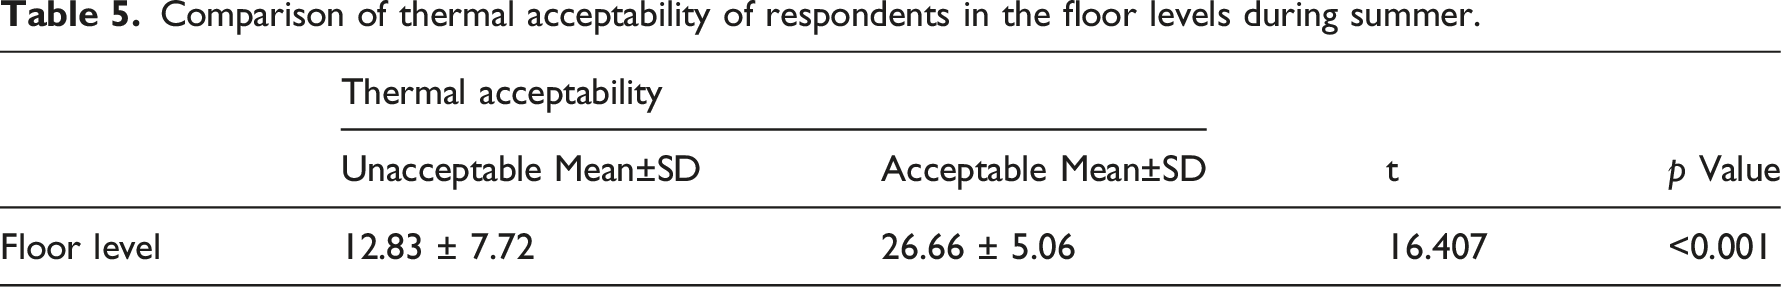
Comparison of thermal acceptability of respondents in the floor levels during summer.
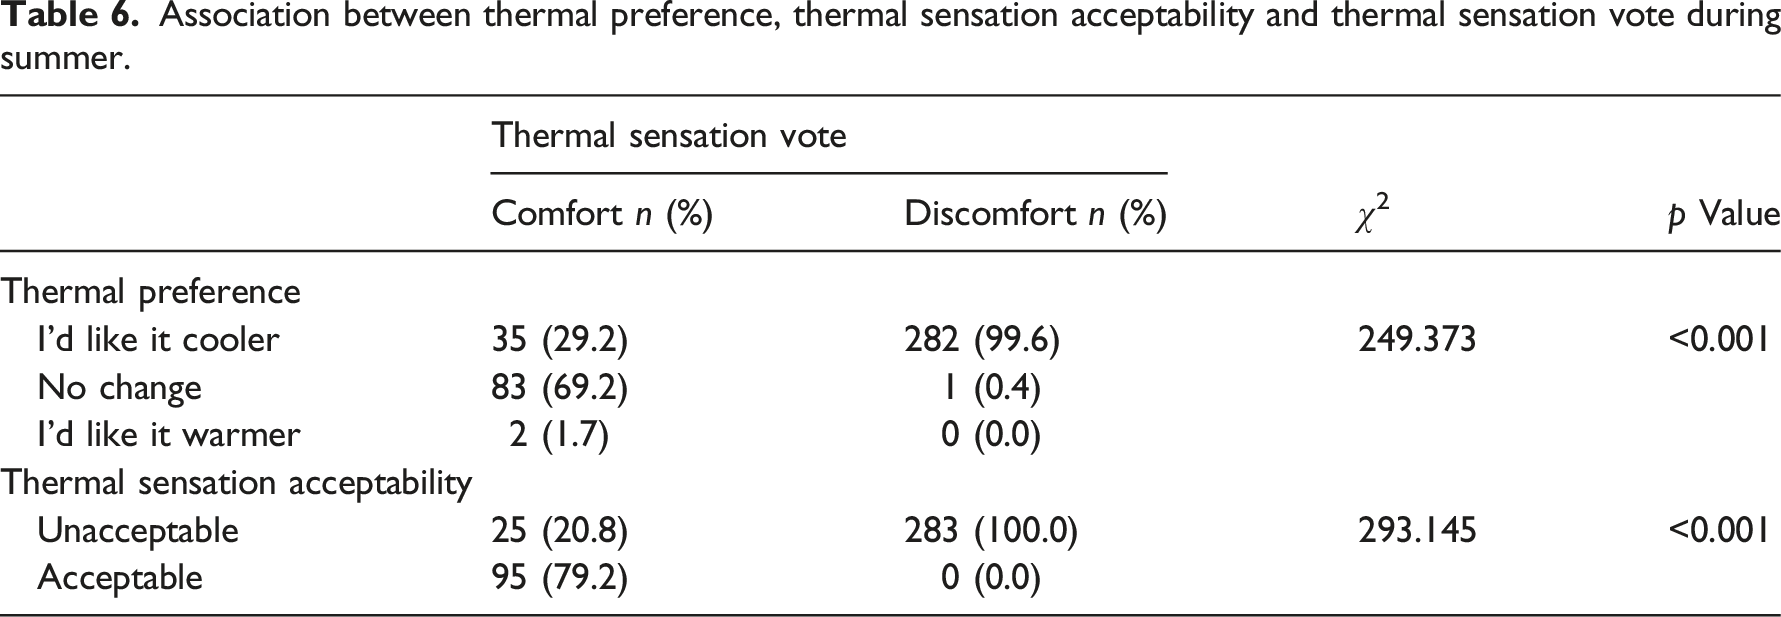
Association between thermal preference, thermal sensation acceptability and thermal sensation vote during summer.
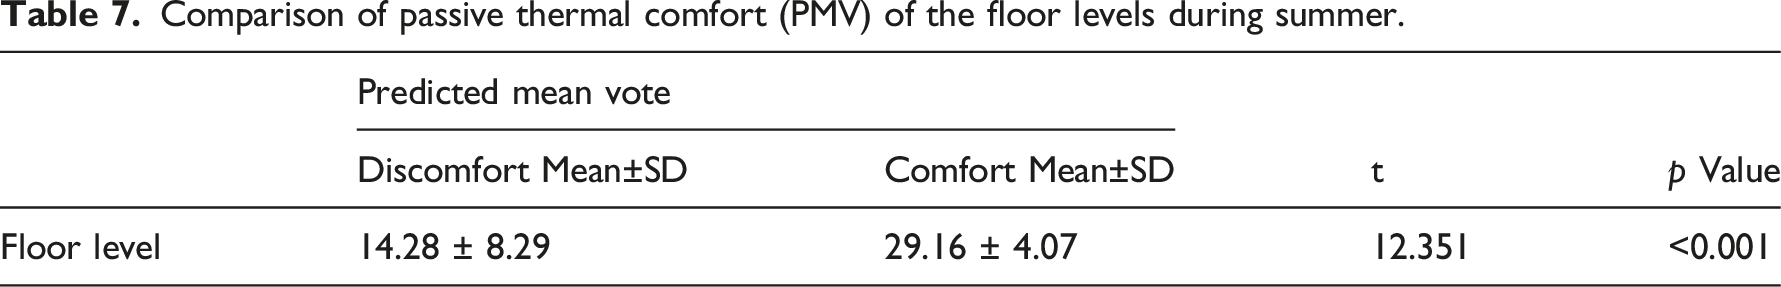
Comparison of passive thermal comfort (PMV) of the floor levels during summer.
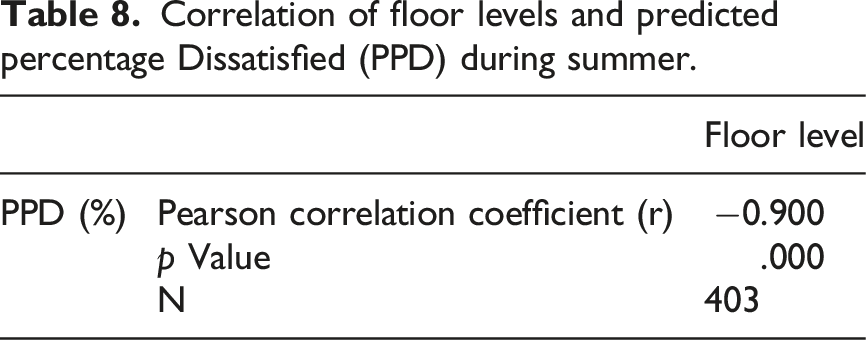
Correlation of floor levels and predicted percentage Dissatisfied (PPD) during summer.
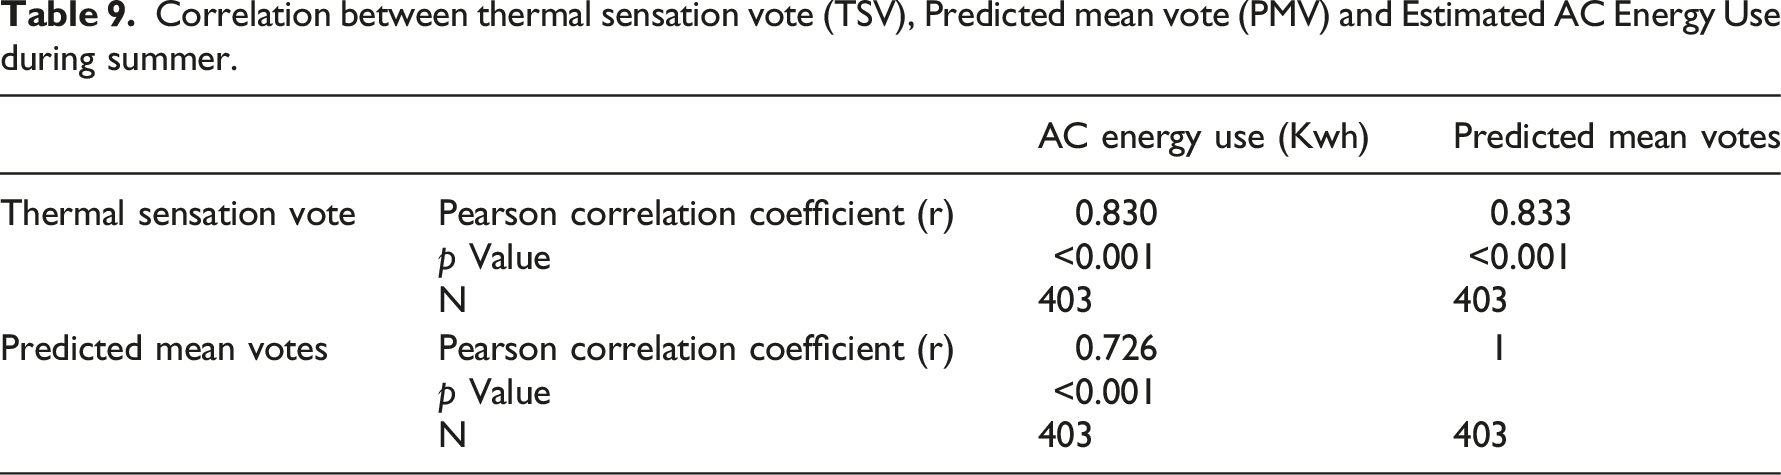
Correlation between thermal sensation vote (TSV), Predicted mean vote (PMV) and Estimated AC Energy Use during summer.
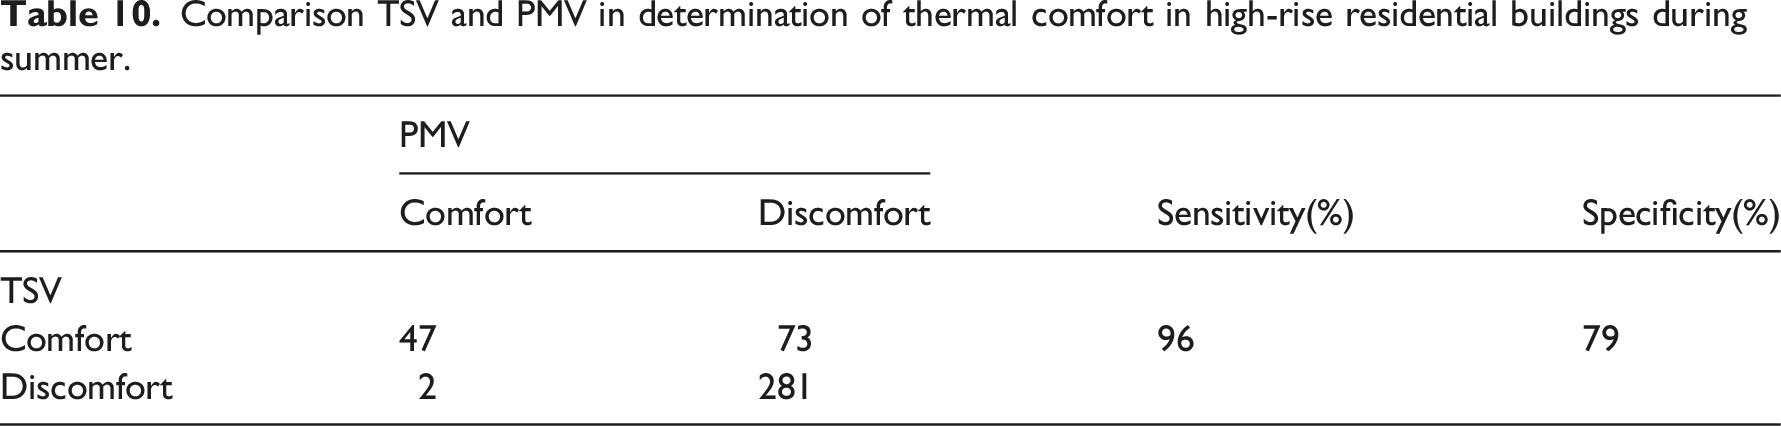
Comparison TSV and PMV in determination of thermal comfort in high-rise residential buildings during summer.
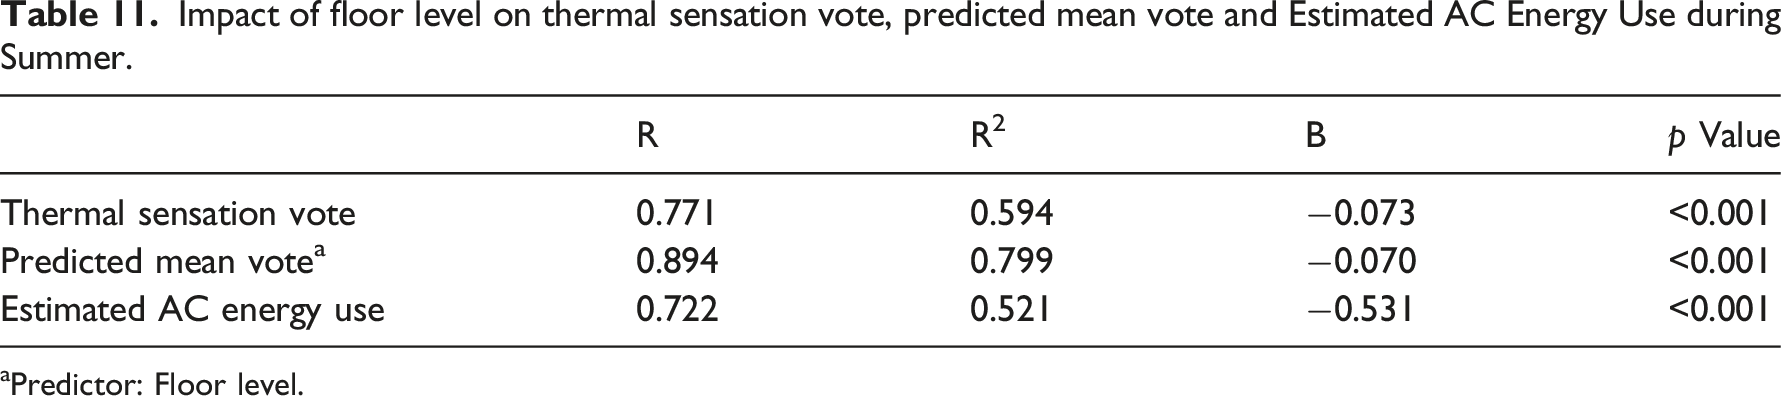
Impact of floor level on thermal sensation vote, predicted mean vote and Estimated AC Energy Use during Summer.
aPredictor: Floor level.
There is a significant relationship between predicted mean vote and floor level during summer (p < .001). The coefficient of determination (R2 = 0.799) indicates that 79.9% of the variation in predicted mean vote is attributed to floor level while the regression coefficient (B = −0.070) indicates negative impact. This implies that a unit increase in floor level will cause 0.070-unit decrease in predicted mean vote. The following regression model is hereby derived for predicting new values of predicted mean vote during summer.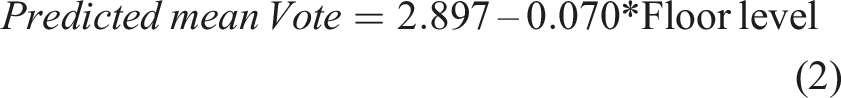
There is a significant relationship between AC energy use and floor level during summer (p < .001). The coefficient of determination (R2 = 0.521) indicates that 52.1% of the variation in AC Energy use is explained by floor level while the regression coefficient (B = −0.531) indicates negative impact. This implies that a unit increase in floor level will cause 0.531-unit decrease in AC energy use during summer.
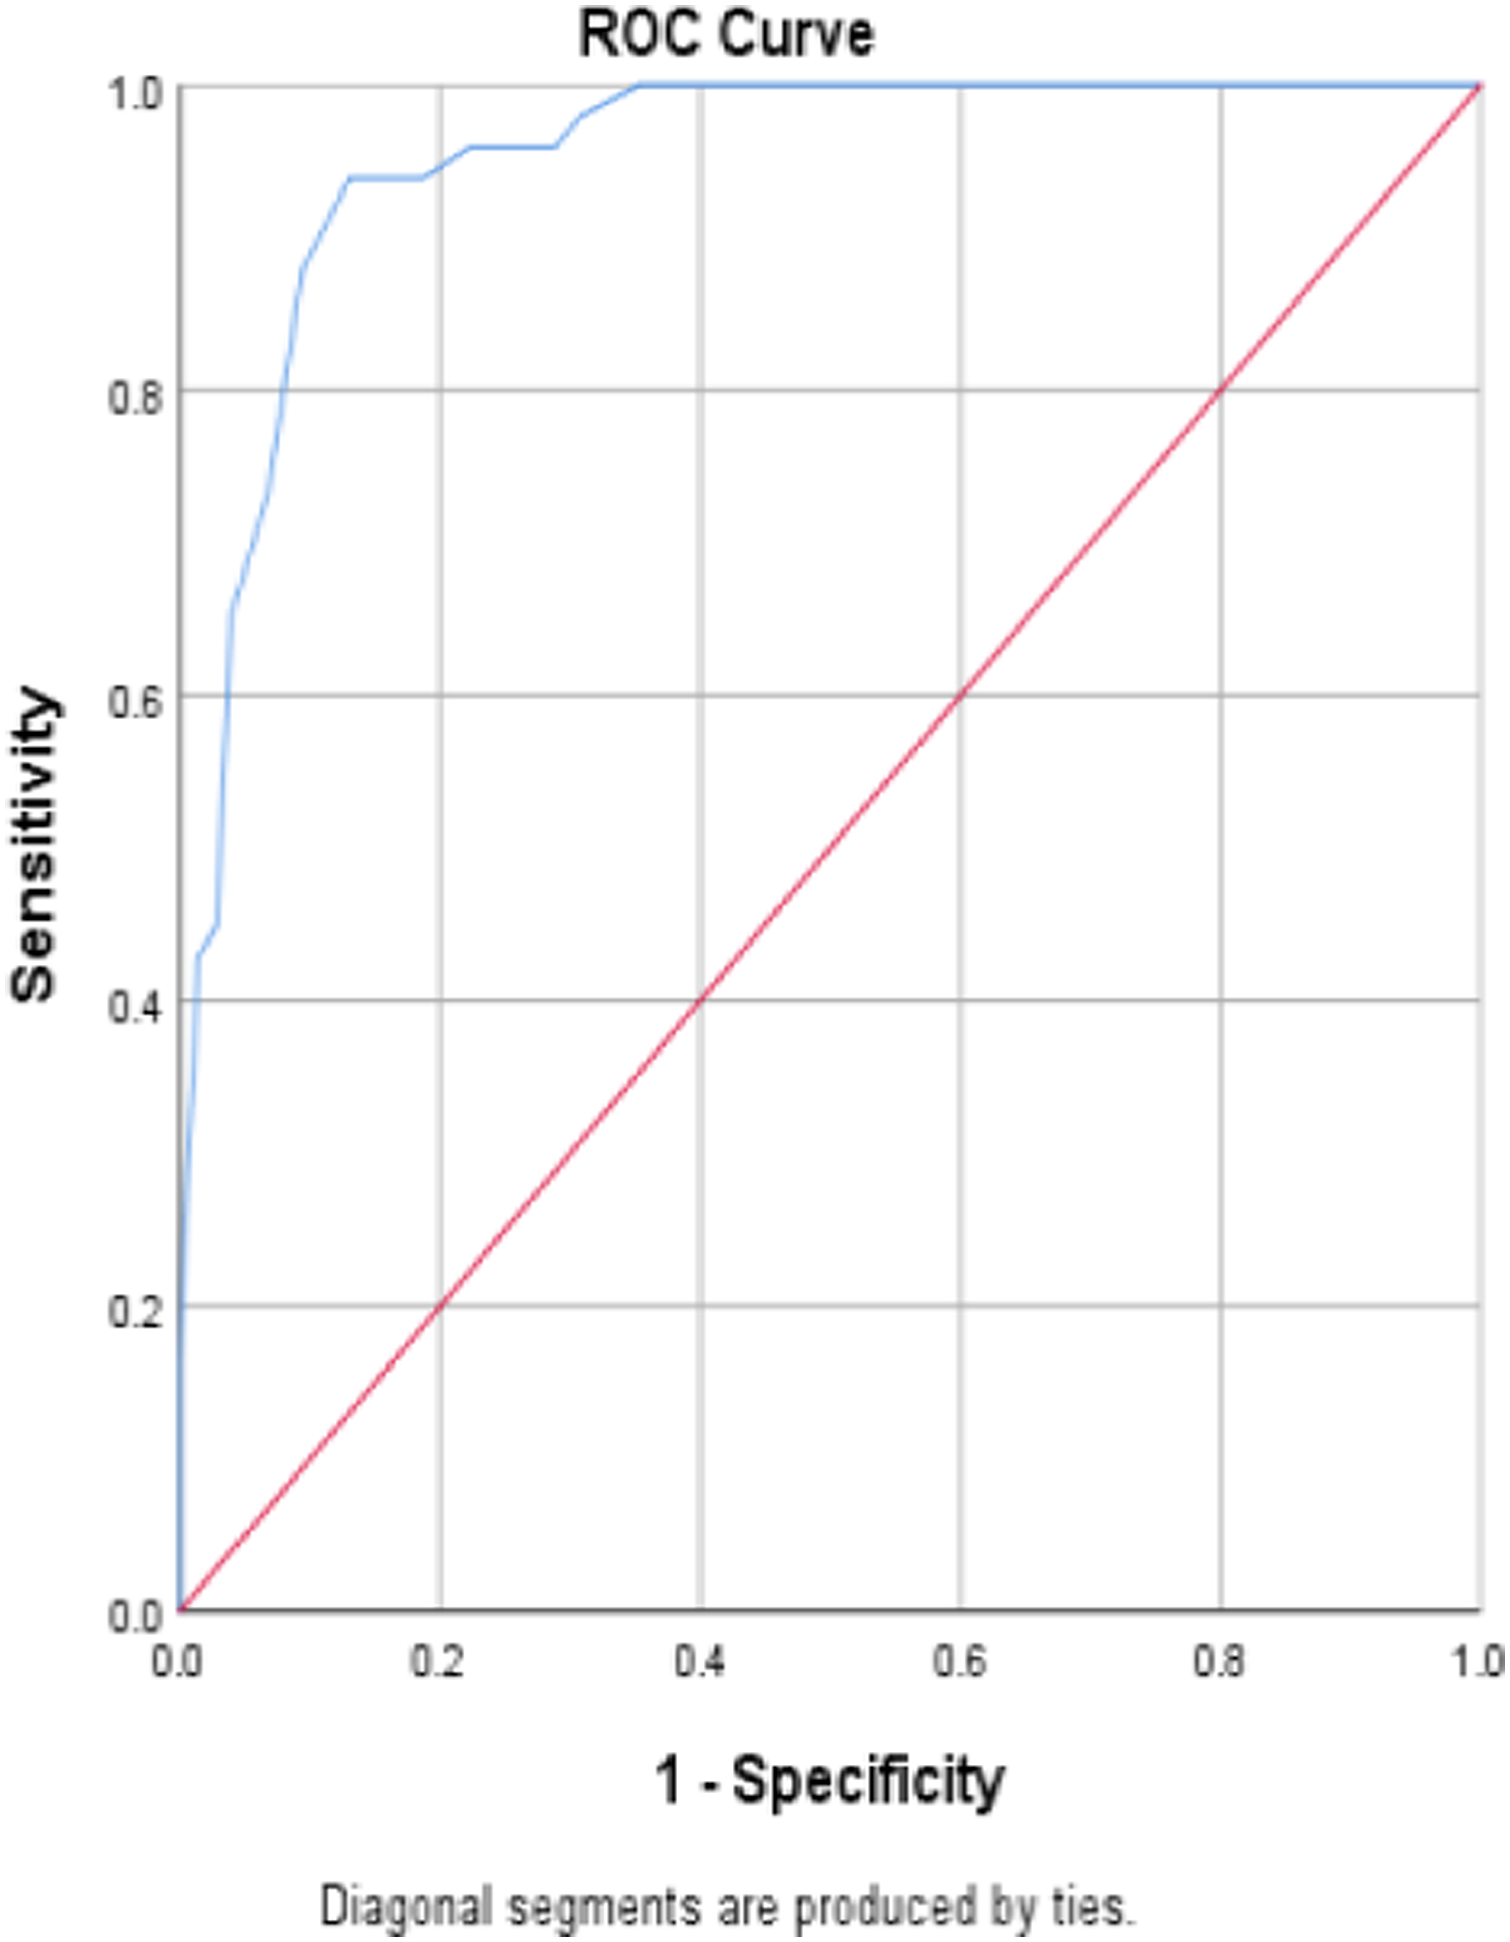
Figures 10 and 11 shows that the curves are above the diagonal line. The closer the curve to the upper left corner of the Y axis, the more accurate the test in detecting floor level of thermal comfort. The point closest to the top left corner of the ROC curve is the cutoff that provides the best trade-off between sensitivity and specificity. This point is the best floor level cutoff during summer. ROC curve showing the accuracy of the test (TSV) in predicting thermal comfort during summer. ROC curve showing the accuracy of the test (PMV) in predicting thermal comfort during summer.
Data showing sensitivity and specificity at various cut-off points of floor level to predict thermal comfort (TSV) during summer.
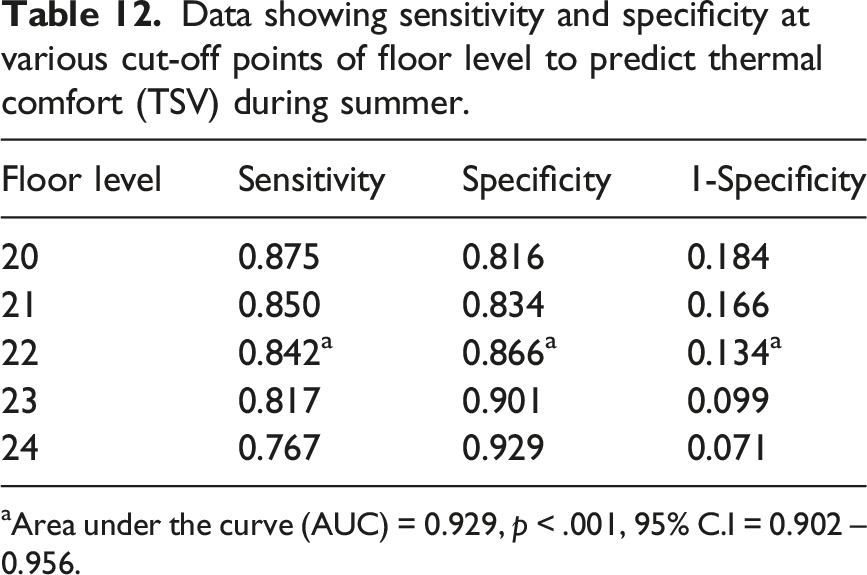
aArea under the curve (AUC) = 0.929, p < .001, 95% C.I = 0.902 – 0.956.
Data showing sensitivity and specificity at various cut-off points of floor level to predict thermal comfort (PMV) during summer.
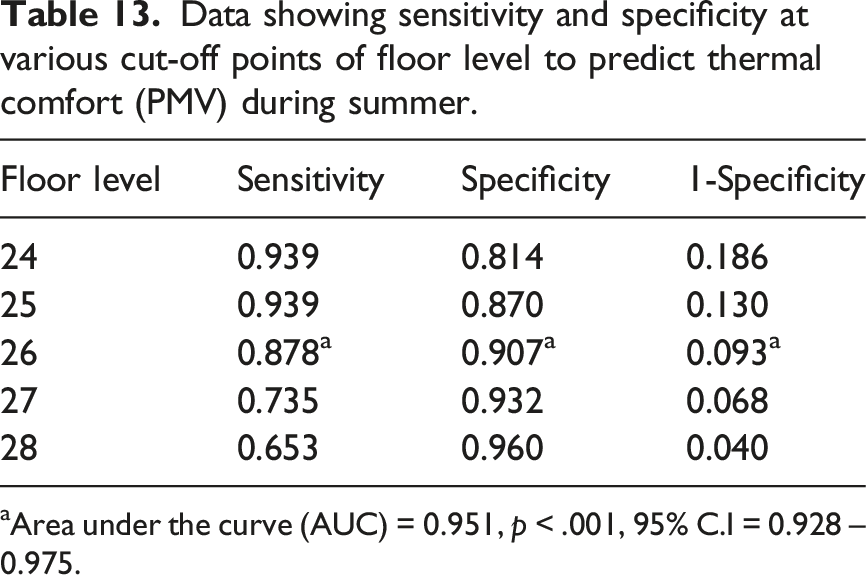
aArea under the curve (AUC) = 0.951, p < .001, 95% C.I = 0.928 – 0.975.
Comparison of passive thermal comfort (TSV) of the floor levels during winter.

Comparison of thermal preference of respondents in different floor levels during winter.
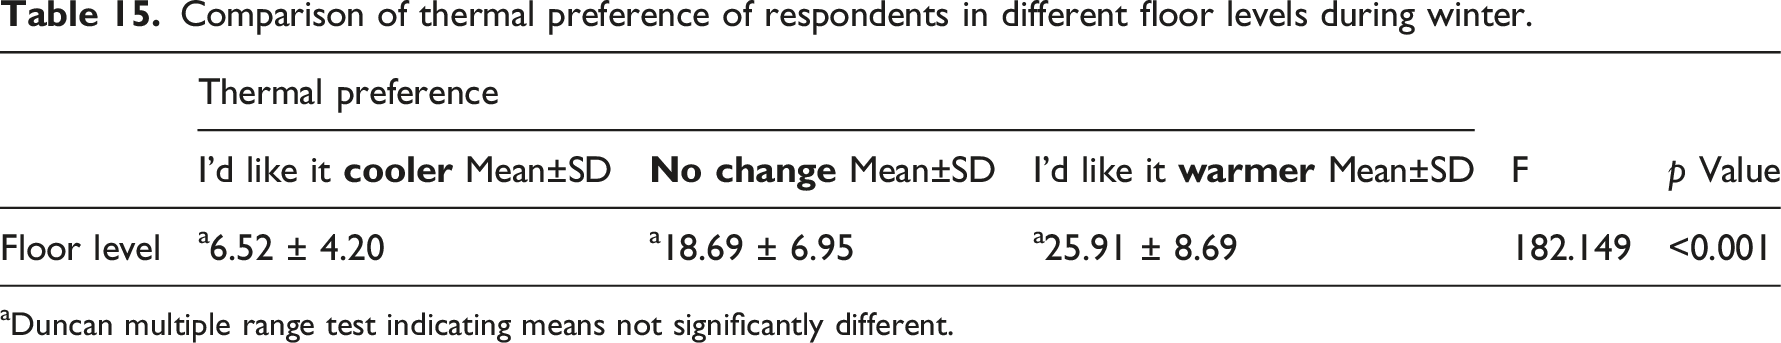
aDuncan multiple range test indicating means not significantly different.
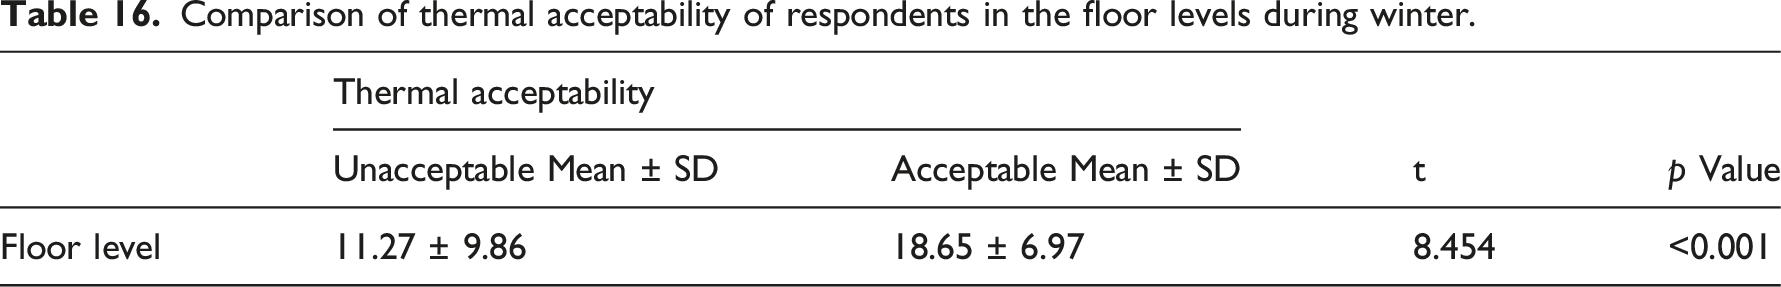
Comparison of thermal acceptability of respondents in the floor levels during winter.
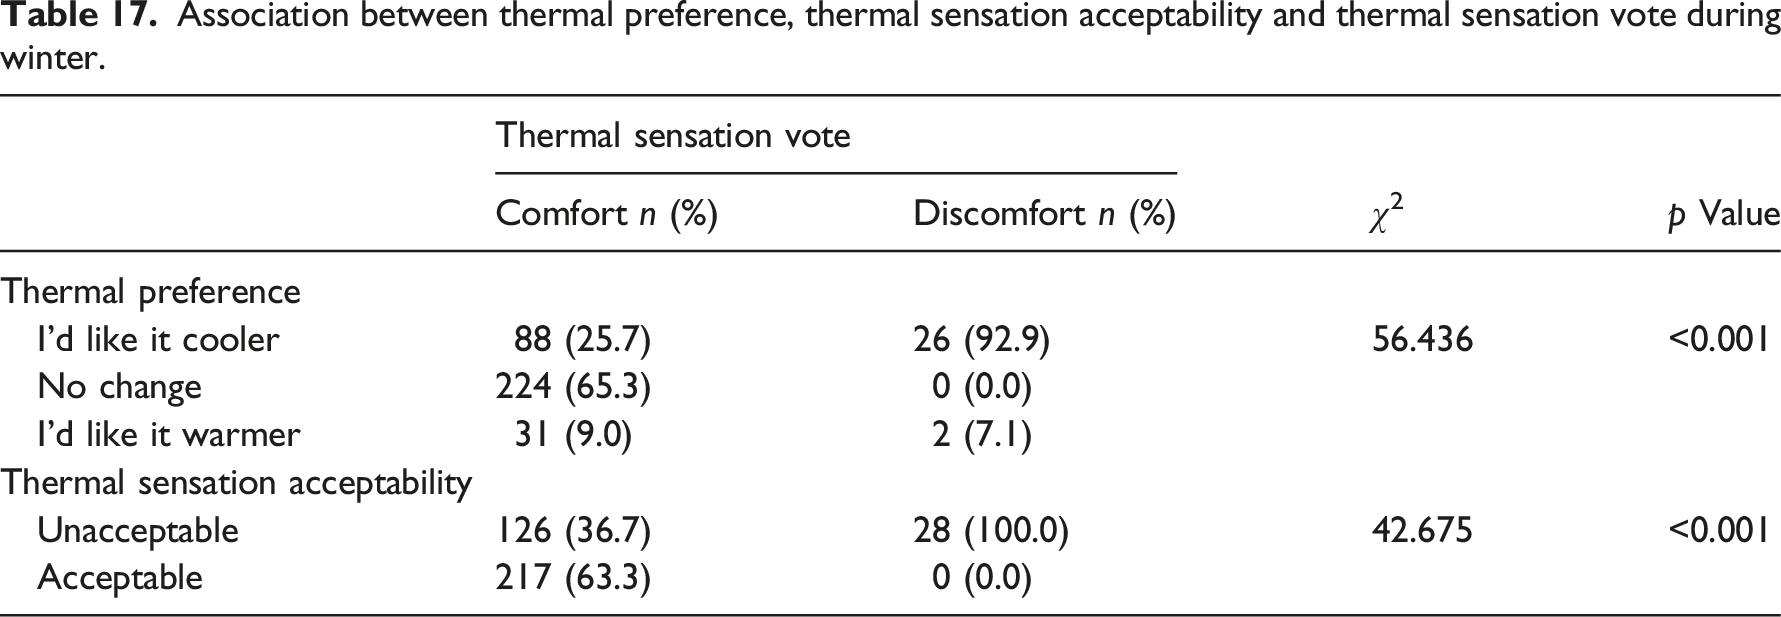
Association between thermal preference, thermal sensation acceptability and thermal sensation vote during winter.
Comparison of passive thermal comfort (PMV) of the floor levels during winter.

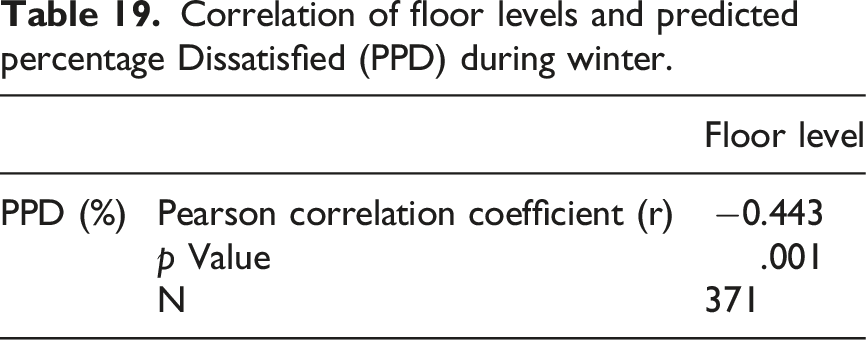
Correlation of floor levels and predicted percentage Dissatisfied (PPD) during winter.
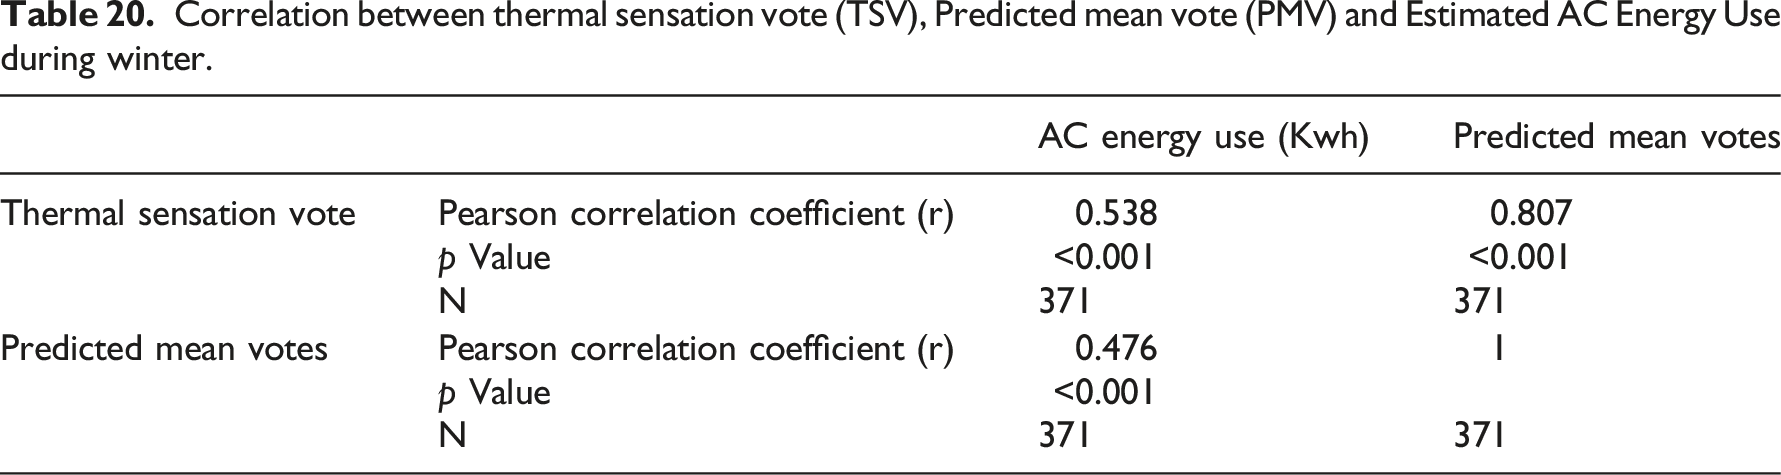
Correlation between thermal sensation vote (TSV), Predicted mean vote (PMV) and Estimated AC Energy Use during winter.
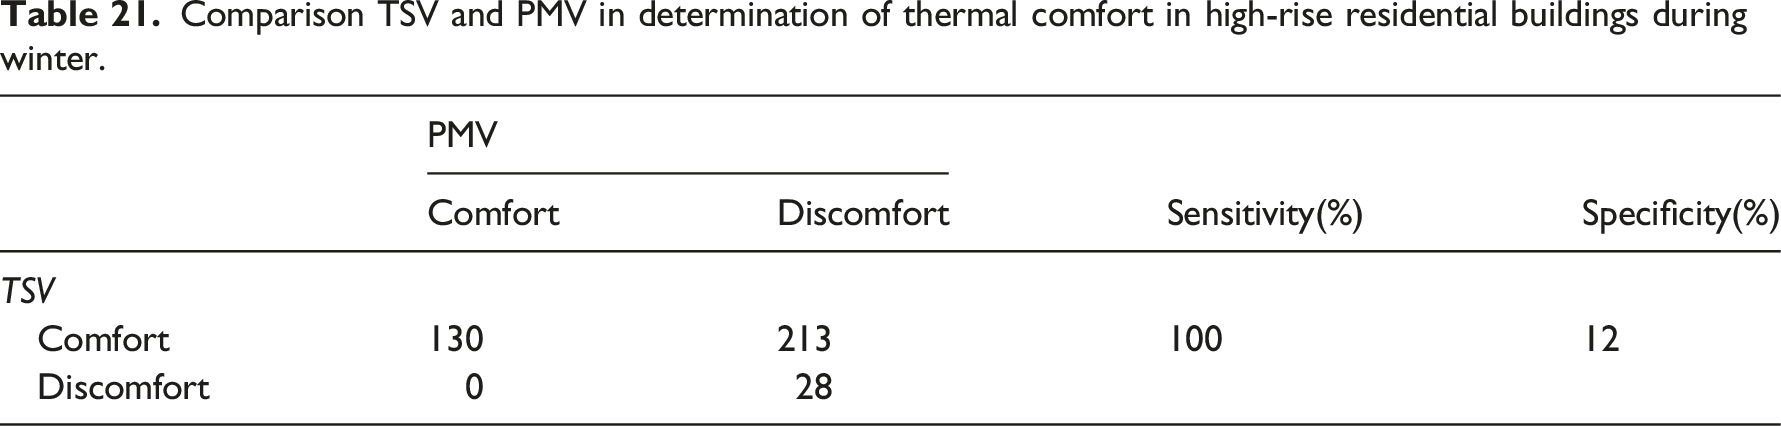
Comparison TSV and PMV in determination of thermal comfort in high-rise residential buildings during winter.
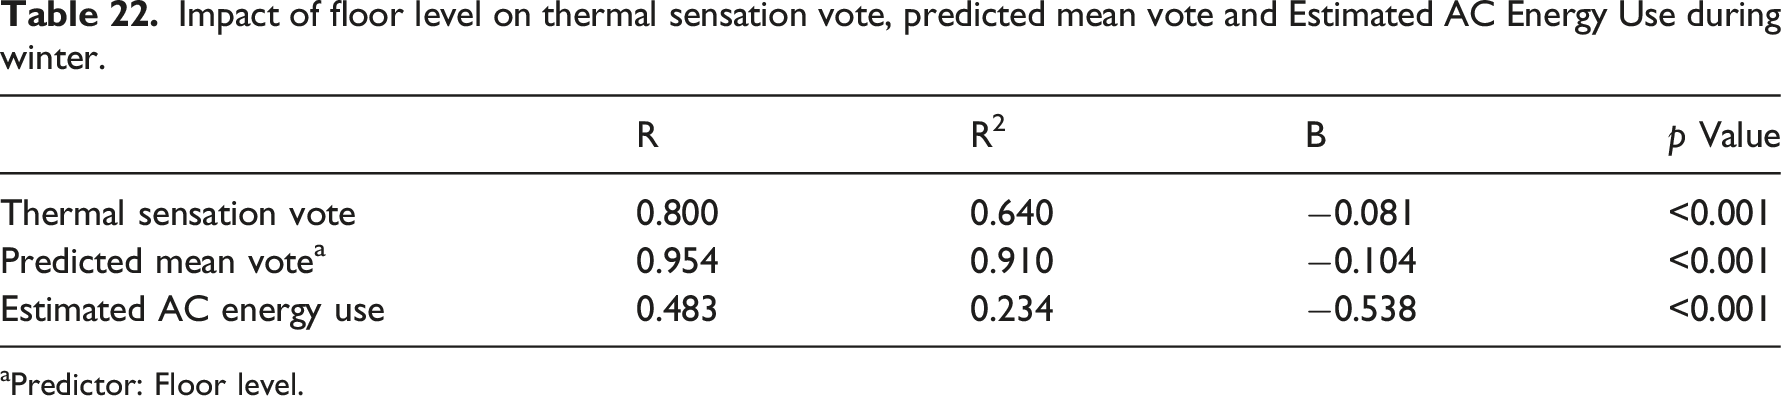
Impact of floor level on thermal sensation vote, predicted mean vote and Estimated AC Energy Use during winter.
aPredictor: Floor level.
There is a significant relationship between predicted mean vote and floor level during winter (p < .001). The coefficient of determination (R2 = 0.910) indicates that 91% of the variation in predicted mean vote is attributed to floor level while the regression coefficient (B = −0.104) indicates negative impact. This implies that a unit increase in floor level will cause 0.104-unit decrease in predicted mean vote. The following regression model is hereby derived for predicting new values of predicted mean vote during winter.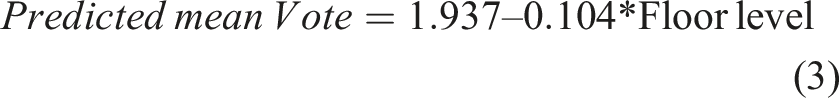
There is a significant relationship between AC energy use and floor level during winter (p < .001). The coefficient of determination (R2 = 0.234) indicates that 23.4% of the variation in AC Energy use is explained by floor level while the regression coefficient (B = −0.538) indicates negative impact. This implies that a unit increase in floor level will cause 0.538-unit decrease in AC energy use during winter.
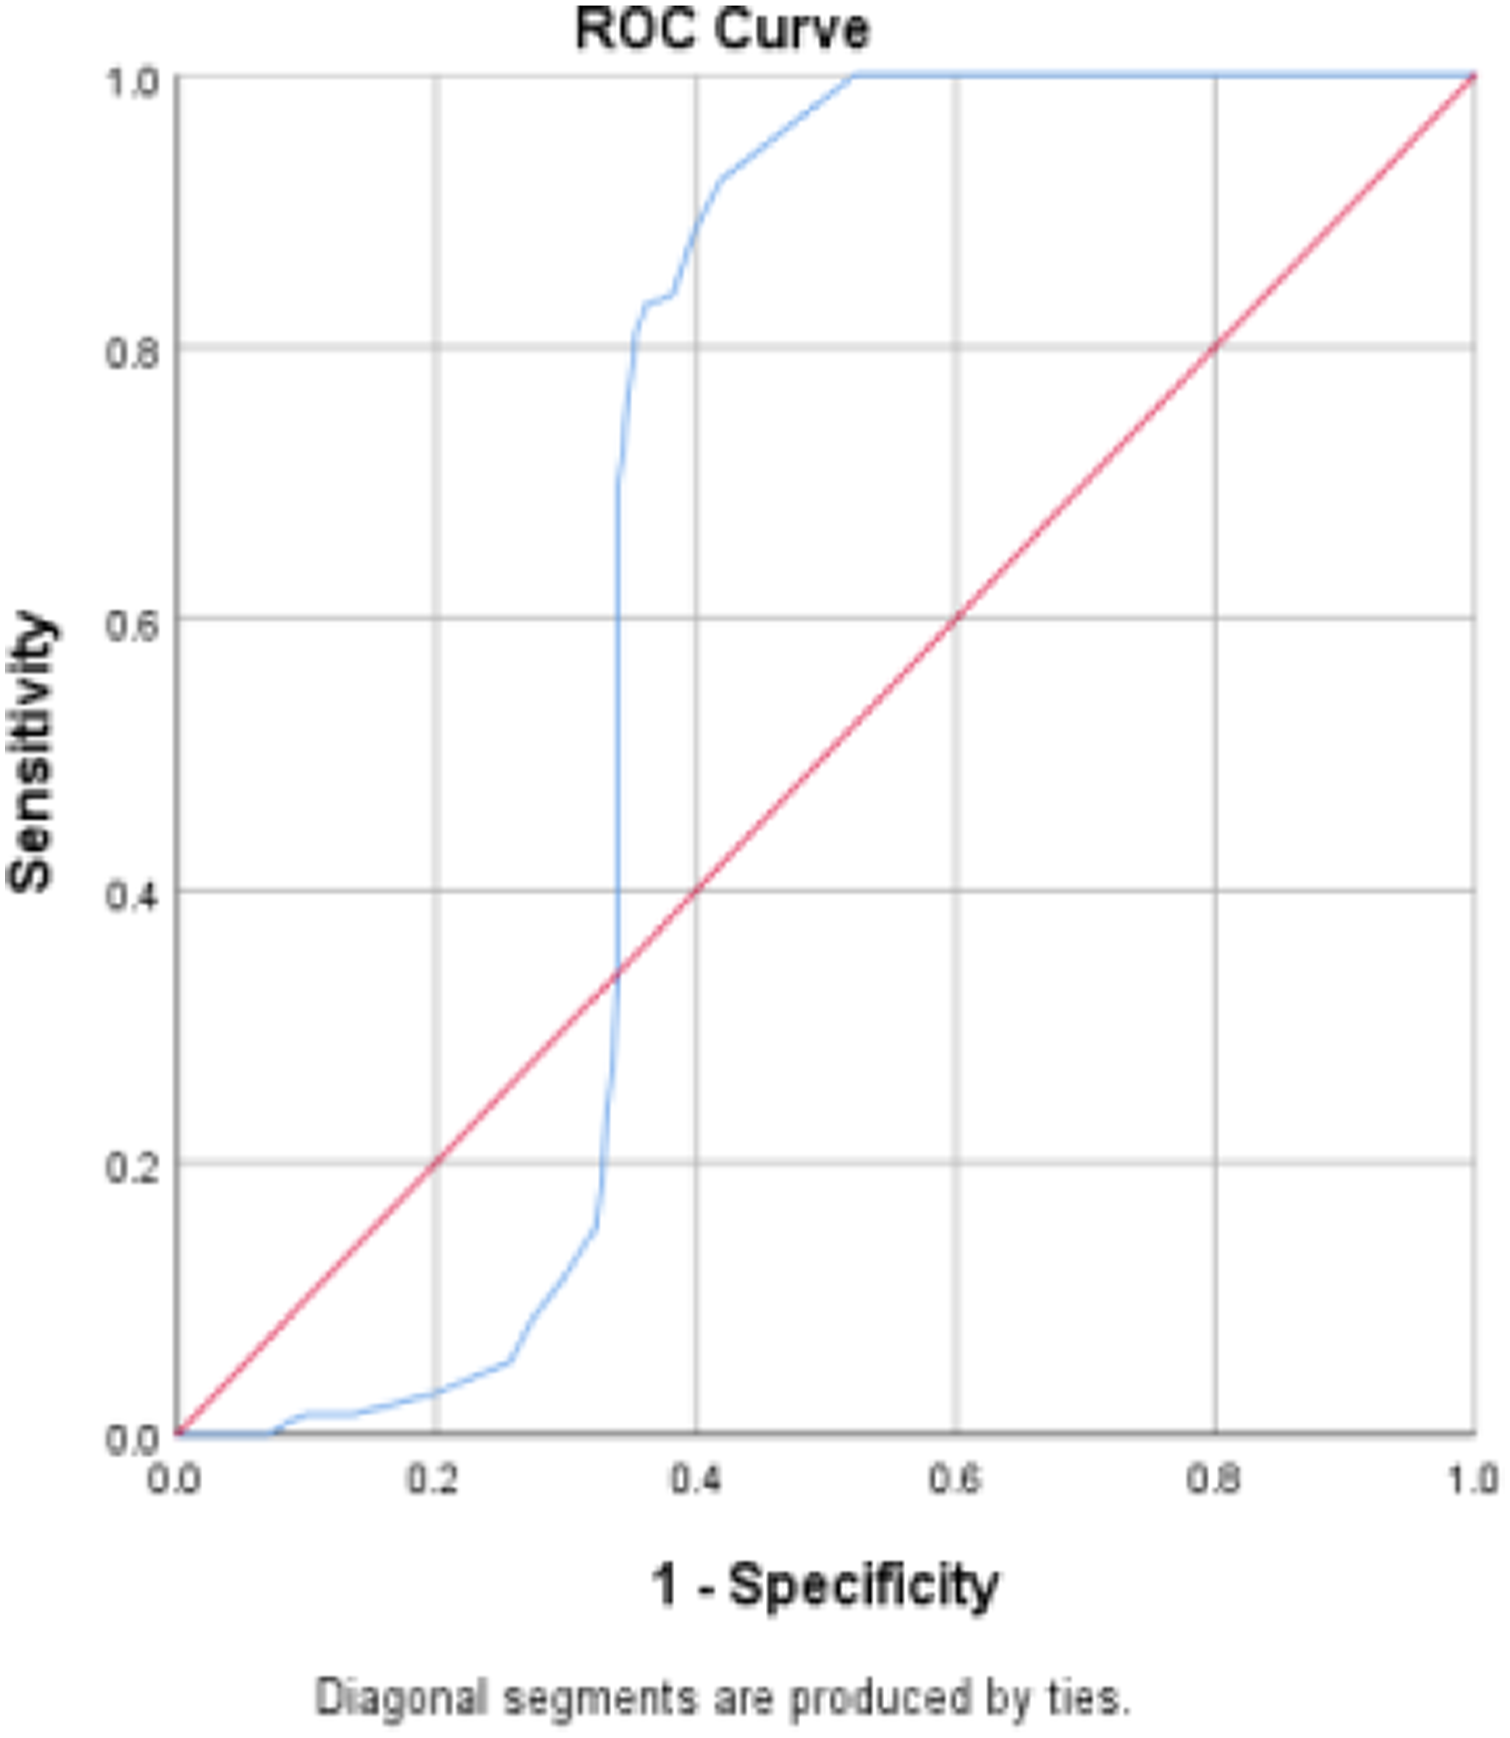
Figure 12 shows that the curve for TSV is above the diagonal line while that for PMV curve (as shown in Figure 13) is not closer to the upper left corner of the Y axis, the test is not accurate in detecting floor level of thermal comfort during winter. An area under the curve (AUC) of 0.659 (p < .001) shows that the test is not accurate and not better than a guess work. This means that the model cannot accurately determine the cutoff floor level for thermal comfort during winter. ROC curve showing the accuracy of the test (TSV) in predicting thermal comfort during winter. ROC curve showing the accuracy of the test (PMV) in predicting thermal comfort during winter.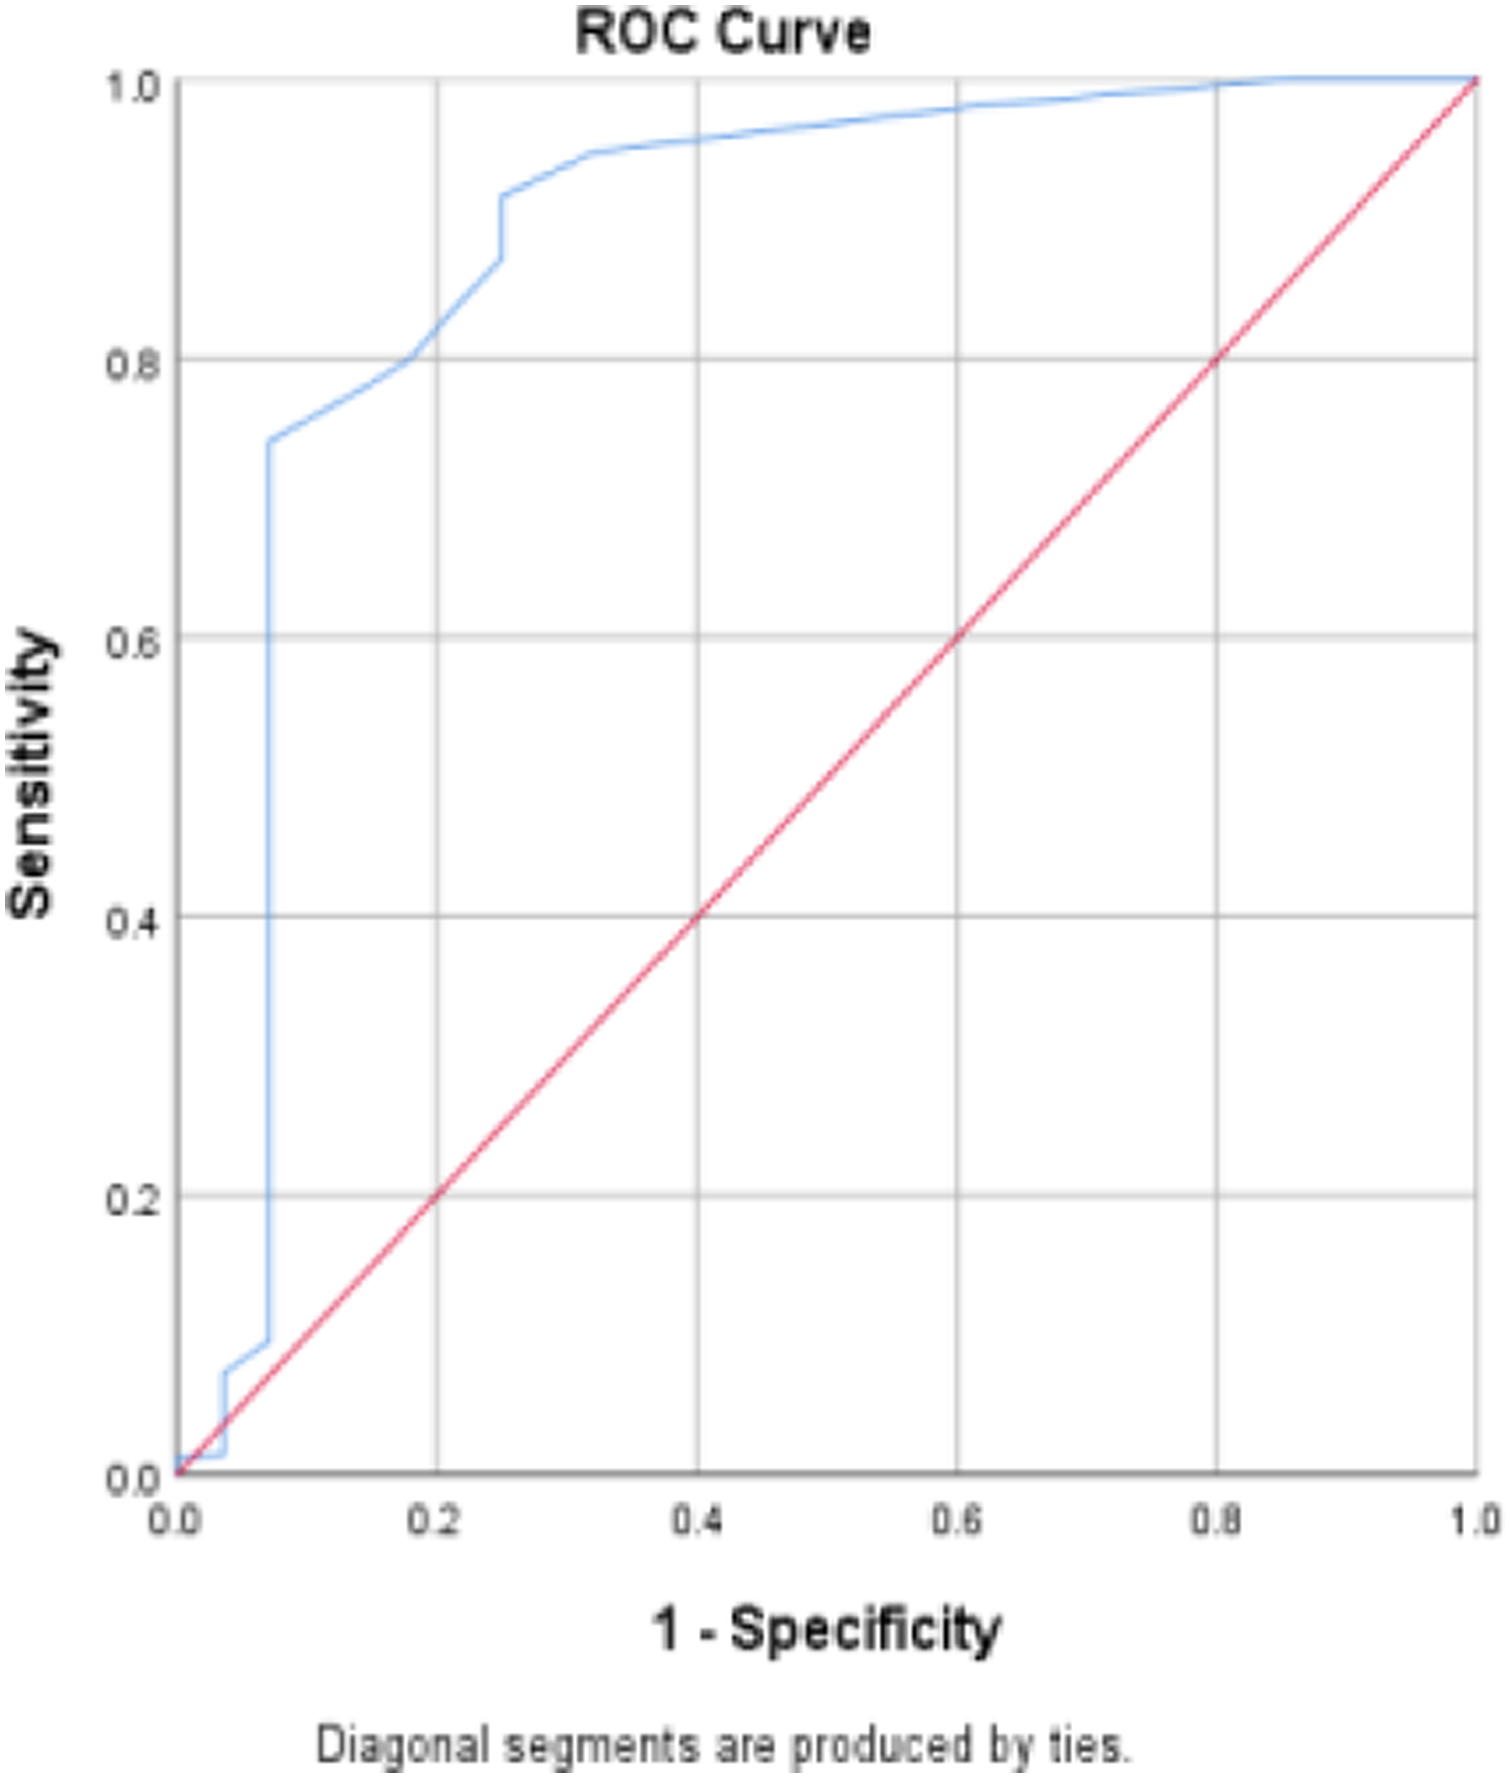
Data showing sensitivity and specificity at various cut-off points of floor level to predict thermal comfort (TSV) during winter.
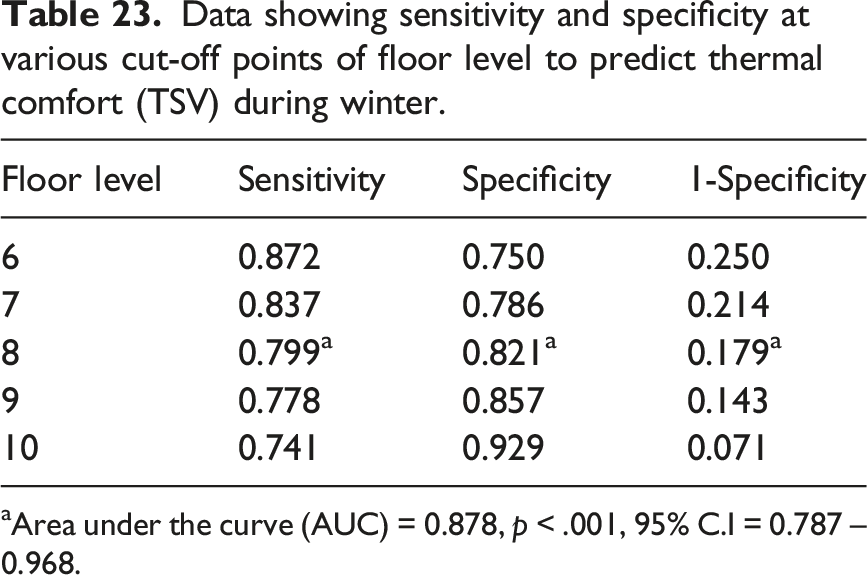
aArea under the curve (AUC) = 0.878, p < .001, 95% C.I = 0.787 – 0.968.
Discussion of results
The results of the study show that floor level significantly influenced the occupant’s thermal sensation votes (TSV), AC energy consumption and Predicted mean vote (PMV) in both seasons of the study. The study calculated the mean floor levels where the most TSV votes were obtained for thermal discomfort and for thermal comfort across the twelve (12) towers in order to get a general idea of the behavior of the floor levels with respect to both thermal conditions. Further, the data was checked for sensitivity and specificity to predict both TSV and PMV at various floor cut-off points during both seasons assuming TSV readings between (−1 to +1) as “satisfied or thermal comfort” while readings outside this range were treated as “dissatisfied or thermal discomfort” and PMV readings between −0.7 and +0.7 as acceptable comfort range.
Overall, higher floors were found to be associated with thermal comfort while lower floors were found to be associated with thermal discomfort. Results reveal that there is a significant relationship between the thermal sensation votes and floor levels as well as there is a significant relationship between predicted mean vote and floor levels in both seasons. The study found a significant positive and very strong correlation between thermal sensation vote and predicted mean votes. According to TSV, floor 22nd emerged as the optimal threshold points that gave the maximum correct prediction of dissatisfaction during summer while according to PMV it was floor 26. In winter, TSV produced floor 8th as the optimal threshold while the PMV was not consistent enough to be relied upon for predicting thermal comfort in winter. The study observed that the PMV seemed to over-predict thermal comfort in the Summer.
The developed mathematical models express these relationships in written form which could be used to predict the both variables in high-rise residential apartments with similar physical and environmental characteristics. The mathematical models (equations (2) and (3)) relates the predicted mean vote PMV to the floor levels. Because the study was treated as two different case studies observing the same phenomena in different apartments in two different seasons, two of such models emerged from the study. One model captured the relationship between the PMV and floor levels in summer while the second captured the same relationship in winter. The summer model (equation (2)) having a higher threshold, can be used for both seasons.
This equation can be used to predict the PMV by floors in other apartments with similar architectural configuration within the tropical climates as the study area. This means that designers can predict the PMV of the indoor space for a proposed high-rise tower of similar physical and climatic characteristics during the design stage and this can help in major decision making regarding number of floors (height) of the proposed building. It is a mathematical prediction of the PMV using floor-levels in a naturally ventilated high-rise residential tower of similar space and climatic makeup.
The findings of this study suggests that for an optimal design, the high summer AC energy consumption in high-rise residential buildings can be reduced when the buildings are designed with the identified discomfort thresholds in mind. Also, since higher floors provide more opportunity for passive comfort, lower floors could benefit from a prioritized, passive façade design allowing for greater comfort as against the typical same design from down to up.
The average apartment headroom was recorded as 2.95 m which translates to about 64.9 m height above the assumed normal ground level (GL) at the 22nd floor and 76.7 m at the 26th and 23.6 m at the 8th floors respectively. The study found a strong correlation between thermal sensation vote and AC energy use in summer, with 52.1% of variation explained by floor level. In winter, a positive strong correlation was found between thermal sensation vote and AC energy use, with 23.4% explained by floor level. A unit increase in floor level caused a 0.538-unit decrease in AC energy use during winter. The study suggests that floor level plays a significant role in influencing AC energy use during different seasons. The study reveals strong seasonal variations in the relationships between thermal sensation, predicted mean votes, floor level, and AC energy use. During both summer and winter, thermal sensation and predicted mean votes strongly influence AC energy consumption, with floor level also playing a significant role. The findings suggest that energy-efficient building design and management strategies, especially related to floor level, can have a substantial impact on reducing AC energy use in both seasons.
Age and gender showed no significant association (p > .05) with thermal sensation vote, thermal preference, and thermal sensation acceptability during the both seasons. The differences observed between age and genders were purely due to chance. Karjalainen 26 in a finland study which considered gender differences in indoor thermal comfort in homes, offices and a university found significant differences in male and female thermal sensation and preferences. Another study by 27 found up to 3deg.C difference in thermal preference of male and female occupants and that was more evident in office spaces. However this study was not aimed at evaluating the same as it was focused on influence of building height on indoor thermal comfort and AC energy consumption.
The study was concerned with apartments in opposite orientations for the different seasons. The reason for this is that, as discussed above in the section on Chennai weather, Chennai experiences generally dry weather with winds blowing from either the north-east or south-west orientations depending on the time of year. Hence, the impact of wind speed on indoor thermal conditions can be more tangible for the apartments towards the north-east or south-west during the respective seasons. Thus, in order to ensure that the best case conditions are studied, responses from apartments in N-E and S-W orientations were prioritized for the study and recorded for the respective seasons.
Further, Aflaki and Mahyuddin 28 in another study considering effects of building height on air temperature and wind velocity in Malaysian high-rise residential buildings found that, that there was significant differences between mean air temperature and velocity within units in the lower and higher floors. According to the study, the air temperature within the apartment unit at higher floor was cooler than the unit at lower floor which could be justified due to significant difference of indoor air velocity between the lower and upper floor levels. The results of their study demonstrated that the amount of indoor wind in the living room at unit in the upper floor was four (4) times higher than the amount for same room at unit in the lower floor. The difference in cut-off points (floor/height) for the thermal dissatisfaction thresholds in the both seasons could be traceable to the increase in temperature and relative humidity during the different seasons. The average monthly day temperatures for the summer and winter month in Chennai for the study year was 81°F and 90°F respectively while the average monthly wind speed and air humidity were winter (10.1 mph, 82%) and summer (9.4 mph, 75%). This could mean a greater degree of discomfort due to the increase in temperature and relative humidity as well as decrease in air speed thereby leading to more cooling demand on the air conditioning system which further impacts the AC energy consumption for the hot - humid season.
The findings of this study implies that tall residential buildings designed with the summer floor threshold in mind can benefit from more natural ventilation. Also the lower floors in residential high-rise buildings could benefit from a prioritized custom passive design that allows for greater comfort as against the conventional typical design from down to up. The higher floors in high-rise residential buildings provide better passive thermal comfort in tropical climatic regions than lower floors. There must be however the possibility of a second cut off point higher up the building beyond which the natural weather conditions may not permit for natural ventilation. This can be investigated using a similar study in taller residential buildings.
Conclusion and recommendations
This study turned the spotlight on the relationship between occupants’ thermal comfort and AC energy consumption with respect to floor levels in tall residential buildings in the tropics. The positive strong relationship between thermal sensation votes and AC energy consumption as well as the identification of floor levels as a good predictor of thermal comfort is priceless piece of information that can be beneficial to architects and designers. The mathematical models developed from the study and the cut off floors identified for the various seasons can be used as a guide when designing naturally ventilated high-rise residential buildings with similar physical and environmental characteristics in tropical climates.
In conclusion, by prioritizing sustainability and taking proactive measures, the high-rise residential design can evolve into a more environmentally friendly and climate-conscious living option. The challenge however remains to figure out a means of keeping the energy consumption due to other factors such as more lifts, more lighting, more home appliances and so on which come into play with increase in height, equal to, or less than that saved from ventilating the buildings naturally.
Footnotes
Acknowledgments
The authors wish to acknowledge the kind support of all the staff and management at the Houses of Hiranandani in Egathur Chennai for granting us permission to approach individuals for participation in the study. We especially thank the kind mail man who helped us distribute our initial call-for-participation to all households within the gated community. We also acknowledge the assistance of the Architecture interns who provided language translation help as well as field work assistance for data collection.
Authors contribution statement
All authors contributed equally in the preparation of this manuscript.
Declaration of conflicting interests
The author(s) declared no potential conflicts of interest with respect to the research, authorship, and/or publication of this article.
Funding
The author(s) declare that no financial support of any kind was received for the research, authorship, and/or publication of this article