
Abstract
Heating and ventilation in buildings and vehicles are responsible for over a third of global final energy usage and the resulting emissions. Local climatization can help to save energy while at the same time enable more individualized and adapted micro-climates around people. For the domain of local comfort, integrative test environments for sensors, actuators, and control software are scarce, and oftentimes tailored to a specific set of components. Here, a server-based modular testing infrastructure which allows integration and evaluation of sensors, actuators, and control strategies is presented. Currently, the system is able to integrate, monitor, and log data of thermal imaging, motion sensing, environmental sensor such as temperature or air velocity and to forward signals to actuators such as fans, infrared- or contact-heaters. The generation of control signals is model-based and relies on user feedback provided via the system’s smartphone app. Lastly, learning algorithms can be trained and compared during user studies.
Introduction
Although emissions are currently on the decline due to the Covid-19 pandemic and first positive effects of power sector decarbonization, building construction and operation still account for 11.7 Gt of carbon dioxide emissions. 1 The sector is responsible for 37% of the global CO2 emissions and 36% of the global final energy use, 2 and some authors project an increase of future energy demand in order to cool buildings. 3 Air conditioning in private cars as well as public transportation and trucks “only” accounts for about 1.5% of global CO2 emissions, but this sector offers promising saving potentials for the 420 million tons of CO2 equivalent 4 as well.
As climate change is acknowledged as one of the main challenges of our society, decarbonization and energy efficiency efforts have been undertaken in all sectors. For the purpose of providing satisfactory and healthy thermal comfort to persons, local climatization has been identified as a promising approach. This holds true not only for workplaces with extreme temperatures,5,6 but also for typical office workspaces.7–10 Individual as well as public transportation ranging from cars to aircraft cabins also spiked research interest.11–13
Local climatization reduces energy consumption and at the same time allows for a better accommodation to individual thermal preferences. Typically, large air volumes are conditioned and provided to building zones or rooms. In contrast, local climatization creates a microclimate around a person. Furthermore, technological advance has facilitated sensor and control algorithm utilization in residential settings,14,15 leading to unprecedented possibilities to incorporate user feedback and real time comfort assessments into building automation.16–18
In this paper, recent studies on local comfort and real-time incorporation of occupant feedback are briefly reviewed. Then, the server-based testing infrastructure is described. The platform is able to predict a person’s state of thermal comfort, adjust local actuators in order to maintain a desirable thermal condition, and to train individual models using machine learning. Thermographic imaging is used to acquire skin temperatures without the need to apply sensors to the body. Lastly, the user app which enables collection of thermal comfort and thermal preference for model improvements of the system is described.
Local and human-in-the-loop climatization approaches
The availability of cheap yet sophisticated sensors and actuators has led to advanced monitoring and control systems for thermal conditioning as well as indoor environmental control in general.14,19–21 User preferences are monitored more closely, and can be integrated into HVAC systems with advanced algorithms.22–24 These approaches have been described as cyber-physical-social systems, 25 context awareness, or human-in-the-loop. 26
Starting as task-ambient systems,8,27 the idea of localized and Personal Climatization System (PCS) has gained attention in residential and vehicular applications.7,28–31 These systems can, for example, be configured as desk-mounted devices,32,33 chairs which can be heated or cooled,34,35 or personalized ventilation nozzles, 36 allowing the systems to target body parts individually. 37 Advantages of PCS have been demonstrated both in terms of increased individual comfort as well as energy saving potentials.9,38–41 At the same time, persisting difficulties are reported, e.g. the placebo effect. According to Song et al., 39 this threat arises because neither investigators nor participants can be blinded from cooling or heating efforts. PCS effects with naive testing subjects. Song and colleagues also remark the difficulties of comparing PCS studies due to differing designs, methodologies, testing subject characteristics (such as age or clothing), and environmental conditions, which altogether complicate an overall assessment of PCS.
Skin temperature has been identified as an important indicator of thermal comfort, and its usefulness as control signal for thermal conditioning has been demonstrated.42–44 A stepwise regression model by Choi and Yeom 44 which combined multiple local skin temperature measurements an gender, was able to predict thermal satisfaction ratings with an accurary of 95.2%. Similar prediction results were obtained in a follow up study, which also included heart rate as a physiological parameter. 44
Using indoor environmental measurements, skin temperature, and heart rate, Deng and Chen 17 applied an artificial neural network to control an in-situ HVAC system. Increased thermal comfort and energy savings were shown. Imaging systems to track clothing level of occupants or occupancy in general were discussed as possible improvements.
Li et al. 18 measured skin temperature and environmental variables which were fed into a fuzzy comprehensive evaluation strategy which in turn controlled a central HVAC system. Showing saving potentials of about one fifth of the daily consumption, the authors also report that these systems do not necessarily rely on “active” human feedback such as answering comfort questions or necessitating keypad entries. Yet, discrepancies between the predicted and actual thermal sensation was observed, posing the question whether a combination of active and passive user consideration may be necessary.
Combining color, depth, and thermal imaging data, Cosma and Simha 45 showed a high correlation of skin as well as clothing temperature with thermal comfort votes given by the test subjects. In a follow-up study, Cosma and Simha 16 used their system together with machine learning classifiers in order to predict the time when people would start to feel thermal discomfort. This approach closes the loop to the HVAC control system, yet, actuators have not been added to this system so far. Other researchers applied this technique to estimate the occupants clothing level, which has a strong influence on heat exchange with the environment and mediates thermal perception. 46
According to Gholamzadehmir et al., 23 one of the major challenges in improving acceptance of PCS is to test more systems in real-life applications in residential or non-residential buildings. Testing on earlier development stages would also benefit from a research platform such as the system presented in this paper, since many questions regarding the user interaction, actual energy use, and saving potential as well as the integration in existing building stock and HVAC systems remain open. Research on PCS would strongly benefit from replicable testing situations to quantify and compare energy and cost saving potentials.
Despite the breadth of research conducted so far, we think that PCS approaches are still in need of more systematic study in laboratory contexts before application in real world settings. Some research questions regarding the fundamental personal comfort models, often guiding and controlling PCS, remain still unsolved, 47 which lead to difficulties when comparing different systems and pose hindrances to successful field implementation.
System design and data exchange
In order to ease research and component testing in local climatization applications, we propose a modular, extendable system architecture suitable for tasks such as hard- and software tests, sensor fusion, data aggregation, and evaluation of control strategies. Whenever possible, the platform builds around open-source software as well as open standards and communication protocols.
At the heart of the system, a client-server architecture is used for system components to communicate via a REST API. The centralized communication avoids software inter-dependencies which makes the system easy to extend and to maintain. Each component connected to the system has a dedicated task and may or may not require direct hardware access. Figure 1 depicts the components that are described in the following sections. Schematic of the system architecture. The type of data exchange is indicted by arrows and lettered symbols.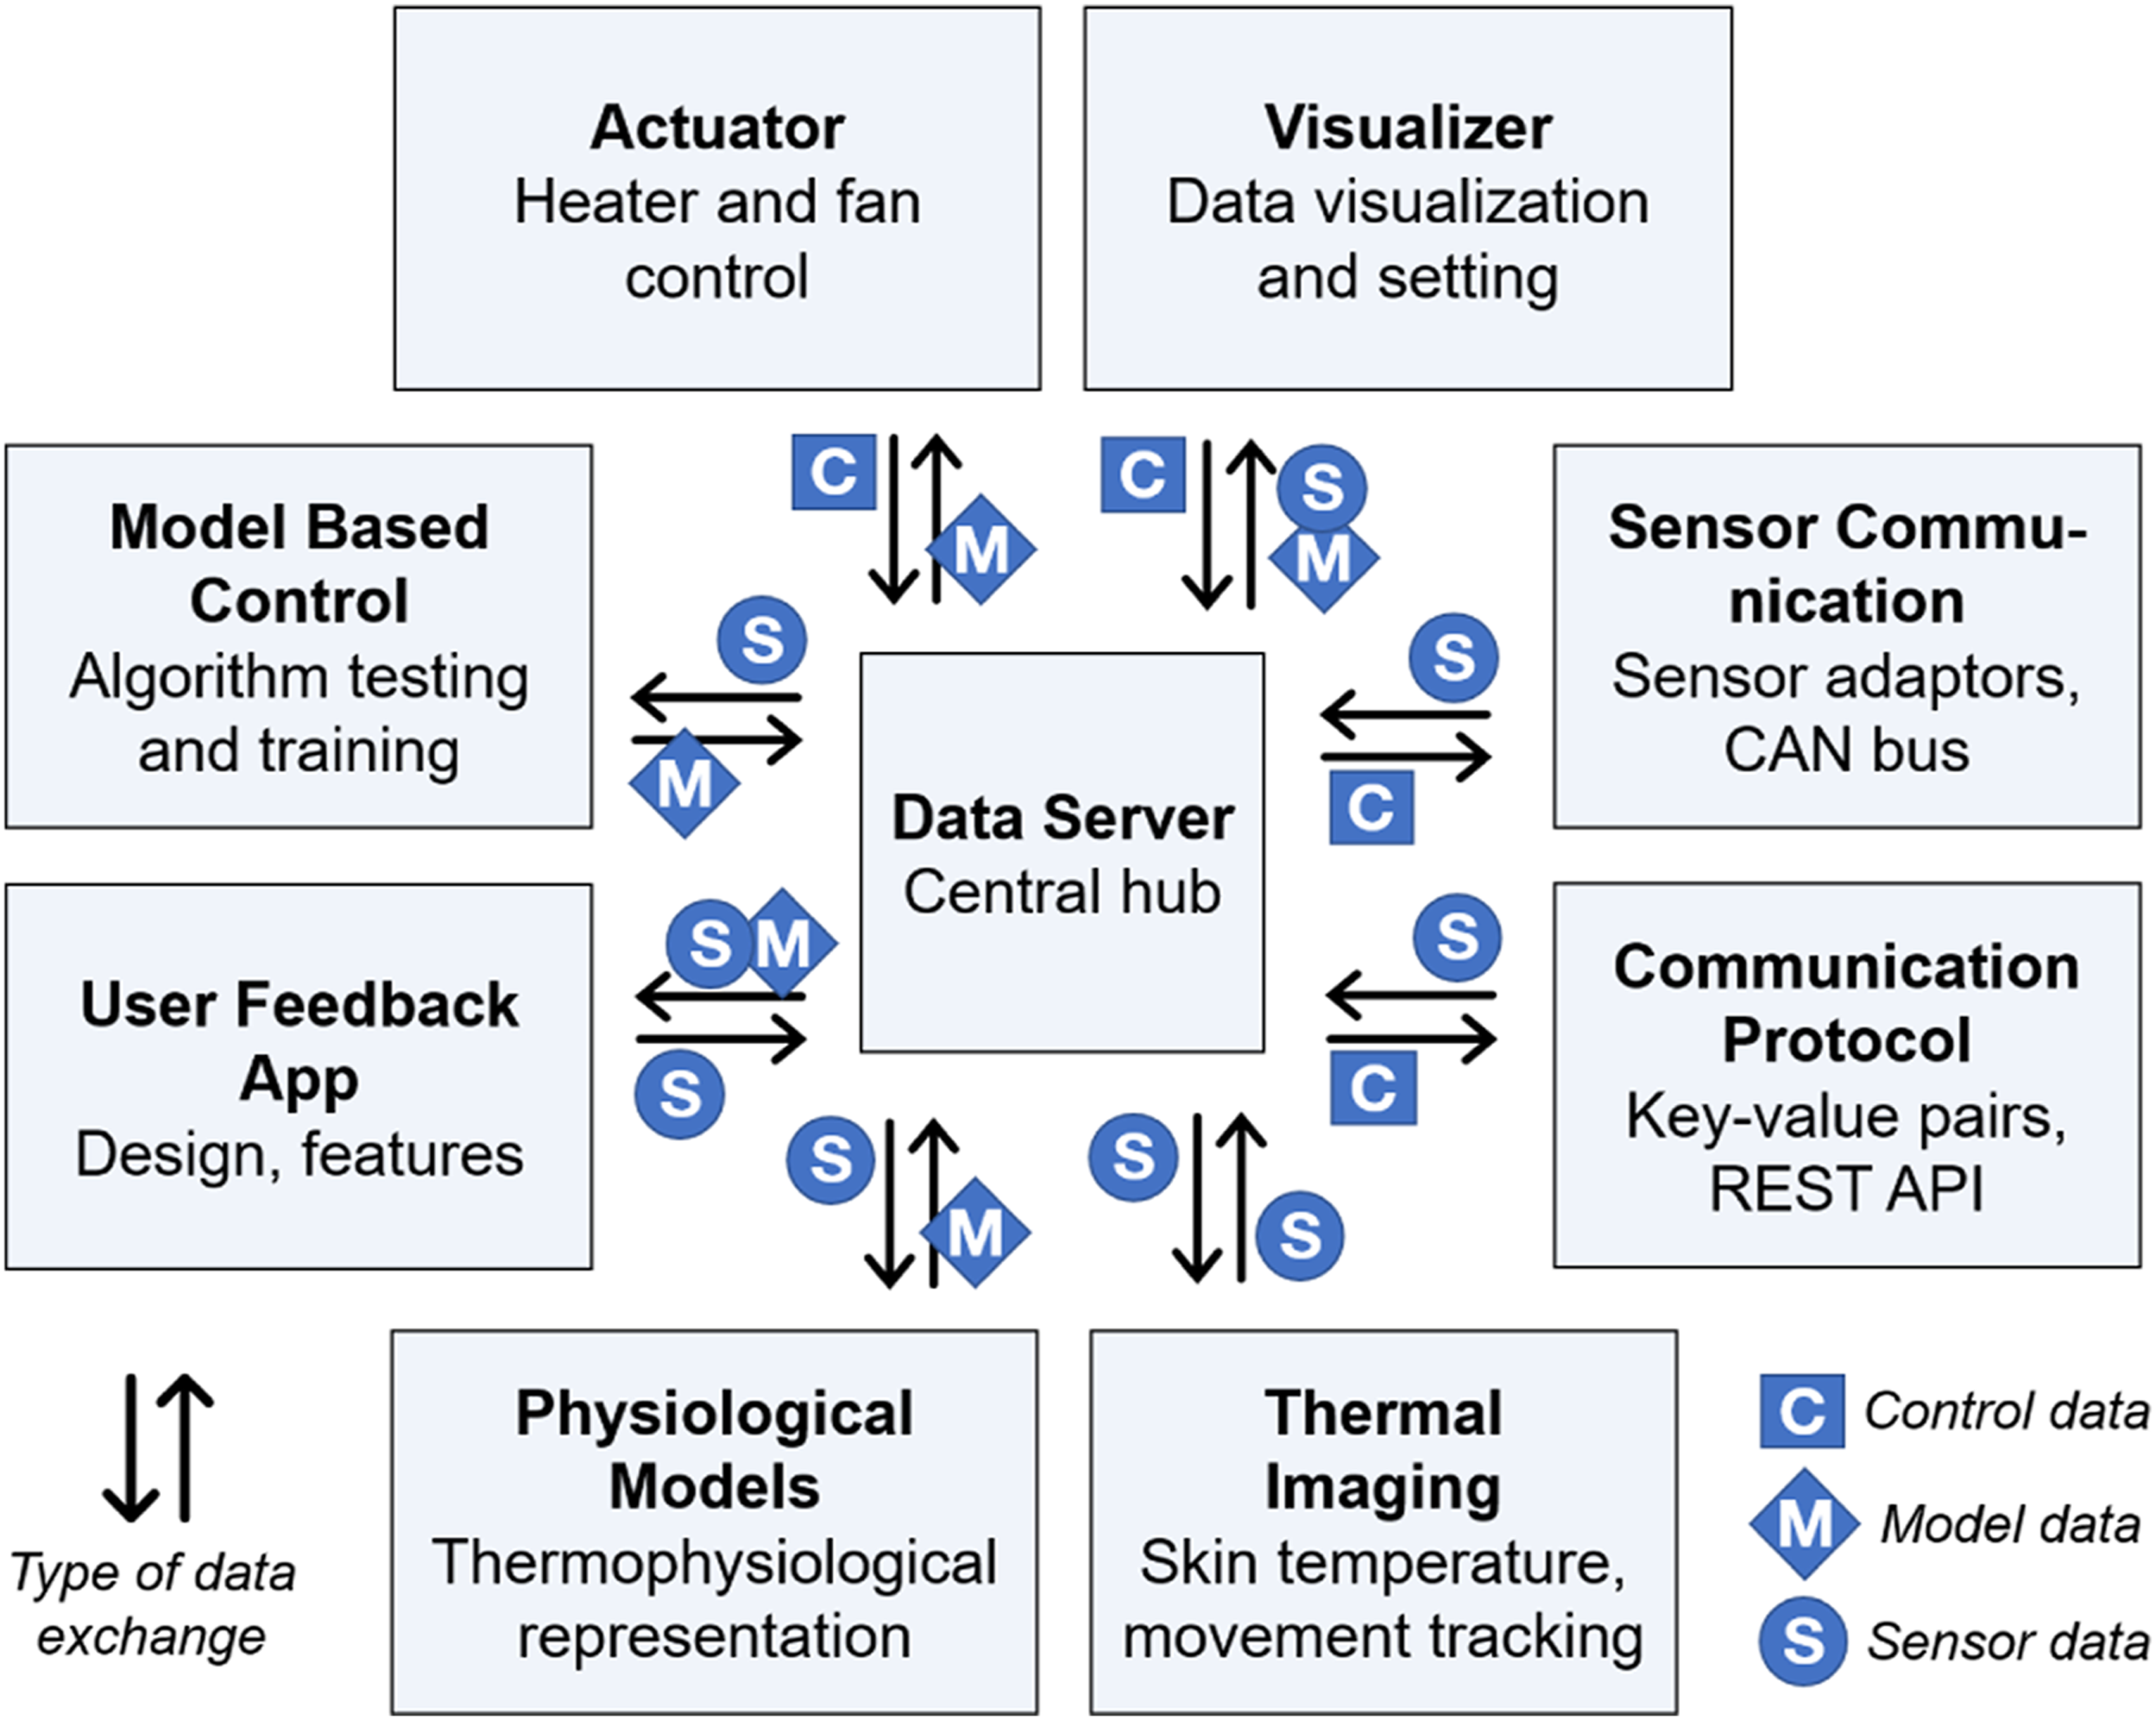
Data server
The data server represents the central communication hub. It runs within a Ubuntu Linux environment and provides a REST interface that can be used to store or retrieve key-value pairs from an internal hash map. This design can be regarded as a type of dependency injection, since each component maintains lists of signals that it frequently sends and retrieves. Signals are sent and retrieved at an interval of one send/request per second which was considered sufficient for the tasks related to personalized thermal conditioning.
Communication protocol
In order to exchange information, components use key-value pairs where each pair refers to a signal within the system. The key represents the signal name, while the value represents its current value and can be any sequence of alphanumeric characters. Signals are not directly communicated between components, but requested and sent from and to the data server’s REST API. The data server maintains a temporary key-value map where the most recent value corresponding to a key is stored. This allows components to communicate asynchronously. If signals need to be time-synced it is the component’s responsibility to send and read timestamps along with the signals. Listing 1 in the Supplemental Material shows an example of a key-value pair stored in the data server (contained in the send node) and two values requested from the data server (contained in the request node). The server replies with the values of the two requested keys which can then be used by the requesting component.
Signal database
The signal database is a central lookup table for signal metadata. It serves two main purposes: components can determine if a signal exists and a component can retrieve metadata about a signal, such as its min. or max. value or its physical unit. Usage of the signal database is optional and the data server does not check for existence of a signal in the database before storing key-value pairs. Hierarchy within signals is introduced through dot notation. For example, if two or more similar sensors exist in one setting, the sensors are prefixed using their locations e.g.
Sensor communication
Environmental data from various sensors can be fed into the system via two main communication protocols. The Sensor adapter component is used to inject physical sensor measurements into the system. While listed as a single component, there are usually multiple sensor adapters running in parallel, each of which is connected to one hardware interface. The adapter supports serial and Telnet interfaces. The data is acquired at regular time intervals and then mapped to signals based on predefined keys. Hence, the sensor adapter component is solely responsible for converting distinct sensor data formats into signals and guarantees sensor readability throughout the system.
Alternatively, the system can be interfaced via a controller area network protocol (CAN bus). Besides the possibility to incorporate vehicle HVAC components into the testing setting, the CAN bus adapter enables the system to write values to the bus, e.g. in order to manipulate temperature set-points. The adapter is implemented in C++ and uses a C library by Vector Informatik company called “Vector XL-Driver Library” 48 that interacts with physical CAN connectors (VN1630A interface).
Visualizer
The visualizer component is a tool for central real-time monitoring of all communication data within the system. The software is implemented in JAVA programming language and requests desired signals from the data server at a fixed time interval. Each signal can be visualized as a time series plot or on a three-dimensional geometry using pseudo-color mapping. The visualizer is important for system testing purposes but also during experimental evaluations. For example, the experimenter can monitor skin temperatures captured using the thermal camera along temperatures reported by room temperature sensors to assess quality and plausibility of collected data. Figure 2 shows a screenshot of the visualizer with two manikin visualizations and corresponding time series. The visualizer can be customized to show pseudo-color visualizations on 3D geometry (top half) alongside time series plots. Data recordings can be started, paused, or stopped with the buttons at the very bottom.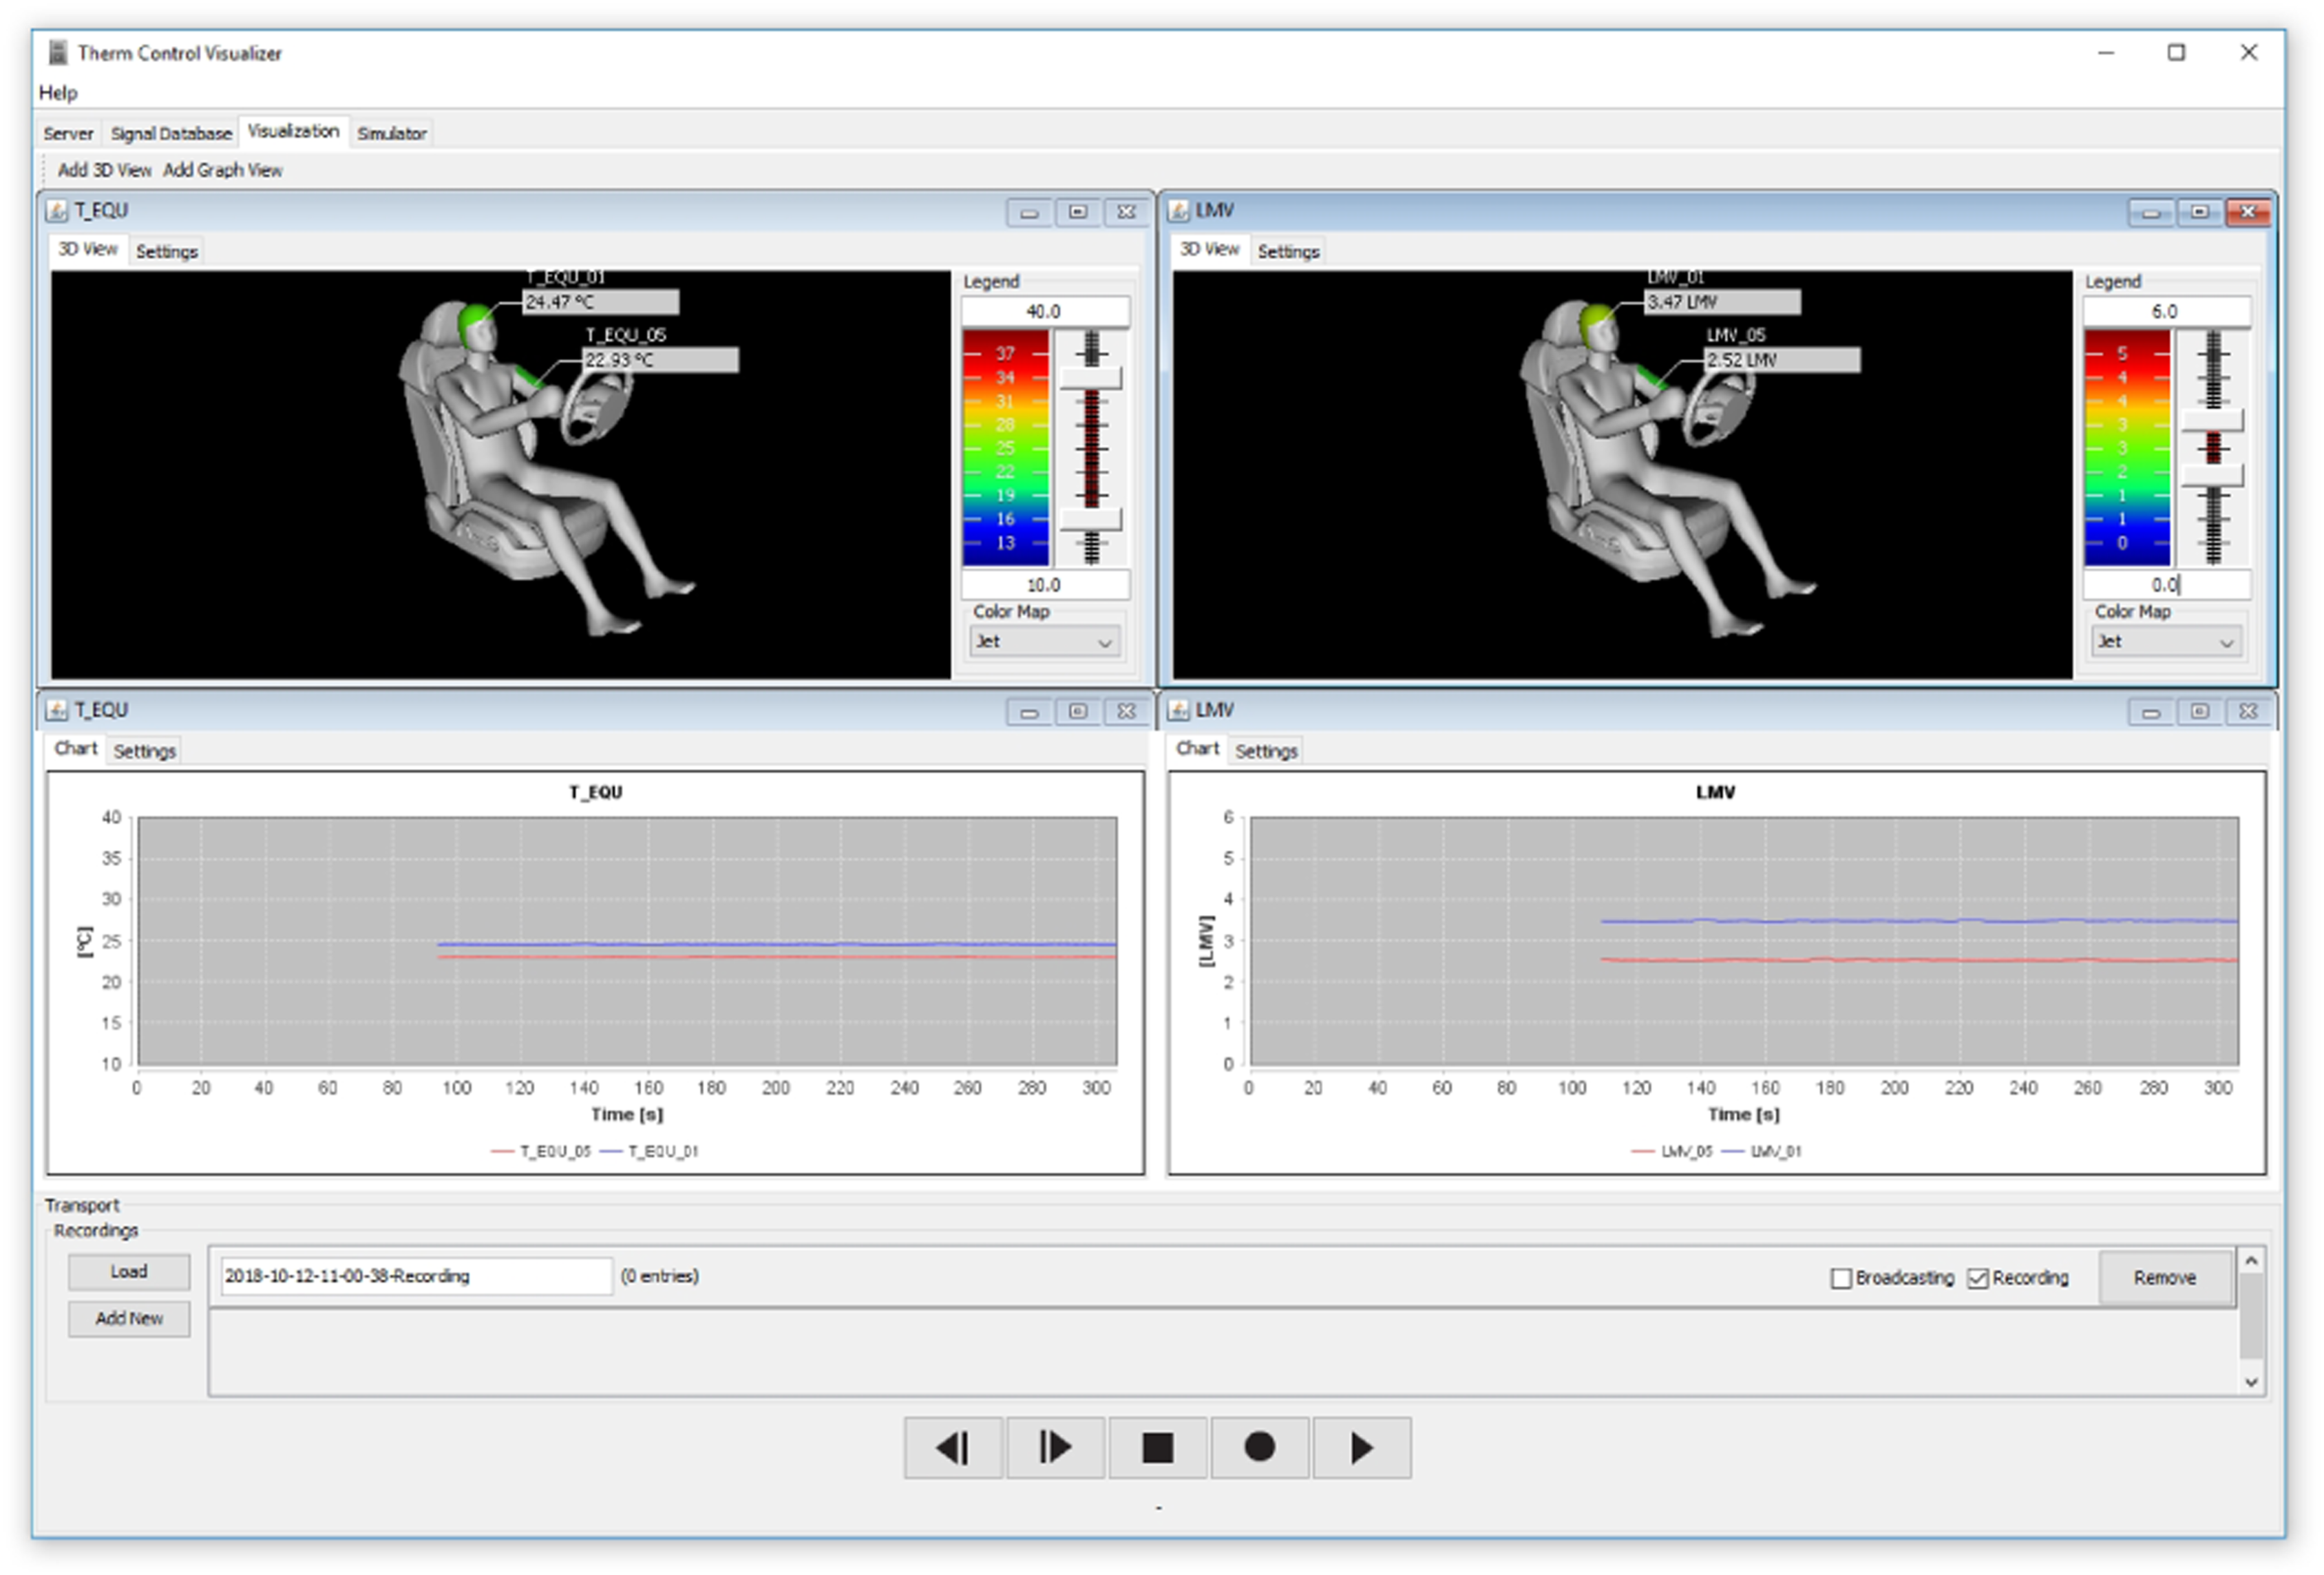
Actuator adapter
Similar to the sensor adapter, the actuator adapter is the connection between the system and the actuator hardware. It converts data server control signals into actual data required by the actuator hardware. A combined local actuator (Figure 3) was used in this system, one on each side of a seated user. It comprises two radiant heaters with an output of 150 W each. On top of the heaters are two radial fans (50 × 50 × 15 mm) with max. 5.000 r/min. An Arduino microcontroller converts signals to hardware setpoints. Starting from the actuator adapter, control signals are converted to a pulse width modulated DMX signal. This low voltage signal is used by an EDX-4R DMX controller which then provides power to the actuators. Prototypical local actuator with two infrared heater lamps and two fans mounted at the top.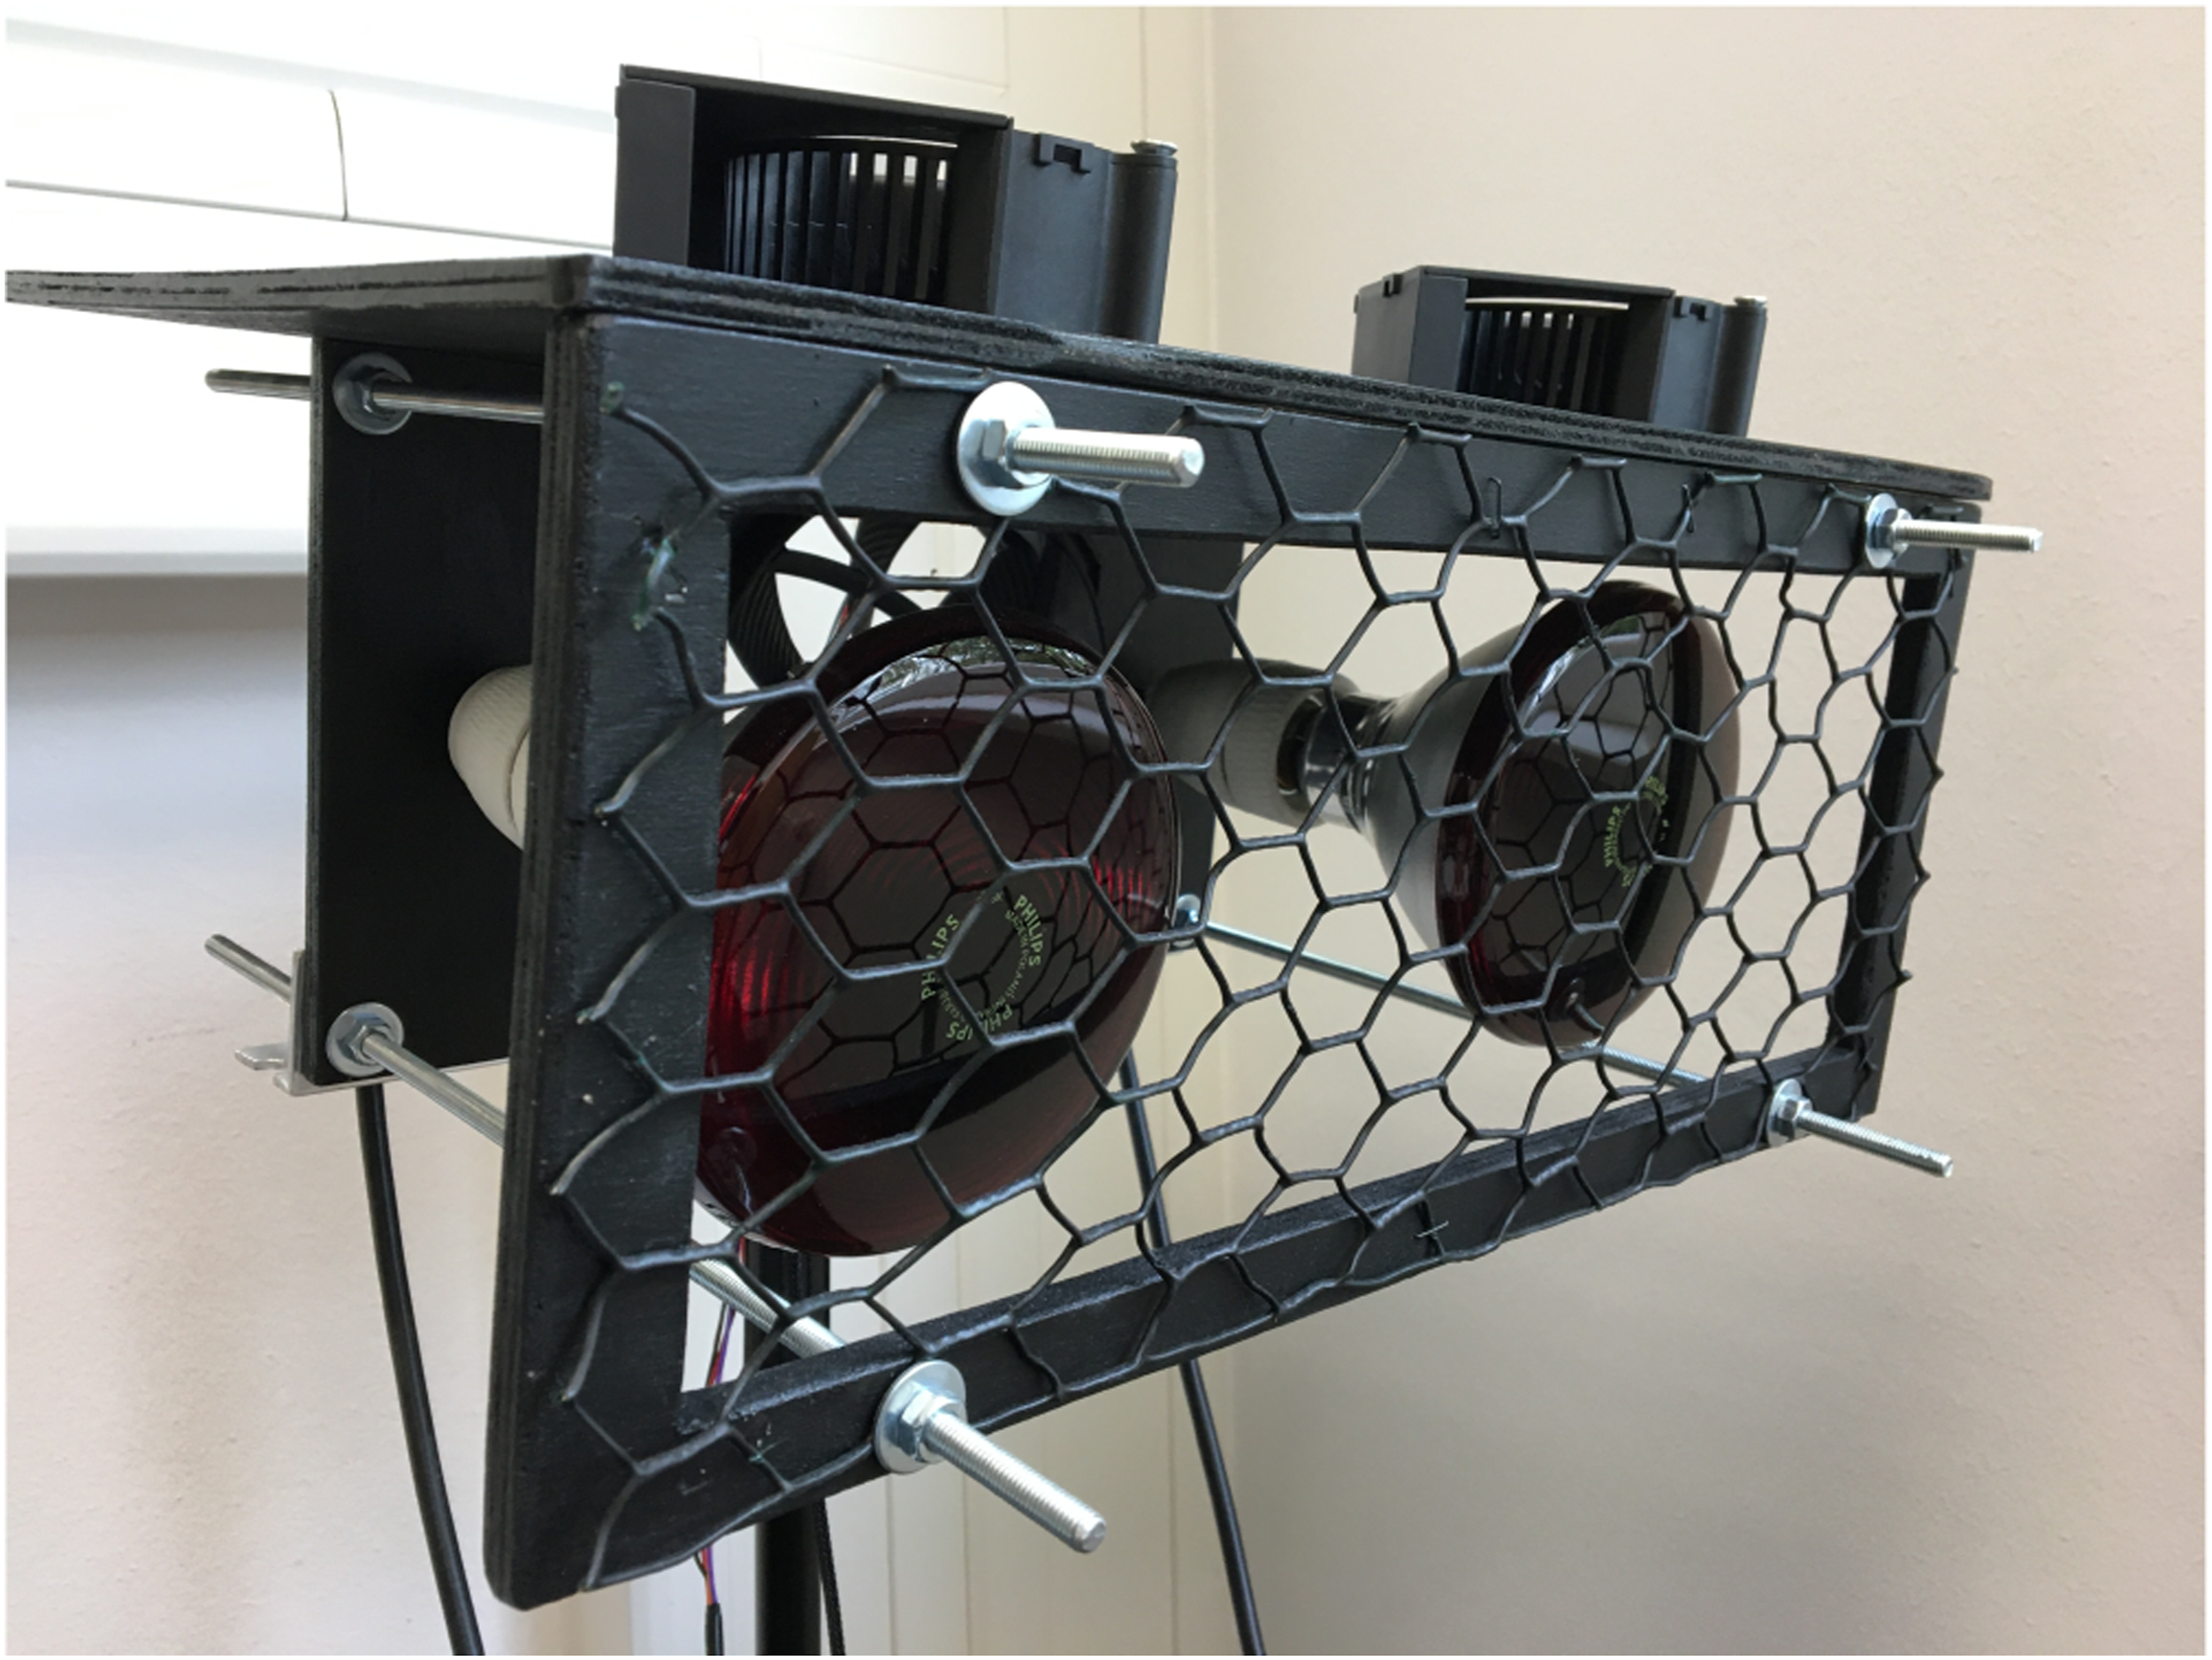
Thermal imaging
The thermal imaging acquires thermographic skin temperature without contact. A Microsoft Kinect 2 is used to track face and pose, and extracted body positions are a foundation to measure temperatures using a FLIR A65 thermal camera. Two separate programs acquire information from the two camera systems, while the main vision component synthesizes the information and forwards them to the data server. Specifically, the vision component creates a server where a Kinect client program and the thermal client program (GAPI client) can send real-time tracking positions and raw 16-bit thermal images. The main program then converts 16-bit thermographic pixels at selected regions and forwards them to the data server. A more detailed evaluation of skin temperature measurement using this process is presented by Metzmacher et al. 49
Kinect client
The Kinect client is a C++ program that communicates with the Kinect camera. It consists of a single thread that continuously requests color and depth frames as well as face and pose information. Face and pose information are x, y coordinates that refer to specific body joins and are continuously updated. The coordinates are in Kinect depth camera space and have to be converted into thermal camera coordinate space. 49 Listing 2 shows the list of Kinect joints. Each measuring point is linked to a Kinect joint along with an adjustable spatial correction offset.
GAPI client
The GAPI client serves as an adapter for the thermal camera. The software is also implemented in C++ and uses the Baumer GAPI 50 to connect to the GigE vision enabled FLIR A35 camera. GigE is a standard for machine vision cameras to communicate data over common Ethernet networks. The GAPI client sends a 16-bit raw thermal image to the main vision component, as well as a list of camera parameters that are required to convert the raw thermal pixels into actual temperature information.
Vision
The vision component receives the camera data from the Kinect and GAPI clients and synthesizes the information for the data server. The software is implemented in JAVA and has no direct hardware dependencies. The data from both clients are combined using a single thread loop which is executed at a fixed time interval. The loop combines position information of detected joins with respective thermal pixel data and obtains temperature readings at the respective points. The imaging component has a user interface that shows the thermal image in scalable pseudo-colors as well as the defined measuring points (see Figure 4). The tracked measuring points are also visualized as time series plots next to the thermal image. Vision component user interface. Left: Thermal image, adjustable color map, and overlayed Kinect skeleton. Right: Real-time temperature measurements.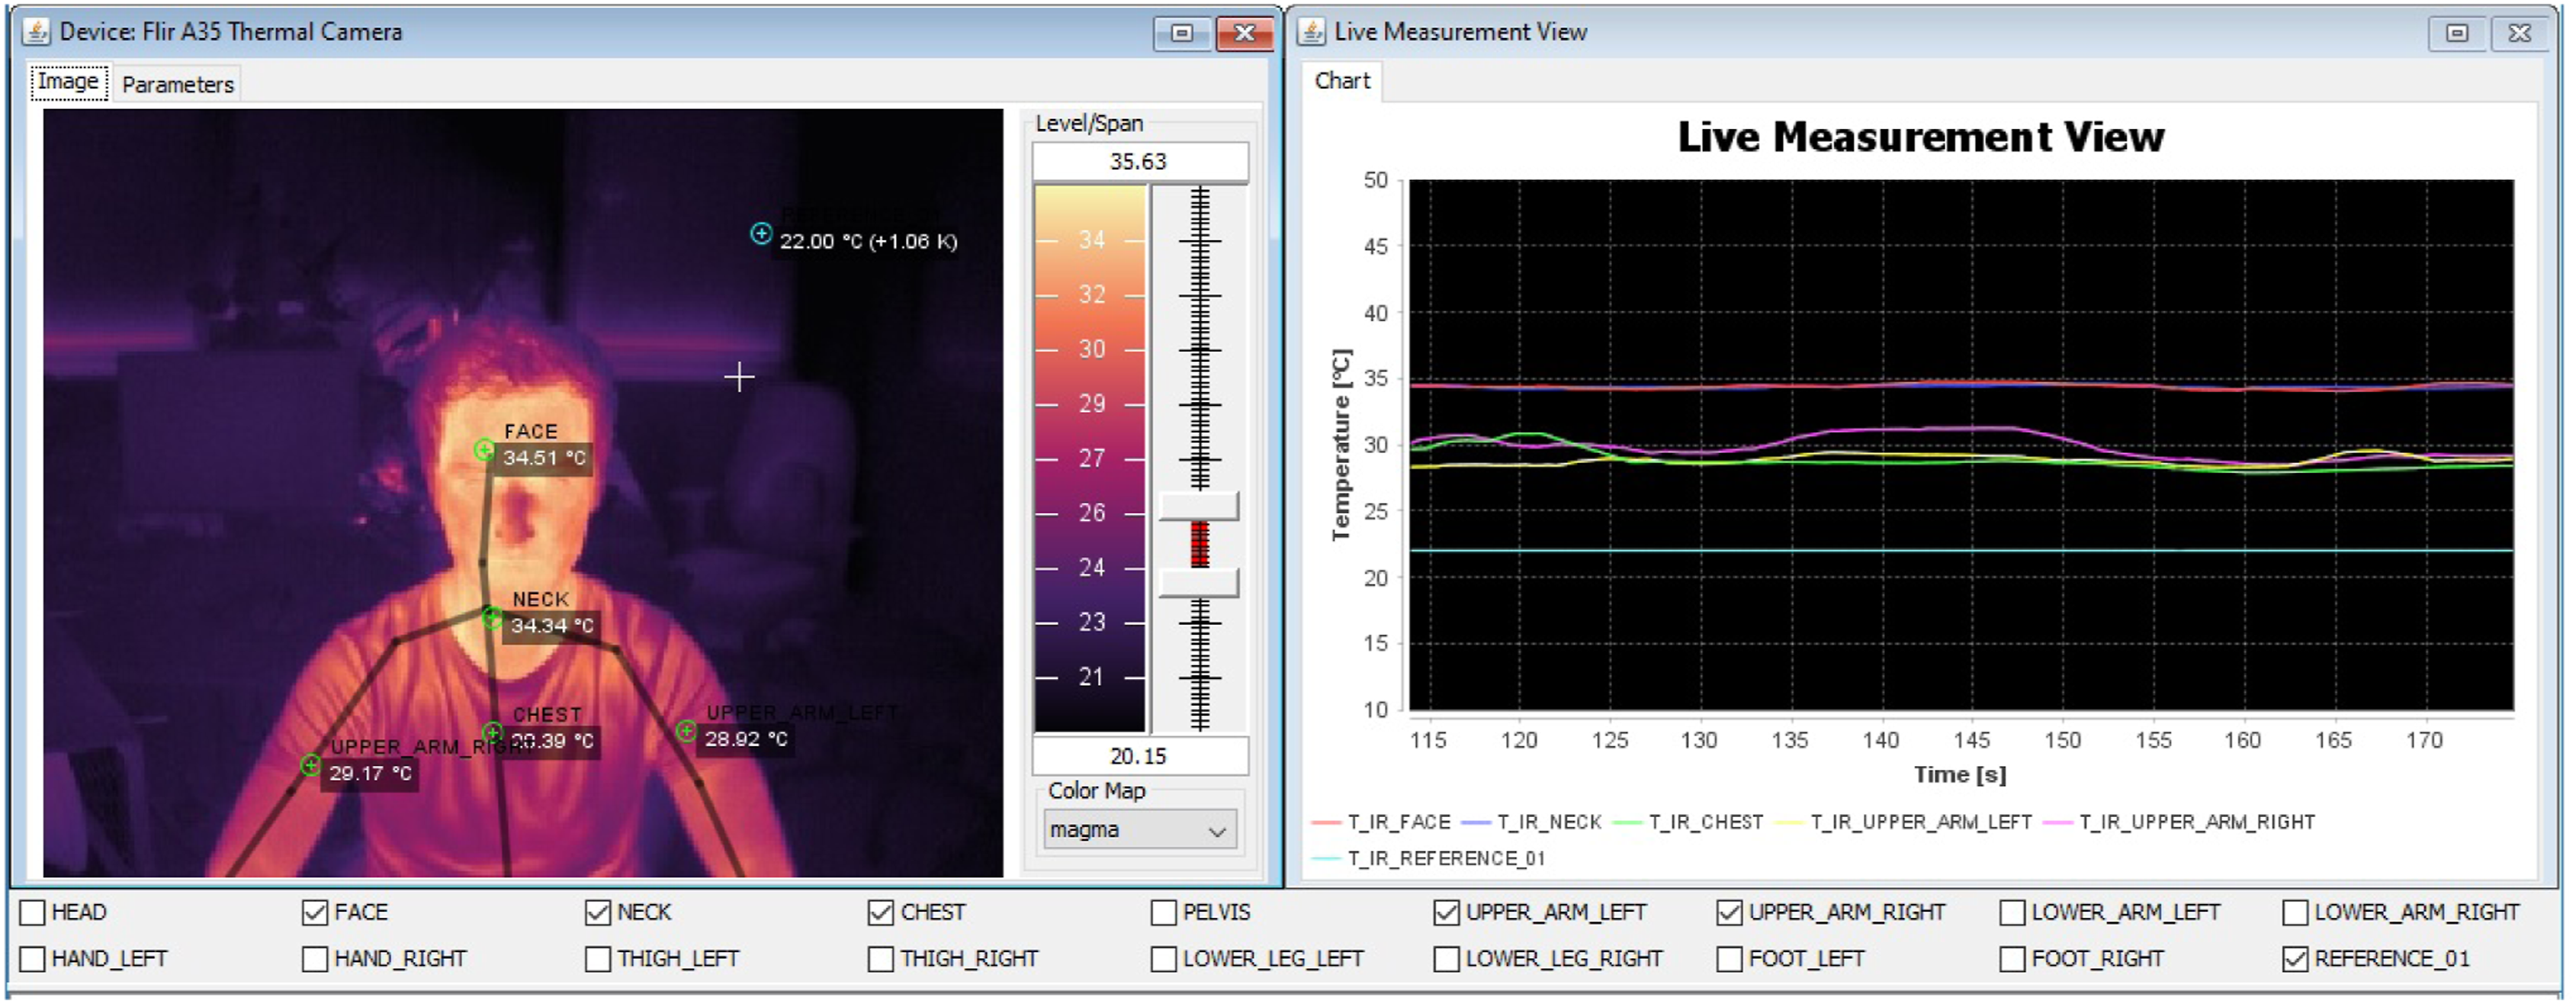
Spatial pooling and reference temperature
Measuring points can be defined and connected to a tracked body join. Measuring points have a fixed radius that defines their spatial pooling. The average temperature of pixels within this radius is the measuring point’s temperature. For the system presented here, a radius of four pixels proved to be a good balance between noise and accuracy. The accuracy of temperature measurement is improved through a reference sensor. The temperature of the reference sensor is visible to the camera and can be compared to the temperature measured in the thermal image for offset correction. This continuous calibration is done each second throughout the measurement.
Thermophysiological model implementation
Depending on the research question or testing purpose, various thermophysiological models can be implemented in order to predict thermal comfort states or to control actuators. The MORPHEUS component is a wrapper for the thermophysiology model developed by Wölki. 51 It is implemented using the declarative modeling language Modelica and integrated into the system through a functional mockup interface (FMU). It is a hybrid model that combines parts of models proposed by Fiala 52 and Tanabe et al. 53
The balanced comfort model (BCM) by Schmidt et al. 54 provides thermal comfort assessments under inhomogeneous climate conditions and builds on the work of Fanger 55 and Zhang. 56 Schmidt introduces calculations of energy balances at local body elements as well as additional terms in order to improve prediction accuracy. The BCM is able to create thermal comfort assessments at both the global level and the local level. Taking heat exchange processes into account, the model calculates energy balances for each body segment which serve as input parameters for the local thermal sensation model based on the regression models introduced by Zhang.
User integration and feedback app
User integration can be utilized for collection and management of user feedback, model training, and real-time visualization of data-streams. The user component also includes an interface showing and allowing adjustments of actuator controller states. Beyond generic thermophysiological models mentioned in section Thermophysiological Model Implementation, individual thermal comfort models can be implemented, trained, and used to control actuator signals.
User feedback
Thermal sensation and thermal comfort assessments can be collected with the feedback app (see Figure 5). It is implemented as a web application using Javascript for interaction and WebGL for 3D visualization. A web-based platform allows for fast development iterations without the need for builds and deployments. The app can be hosted as a network component and accessed via any touchscree-enabled device. Screenshot of the user feedback app.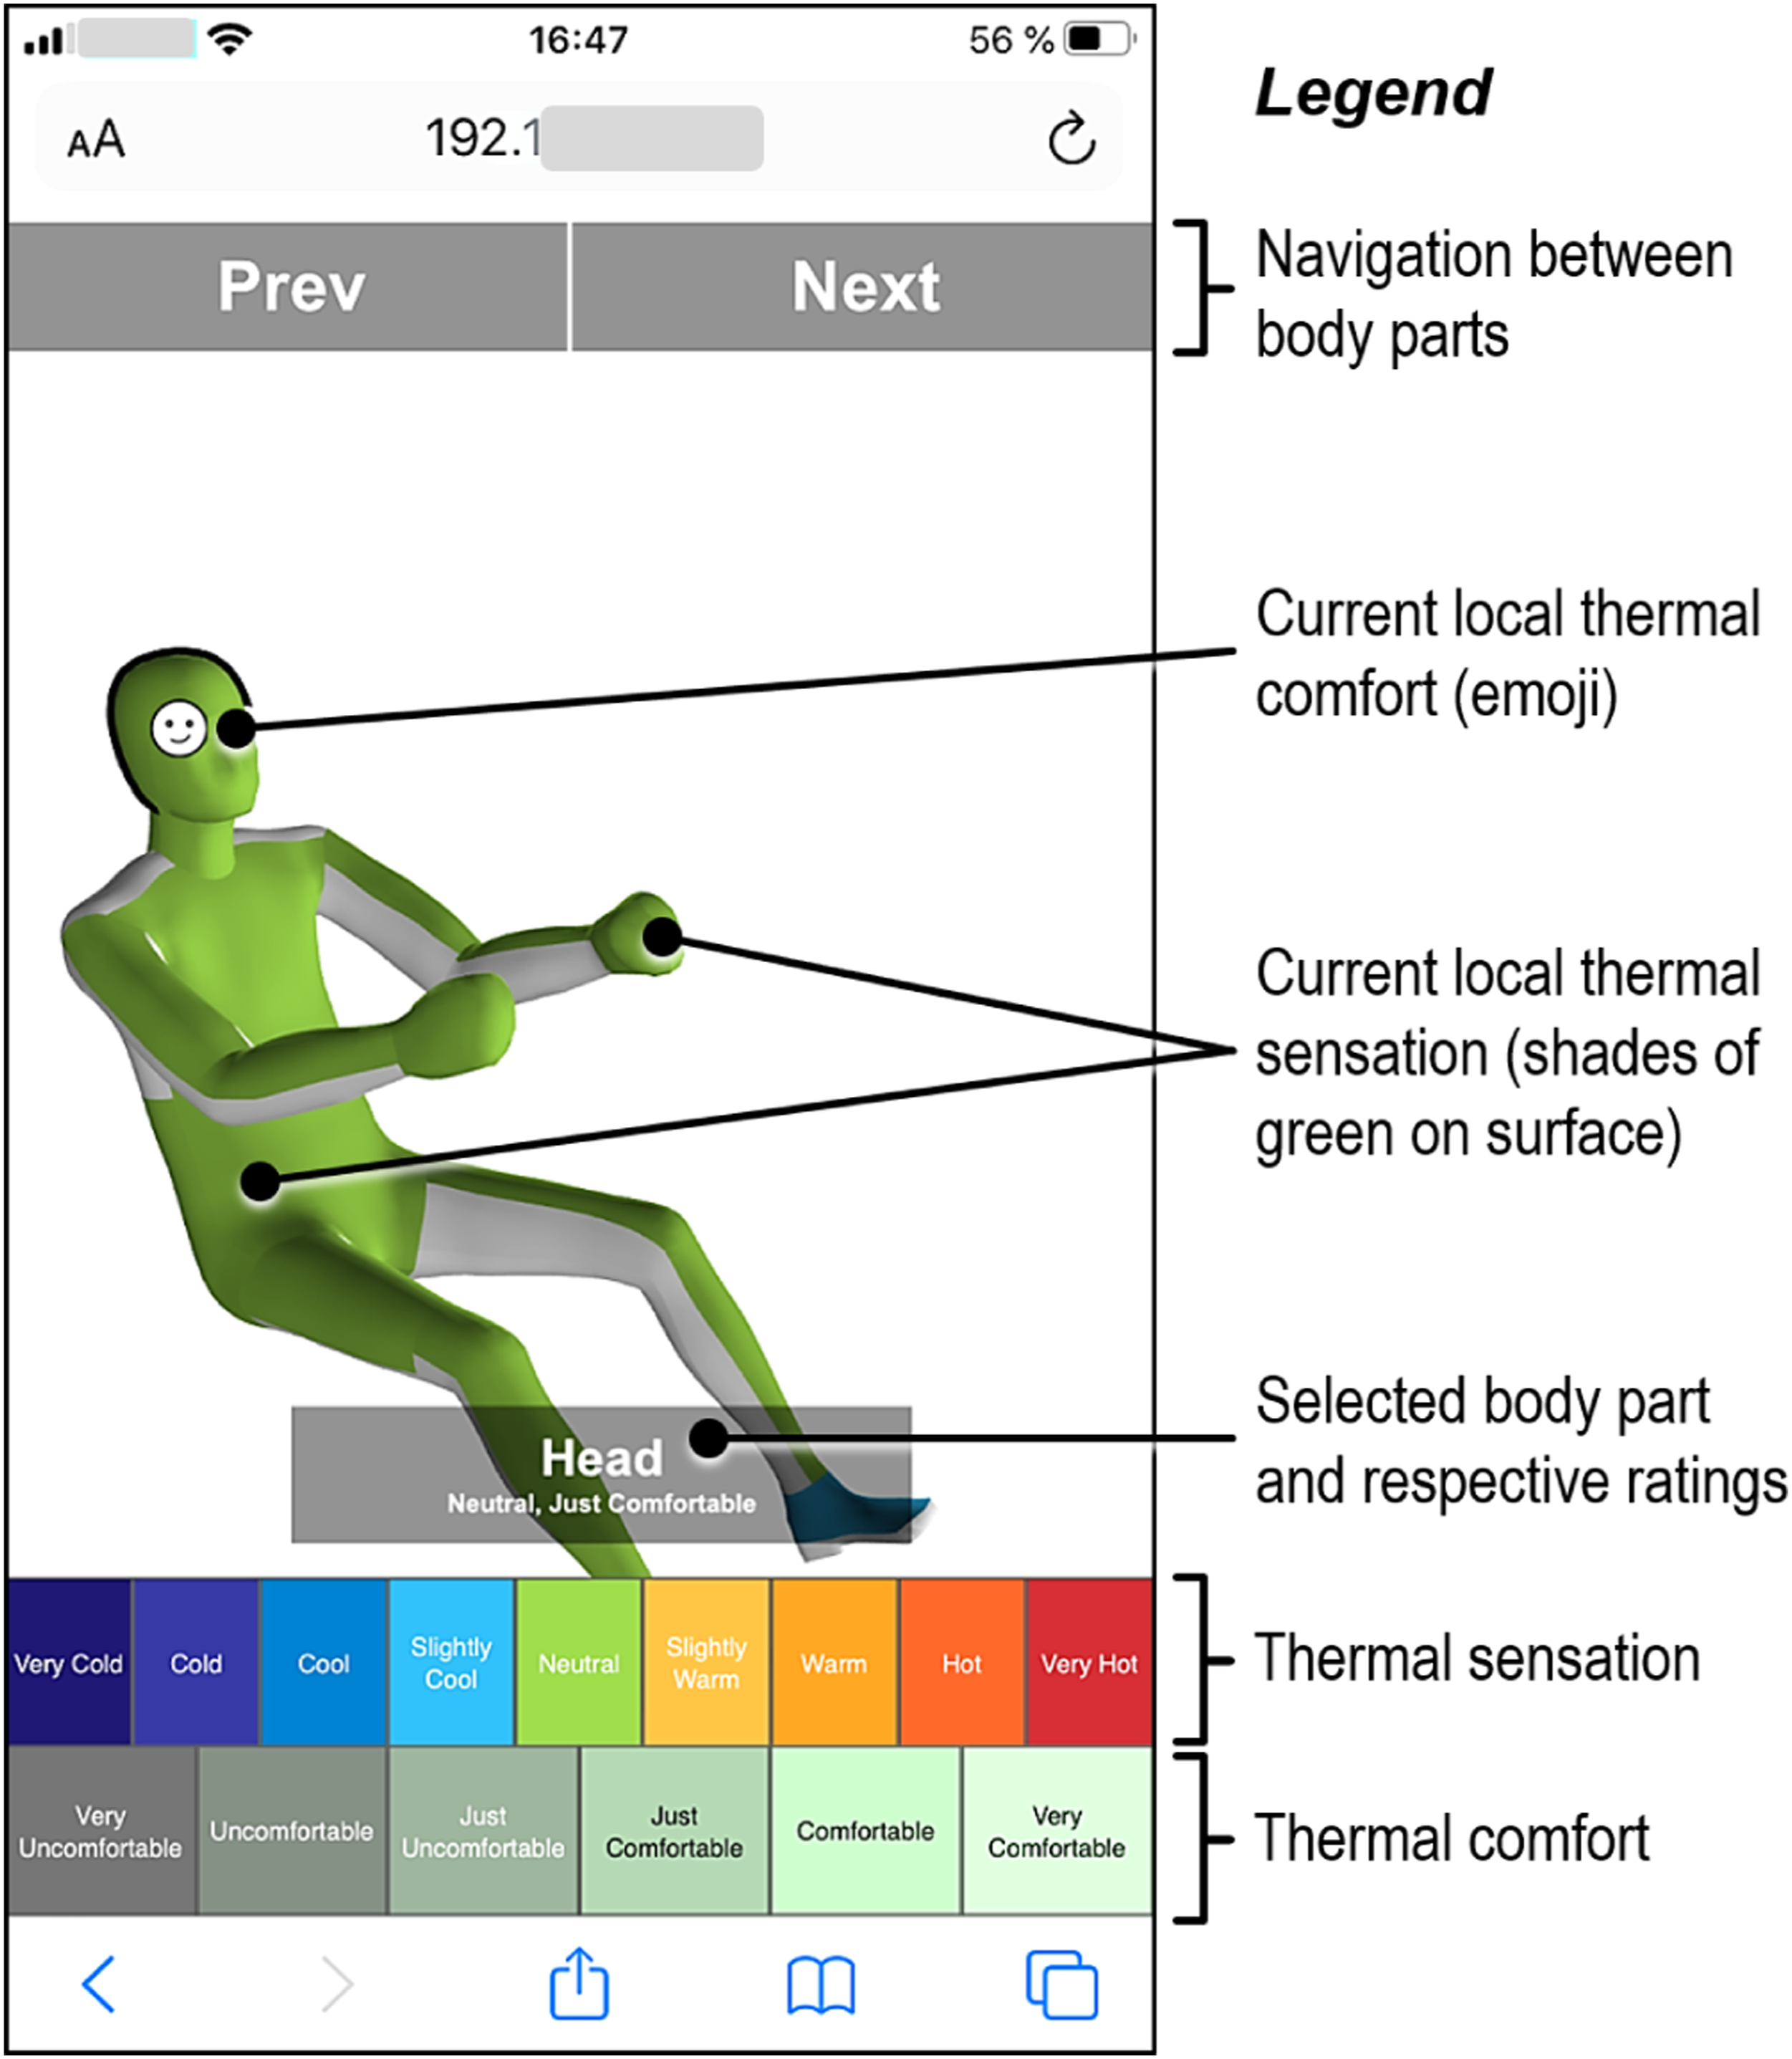
The app displays a 3D manikin showing the user’s current assessment of thermal sensation and thermal comfort. Thermal sensation for each assessed body segment is represented with a pseudo-color, and thermal comfort is displayed through an emoji at the segment’s position. Two rows of buttons at the bottom enable the user to enter a thermal sensation and thermal comfort assessment for the currently selected body segment (see Figure 5). Each button is associated to a discrete value on the Zhang sensation and comfort scale.
The 3D manikin is subdivided into uniquely named body segment meshes that are associated with a respective data server signal. For example, the face segment represents
Thermal comfort on the other hand is an evaluative assessment of temperature. A person can feel comfortable when it is warm or uncomfortable when it is cold and vice versa. Moreover, people do not necessarily associate comfort with a continuous color scale. Hence, thermal comfort in the app is represented as emoji that are related to discrete values on the Zhang comfort scale.
The app iterates through the body segments in a predefined order. For each segment the user gives a thermal comfort and thermal sensation assessment. When the sequence of segments is completed the user submits the assessed body state as a single datapoint. After the first complete iteration, the user only makes adjustments from the previous input, and a complete reassessment is not necessary.
Monitoring
The main user interface of the user component shows a representation of each body segment in a segment grid (see Figure 6). Each panel in the grid displays the currently measured skin temperature, the last Local Thermal Sensation and Local Thermal Comfort (LS/LC) assessment, all past LS/LC assessments as scatter plot as well as a model preview with a skin temperature range on the x-axis and respective LS/LC predictions on the y-axis as line plot. In addition, all model coefficients and parameters can be displayed and subjective LS/LC assessments can also be entered over the panel interface instead of the feedback app. Screenshot of the monitoring interface. The image shows the segment panel with collected user data during a model training session.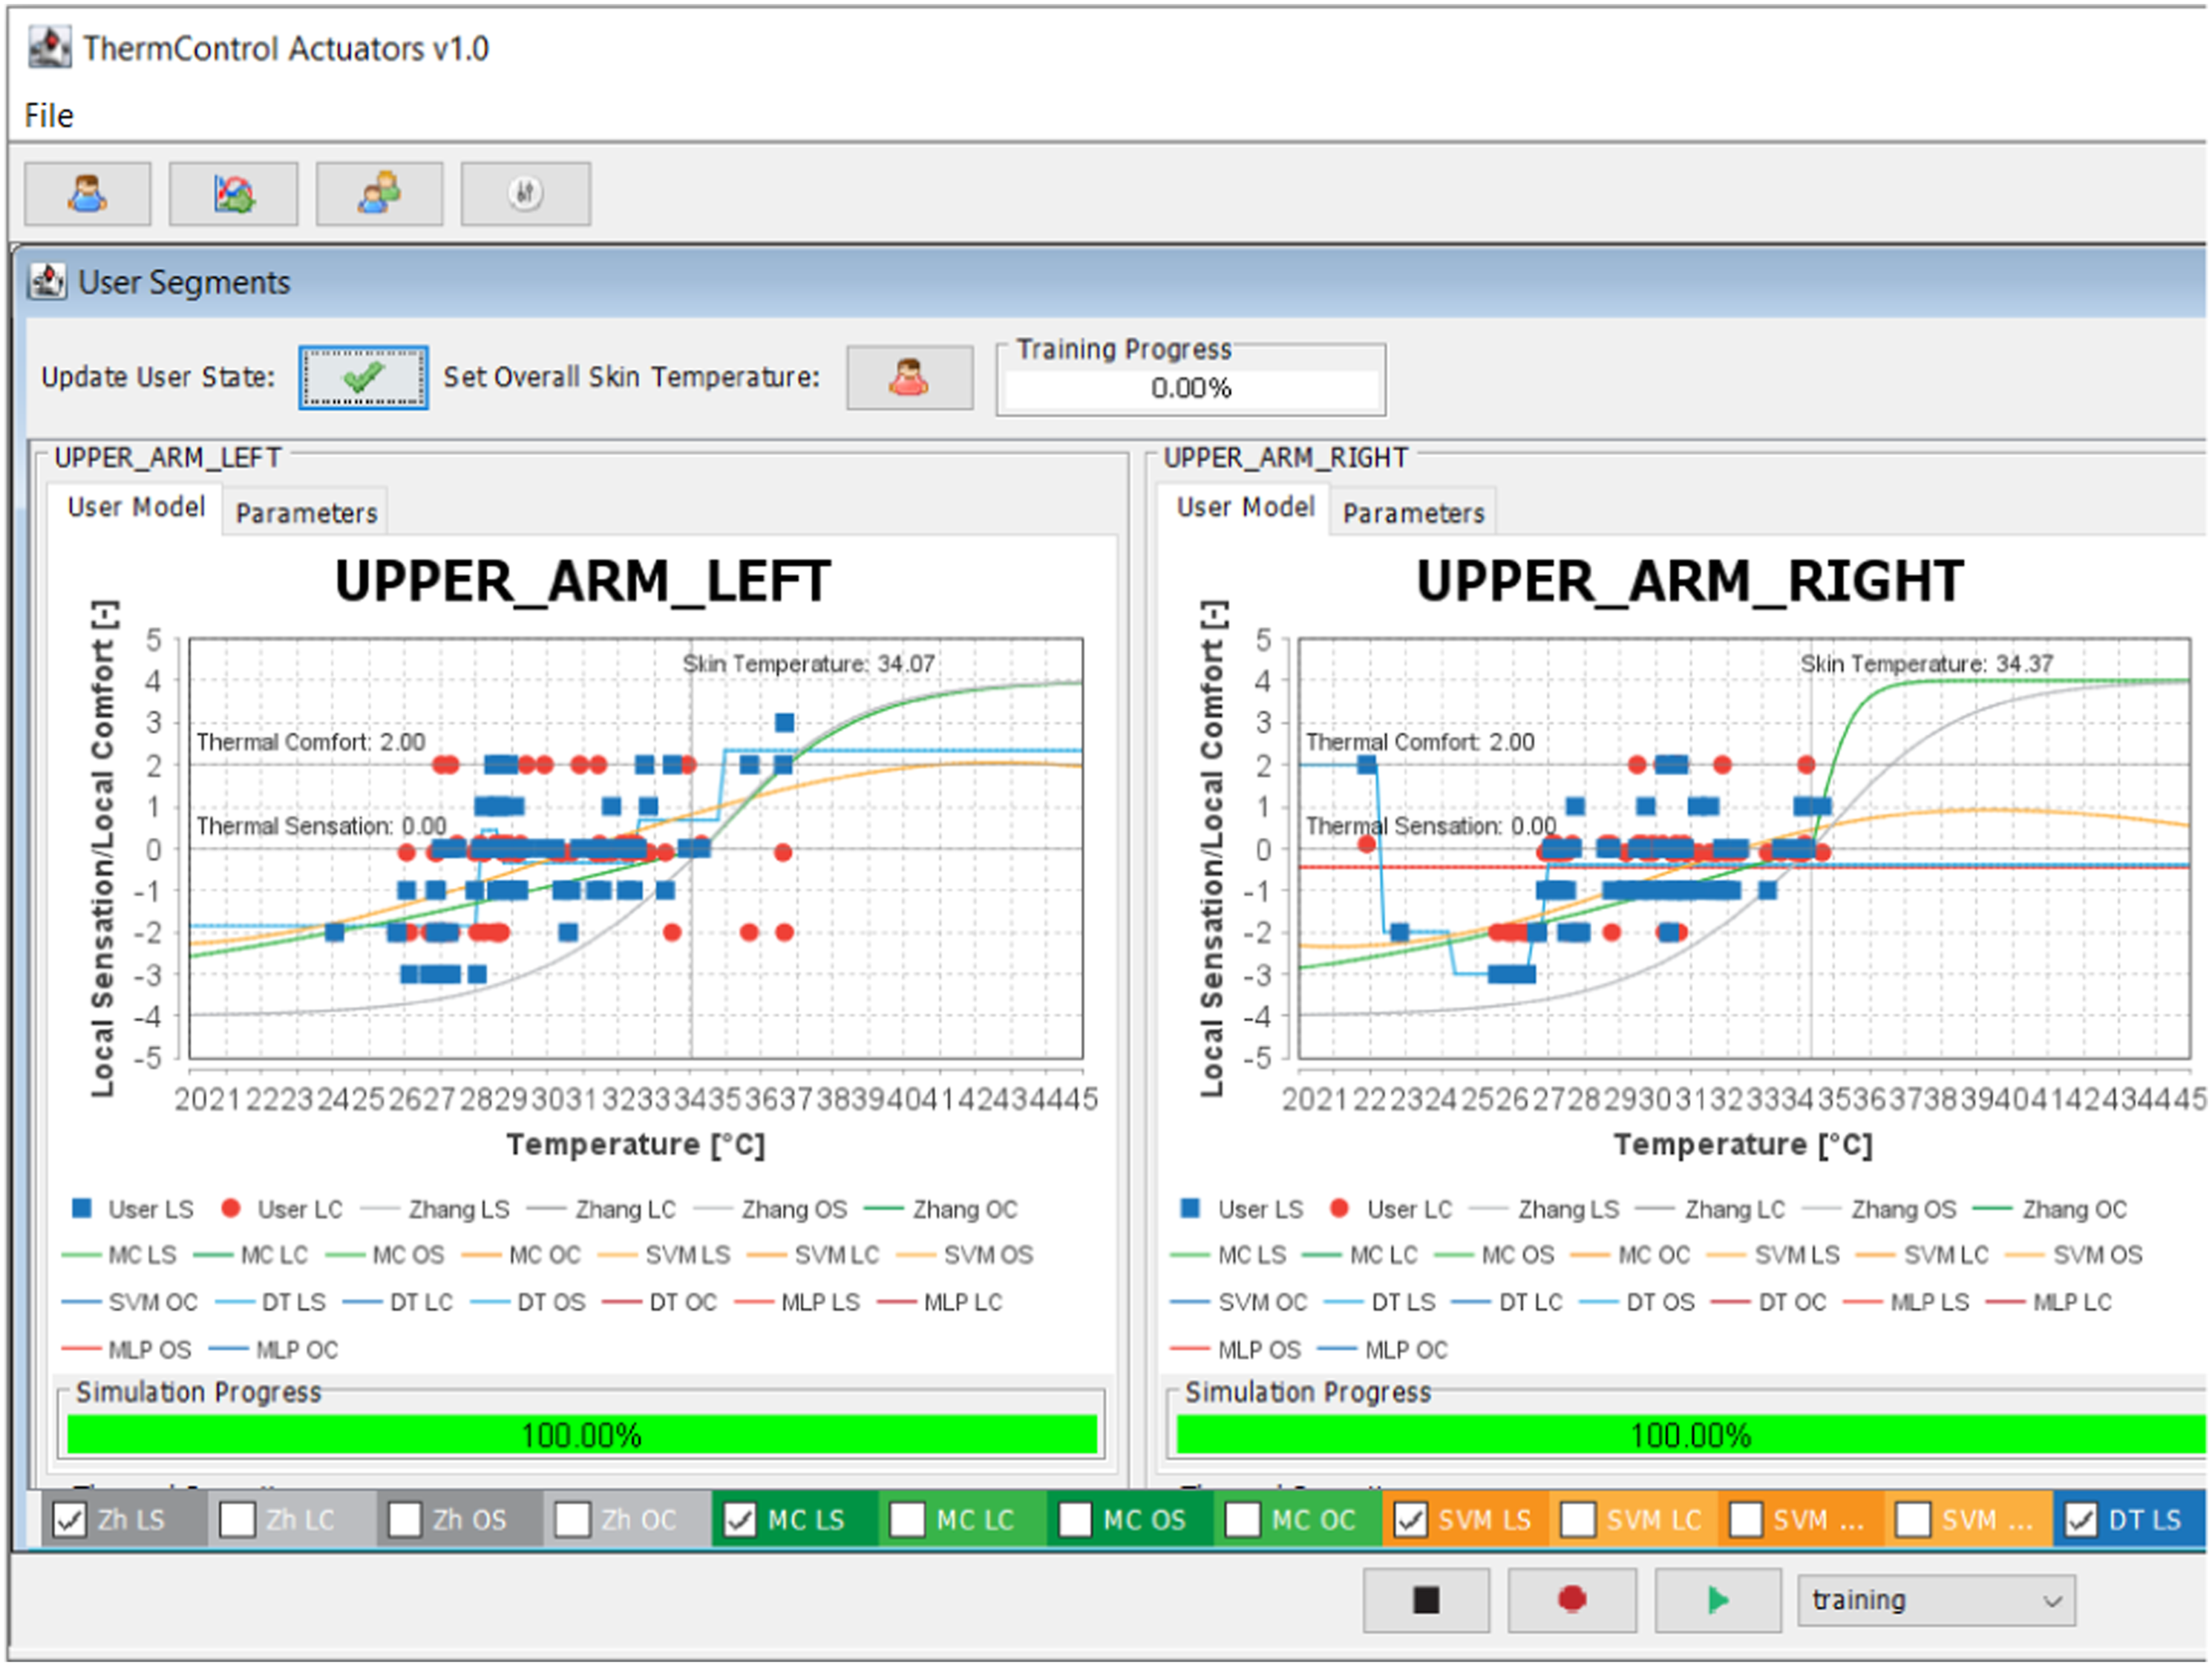
The user data and model parameterization are stored in CSV and XML files. When a new user is created, a unique user ID is generated. A short questionnaire can be answered that contains year of birth, gender, clothing insulation, height, and weight. Listing 3 shows an example of a user XML file along with the questionnaire parameters an example segment configuration node. This file is continuously updated during test sessions.
Model based control
Two exemplary thermophysiological models were already described in section Thermophysiological Model Implementation, but the system can be used to develop and compare different control algorithms and strategies in a concurrent manner as well. Training data, i.e. user feedback on current thermal sensation, can be collected via the user app described in section User Integration and Feedback App. A full description of an exploratory comparison of control strategies can be found in Metzmacher et al., 57 and will only be briefly described here.
Models
The original Zhang model is implemented in the user component as a reference model. Based on that, a Monte Carlo (MC) model can be trained where coefficients are modified in order to fit individual user data. The remaining three model types, a decision tree (DT), support vector machine (SVM) and a multilayer perceptron (MLP) implemented in the user component, are plain models that use the Zhang scales but create their own internal structure. For the DT, SVM and MLP models, a separate model is trained for each body segment and a global segment. Trained models can be assigned to a PID controller that controls an infrared heater/fan pair. The PID controller then uses the local sensation or local comfort predictions of that model as controlled variable.
Simulation
The user component has a simulation module that creates a preview for each trained model. For each segment, the simulated skin temperature is swept from a predefined minimum to a predefined maximum value. All other segment skin temperatures are held constant for a single simulation. For the constant temperatures, the respective skin setpoint temperatures proposed by Zhang 56 are used. LS/LC predictions for each model are stored for each simulated skin temperature step. The predictions are then shown in the 2D line plots and give a preview of the current state of each model.
Controller
For actuator control and model tuning purposes, the user component implements a controller user interface (Figure 7) with two panels: the panel on the left side can be used to manually control actuator power in order to test various settings (actuator control needs to be set to manual). The panel on the right shows the current controller output when the actuators are controlled using the PID controllers. Each PID controller is assigned an infrared heater and a fan. If PID output is positive the heater receives the control value, otherwise the fan receives the inverted control value. The user component interface for actuator control.
Conclusion
This work presented the system design of a research platform for personalized thermal conditioning components, including thermal imaging, data exchange of sensors and actors, as well as real-time monitoring and controller tuning. We support the call for more PCS research in real-life settings. At the same time, unanswered questions regarding the efficiency, effectiveness, and the comfort models themselves may hinder more successful field studies.21,23,37,39
We therefore presented this platform to investigate personal climatization in a holistic approach. The main focus was the integration of various components and a high degree of modularity. Therefore, improvement and future research is needed to bring each individual component into a “competitive” instead of “working” condition. At the same time, the system’s modularity already allows for selective improvements and testing of components in its current state of development.
Preliminary studies using the system have been conducted using two local actuators.57,58 It was shown that the system is able to compensate cold and warm ambient conditions and increase the subject’s thermal comfort within a defined temperature range. Since only two actuators were tested, the system ability to compensate for cold ambient temperatures was limited. Further studies need to be conducted that analyze the system with additional actuators covering every part of the body as well as a larger pool of human subjects to especially test and improve the app usability.
Furthermore, the studies were conducted using a chilled beam HVAC system in order to establish cold ambient temperatures. This, however, also introduced cold draft which should be eliminated as an influencing factor in future studies. For a detailed discussion description of advantages and disadvantages of various PCS configurations, the reader is referred to Warthmann et al. 28
Lastly, a modification and optimization of the user feedback app is considered crucial in improving usability and acceptance studies for PCS. In the current setup, the application is the sole feedback and interaction device, and lacks functions such as the ability to gather general thermal preferences or complaints by the user, which need to be collected via interview or questionnaire additionally.
Supplemental Material
Supplemental Material - Modular personalized climatization testing infrastructure with smartphone-based user feedback
Supplemental Material for Modular personalized climatization testing infrastructure with smartphone-based user feedback by Henning Metzmacher, Marc Syndicus, Alexander Warthmann, Jérôme Frisch and Christoph van Treeck in Building Services Engineering Research and Technology
Footnotes
Acknowledgements
We would like thank the institute’s measurement and control technician, Rainer Ehrt, for his support during the system’s development and maintenance.
Declaration of conflicting interests
The author(s) declared no potential conflicts of interest with respect to the research, authorship, and/or publication of this article.
Funding
The author(s) disclosed receipt of the following financial support for the research, authorship, and/or publication of this article: Earlier research which is integrated into the current system was supported by the German Federal Environmental Foundation under grant AZ 31078. We gratefully acknowledge the support.
References
Supplementary Material
Please find the following supplemental material available below.
For Open Access articles published under a Creative Commons License, all supplemental material carries the same license as the article it is associated with.
For non-Open Access articles published, all supplemental material carries a non-exclusive license, and permission requests for re-use of supplemental material or any part of supplemental material shall be sent directly to the copyright owner as specified in the copyright notice associated with the article.