
Abstract
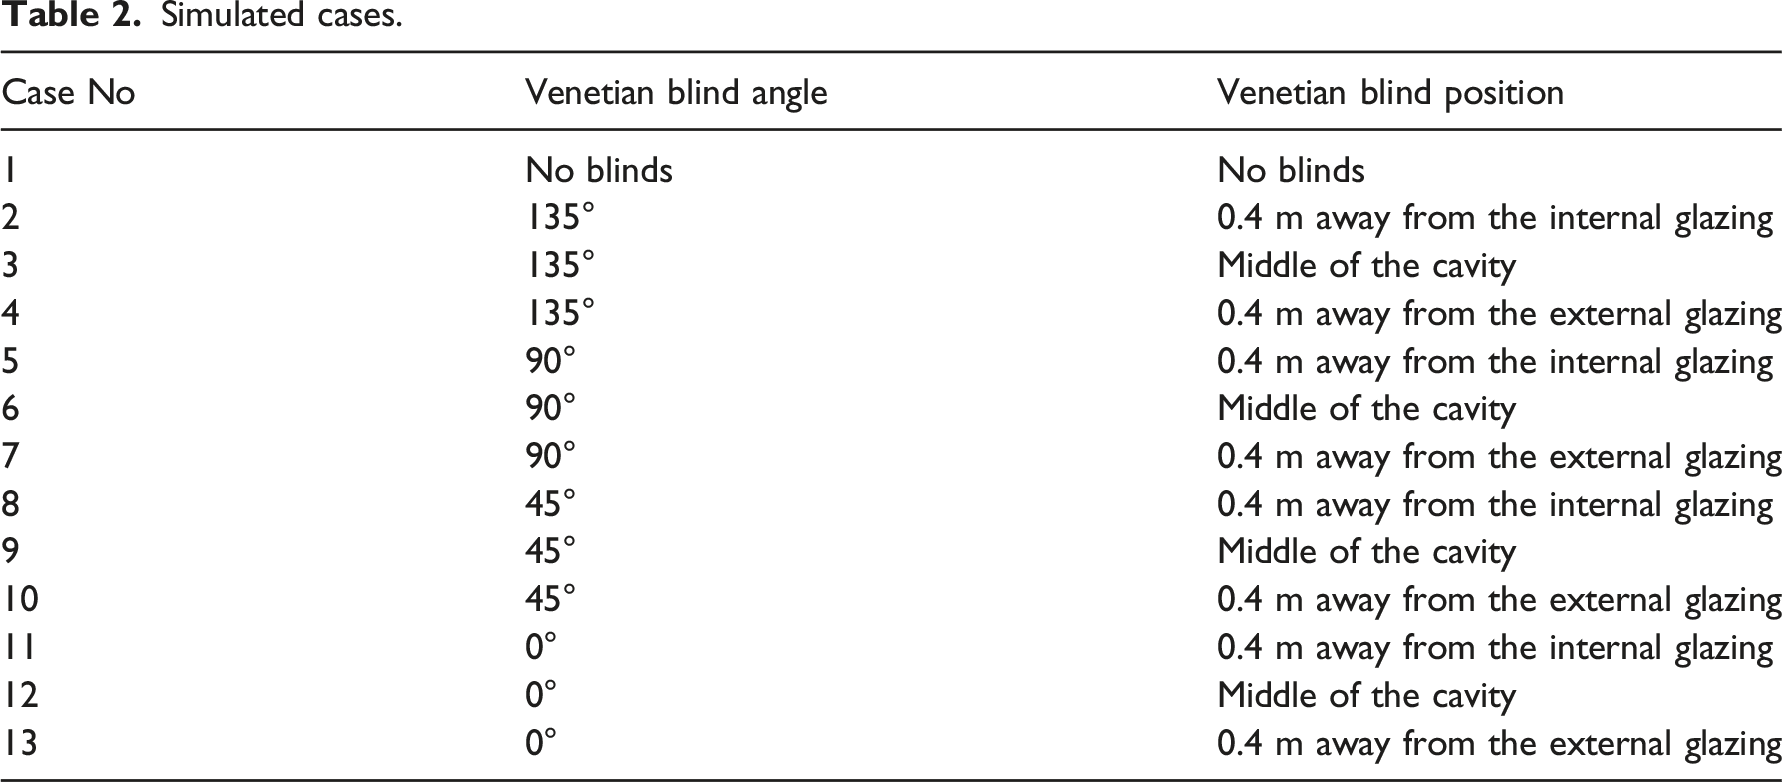
Double skin façades (DSFs), offer great views, architectural aesthetics, and energy savings. Yet, in a fire event the glass façade breaks leading to risks to human life and firefighting difficulties. Shading devices incorporated to prevent unfavourable heat gains to reduce cooling load though offer energy savings potentially present other challenges in firefighting and occupants’ evacuation. In this study, Fire Dynamic Simulator (FDS) was used to numerically investigate the spread of a 5 MW HRR polyurethane GM27 fire in a multi-storey double skin façade building with Venetian blinds placed in its cavity. The blinds were positioned 0.4 m away from the internal glazing, middle of the cavity and 0.4 m away from the external glazing respectively. In each blind position the slat angle was opened at 0°, 45°, 90° and 135° respectively. The results show peak inner glazing surface temperature ranged between 283°C to 840°C depending on the thermocouple position, the Venetian blind position and slat opening angle. Without Venetian blinds, peak inner glazing surface temperatures ranged between 468°C to 614°C. In all cases except when the slat angle was 0° and the blind was positioned closer to the outer glazing, the inner glazing surface temperature from the closest thermocouple (TC 14) above the fire room exceeded 600°C, the glass breakage temperature threshold. Overall, the Venetian blind position and slat opening angle influenced the spread of fire. Venetian blind combustibility and flammability were not considered and therefore recommended for future studies.
Introduction
Background
The façade plays a vital role in buildings, protecting the internal environment and acting as a medium for heat transfer between the indoors and outdoors.1–3 For conventional buildings, inappropriate materials or techniques chosen for facades can have adverse effects on performance, leading to overheating, poor natural ventilation, and excessive energy consumption.4–7 Double Skin Façades (DSFs) have superseded general glass façades in optimizing building performance while providing great views, better indoor environment, and architectural aesthetics.8,9 Their double-layer glass allows the reduction of heating and cooling demand while appropriate lighting is permitted indoors to reduce the artificial lighting load.4,10 For naturally ventilated DSFs, thermal buoyancy, stack effect and wind effect dominate the ventilation process.11–13
Influence of venetian blinds on double skin façade performance
To block unfavourable heat gains, DSFs can incorporate shading devices during hot periods to reduce cooling load.12,14 Typical is the installation of Venetian blinds in its intermediate cavity to influence building performance.5,15 For instance, Oesterle et al. 16 found that the smaller space created between these shading devices and the glazing heats up, influencing DSF performance. Wang et al. 17 simulated DSFs with the blinds of slat angles 0°, 30°, 60°, and 90° in an air cavity of 0.4 m thick and vent area of 0.3 m2, and found that Venetian blinds significantly affect the solar radiation transmitted into the indoor environment, impacting the temperature and airflow rate in the cavity. Ji et al., 18 Jiru et al. 19 and Lee et al. 20 carried out similar simulations and concluded that the cooling energy demand increases with increasing slat angle. Ji et al. 18 found that 80° Venetian blind angle opening performs well and increases natural ventilation by up to 35%. Jiru et al. 19 compared various positions of Venetian blinds in the DSF cavity and found turbulence caused by the blinds intersect with the thermal boundary layer of glazing, leading to enhanced heat transfer when the blinds are close to the glazing. Gratia and De Herde 14 found that cooling consumption in an office building with DSF can be decreased up to 23.2% depending on blind location, blind colour and double skin opening. Iyi et al. 21 also found that the optimum blind position for energy saving is about one-third of the external glazing.
Fire and smoke in the double skin façade system
DSFs although can optimize building energy performance, face challenges complying with fire codes leading to many failing fire safety requirements.8,22 Shao et al. 23 carried out a Computational fluid dynamic (CFD) analysis on the naturally ventilated DSF at the Center for Sustainable Energy Technologies (CSET) building in Ningbo, China. They found that though it met the national fire safety requirement in China, it still failed to prevent the spread of fire, allowing smoke to occupy the fire exit stairway. According to Abdoh et al., 6 fire safety in DSFs is crucial due to recent spikes in fires in high rise buildings with DSF systems.
When exposed to fire with a significant heat release rate (HRR), the expansion rate at the centre of the glass in a DSF system becomes more significant than the area protected by the window frame resulting in thermal stress, cracking and subsequent breaking. 24 The smoke entering the cavity between the two panes flows upwards under stack effect, leading to risks to human safety, fast fire spread to upper floors, difficulties for firefighting, and fire debris.25,26 Ni et al. 25 found that the aluminium frames of windows would deform considerately before the glass broke, resulting in smoke penetrating through the gaps between the pane and frame into the DSF cavity. Their experiment also showed that with 0.7 MW, 1 MW or 2 MW maximum HRRs, a 6-mm-thick, toughened glass glazing would break at glass surface temperatures between 600-800°C. 25 Miao and Chow 27 also found that for a given cavity width, HRR and geometry of window opening are two key factors that influences plume trajectory. Abdoh et al. 6 conducted fire simulation in DSF with the Venetian blinds using smoothed particle method and found that the blind angle could significantly affect fire spread and temperature distribution in the DSF.
Similar to findings by Abdoh et al., 6 we posit that in addition to blind angle, where Venetian blinds are located in the DSF cavity and their varied combinations with blind angle openings may affect the spread of fire. To this end, we numerically investigated the influence of Venetian blind position and slat opening angle on the spread of fire in the DSF cavity of a multi-storey building using National Institute of Standards and Technology (NIST) Fire Dynamic Simulator (FDS). The purpose is to develop new thinking on mitigation of fire risks in buildings for architects, engineers and designers when incorporating Venetian blinds in DSFs.
Numerical methodology
Physical and geometrical model
Figure 1(a) and (b) show the physical and geometrical models of the building with multi-storey type DSF spanning 5 floors
28
designed using PyroSim Version 2021.1.0224. The building is 6m deep and 15m high. Each room is 3m high with a 36 m2 construction area. Windows connecting to the DSF cavity from each room have dimensions of 4×2 m2. The cavity of the DSF system is 1.2 m deep, with a solar chimney 1m above the building. The widths for Openings 1 and 2 are 1.2 m, respectively. Fresh air enters the naturally ventilated DSF through opening 2 below, and stale air exits via opening 1 above. 200 mm wide Venetian blinds oriented vertically and openable at various slat angles are installed in the DSF cavity. The solar chimney enables a temperature gradient to be established for stack effect. In a fire event, all the openings into the DSF are assumed closed except openings 1 and 2. The fire source, a 1 m3 burner located at the centre of the room, is on the first floor and 2.5 m away from the DSF inner window. The window in this room is broken to allow hot gas flow into the DSF cavity. (a) Physical model. (b) Geometrical model showing numbered thermocouple location.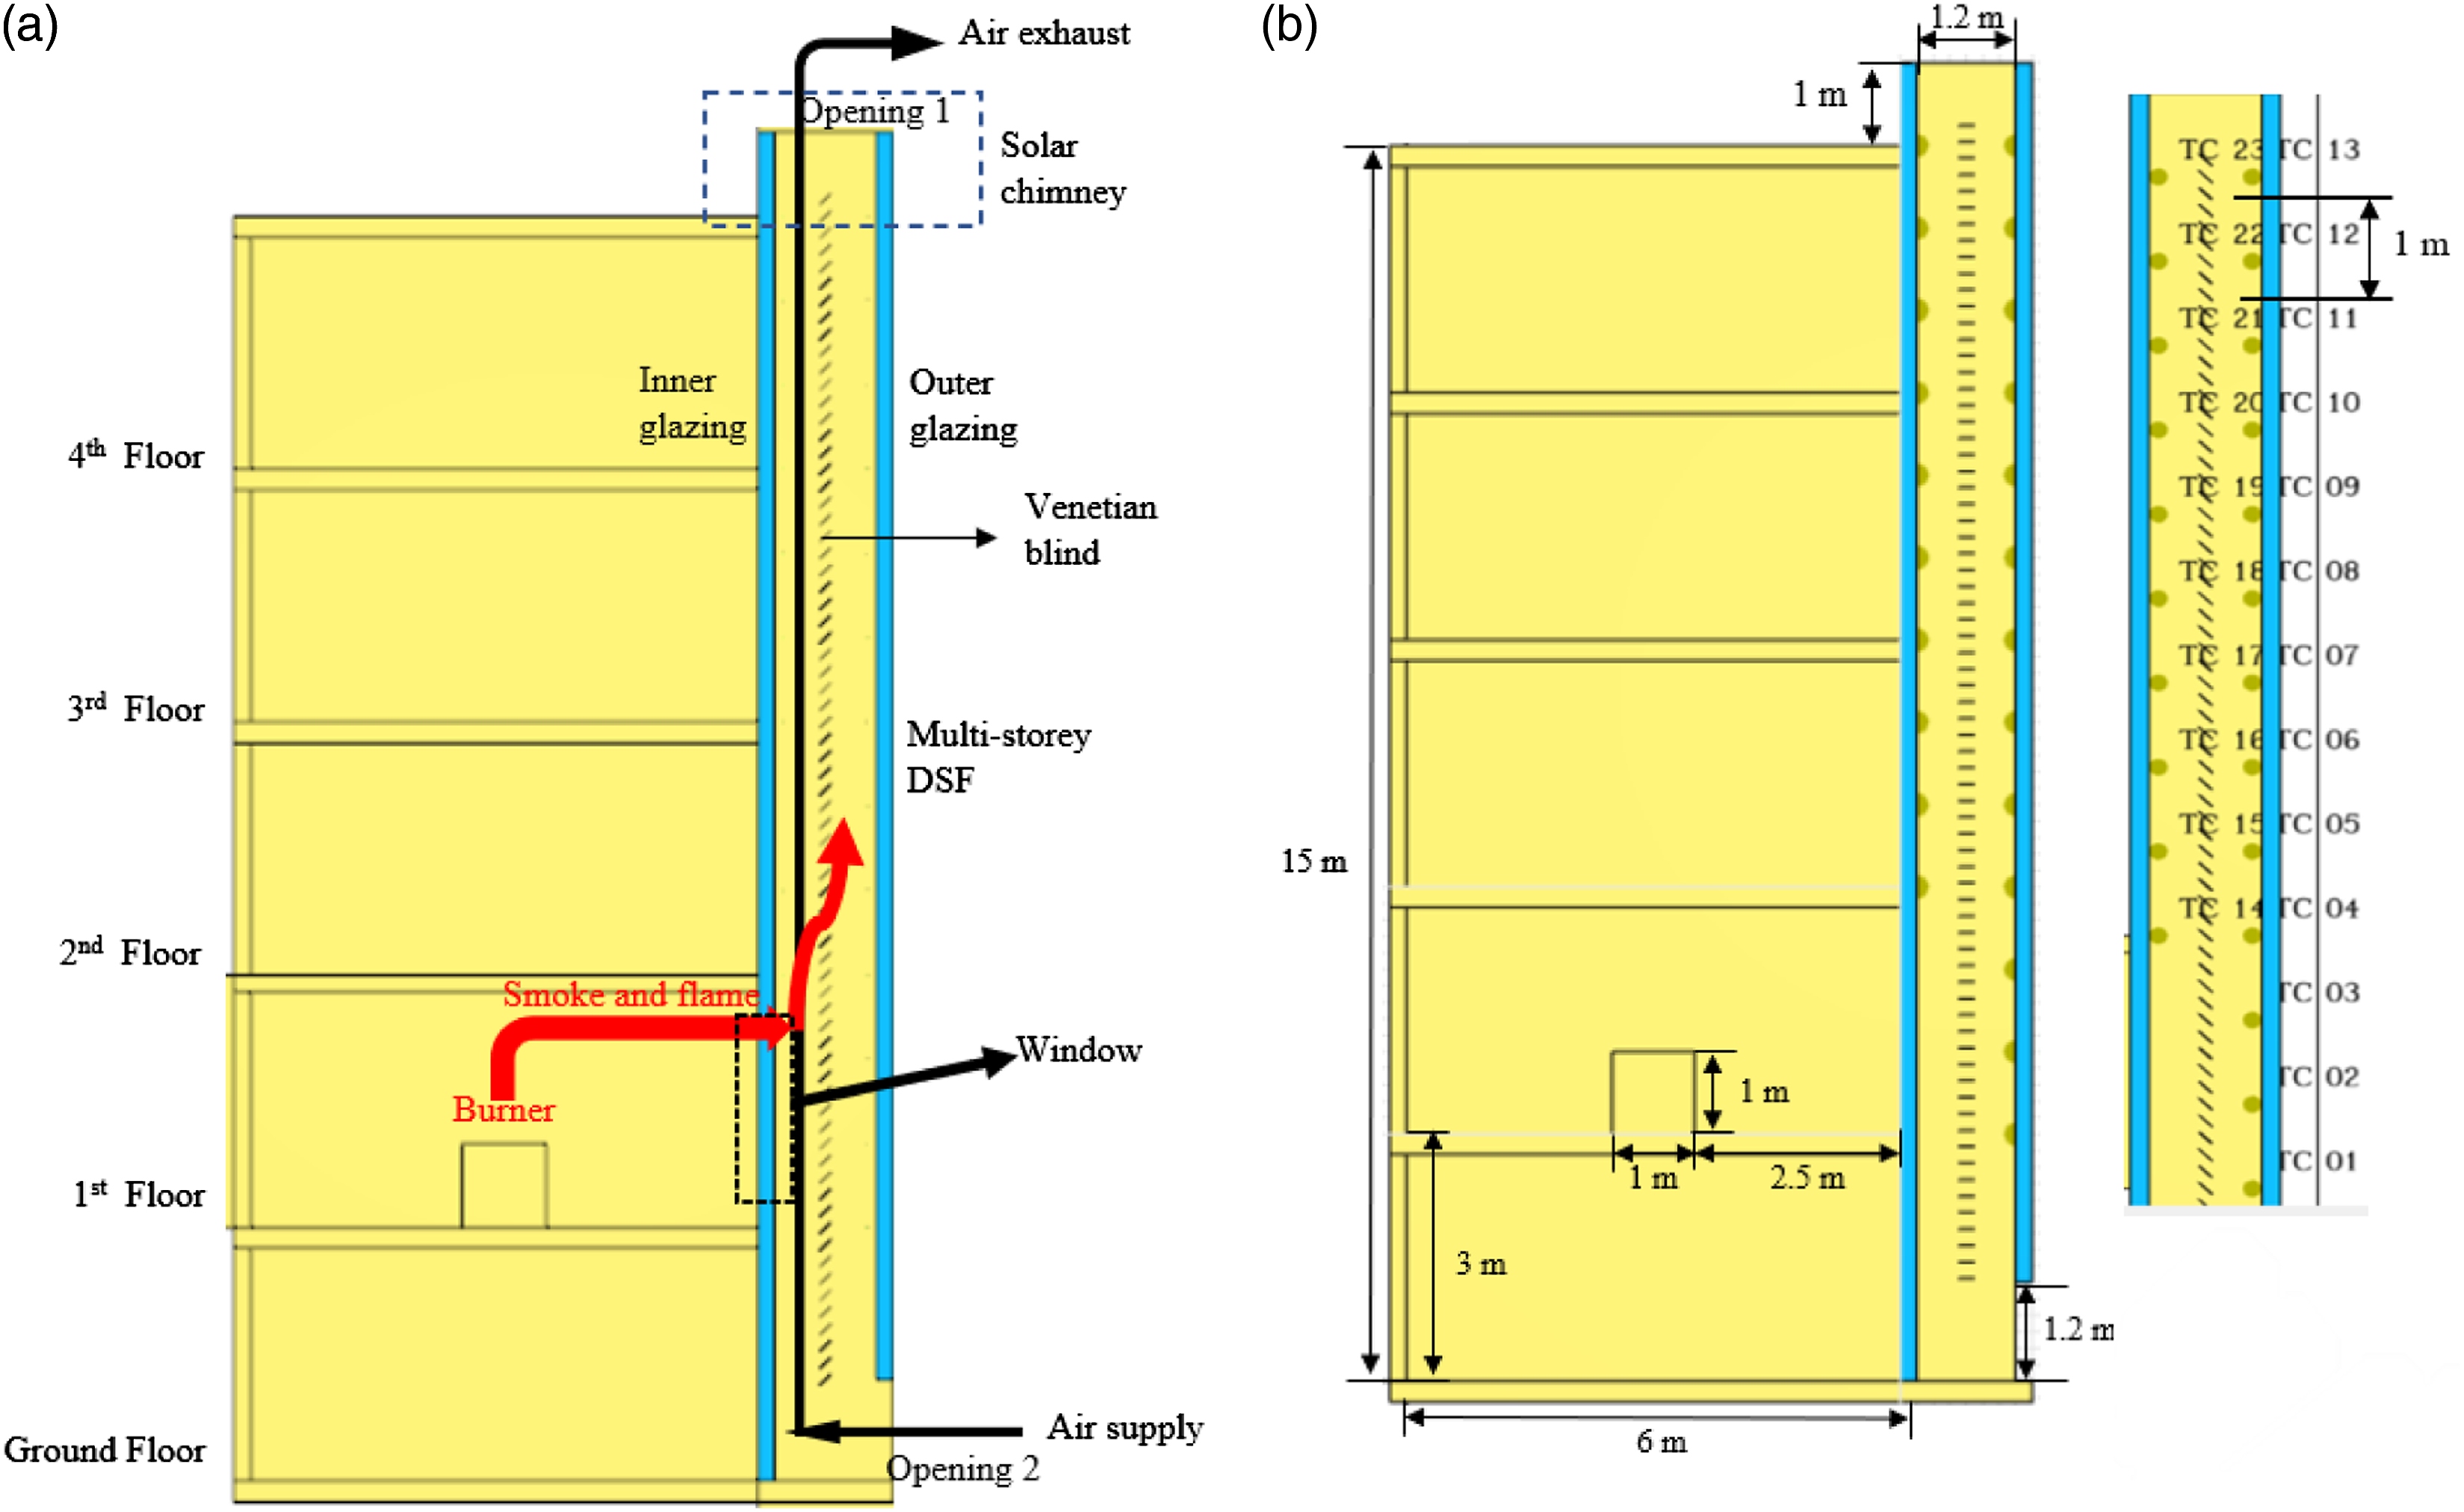
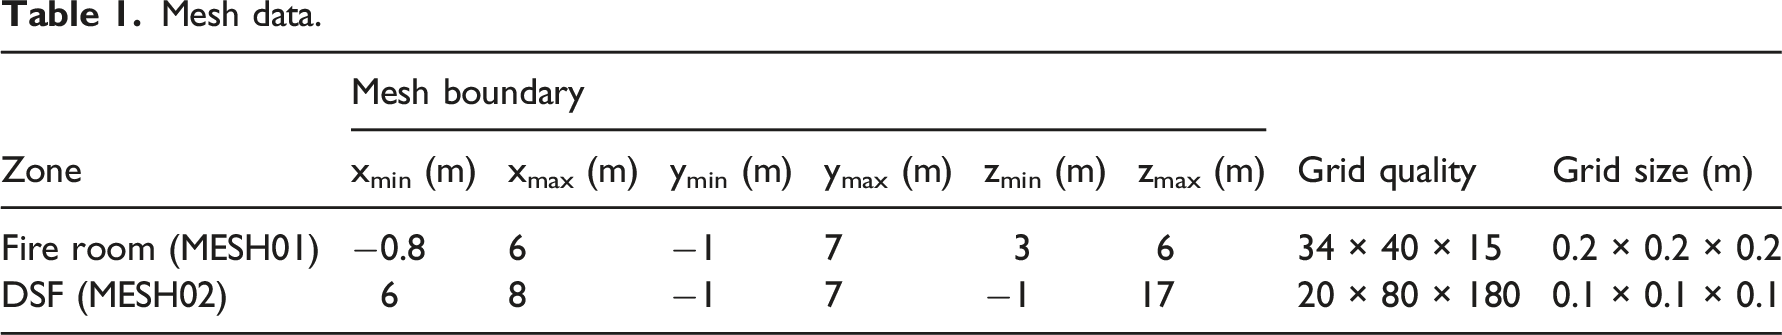
Meshed model
Mesh data.
Simulation methodology
The simulation was carried out using Fire Dynamics Simulator (FDS) version 6.7.5. The fuel selected for the fire was Polyurethane GM27, consistent with Society of Fire Protection Engineers (SFPE) standards. The burner surface area was 1m2 and to achieve a HRR 5 MW, the heat release rate per area (HRRPUA) for the burner surface was set to 5000 kW/m2. This HRR for the fire scenario is consistent with the fire authorities fire hazard assessment test values28,31 and it was set to maintain at that HRR value throughout the simulation. The combustion was based on the Mixture Fraction Combustion Model in FDS applicable to the Very Large Eddy Simulation (V-LES) model used for this simulation. V-LES provides a good compromise between efficiency and precision and useful in situations where LES remains computationally expensive under high to very-high Reynolds number flow conditions.
32
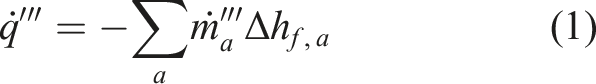
For an infinitely fast reaction, FDS sums the lumped species mass production rates and their respective heats of formation to determine the HRR per unit volume as presented in Equation (1).
33
Simulated cases.
Results and discussion
Spread of fire in double skin façades without venetian blinds
The investigations begun with the simulation of the 5 MW HRR fire in the DSF without Venetian blind. As shown in Figure 2, the hot gas exited the fire room and attached itself to the interior pane due to high air entrainment from the bottom opening of the DSF. The curvature of the jet increased until the flow attached itself to the inner glazing surface due to Coanda effect.
34
As a result, it was highly likely that interior pane reaching a temperature over 600°C would break allowing flame and smoke to take over immediate upper floors.6,25 Case 1: Temperature distribution in the DSF system without Venetian blinds (a) at 25s (b) at 50s (c) at 75s (d) at 100s.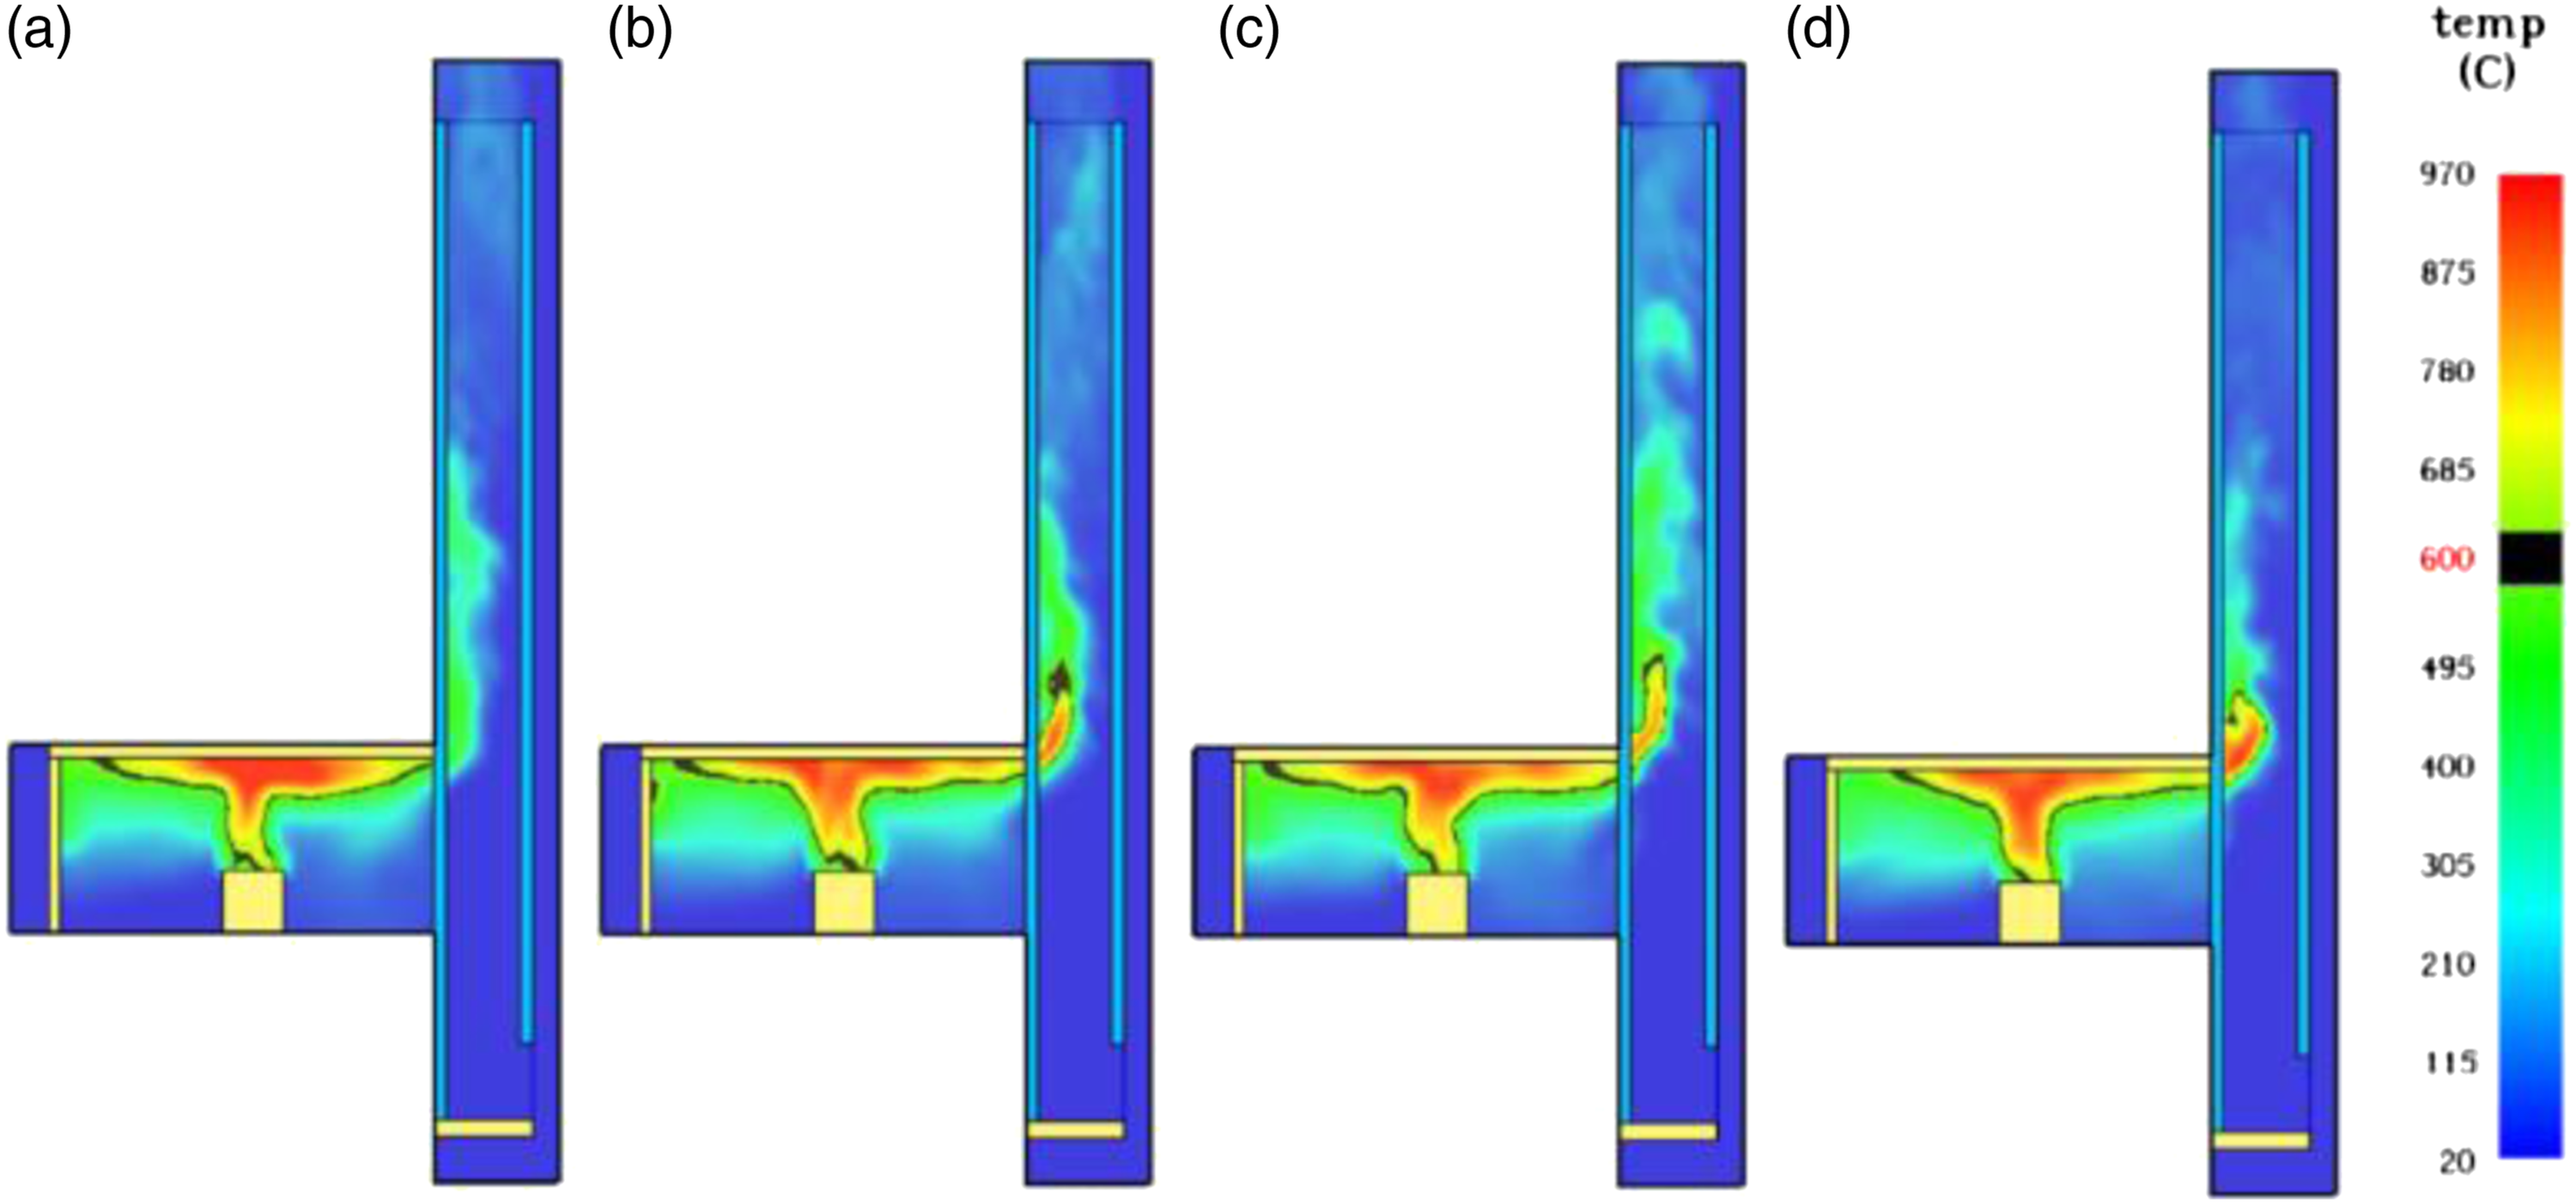
Hot gas flow in double skin façade with venetian blind
Twelve (12) different cases were simulated respectively to explore the impact of Venetian blinds on the hot gas flow. With the Venetian blinds oriented vertically in the DSF cavity, two zones, Zone 1 and Zone 2 were created. Zone 1 represented the cavity space between the inner glazing and the Venetian blind, and Zone 2 the cavity space between the Venetian blind and the outer glazing of the DSF.
Velocity profile
Slat opening angle = 135°
Figure 3(a)–(c) shows velocity vectors in DSF with Venetian blinds placed 0.4 m away from the inner glazing (Case 2), middle of the DSF cavity (Case 3) and 0.4 m away from the outer glazing (Case 4) respectively. In all three cases, the hot gas flowed through slat opening from Zone 1 into Zone 2. Flow velocities in both Zones increased overtime. Case 2 shows a larger bulk hot gas velocity in Zone 2 reaching a maximum of 7 m/s. Case 3 with the Venetian blind positioned in the middle of the DSF cavity on the other hand shows a larger bulk hot gas velocity in Zone 1 reaching a maximum of 8 m/s. With the Venetian blind closer to the outer glazing (Case 4), a wider Zone 1 was created allowing a larger bulk of hot gas to occupy that zone. For this case, a larger bulk gas velocity reaching a maximum of 9 m/s can be observed in Zone 1. For this slat opening, a larger bulk hot gas velocity is observed in Zone 2 only when the blinds were positioned closer to the inner glazing as in Case 2. Overall, there was unbalanced velocity distribution in the zones with higher air entrainment rate from bottom along the pathway, surging upwards.
28
(a) Case 2: Velocity vectors of hot flow in the DSF with Venetian blind opened at 135° - Close to the inner glazing (a) at 25s (b) at 50s (c) at 75s (d) at 100s. (b) Case 3: Velocity vectors of hot flow in the DSF with Venetian blind opened at 135° - In the middle (a) at 25s (b) at 50s (c) 75s (d) at 100s. (c) Case 4: Velocity vectors of hot flow in the DSF with Venetian blind opened at 135° - Close to the outer glazing (a) at 25s (b) at 50s (c) at 75s (d) at 100s.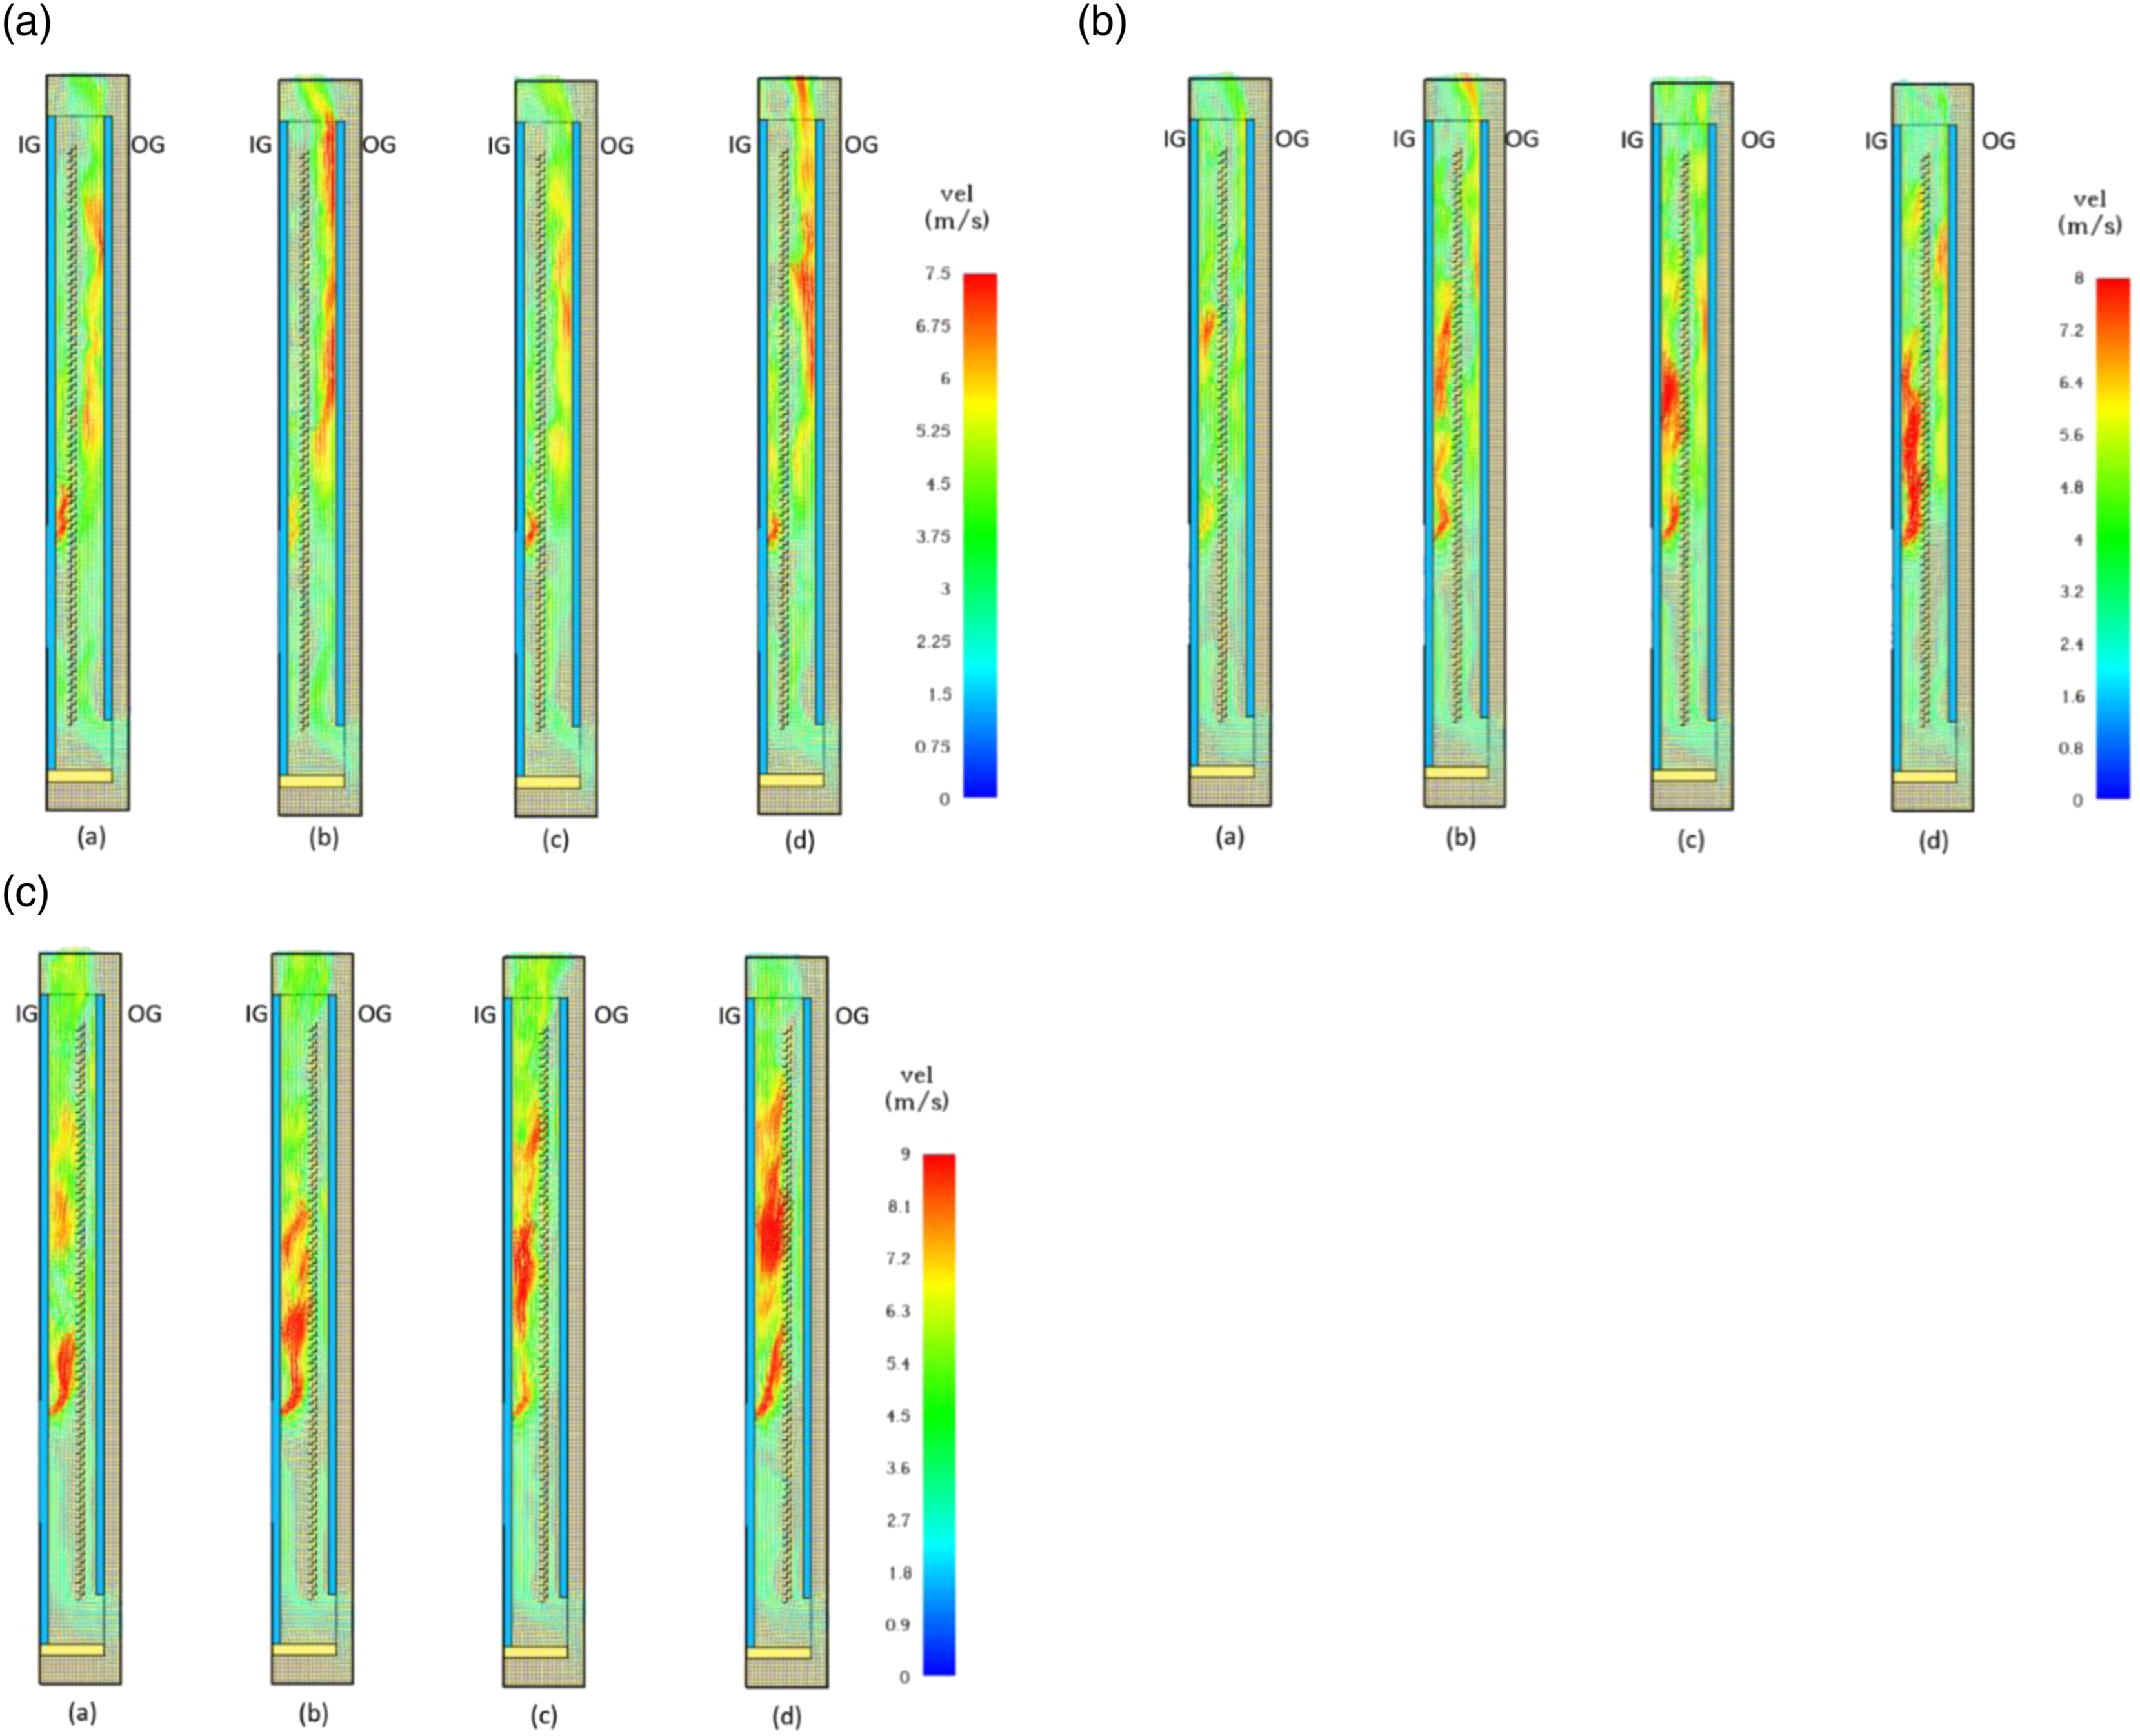
Slat Opening Angle = 90°
Figure 4(a)–(c) compares velocity vectors of the hot gas flow through the Venetian blind with slat opened at 90° in the positions represented by Cases 5, 6, and 7 respectively. Like Cases 2–4, as the blind moved closer to outer glazing, flow velocity near the inner glazing increased. In Figure 4(b), unlike Case 3 where the bulk velocity increased in Zone 1, the velocity of the hot flow in both Zones in Case 6 appeared to be balanced. For Cases 5 and 6, maximum hot gas velocity of 8 m/s were observed. In Figure 4(c) the Venetian blind positioned closer to the outer glazing created a larger Zone 1 where the fire plume flowed upward at a comparatively higher velocity. Here, maximum hot gas velocity observed was 9 m/s. (a) Case 5: Velocity vectors of hot flow in the DSF with Venetian blind opened at 90°- Close to the inner glazing (a) at 25s (b) at 50s (c) at 75s (d) at 100s. (b) Case 6: Velocity vectors of hot flow in the DSF with Venetian blind opened at 90° - in the middle (a) 25s (b) 50s (c) 75s (d) 100s. (c) Case 7: Velocity vectors of hot flow in the DSF with Venetian blind opened at 90° - Close to the outer glazing (a) at 25s (b) at 50s (c) at 75s (d) at 100s.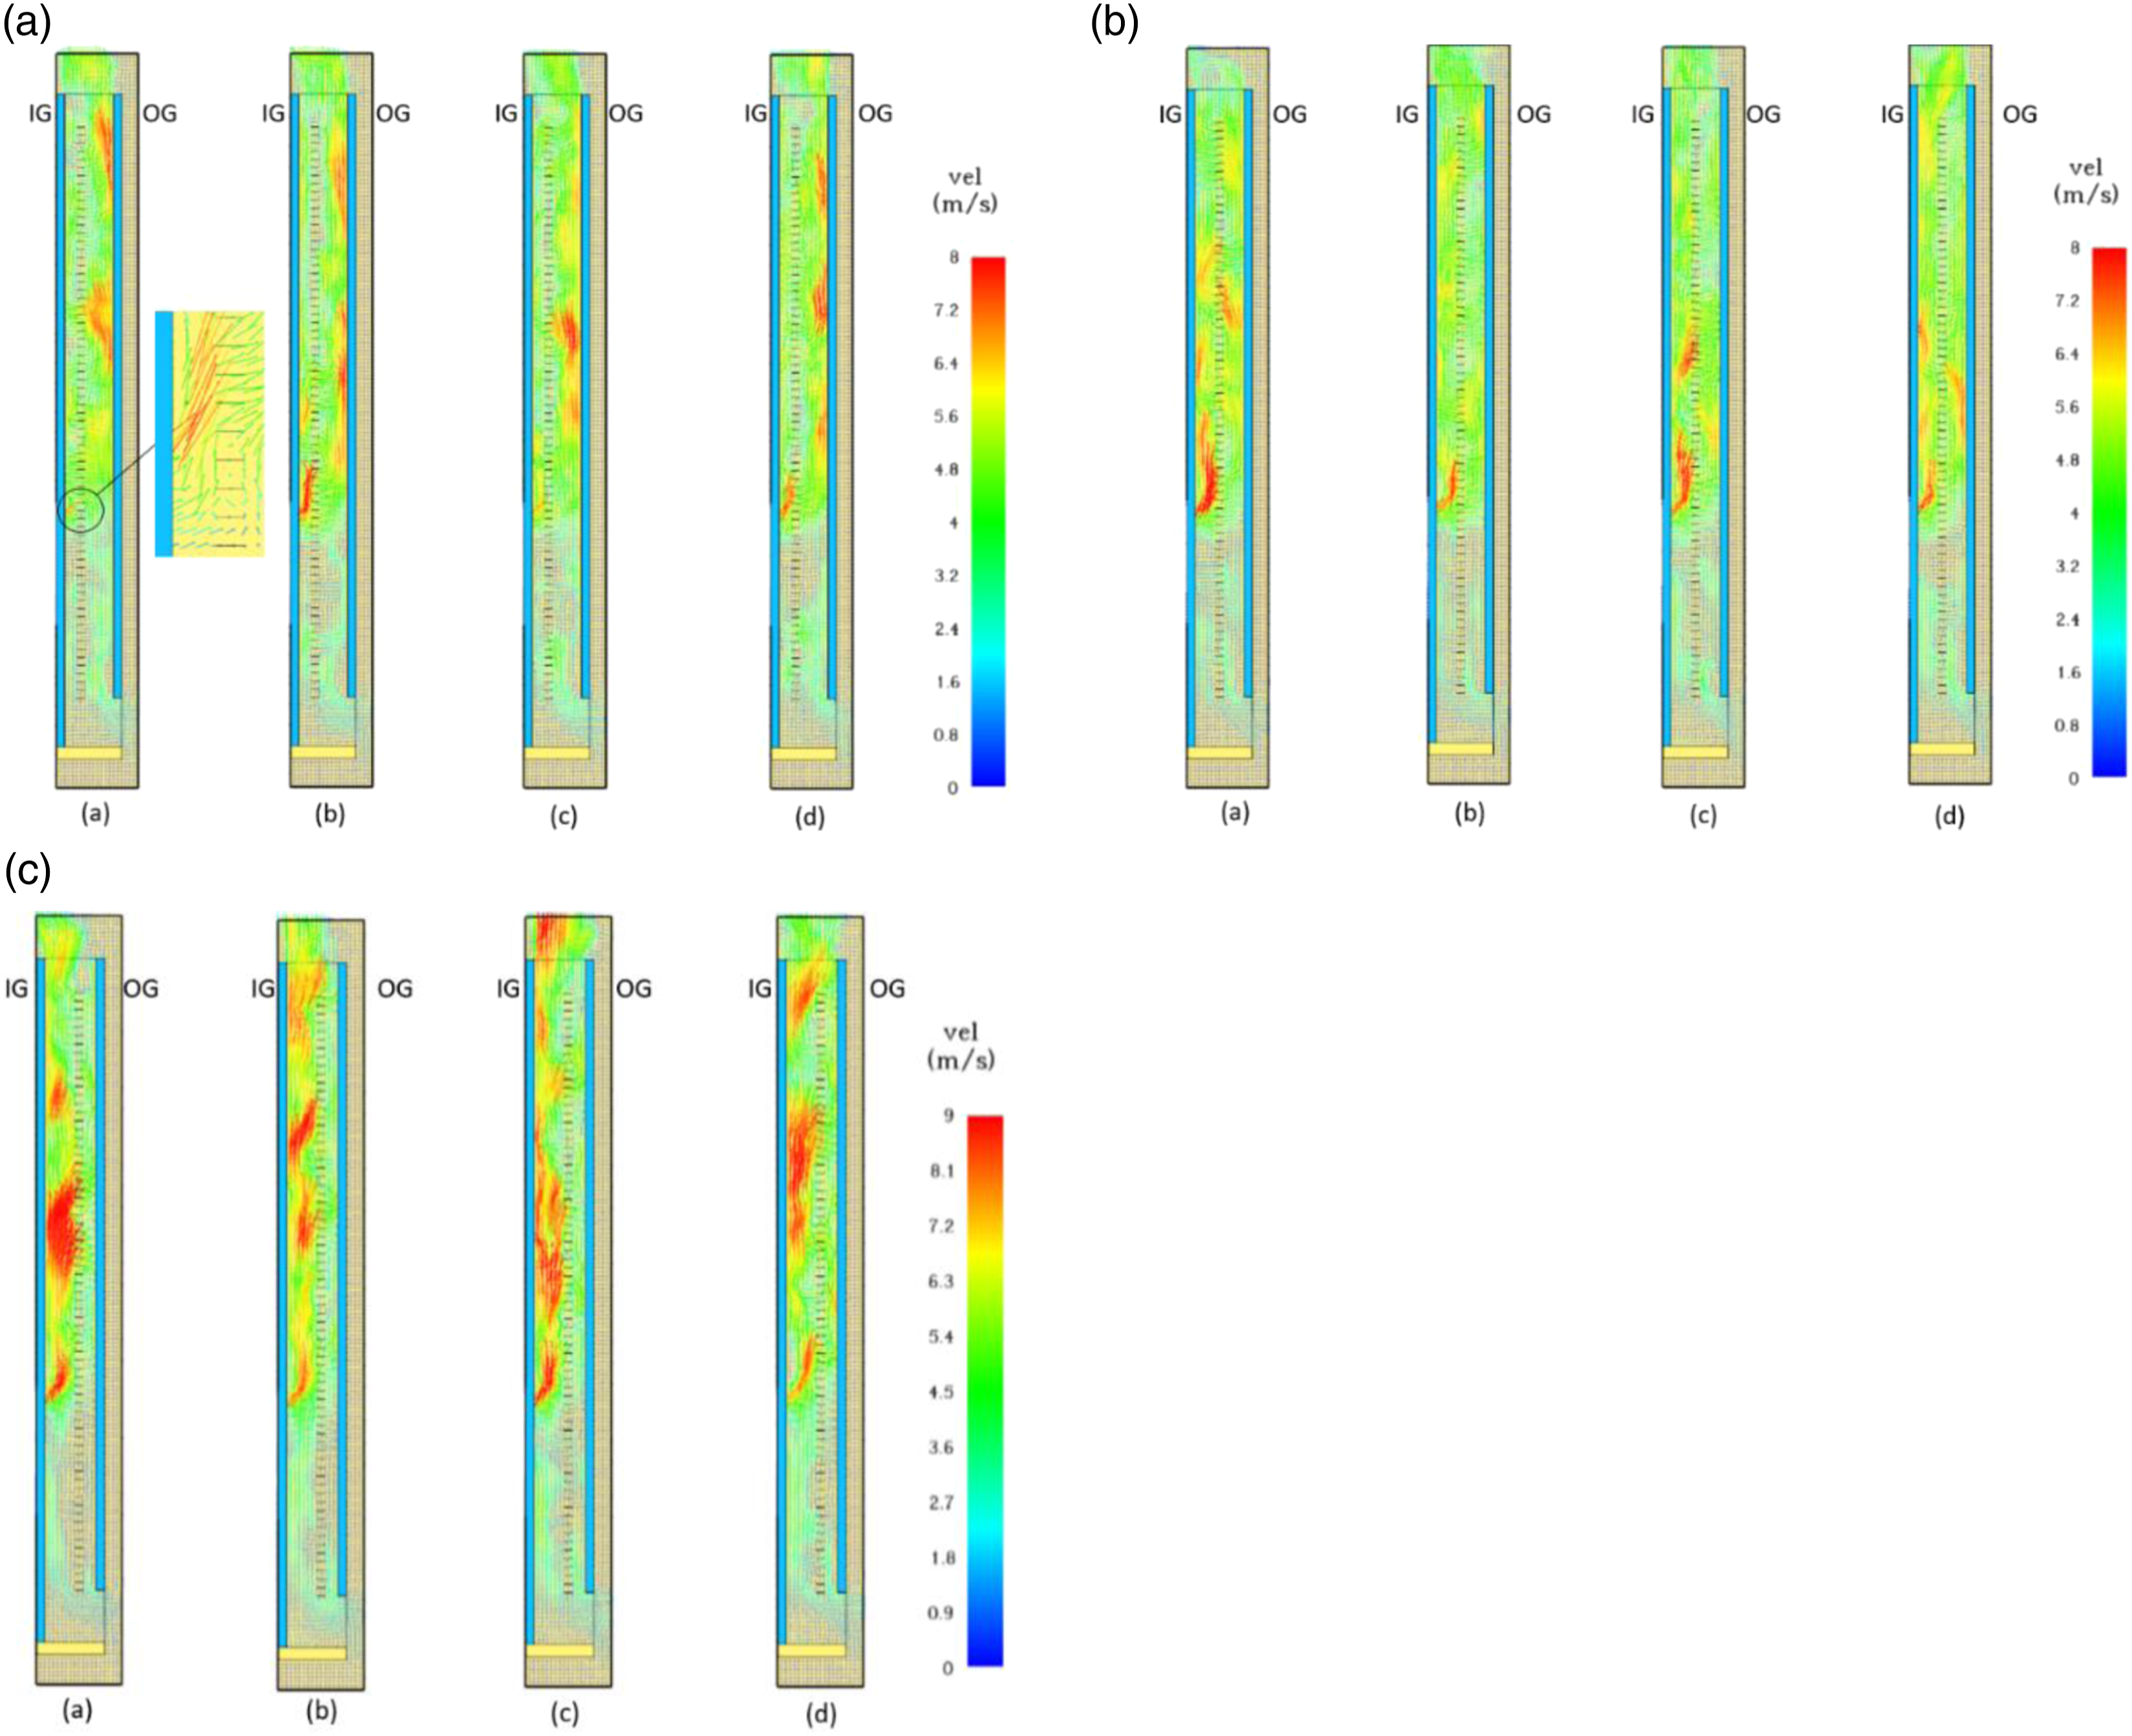
Slat opening angle = 45°
Case 8, Case 9, and Case 10 in Figure 5(a)–(c) shows the velocity profile of DSF with the Venetian blind opened at 45° in the various blind positions. For Case 8, the hot gas flow velocity increased significantly in Zone 2 more than in Zone 1 reaching a maximum of 9 m/s. The increase in the velocity as the hot gas flow exited the Venetian blind opening may be attributable to its acute angle making the opening narrow. The narrow cavity space in Zone 1 appeared to have forced the hot gas to flow through the acute slat opening into Zone 2. Like previous observations in Cases 3 and 6, the bulk velocity of the hot gas in Zone 1 of Figure 5(b) was more than that in its Zone 2. It was observed that the acute 45°angle restricted the hot flow moving into Zone 2. Unlike in Case 8 the bulk hot gas flow reaching the maximum velocity of 9 m/s remained largely in Zone 1. In Case 10, the location of the Venetian blind and the acute slat angle allowed a larger buoyant flow in Zone 1 reaching a maximum velocity of 10 m/s. (a) Case 8: Velocity vectors of hot flow in the DSF with Venetian blind opened at 45°- Close to the inner glazing (a) at 25s (b) at 50s (c) at 75s (d) at 100s. (b). Case 9: Velocity vectors of hot flow in the DSF with Venetian blind opened at 45° - In the middle (a) at 25 s (b) at 50 s (c) at 75 s (d) at 100s. (c) Case 10: Velocity vectors of hot flow in the DSF with Venetian blind opened at 45° - Close to the outer glazing (a) at 25 s (b) at 50 s (c) at 75 s (d) at 100s.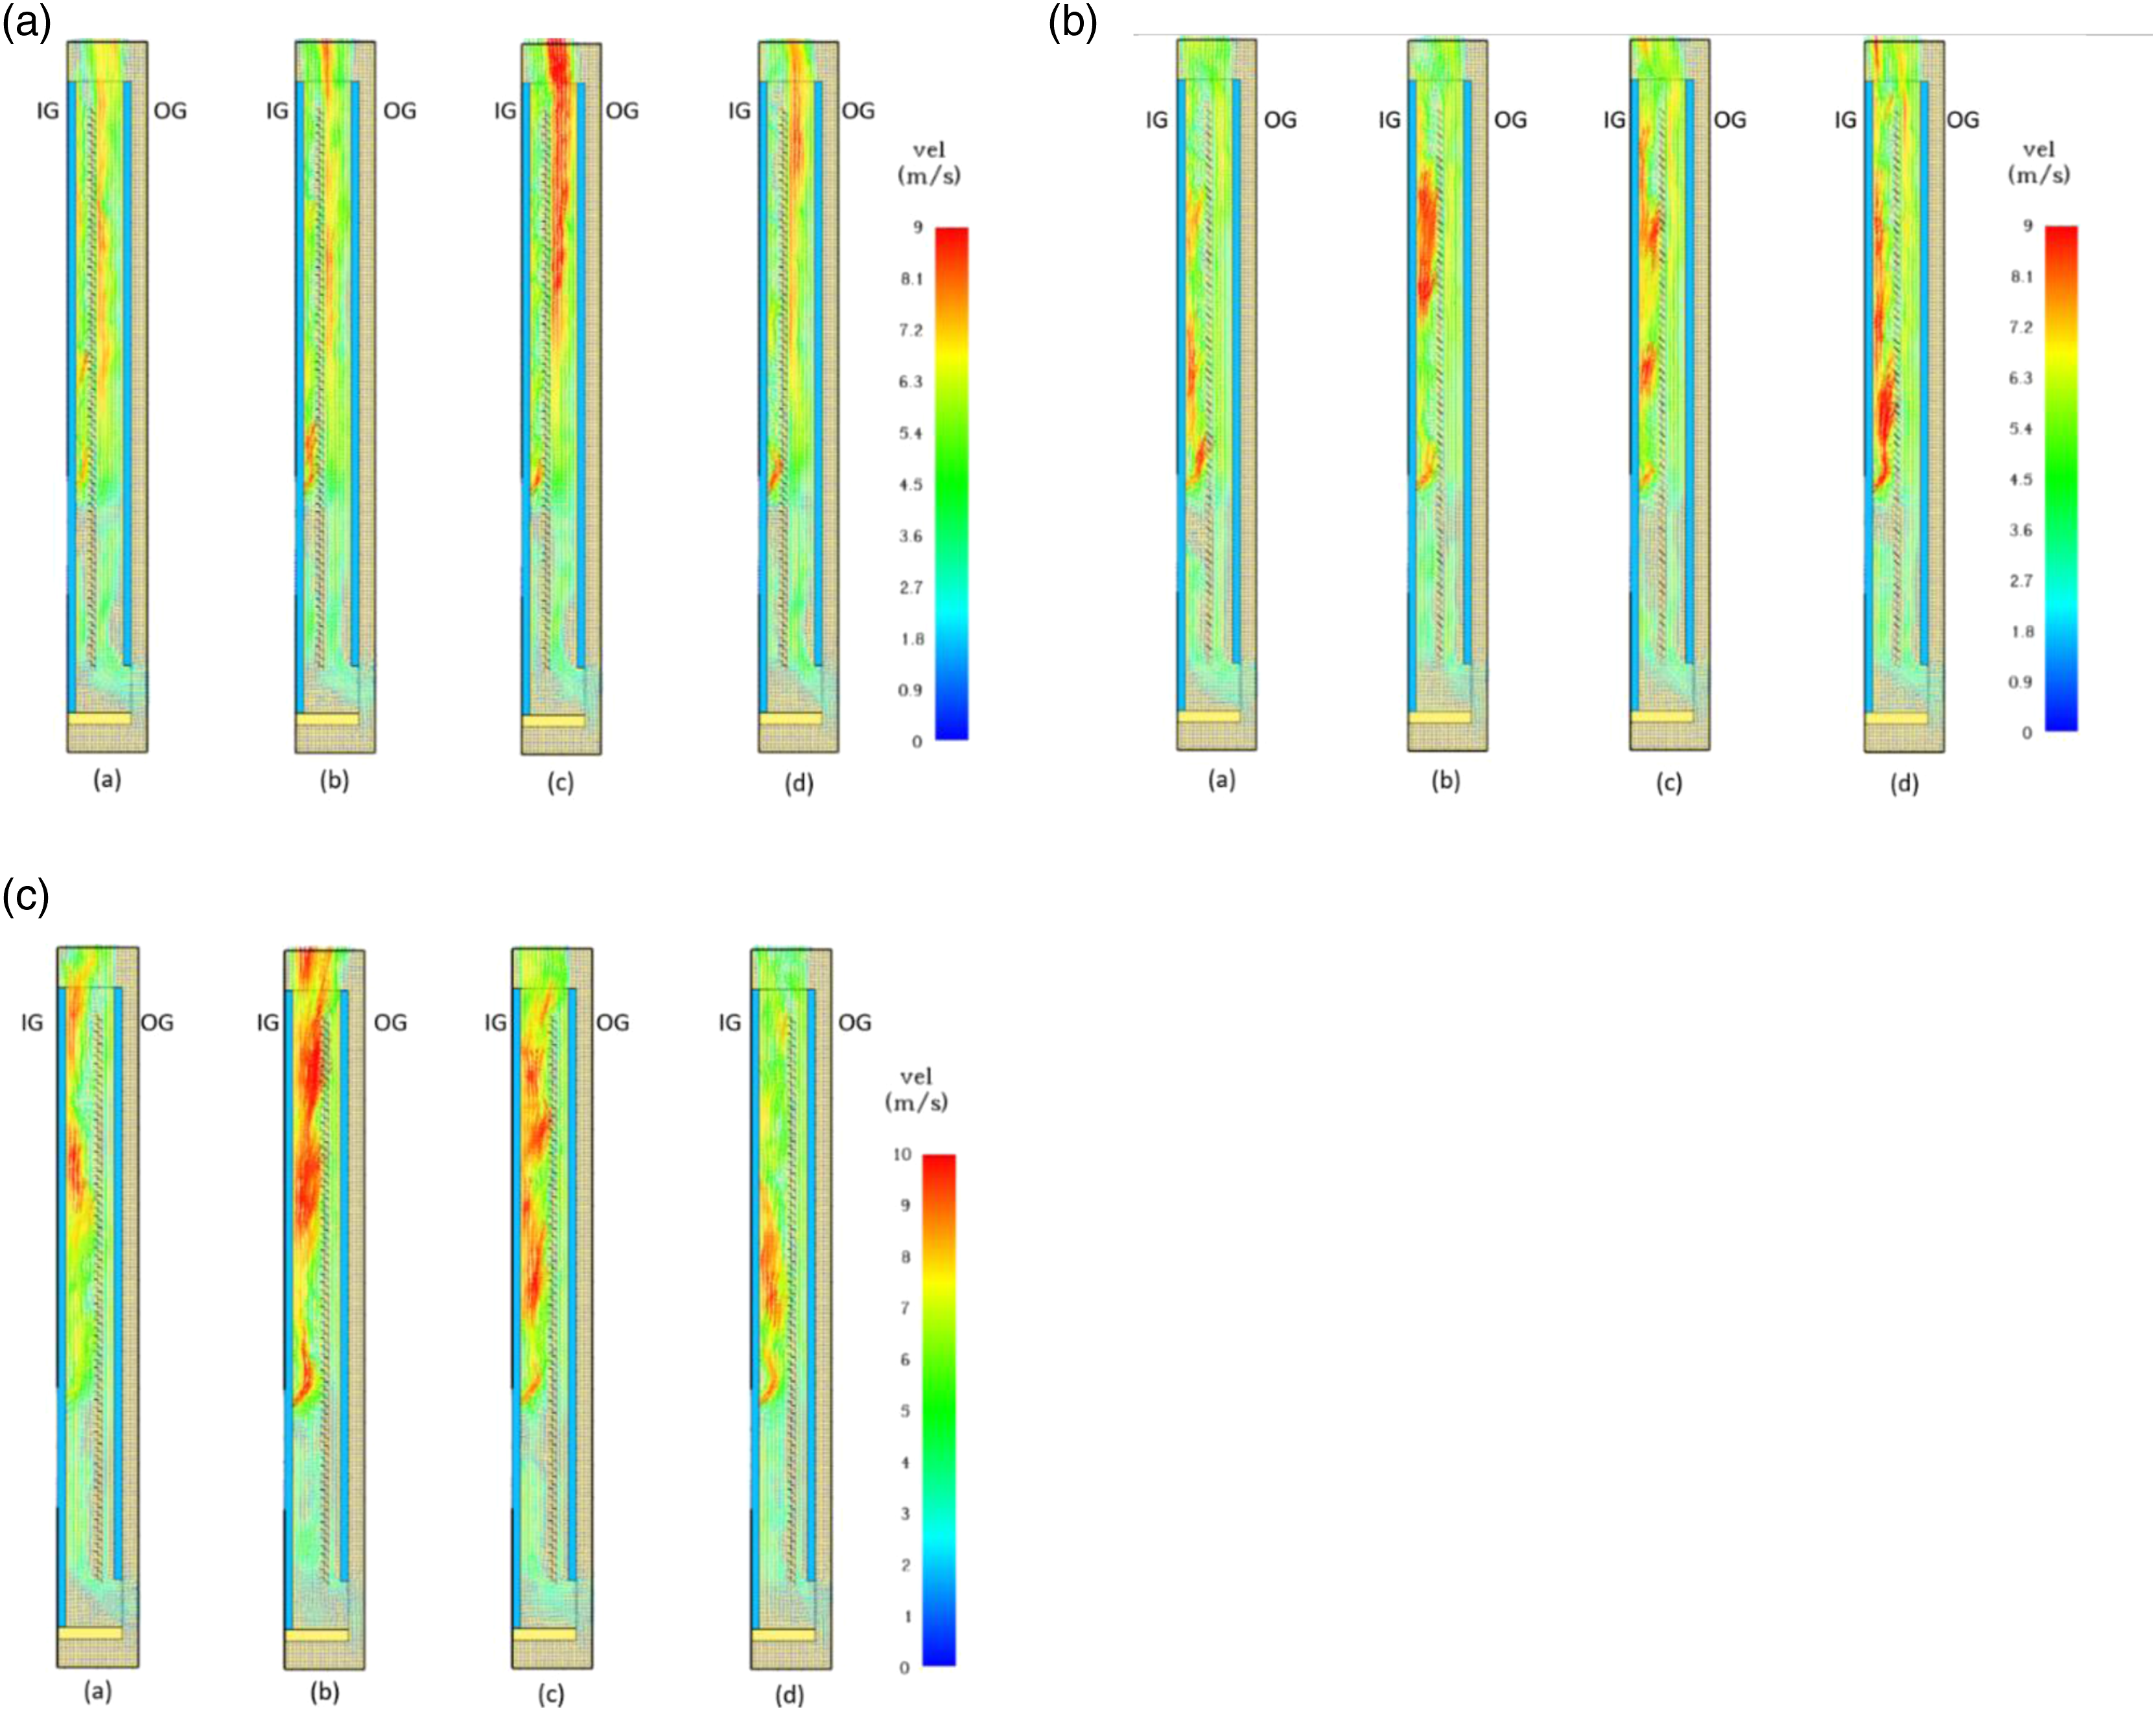
Overall, most of the hot gases rose with a comparatively low amount going down due to buoyancy indicating that the amount of smoke going to floors lower than the fire location would likely be minimal compared to the amount going to upper floors. Depending on the slat opening angle and the blind position, hot gas maximum velocities ranged between 7.5 m/s to 10 m/s. In the scenario where the glazing shatters, these maximum hot gas velocities can impact evacuation of occupants leading to firefighting challenges.
Slat Opening Angle = 0°
At 0°slat opening angle, the Venetian blind was fully closed hence acted as a vertical wall dividing the DSF cavity subsequently reducing the cavity space for the hot flow. It is important to note, the Venetian blind was set as incombustible. Overall, the hot flow was observed to mostly move upwards at comparatively higher velocities in Zone 1. For this case, the results show the influence of the size of the DSF cavity volume on the spread of fire and smoke. Here, irrespective of the size of the cavity dimension created as a result of the blind position, the maximum hot gas velocity reached 10 m/s. This likely will have implications for firefighting and the spread of fire and smoke to immediate upper floors in the event the inner glazing shatters.
Temperature profile
Glazing surface temperatures
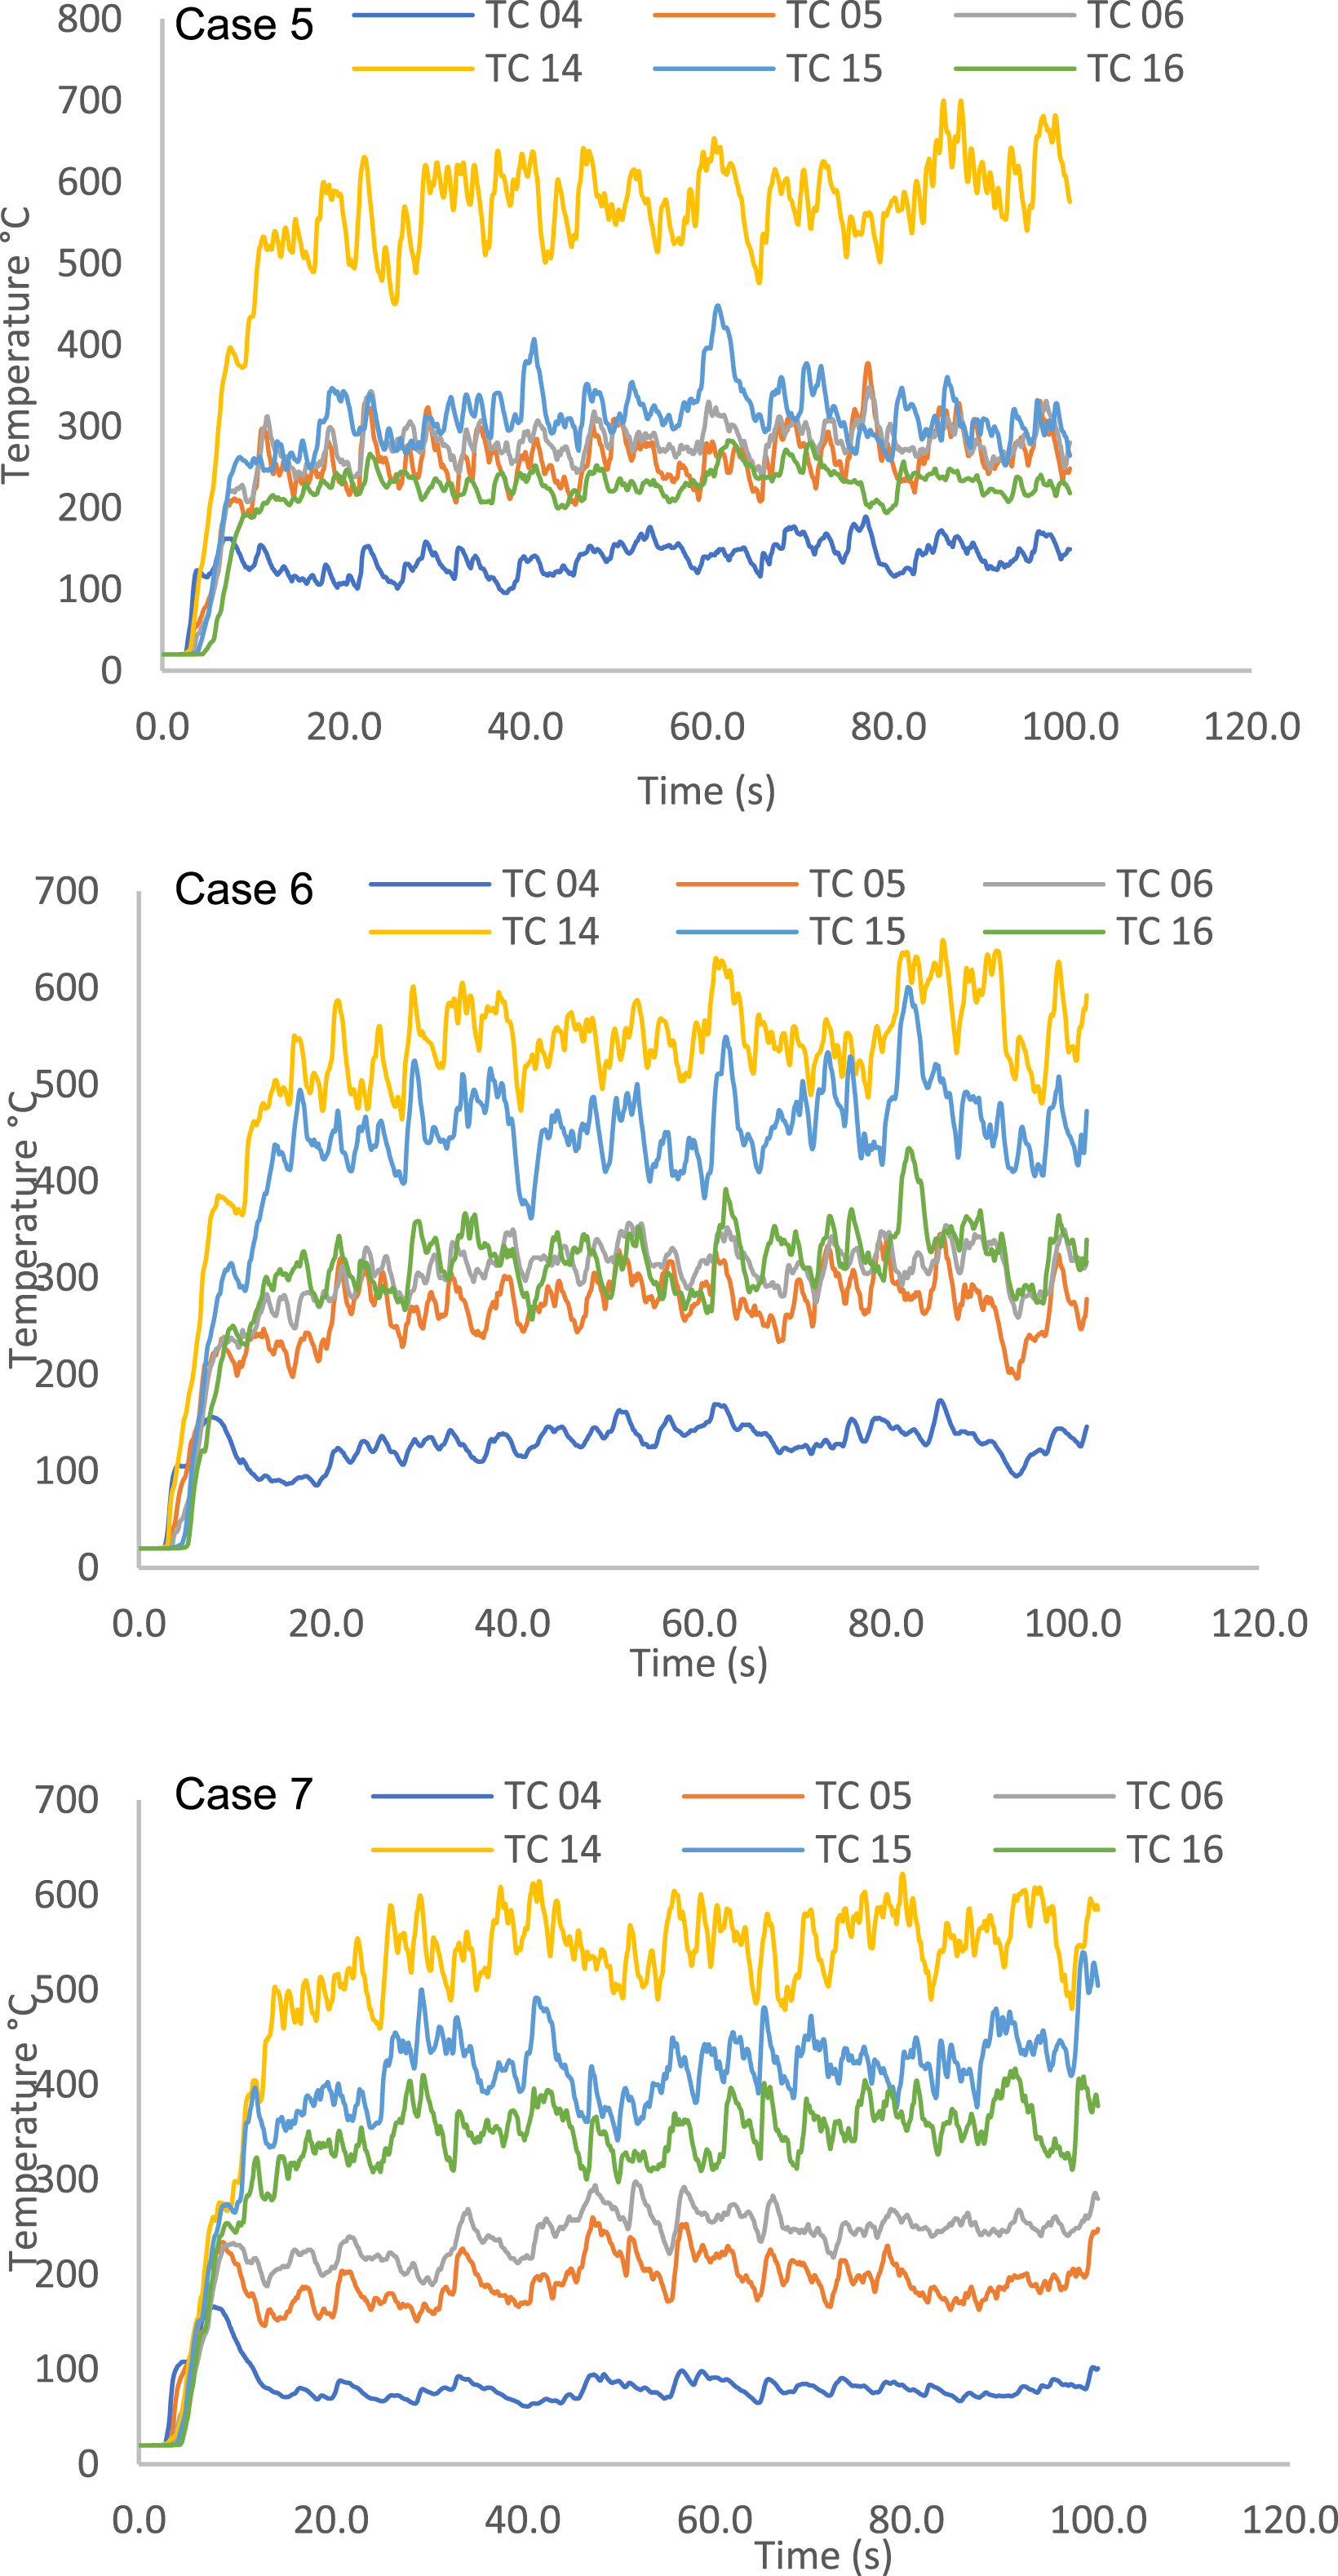
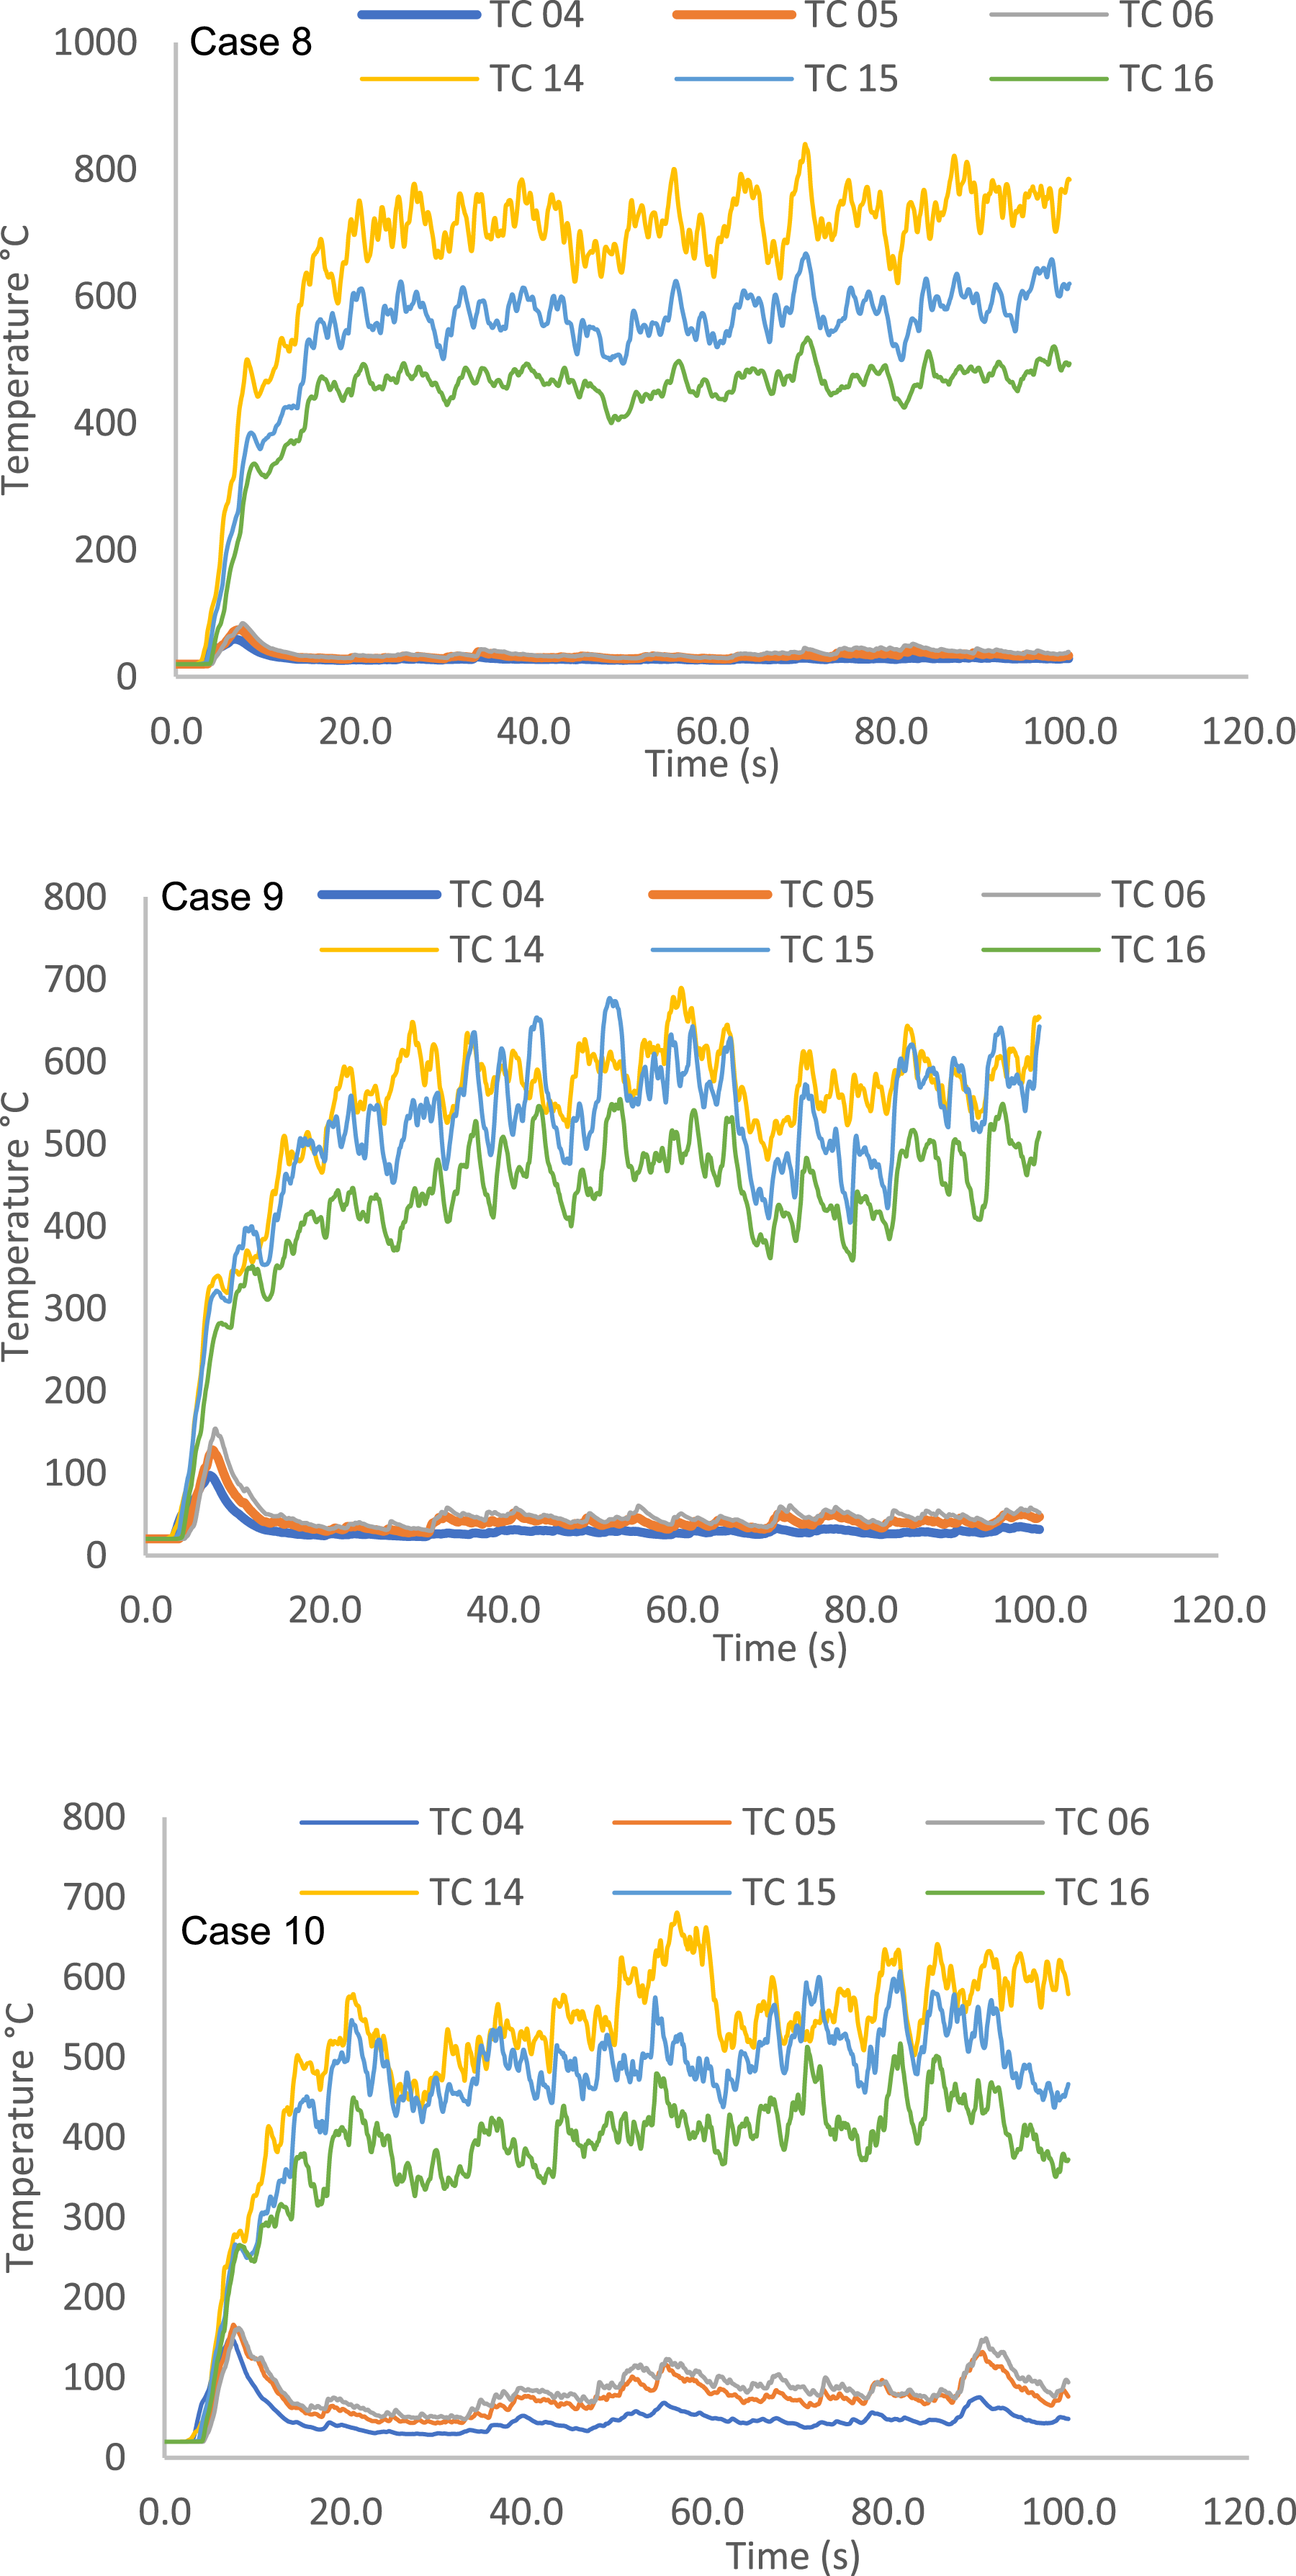
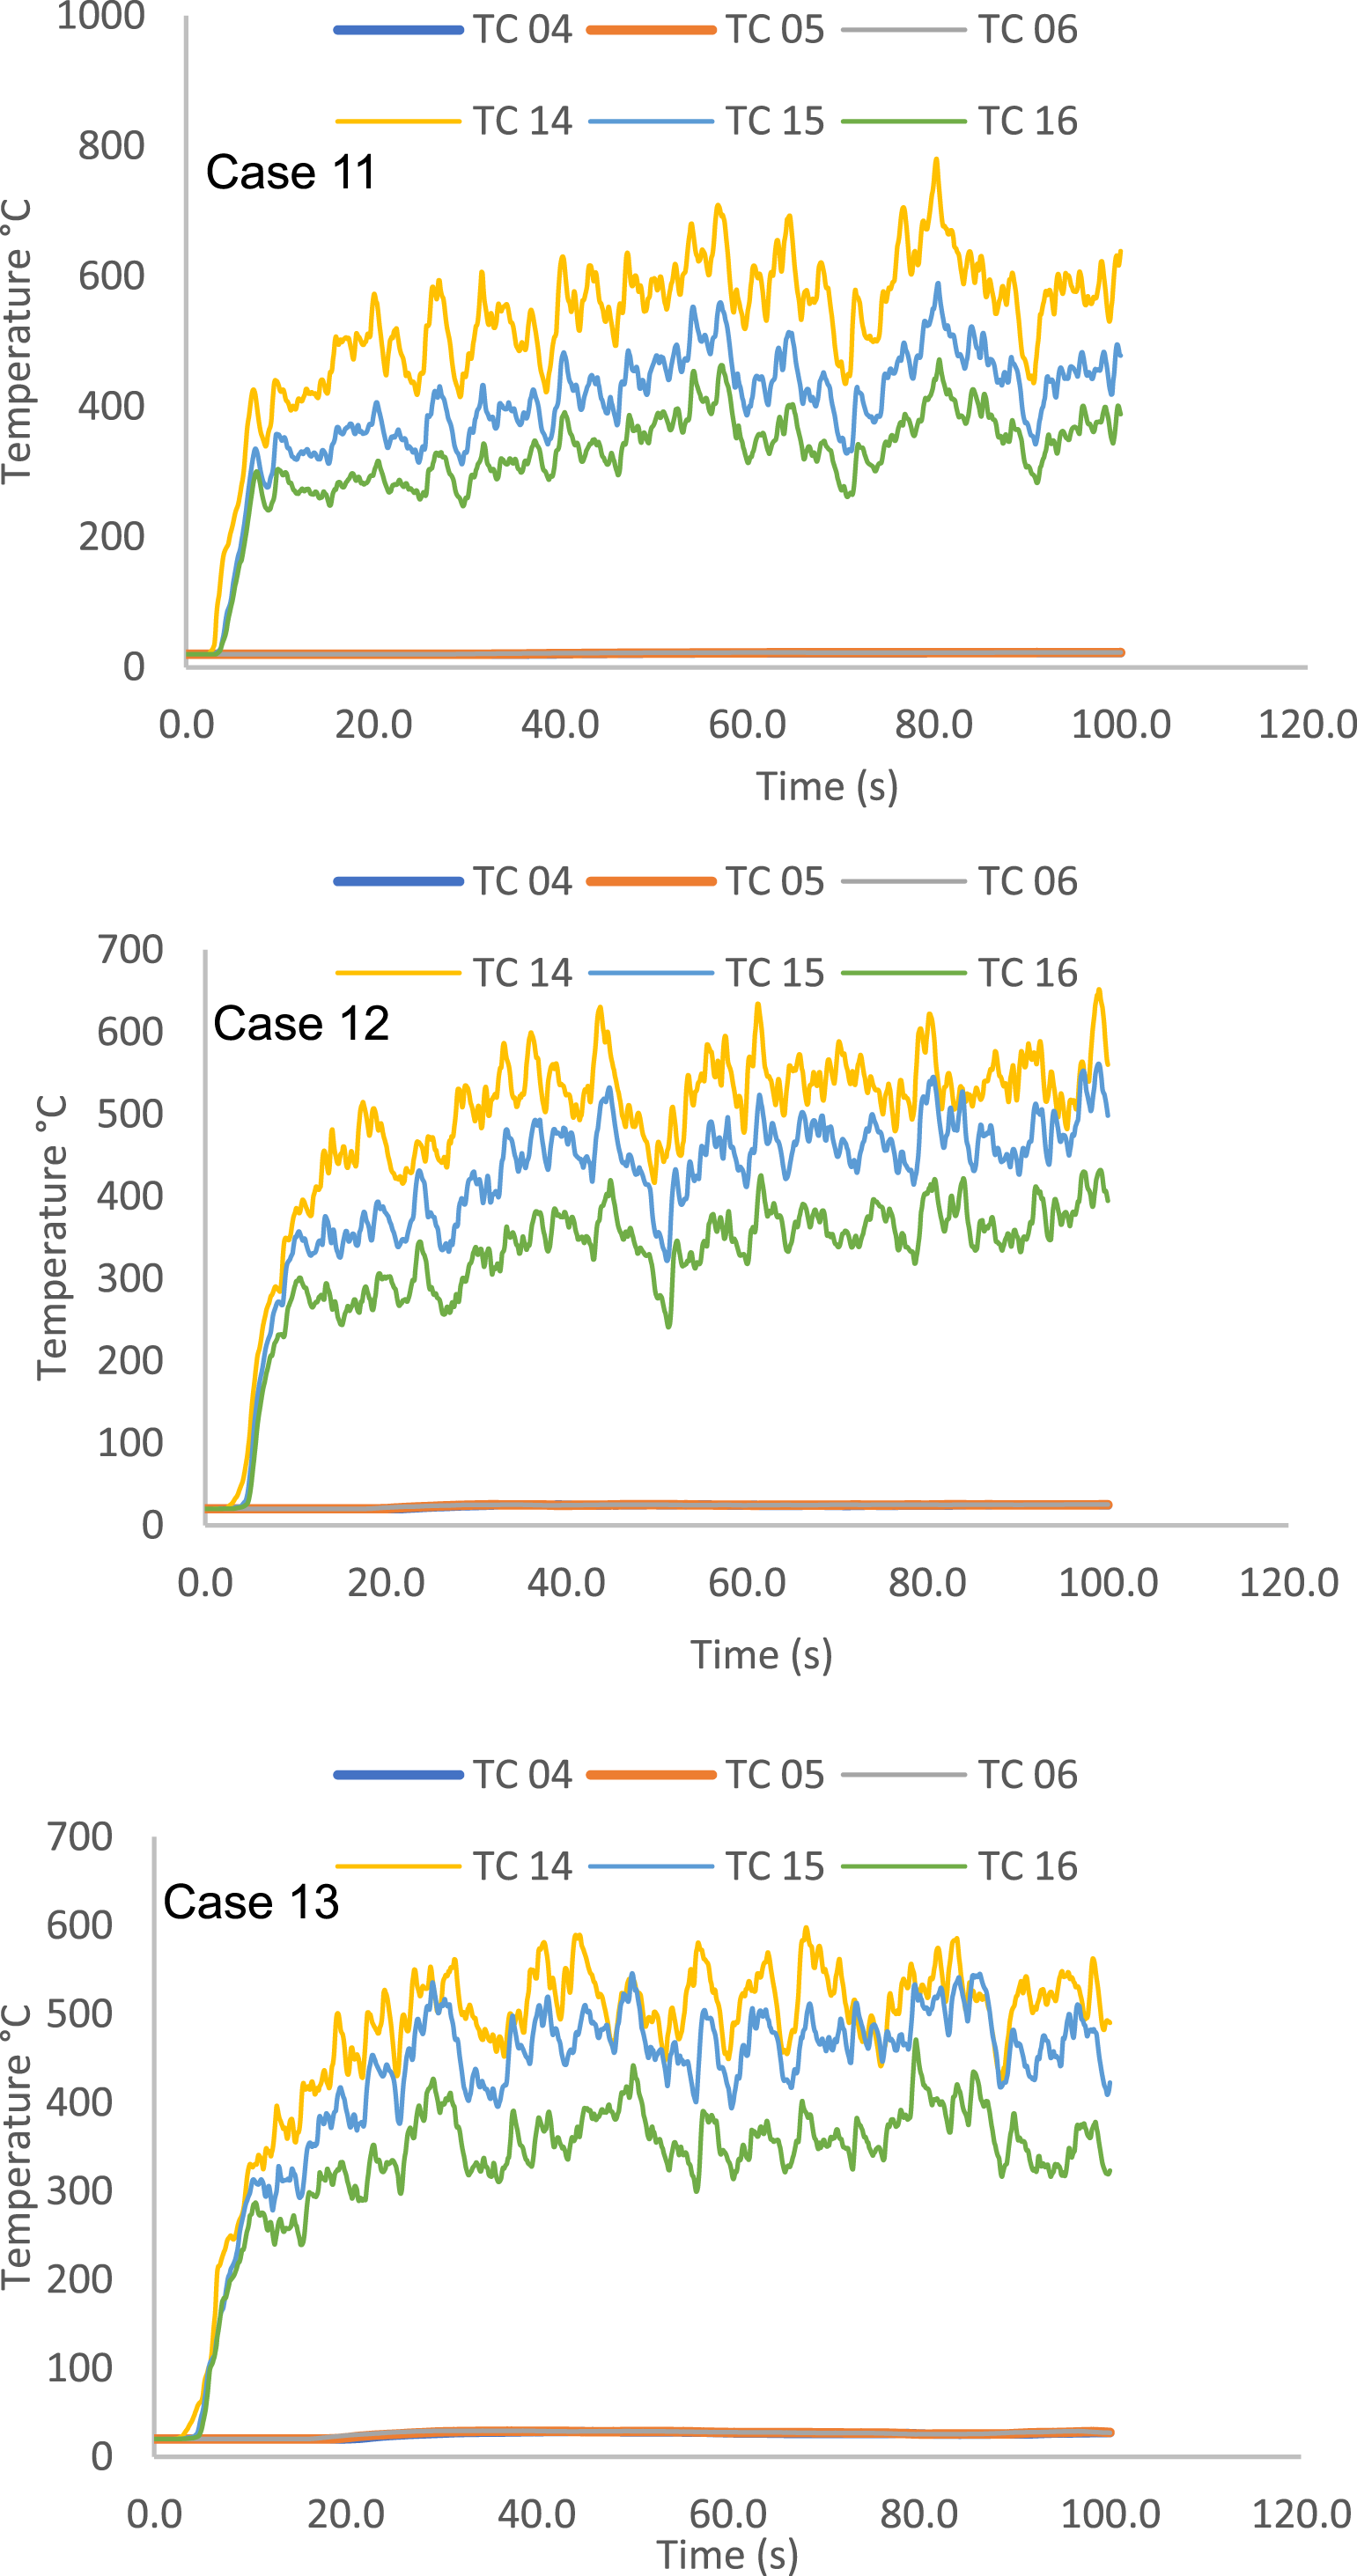
Figures 6–9 shows plots for the transient inner and outer glazing surface temperatures for Floor 2 under the simulated scenarios. Floor 2 was chosen as it is immediately above the fire room and significantly impacted due to the pattern of hot gas flow observed in Figure 2. Crucially, the maximum surface temperatures obtained from thermocouples installed on glazing surfaces on Floor 3 and Floor 4 were 471°C and 305°C respectively, both significantly less than the glass breakage threshold temperature of 600°C. On Floor 2 as shown in Figure 1(b), thermocouples TC 04, TC 05, and TC 06 were respectively installed 0.1 m apart on the outer glazing from bottom up. Similarly on the same floor, TC 14, TC 15, and TC 16 were installed 0.1 m apart on the inner glazing. Transient temperature profiles for venetian blind opened at 135°. Transient temperature profiles for venetian blind opened at 90°. Transient temperature profiles for venetian blind opened at 45°. Transient temperature profiles for venetian blind opened at 0°.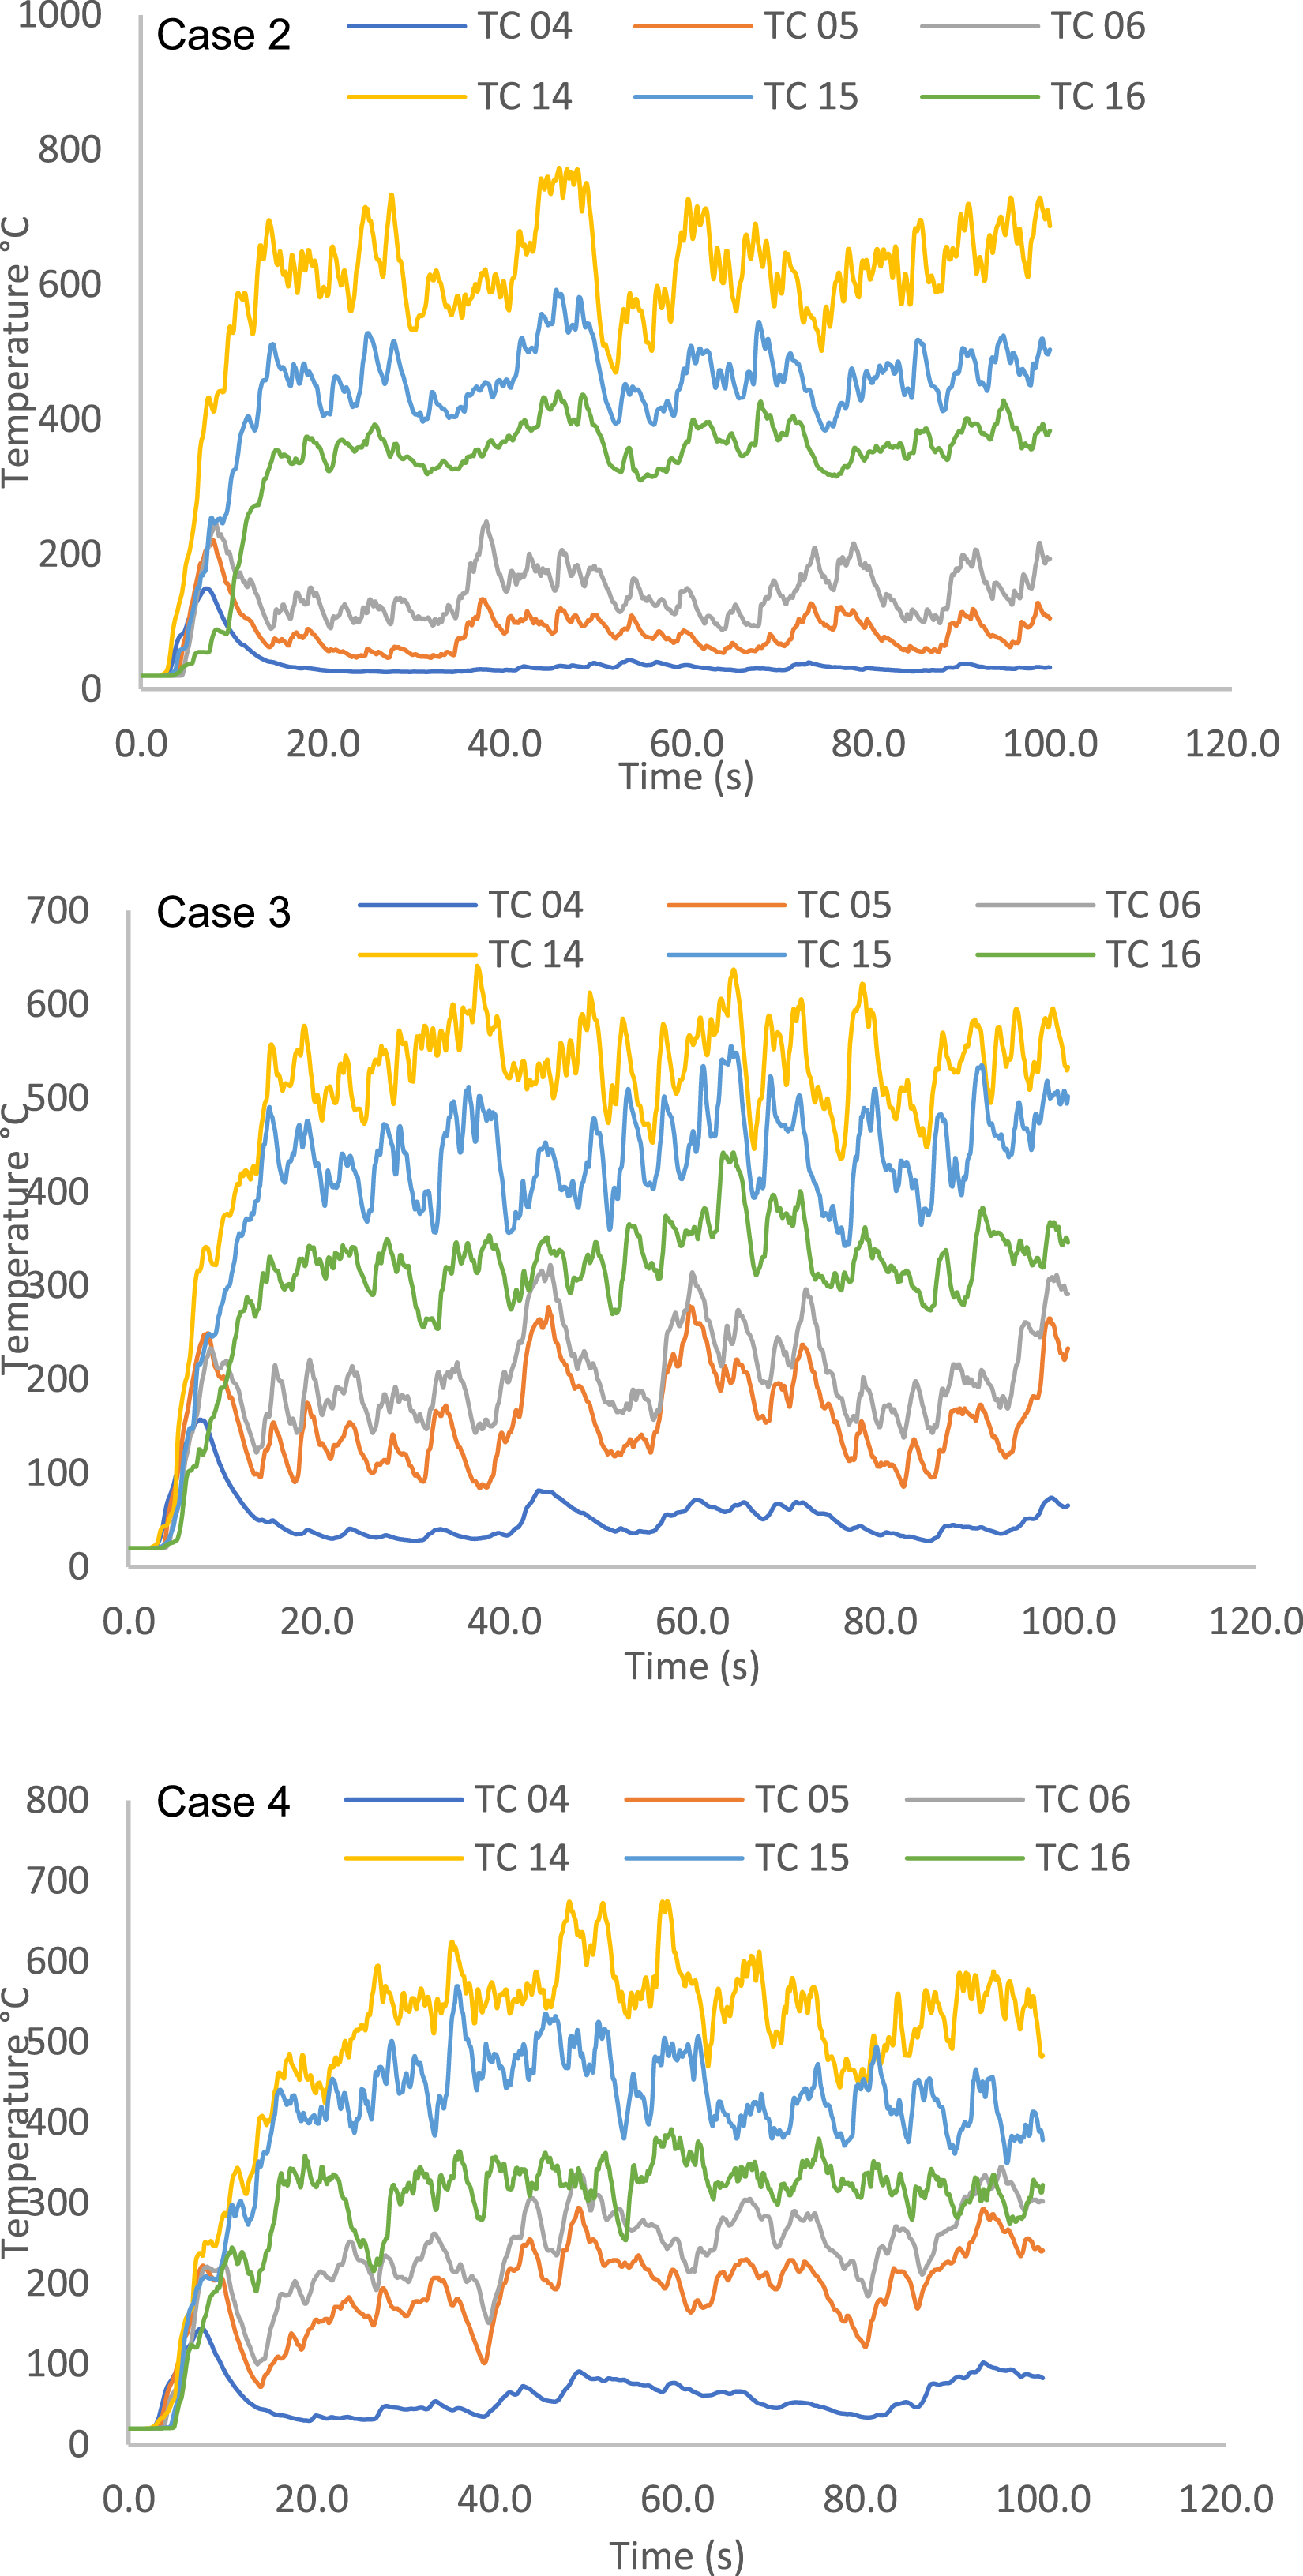
In Figure 6, the transient surface temperatures on the Floor 2 glazing with the Venetian blind opened at an angle of 135° is presented. It can be observed that the inner glazing temperature was comparatively higher than the outer glazing temperature for this slat angle opening. In all cases for this slat angle opening, there was a comparatively larger temperature difference between TC 04 and TC 14 the closest thermocouples to the fire room. With TC 14 showing peak inner glazing surface temperatures above 600°C, it is safe to assume that under this scenario, the inner glazing will shatter allowing smoke and fire to spread to the second floor. For Cases 2, 3 and 4, the peak temperatures obtained for TC 14 were 773°C, 641°C and 675°C respectively. With the time taken for the threshold to be reached, it is also safe to say this could lead to evacuation challenges as hot gases can impact occupants safe exit of the floor. Thermocouple temperatures recorded for TC 15 and TC 16, 0.1 m apart, both above TC 14 shows peak temperatures below the glass breakage threshold. For Case 2 the peak temperatures for TC 15 and TC 16 were 592°C and 442°C respectively. For Case 3 they were 555°C and 442°C respectively while for Case 4 they were 569°C and 391°C respectively. It was also observed that the Venetian blind position at this slat angle opening influenced the amount of the hot gases that occupied Zone 2 to increase the outer glazing surface temperature.
Figure 7 shows Cases 5, 6 and 7 with the Venetian blind angle opened at 90°. Here too, TC 14 over time exceeds the glass breakage threshold. For Case 5, a significant temperature difference between TC 04 and TC 14 was observed throughout the simulation. The difference between the peak surface temperatures for TC 04 (189°C) and TC 14 (700°C) was determined to be 511°C. For TC 05 and TC 15, the temperature difference is comparatively smaller with a peak temperature difference of 71°C. However, the results for TC 06 and TC 16 shows that the outer glazing surface temperature supersedes the inner glazing surface temperature. Here, peak surface temperatures obtained were 348°C and 283°C respectively for TC 06 and TC 16. This shows that more hot gases impinged on the outer glazing surface at that thermocouple level as the hot gases rushed through the 90° slat opening angle. For Case 6, a comparatively larger temperature difference between the peaks of TC 05 (345°C) and TC15 (601°C) was observed. For TC 06 and TC 16, the temperature appears to be similar with only a slight difference between them. Here, peak temperatures for TC 06 and TC 16 were respectively 357°C and 434°C resulting in a peak temperature difference of 77°C. Case 7 on the other hand shows clear temperature differences between the inner glazing surfaces and outer glazing surfaces. The peak temperatures for TC 04 and TC 14 were 166°C and 622°C respectively. For TC 05 and TC 15, the peak temperatures were 260°C and 539°C respectively. While for TC 06 and TC 16 they were 298°C and 417°C respectively. Here, the recorded temperatures for the inner glazing surfaces overall were comparatively higher than those for the outer glazing surfaces.
Figure 8 shows the transient temperature profiles for Cases 8, 9 and 10 when the Venetian blind angle was opened at 45°. The results show significantly lower temperatures record on the outer glazing surfaces compared to the cases in Figures 6 and 7. This appears to indicate that at this blind angle opening, the hot gas path to Zone 2 was impeded hence the significant temperature differences between the inner and outer glazing surfaces. For all three cases, peak temperatures for TC 14 and TC 15 were observed to exceed the glass breaking temperature threshold of 600°C. For Cases 8, 9 and 10, TC 14 attained peak temperatures of 840°C, 689°C and 681°C respectively, while TC 15 attained corresponding peak temperatures of 667°C, 677°C and 607°C. For TC 16, the peak temperatures under the three cases were 535°C, 554°C and 517°C respectively, all below the glass breakage temperature threshold. The outer glazing in all three cases achieved peak temperatures comparatively lower and ranging between 59°C and 166°C. With most of the peak temperatures for the inner glazing exceeding the glass breakage threshold, there is the likelihood of the inner glazing shattering. This coupled with a comparatively lower outer glazing temperature can create challenges for firefighting from the outside and occupants’ safe evacuation due to the spread of hot gases when the inner glazing shatters.
Figure 9 shows the transient glazing surface temperatures when the Venetian blind was assumed closed. Here, it is important to note that the Venetian blind was specified to be incombustible hence acted as a fire barrier when the slat angle was 0°. For Cases 11 and 12, the peak surface temperatures for TC 14 were 780°C, and 652°C respectively, exceeding the glass breakage temperature threshold. For Case 13, the peak inner glazing surface temperature was below the glass breakage threshold temperature. Here, TC 14, TC 15, and TC 16 registered peak surface temperatures of 598°C, 546°C and 471°C respectively. Since the hot gases did not penetrate the Venetian blind, the outer glazing temperature maintained the initial room temperature set value of 20°C. Overall, the results indicate that the inner glazing surface temperature increased with a decrease in the cavity volume of the zone. This implies that the DSF cavity dimension influences the glazing surface temperature in a fire event and in this context, it was the inner surface glazing temperature.
Model validation and sensitivity analysis
Validation of model
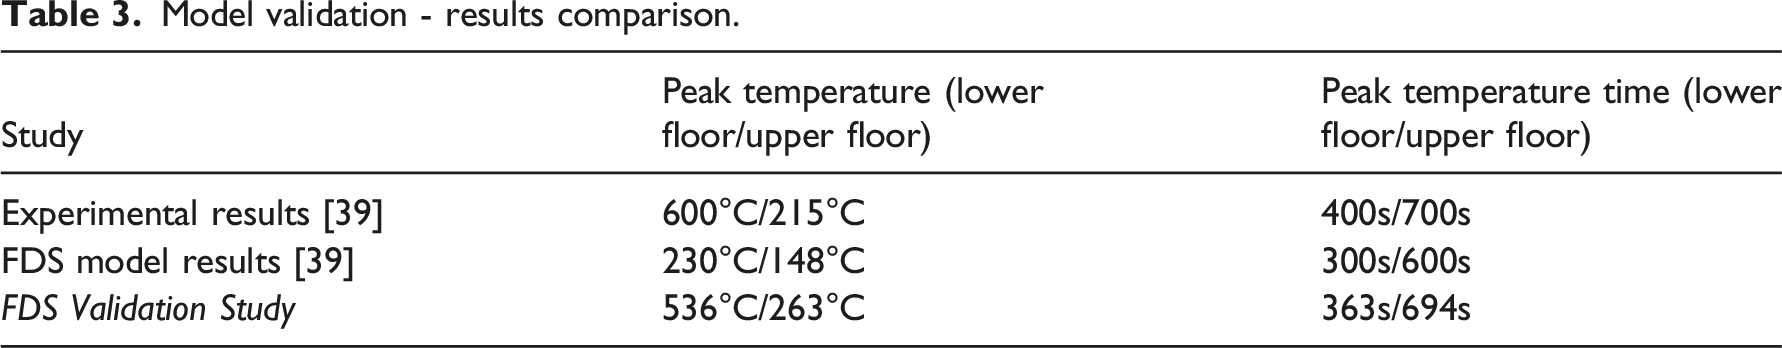
Since we investigated a fire event invariably of high consequence and uncertainty, we acknowledge that there may be large uncertainties tied to our simulation inputs that may be far from an actual future scenario 35 . The challenges associated with validation of fire models is well recognized due to the high cost and other difficulties of conducting large-scale fire tests 36 . According to Chow et al. 36 , most field models are validated by experiments not specially designed for such purpose with very few studies comparing models with field measurements in actual sites. To this end, we discuss the validation of our model in terms of a historical statement of the model’s capability, due to the challenges in replicating the actual fire scenarios in an actual site. 35 As outlined in Pretrel et al. 37 and Merci et al., 38 challenges in validating numerical fire models makes it necessary for modifications to be made to be able to validate against historical experimental data. Since in this present study there was no actual experimental set up for the validation, we validated our model’s capability by using it input parameters and approach to simulate Peng et al. 39 ’s model as a basis of comparison to demonstrate reliability of our results. Peng et al. 39 carried out experimental and numerical studies of fire and smoke movement in the cavity of a double-skin glass façade similar to this present study. They used an FDS model to simulate one of the experimental tests to investigate the effect of fire sources and cavity depths and found good agreement between their experimental and numerical results.
Here, we used our key parameters and approach to model the building in Peng et al., 39 which is a 2-storey DSF building of dimensions 4 × 9 × 3.3 m high with a DSF cavity depth of 860 mm. The 2-storey building was meshed similarly as our present study, with the fire room meshed with grid size of 0.2 × 0.2 × 0.2 m (MESH 01) and the cavity meshed with grid size of 0.1 × 0.1 × 0.1 m (MESH 02) both with respective grid quality as shown in Table 1. Since Peng et al. 39 did not consider Venetian blind in the cavity of the DSF, we also omitted the Venetian blind in this validation process to enable a reasonable comparison to be made. The Heat Release Rate (HRR) was set as 2 MW, and the simulation was run for 1000s similar to one of the experimental fire scenarios in Peng et al. 39 The HRR was set to develop a fast t2 growth rate to reach and maintain 2 MW HRR similar to the numerical simulation in Peng et al. 39 The internal facade of the fire room was assumed to be broken. Temperature sensors were placed 0.1 m apart on the inner façade from a height of 1.6 m from ground.
In Figure 10(a) and (b), three plots namely Experimental Results,
39
FDS Model Results,
39
and FDS Validation Study are represented on each chart. In our FDS Validation Study, we find that simulating Peng et al.
39
’s model with our parameters yielded results that follows closely the experimental results obtained by Peng and co-workers. Although in some situations our FDS Validation Study model overpredicted the experimental results obtained by Peng et al.,
39
we still draw confidence in our model’s capability to reasonably predict the potential trend under experimental conditions albeit with some level of uncertainty. (a) Measured temperature - upper floor. (b) Measured temperature - lower floor.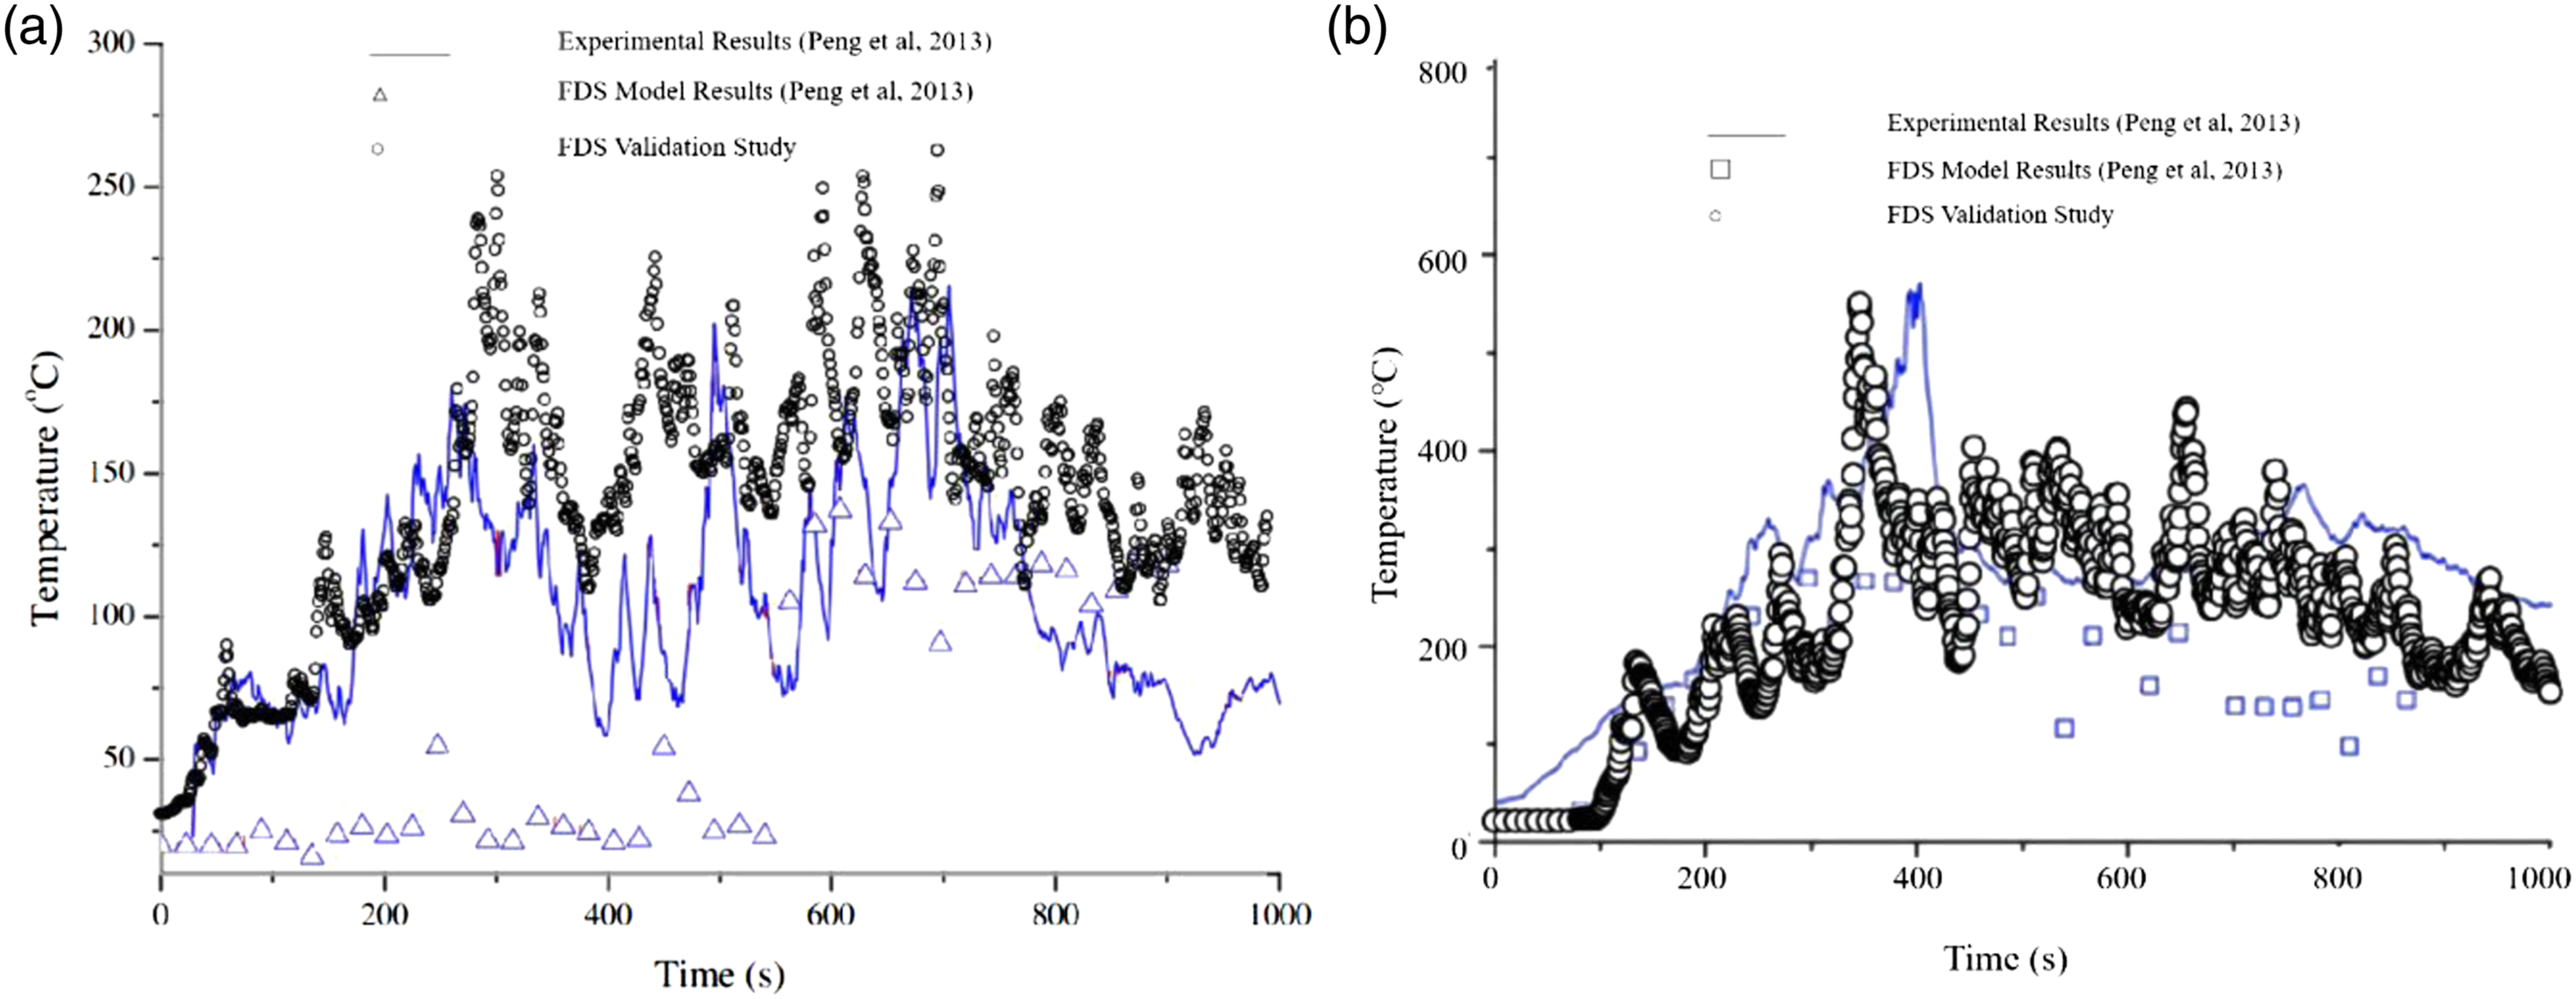
Sensitivity analysis
Statistics for mesh sensitivity analysis.
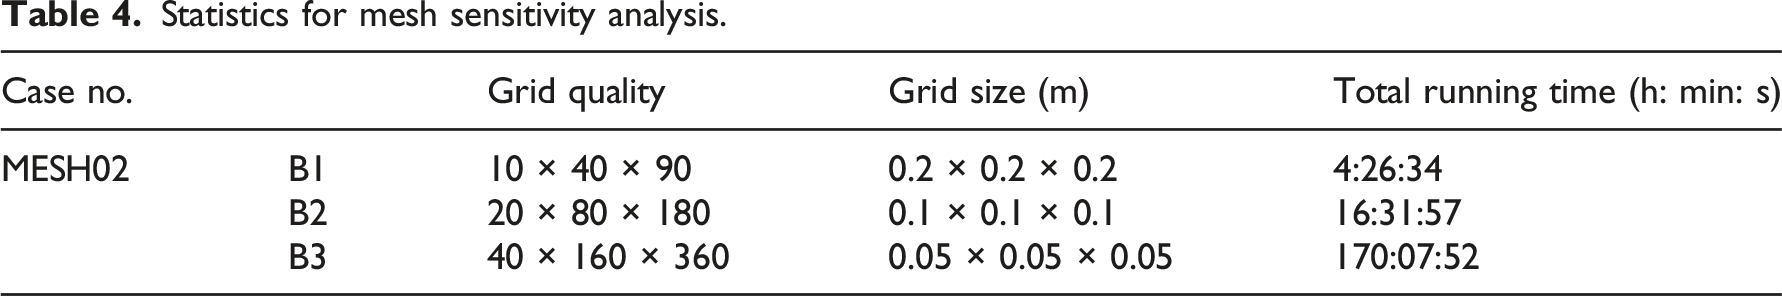
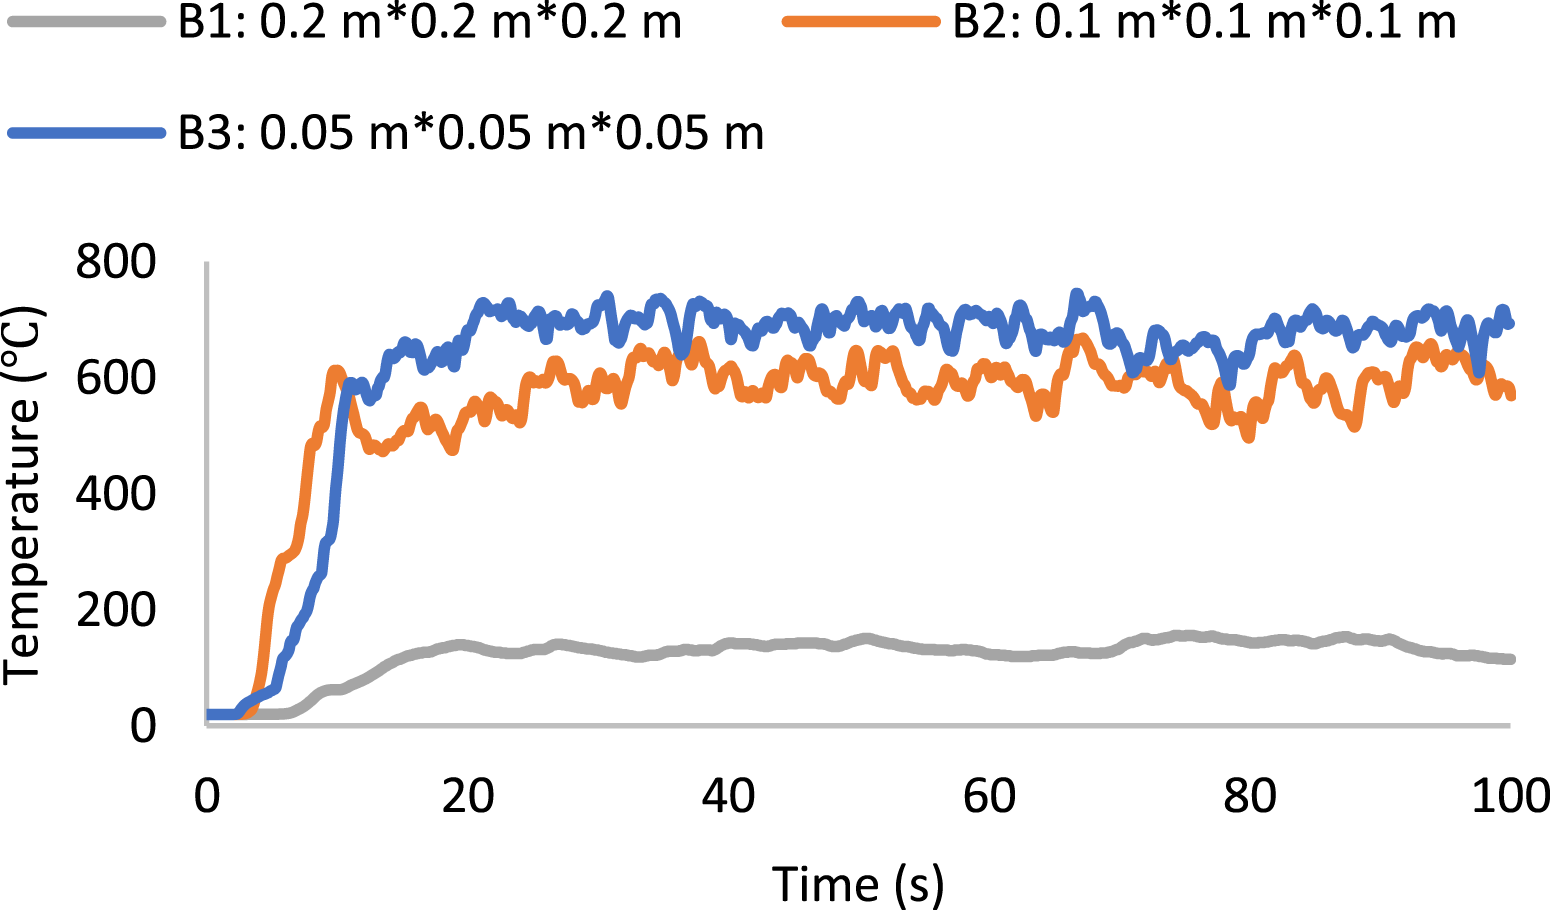
Mesh sensitivity analysis - thermocouple (TC 14) temperature.
Limitations of study
There were several limitations in this investigation alongside the main limitation of having no real-life experimental model for validation. The first key limitation was to do with PyroSim and FDS using only a rectilinear grid type. This created some challenges as the Venetian blinds with slat angle opening of 45° and 135° could not be meshed directly. This is because the grid did not match the edge, hence, saw tooth domains had to be created as a workaround which influenced the results obtained for those slat angle openings. The other limitation was that although bulk velocity distribution was considered in the simulation as an important fluid flow variable, the pressure distribution in the DSF cavity was not considered. This is because, in the present study, the emphasis was largely on investigating the façade peak temperatures reaching the glass breakage threshold and related implications. Future studies therefore can consider pressure distribution of the hot gases and its impacts on evacuation in the scenarios investigated. Also, influences from external environmental factors such as wind and solar radiation on the DSF system were ignored although in real life those are factors that cannot be ignored. 5 There were several other assumptions made that potentially influenced the results as well. For instance, air leakage from rooms and DSF system were not taken into consideration. The building was also assumed empty with no mechanical systems.
Conclusion
A numerical investigation of fire in the cavity of a multi-storey naturally ventilated DSF with Venetian blinds was carried out using Fire Dynamic Simulator (FDS). The results show that: • The bulk hot gas velocities in the DSF cavity zones were influenced by the slat angle opening and blind position. For the scenarios investigated, the maximum bulk hot gas velocities ranged between 7.5 m/s and 10 m/s. The maximum velocity of 10 m/s was observed when the slat angle was 45°and the blind position was 0.4 m away from the outer glazing. While the lowest maximum of 7.5 m/s in the range occurred when the slat angle was 135° and the blind was positioned closer to the inner glazing. • In the DSF without Venetian blinds, the fire was found to attach itself to the inner glazing due to Coanda effect with a significantly larger air entrainment gap at the bottom. The peak inner glazing surface temperatures obtained ranged between 468°C to 614°C. • Peak temperatures on the inner glazing surface, ranged between 283°C to 840°C, varying with the position of the thermocouple, the Venetian blind position and slat angle opening. Peak temperatures for TC 14, the closest thermocouple on the floor above the fire room, exceeded the glass breakage temperature of 600°C for all cases except when the Venetian blind was completely closed and placed 0.4 m away from the external glazing, indicating the fire risk levels of the immediate floor above the fire room for a fire of 5 MW HRR. • At a slat angle of 45°, the Venetian blind acted as a partial fire barrier allowing a small quantity of hot gases to move towards the outer glazing. At 0° slat angle, the Venetian blind completely blocked off the fire preventing it from influencing the surface temperature of the outer glazing on the assumption that the blind material was incombustible. In both cases there were significant surface temperature differences between the inner and outer glazing with the outer glazing surface remaining at significantly lower temperatures.
Overall, the simulation shows that the room immediately above the fire room is exposed to significant fire hazards in the event of a fire as the trajectory of the fire goes up due to the stack effect. For the same HRR, the Venetian blind position was found to influence the level of temperature increase within the cavity and on the surface of the inner glazing. While the slat angle opening influenced the path of the hot gas flow from Zone 1 to Zone 2 influencing the bulk hot gas velocity distribution in the DSF cavity.
In this, study the combustibility and flammability of various Venetian blind materials were not considered. It would be interesting to know how much influence the rate of combustibility and flammability of such materials will have on the spread of fire and smoke in the DSF; hence we recommend for future studies along with supporting experimental study.
Footnotes
Declaration of conflicting interests
The author(s) declared no potential conflicts of interest with respect to the research, authorship, and/or publication of this article.
Funding
The author(s) disclosed receipt of the following financial support for the research, authorship, and/or publication of this article: This work was supported by the Zhejiang Provincial Natural Science Foundation (Number LQ19E080004) and Science and Technology Innovation Program of College Students in Zhejiang Province (No.2019R428009).
Credit author statement
Huang Youxian: Investigation, Methodology, Writing-Original Draft, Validation. Yeboah, Siegfried: Conceptualization, Supervision, Visualization, Writing - Original Draft, Writing- Reviewing and Editing. Shao, Jingjing: Conceptualization, Writing- Reviewing and Editing, Validation, Funding acquisition.