
Abstract
Data-driven building operation and maintenance research such as metadata inference, fault detection and diagnosis, occupant-centric controls (OCCs), and non-invasive load monitoring have emerged (NILM) as independent domains of study. However, there are strong dependencies between these domains; for example, quality of metadata affects the usability of fault detection and diagnostics techniques. Further, faults in controls hardware and programs limit the performance of OCCs. To this end, a literature review was conducted to identify the dependencies between these domains of research. Additionally, real-world examples using operational data from three institutional buildings in Ottawa, Canada, were provided and discussed to demonstrate these dependencies. Finally, a holistic tool-agnostic workflow was introduced which suggested the implementation of operational energy efficiency measures in the following order to ensure their full potential: (1) improve metadata, (2) address faults, (3) implement OCCs, and (4) monitor enhanced key performance indicators (KPIs). The proposed workflow is intended to be comprehensive, reproducible, nonintrusive, and inexpensive to implement.
Keywords
Introduction
Achieving energy efficiency in buildings to reduce their ecological footprint has been a major area of research and development since the energy crisis in the 1970s. The building sector is recognized as one of the major energy consumers as commercial and residential buildings account for 29% of the total energy use and are responsible for 13% of greenhouse gas (GHG) emissions in the United States.1,2 Most of this energy is used in buildings during the operational phase of their lifecycle for heating, ventilation, and air conditioning (HVAC) purposes. 3 However, inefficient building operations are responsible for wasting as much as 30% of the energy used in buildings.4,5 Further, inefficient building operations increase system failures and compromise occupants’ comfort.6,7 Therefore, optimizing building operations to achieve efficiency has been the focus of building operation stakeholders for the last few decades.
Inefficiency in building operations can be attributed to various factors such as the lack of useful data from building energy management systems (BMSs), such as the building automation system (BAS) and computerized maintenance management system (CMMS), the occurrence of faults (i.e., soft and hard faults), the lack of efficient fault detection and diagnostics (FDD) techniques, and the absence of effective monitoring of energy flows and key performance indicators (KPIs). Therefore, building operation optimization should be approached by improving the quality of metadata, fixing faults, upgrading/improving sequences of operations, and improving or implementing advanced energy flow monitoring techniques and KPIs.
As building operations have become data-focused, there has been increasing emphasis on building operational metadata and its quality. Standardizing and improving metadata has been the focus of researchers (e.g., Balaji et al. 8 ), building operations professionals (e.g., Roth 9 ), and standard developers (e.g., Rasmussen et al., 10 W3C, 11 and Auer et al. 12 ). Standards for semantic metadata models are critical if building operation professionals are to improve building energy efficiency, as this standardization will allow for a more thorough understanding of sequences of operation while decreasing the time and cost associated with the identification and rectification of operational anomalies. In other words, standardized metadata serves as an enabling approach for building operation stakeholders as it lowers engineering costs and facilitates corrective actions and the deployment of smart building solutions.
On another front, HVAC control systems in commercial buildings consist of a large number of sensors and actuators which are often manually configured and commissioned upon building construction completion. These sensors and actuators are seldom recommissioned during operation which results in many faults that go undetected by building operations professionals. Additionally, point-by-point auditing/inspection of all sensors and actuators is a labor, cost, and time-intensive effort that is unreasonable and impractical at scale. Therefore, there have been many efforts focused on detecting and diagnosing hard and soft faults using operational data by introducing and implementing automated fault detection and diagnostics (AFDD) algorithms in BASs (e.g., Bruton et al., 13 Gunay and Shi, 14 Katipamula and Brambley, 4 Li et al. 15 ). The term “hard fault” refers to a physical issue with one or more of a system’s components (e.g., stuck dampers and failed actuators). The term “soft fault” refers mainly to a fault in the control logic or code used to operate these systems (e.g., typographical errors and erroneous implementation of sequences of operation).
HVAC systems in buildings might underperform for a number of reasons; a major culprit of this during operation is poor control sequences. 16 Therefore, improving sequences of operation by implementing sequences of operation for system-and zone-level equipment is another critical aspect for optimizing energy performance during building operation. So-called “high performance sequences of operation” have been the focus of documents such as ASHRAE Guideline 36 17 ; however, widespread adoption of such guidelines as industry standards has yet to be realized. 18 The next-generation sequences of operation will also focus on the use of occupant-centric control (OCC), which is one of the areas investigated in the ongoing International Energy Agency-Energy in Building and Communities (IEA-EBC) Annex 79. 19 These include upgrades to the sequences of operation such as adapting building ventilation, (e.g., Hobson et al. 20 ), temperature (e.g., Gunay et al. 21 ), and lighting (e.g., Gunay et al., 22 Park et al. 23 ) setpoints based on occupancy and occupant preference data to improve both building energy use and occupant comfort. 24
Another aspect of improving energy efficiency during operation is monitoring energy flows in buildings. Most of the commercial office building stock records bulk metered energy-use data (i.e., total electricity use or/and natural gas use) on a monthly basis for billing purposes, which is available to energy management professionals.25,26 A relatively small number of buildings have submetering infrastructure that provides information to energy management professionals about energy use by different end-use categories (e.g., lighting, plug-in equipment, boilers, chillers, fans, and pumps). Accessing such submetering data is of great importance for energy management professionals as it facilitates detecting energy-use anomalies (e.g., high energy use by hydronic perimeter heaters during cooling season, and cycling of equipment outside of scheduled hours). Load disaggregation using operational data from the BAS offers a low-cost and nonintrusive opportunistic tool for obtaining the benefits of submetering that includes understanding energy flows and monitoring energy performance in buildings.27,28 Load disaggregation can support energy management professionals in making informed operational decisions and consequently improve energy performance of buildings.
The different approaches for optimizing energy performance during operation are inter-dependent (see Figure 1). For example, performing FDD or AFDD, model predictive control (MPC), or load disaggregation requires high-quality metadata. For instance, Gunay et al.
29
identified the lack of publicly available data as one of obstacles for developing AFDD algorithms for HVAC systems. The proposed data-driven workflow for improving energy efficiency in buildings during operation.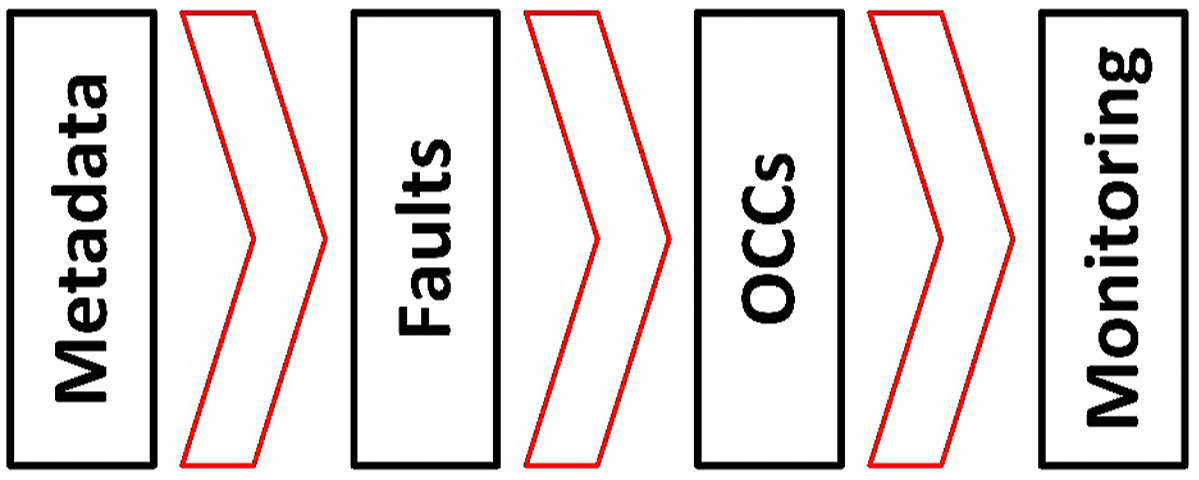
Reviewing relevant studies reveals that numerous efforts have been ongoing to increase energy efficiency by improving these different individual aspects of building operation. However, a holistic approach that considers all of these aspects and their inter-relationships represents a gap in the literature. To this end, the contribution of this paper is to address the gap in the literature by providing a holistic data-driven tool-agnostic workflow that addresses the various issues that impact the efficacy of building operations, including focusing on four main domains: metadata, hard and soft faults, OCCs, and monitoring energy flows. The paper also outlines the current challenges researchers and practitioners face with improving/optimizing the energy performance of buildings.
The proposed workflow
Although there have been many efforts aiming to improve energy efficiency and occupants’ comfort during operation, almost none of these efforts are holistic in a way that deals with all problematic aspects of inefficiencies in buildings. In this section, a comprehensive data-driven, tool-agnostic workflow that covers the four main aspects of improving energy performance in commercial buildings is introduced (see Figure 1). Broadly, this workflow consists of (1) addressing and improving metadata, (2) detecting and fixing hard and soft faults, (3) developing and implementing OCCs, and (4) monitoring energy flows and KPIs. This order is particularly important because of the interdependencies of each subsequent step on the preceding step(s). For example, faults may be difficult to detect if metadata quality is poor; the energy savings potential of OCCs may be diminished if faults cause unintended behaviors in operation of the HVAC system; and, the monitoring of energy flows may be challenging if baseline performance cannot be established. These challenges and barriers, amongst others, are presented first for each aspect, then recommendations for improvements are provided.
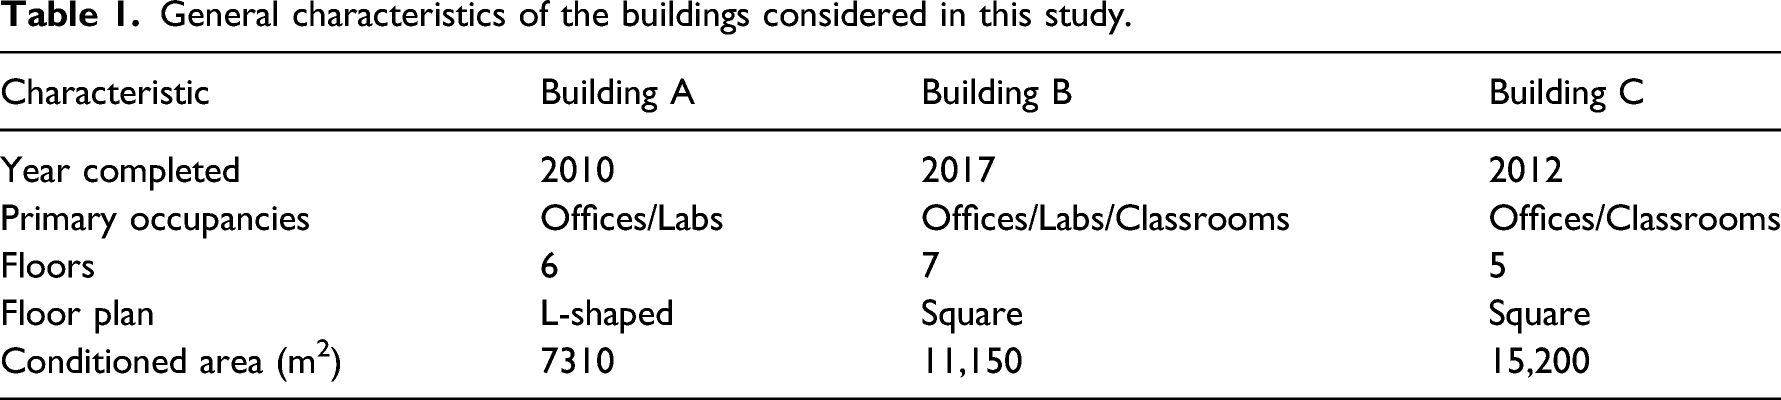
General characteristics of the buildings considered in this study.
Metadata
Challenges related to metadata
Examples of the different tags used to describe control points in the example buildings.
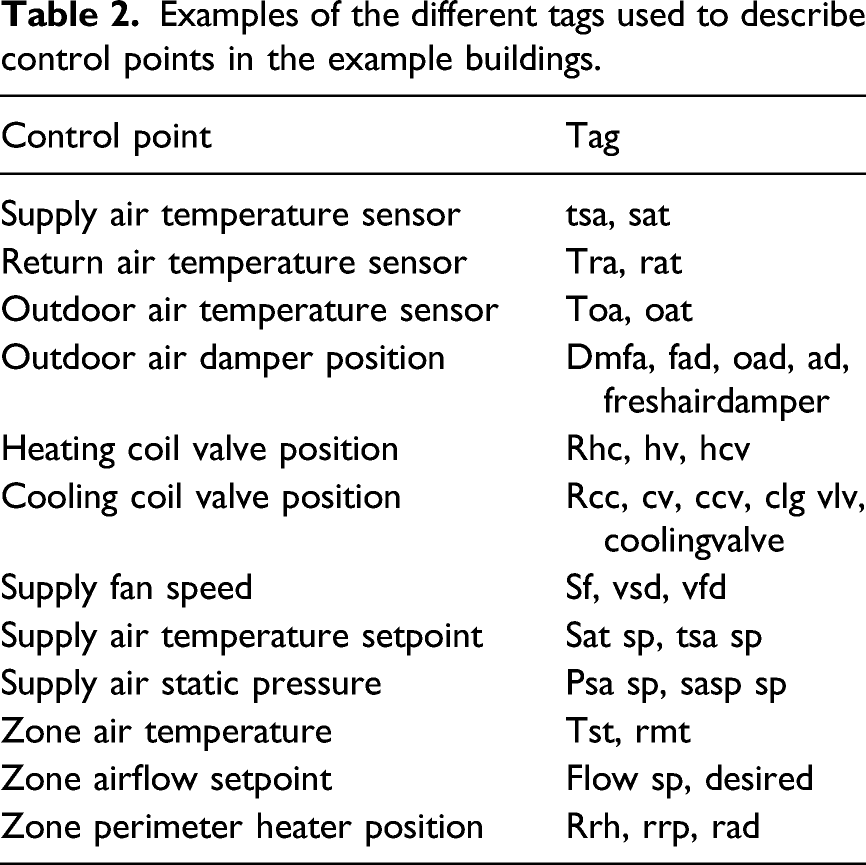
Although there have been several efforts to develop standardized practices for data point labeling, existing metadata typically does not follow any standard labeling and often follows unstructured building and vendor specific idioms. For example, Project Haystack, 36 a commonly-known standard for building metadata that uses semi-structured labels instead of unstructured labels, has been involved in the ASHRAE 223P effort to develop standardized tagging of buildings metadata. Other metadata ontologies, such as the Brick schema 8 and Industry Foundation Classes (IFC), 37 also represent efforts to standardize metadata. However, standards such as these are not without issues and have been criticized for lacking explicit class hierarchy, as well as an inability to balance consistency and composability.
Furthermore, several efforts have been deployed for extracting structure from unstructured metadata, a process known as metadata inference. These efforts include learning parsing rules of unstructured labels by leveraging semi-supervised learning approaches (e.g., Bhattacharya et al., 38 Koh et al. 39 ), examining historical timeseries data to classify sensors, actuators, and setpoints (e.g., Hong et al. 40 and Chen et al. 31 ), and combining label clustering and timeseries analysis (e.g., Balaji et al. 41 and Shi et al. 42 ). Consistent metadata requires a set of rules formalizing how metadata can be defined, structured, composed, and extended.
Preceding the implementation of predictive controls or FDD algorithms in a BAS, it is common practice to have an expert work on preparing data and interpreting the BAS from HVAC drawings and control schematics. 43 Although many efforts to improve metadata by developing semantic models44,45 are ongoing, the engineering costs for improving metadata for data analytics are still high; this is recognized as the main barrier for implementing smart building solutions in existing buildings.31,46
Methods to improve quality of metadata
Metadata associated with VAV airflow rate trend logs on a single floor of an institutional building in Ottawa, Canada.
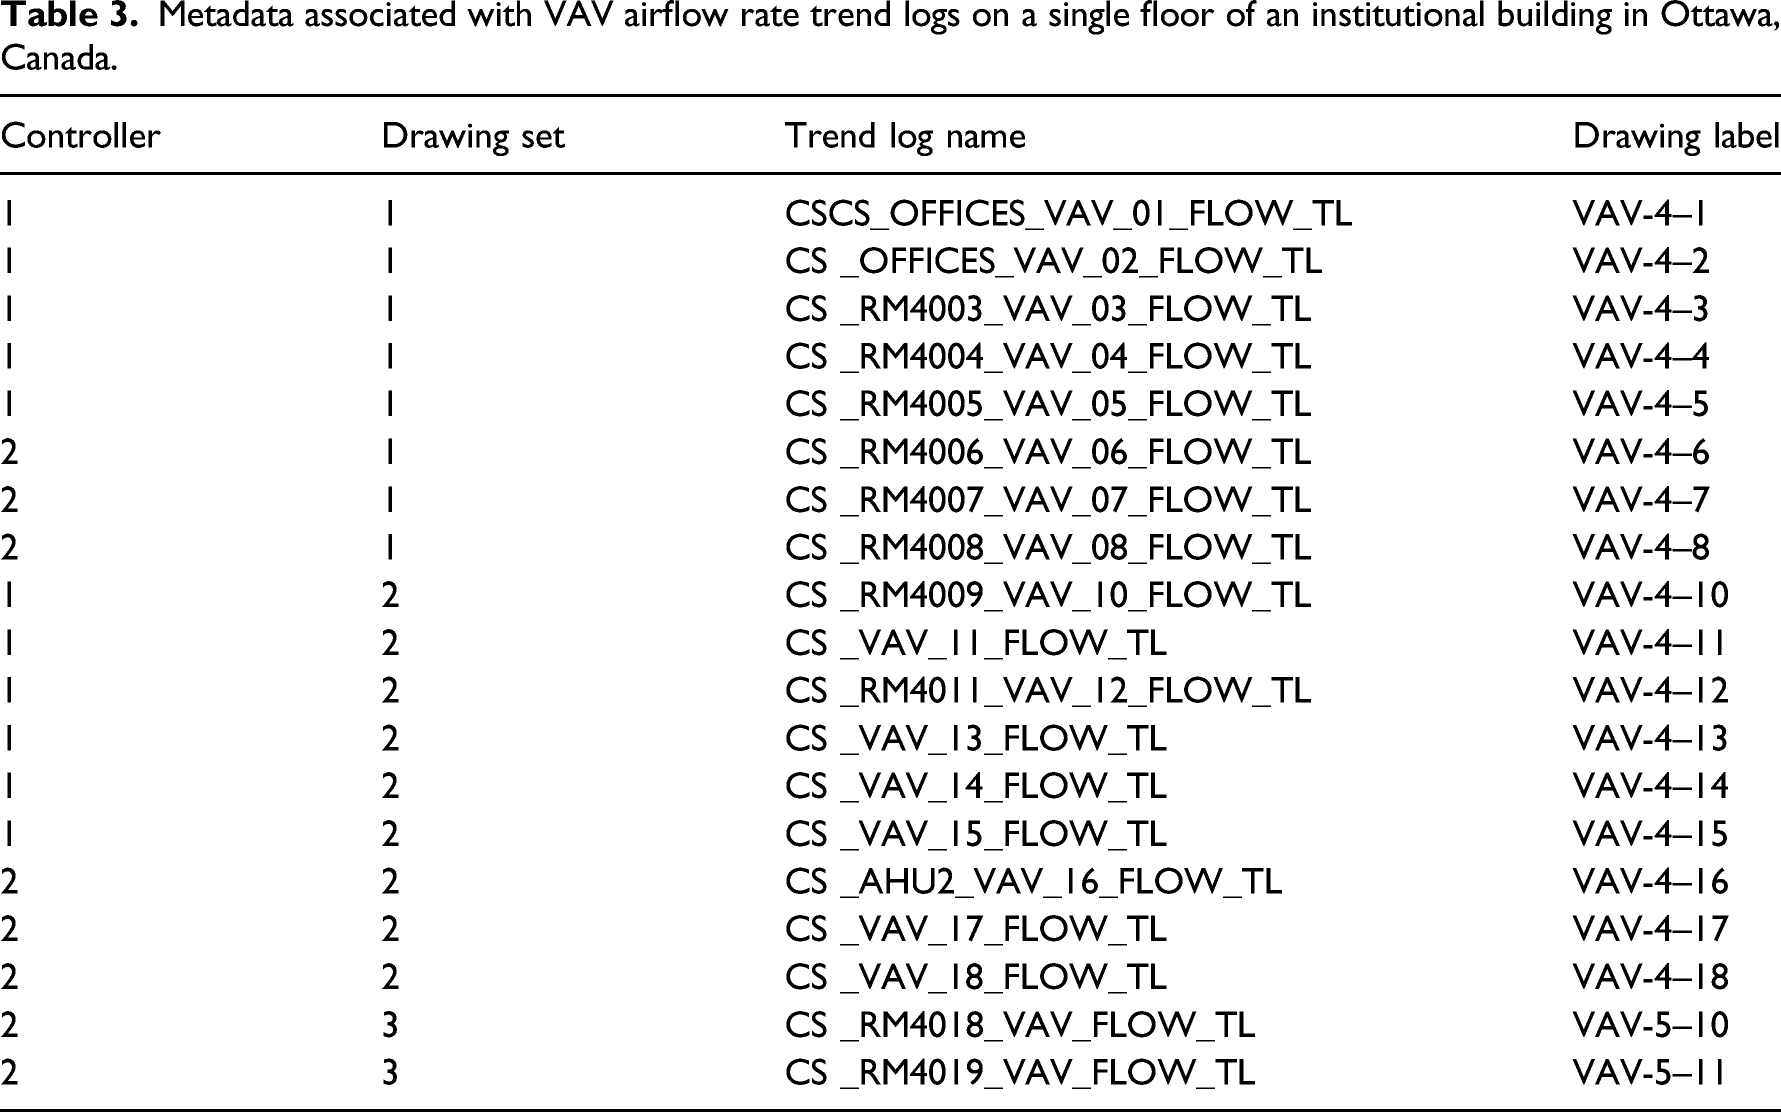
Observing semantic information in BAS data point labeling reveals that it can be classified into three different categories: data point labels with complete semantic information (i.e., labels with adequate number of descriptive tags explaining the point type, its location, and hierarchical relation to other systems), data point labels with partial semantic information, and data point labels with no semantic information. A data point label with complete semantic will have the structure that is consisting of the building name, system name, zone name, and BAS control point type. A study by Gunay et al. 25 examined metadata from 14 different office buildings and looked at 55,000 data points in BASs from different vendors. The analysis of their labels revealed that only 3% of the data points labels had semantic information that could be considered complete. These results are indicative of the quality of metadata that is available in existing buildings and highlights the need for improving this quality by implementing a standard ontology. Given the severity and widespread nature of this problem, improving metadata in existing buildings must leverage different inference techniques that are being developed by researchers.39,44,47 An example of these metadata inference methods is a method developed by Chen et al. 31 that includes classifying data point types from controllers based on their numerical features and identifying the functional relationships among these data points by grouping them using different matching strategies. While such metadata inference schemes are not perfect, they are a compelling alternative to the slow and costly expert-based manual methods that have been used to date and may be the only viable option if metadata in existing buildings is to be improved at scale.
Once metadata labeling is established, the preparation and cleaning of the trend log data is the next critical and time-consuming step in any data analytics approach for improving energy performance of buildings during operation. This includes eliminating stagnant values and outliers, identifying faulty sensors and actuators, correcting sensor drift or lag, shifting interdependent data to concurrent timesteps for analysis, and much more depending on the intended use. This is yet another obstacle to adopting/performing data-driven building energy improvements as it requires a specific kind of technical expertise which is often unavailable within traditional building operation teams and may require an external consultant; this can increase the engineering costs associated with improving metadata drastically.
Hard and soft faults
Common faults
Faults in building systems can be soft (e.g., programming related) or hard (e.g., failed devices/components) faults which affect energy use and compromise comfort. For example, a faulty temperature sensor (i.e., hard fault) might trigger under- or over-ventilation that can lead to thermal discomfort and compromise indoor air quality (IAQ), whereas a programming error in an AHUs operating schedule (i.e., soft fault) may cause operation and energy waste outside of operating hours. Due to the sheer number of sensors and actuators that are installed in modern buildings, many faults may go undetected. Sensors and actuators are configured and commissioned during installation and are rarely recommissioned during operation, which can allow some faults remain undetectable to operators until occupants complain or a point-by-point inspection is performed.
Hard or soft faults can occur at the system (e.g., AHU) or zone (e.g., VAV terminal units, perimeter hydronic units) level in various forms, see Figure 2. Zone-level faults are typically more difficult to detect as they often do not have an extensive impact that can be seen on the whole building or system, unless they cause severe comfort conditions that trigger complaints from occupants.
48
Conversely, system-level faults affect several zones or the entire building and are comparatively more likely to be detected.
49
Types and levels of HVAC control faults.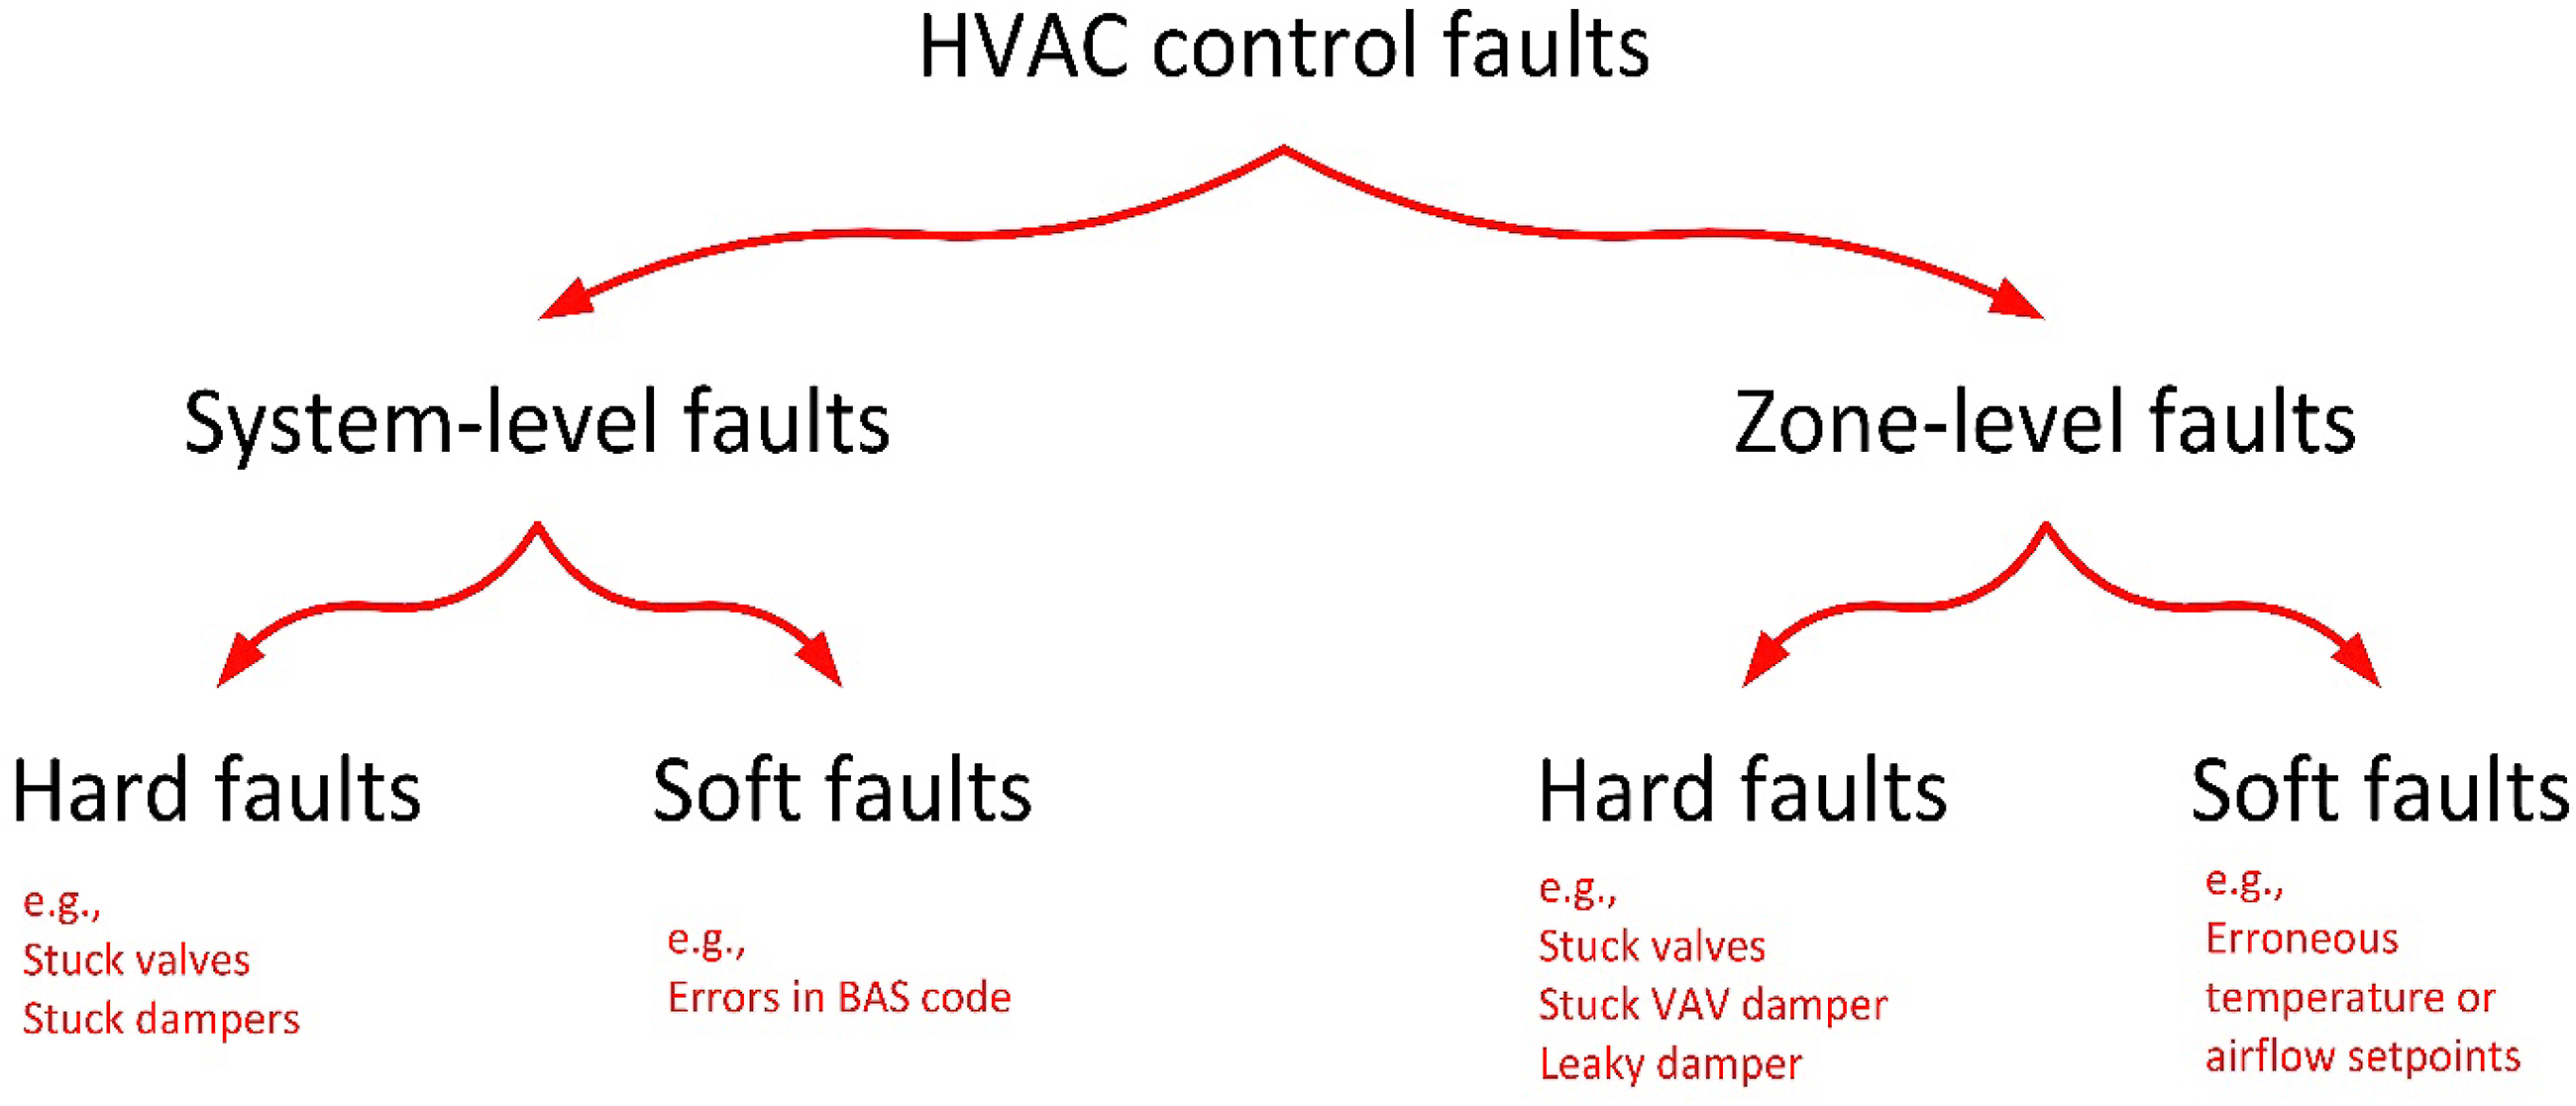
Soft faults are faults in the programming logic of BASs which may cause components to function inappropriately or not function as intended. These faults are relatively common and yet typically difficult to detect. Hard faults refer to faults that happens when system hardware such as sensors, dampers, actuators, or valves fail either partially or in totality. Both hard and soft faults are possible at the system and/or zone level. Common system-level hard faults in forced air AHU-VAV systems include, but are not limited to, issues with cooling coils, heating coils, and mixing, outdoor, and exhaust air dampers. Common zone-level hard faults could be issues with VAV terminal unit dampers or perimeter hydronic heater valves. Zone-level sensors can also experience hard faults, such as the inadvertent wiring of motion detectors incorrectly which can lead to a reversal of the binary occupancy output (i.e., 0 and 1, typically corresponding to vacant and occupied, respectively, would then correspond to occupied and vacant, respectively), for example. In building A, eight of the 98 motion detectors were installed in such a fashion. An example of the impact this has on the sensor data can be seen in Figure 3, where an occupant briefly retrieving something from their office on a Monday during reading week (i.e., a holiday period where the institution was closed) was output as vacancy, while the Sunday and Tuesday of this week—including the overnight periods—were considered to be constantly occupied. On the other hand, system-level soft faults can include faulty economizer operation logic, simultaneous heating and cooling, AHU heating coil use during economizer operation, and erroneous supply air temperature and pressure resets, while soft faults at zone-level can include inappropriate indoor temperature and airflow control logic errors, amongst others. Motion detector wiring resulting in reversed occupied/vacant signals.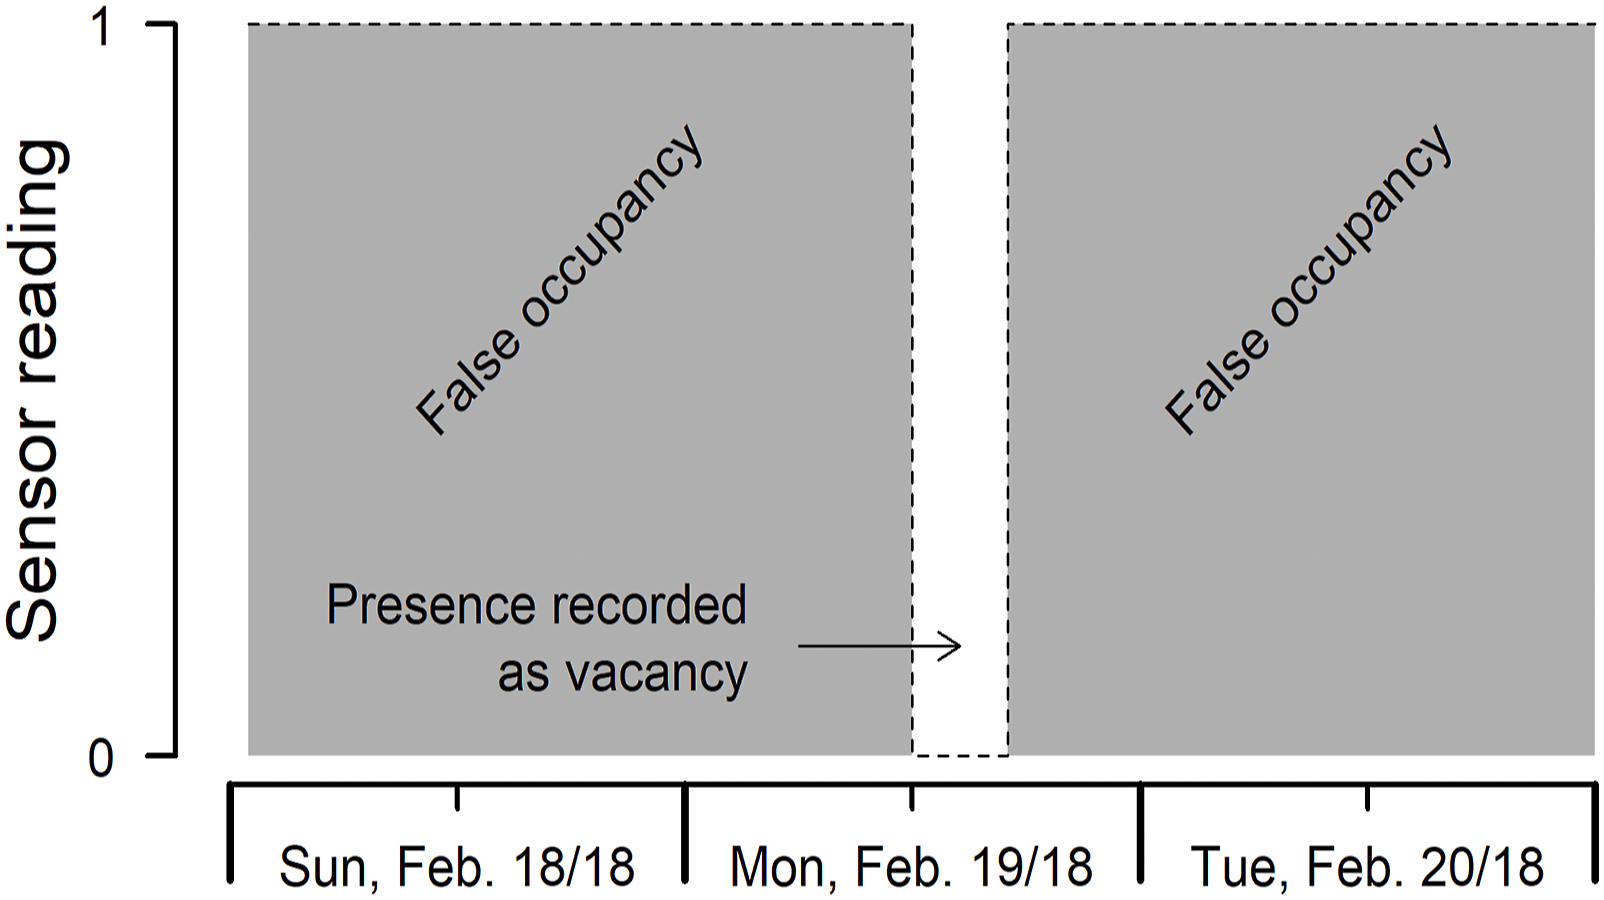
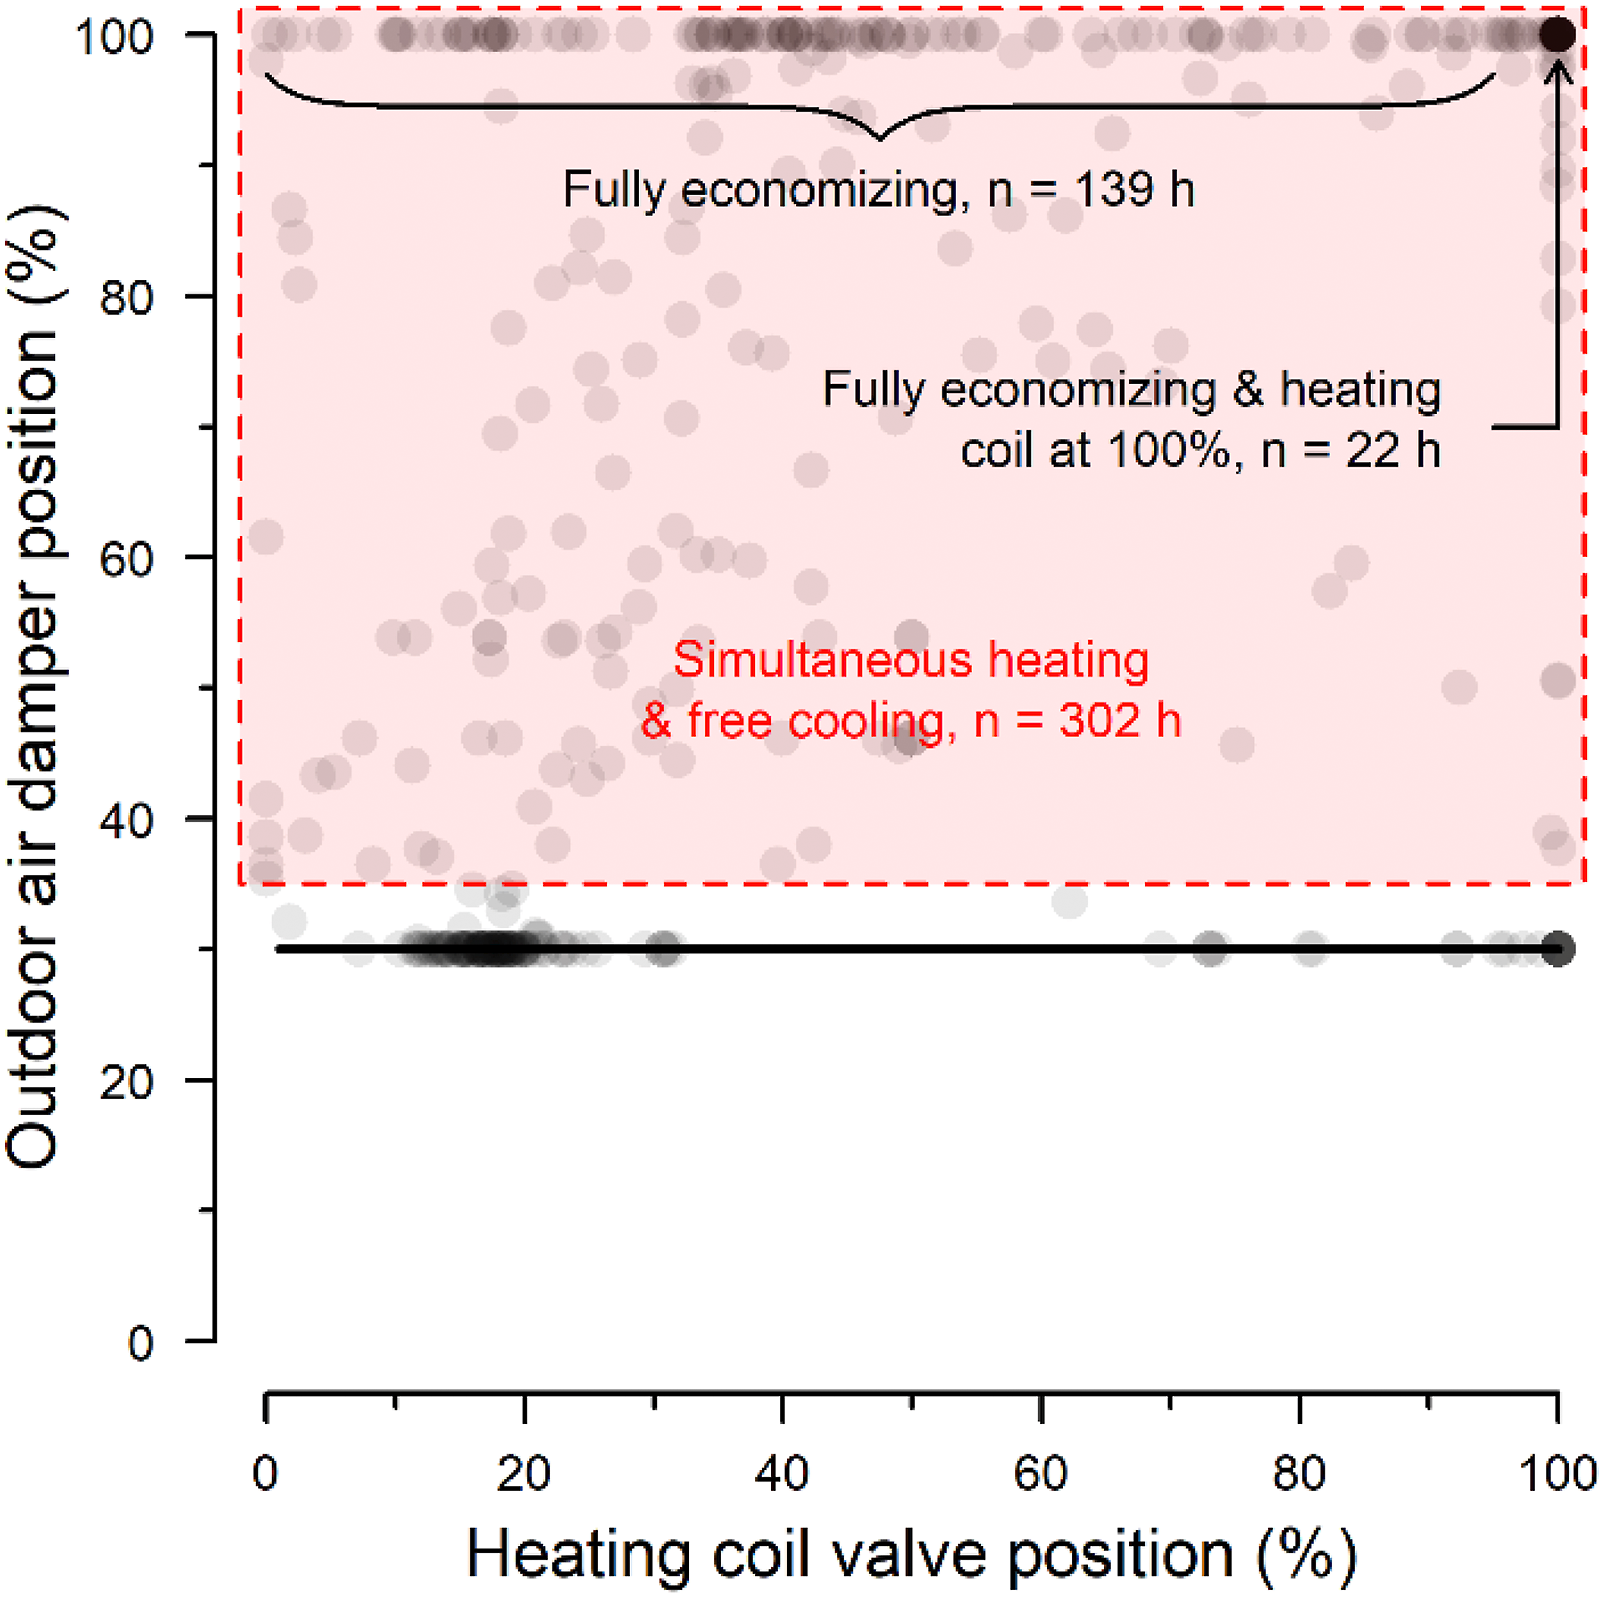
An example of the consequences of an AHU programming soft fault which occurred in building B can be seen in Figures 4 and 5. No lower temperature limit for economizer operation was imposed which led the AHU to enter free cooling (and even fully economize) during extremely low outdoor air temperatures in the heating season, see Figure 4. With no lockout for the economizer during heating, the heating coil operated continuously (and at times 100% capacity) to heat the large volume of cold outdoor air admitted, see Figure 5. Such soft faults are energy intensive and can lead to system failures (e.g., freezing of the heating coil, which later occurred in this building before this soft fault was corrected). An example of excessive economizing during heating season caused by a soft fault in the AHUs programming. Heating coil valve versus outdoor air damper position during the heating season indicating that the heating coil was often on during economizer operation.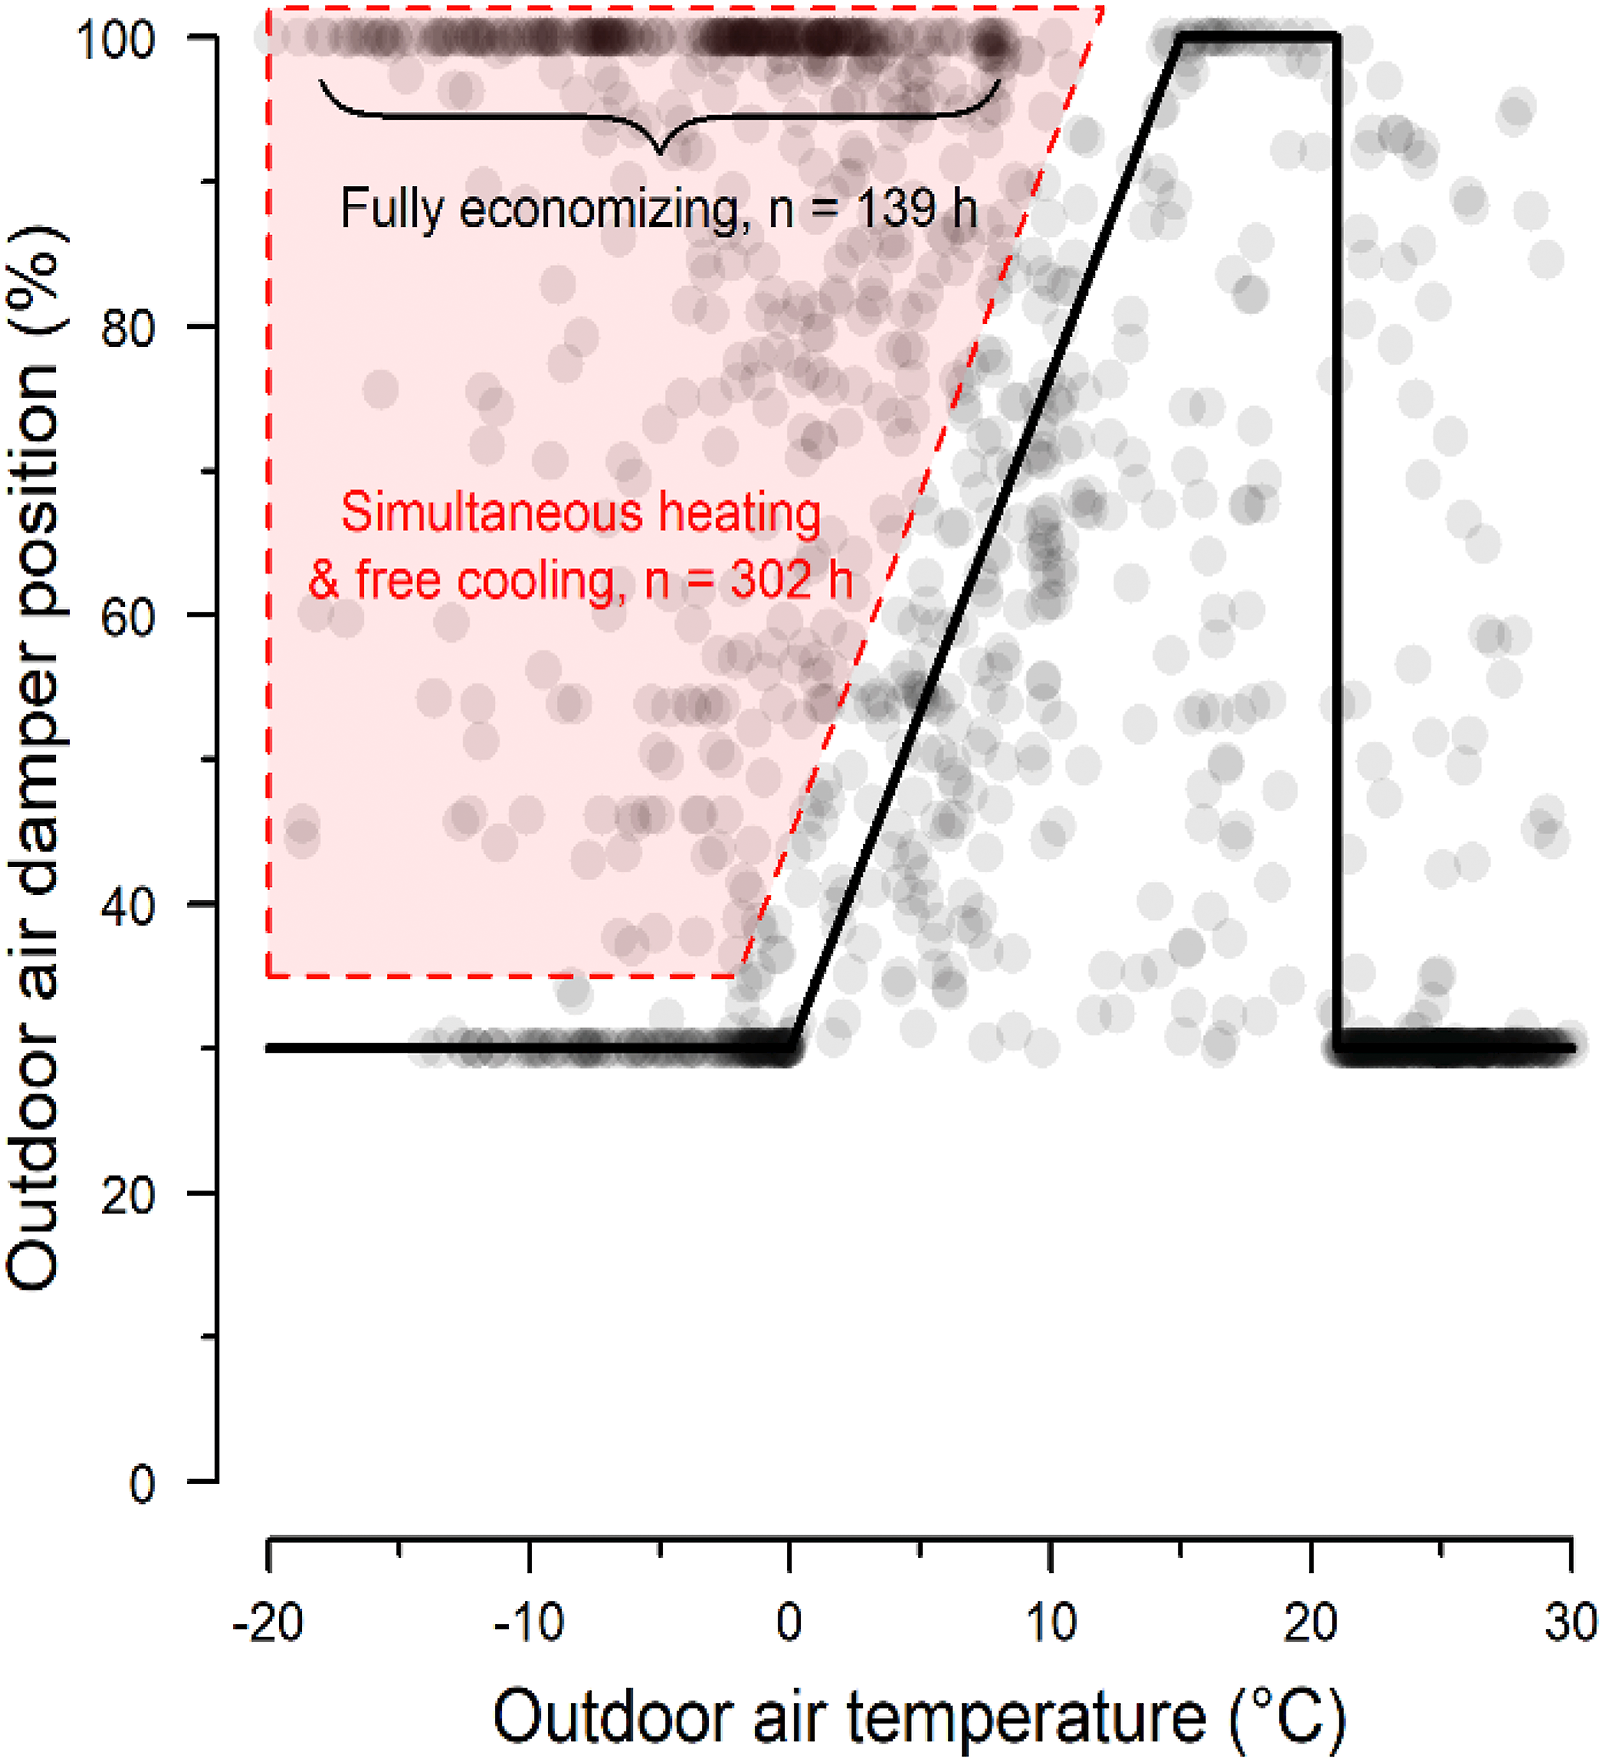
An example of a hard fault which occurred in building C is demonstrated in Figure 6; in this case, a heating coil valve in an AHU was broken. The hard fault was initially detected from data where a poor correlation (i.e., a coefficient of determination (R2) of 0.21) was found between the reported heating coil valve position and the difference between the mixed air temperature (TMA) and the supply air temperature (TSA) in the AHU, indicating almost no temperature rise across the heating coil (i.e., the minimal temperature rise observed in Figure 6 can be attributed to the heat generated by the in-stream supply fan motor). A scatter plot indicating the correlation between the heating coil valve position versus the difference between TSA and TMA.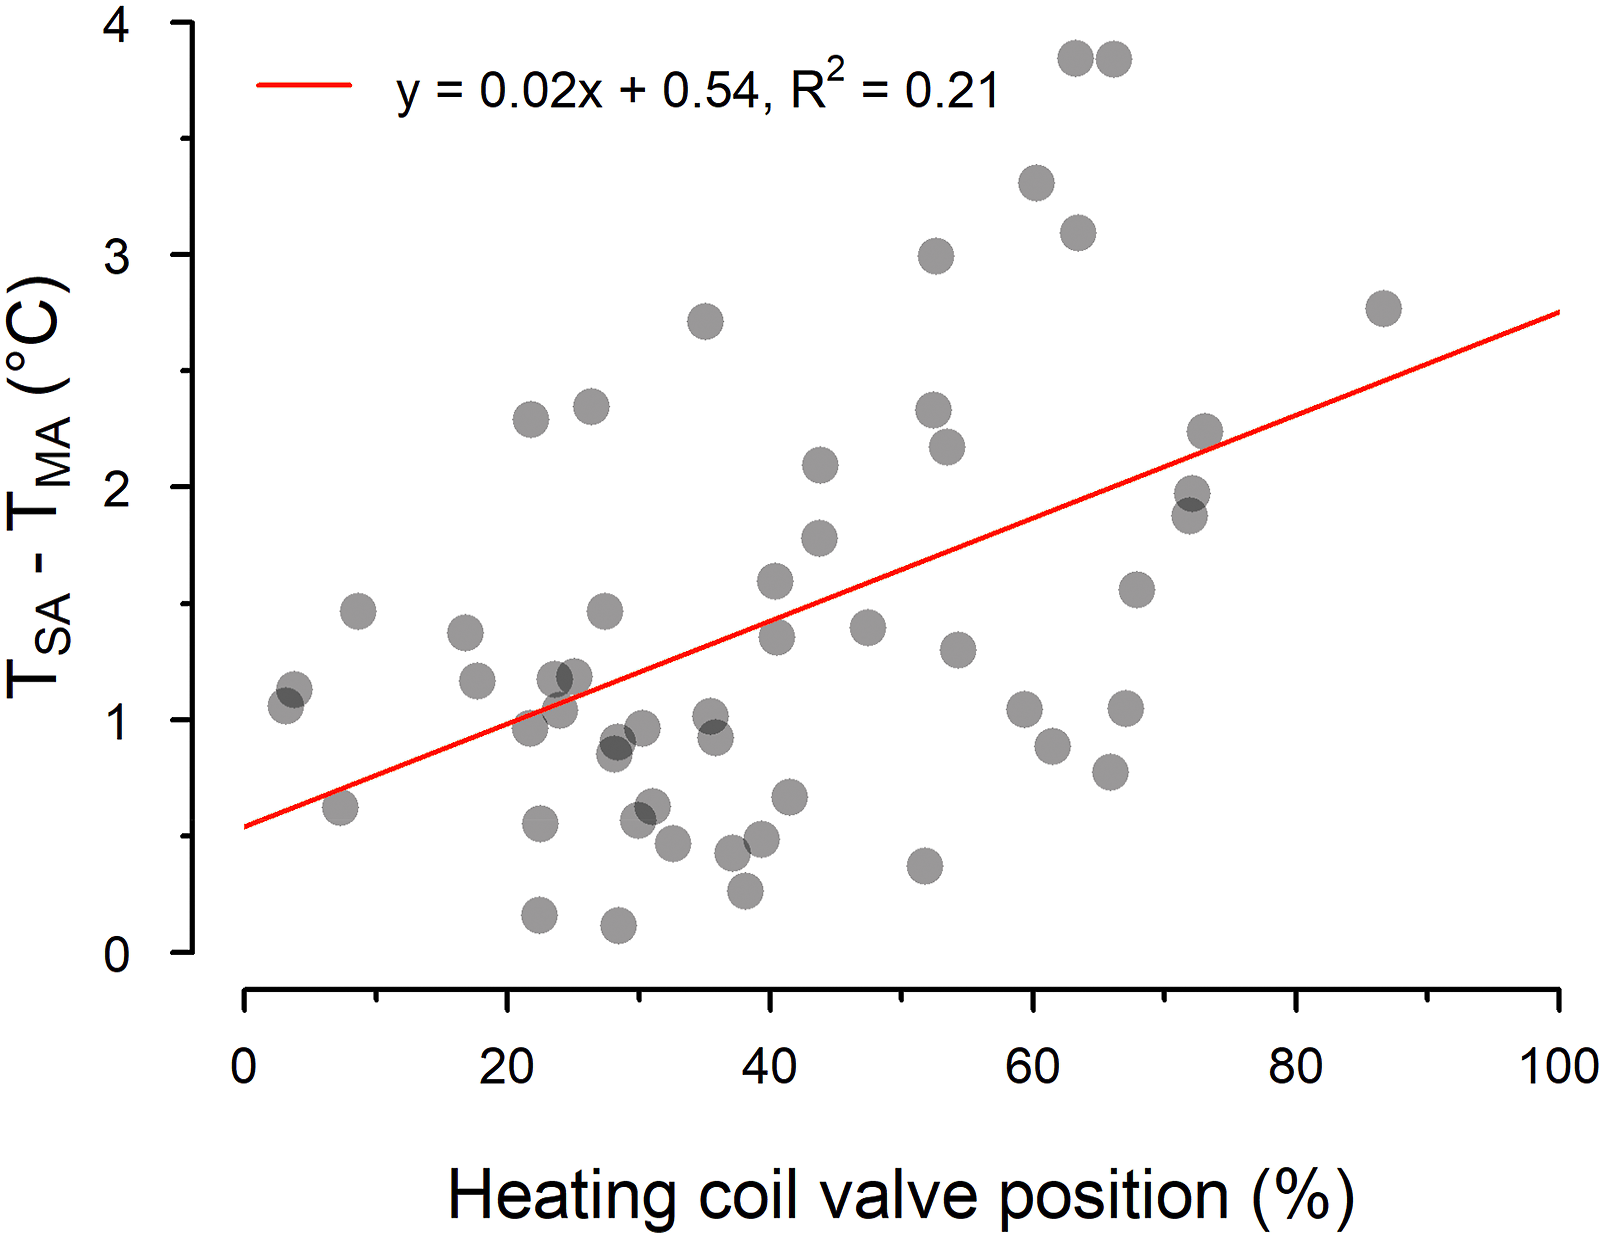
Methods to address common faults
To handle faults in building systems, researchers have developed different methods for FDD. Several AFDD algorithms and approaches have been developed that rely on operational data. These algorithms and techniques have shown promise in their ability to detect faults proactively rather than reactively. AFDD methods for building HVAC systems can be grouped into three broad categories: qualitative (rules-based), quantitative (i.e., whitebox and physics-based), and process history-based methods. However, these AFDD algorithms are not widely implemented in buildings which leaves many faults undetected and jeopardize building performance.
Given the complexity and the energy and comfort implications of the presence of the previously discussed faults, detecting and fixing these faults requires high-quality and high-resolution metadata. Typically, the cost of AFDD is driven by the costs of data preparation due to the poor quality of existing metadata. With standardized and intuitive metadata labeling, the cost of implementing AFDD would be much lower as laborious and time-consuming manual data preparation would not be necessary. 25 This highlights that improving energy efficiency during operation requires a holistic workflow that takes into account these dependencies.
To improve energy efficiency and decrease/minimize discomfort complaints, fixing hard and soft faults at the system and zone level is an essential step that needs to be taken. Techniques like inverse modeling of heat and mass flow and cluster analysis are useful for detecting and diagnosing faults (e.g., Refs [14,50,51]).
Occupant-centric controls
Implementing faulty sequencing logic for HVAC operations is a common cause of inefficient building operation in terms of energy and comfort (e.g., Wang, Mathew and Pang, 52 Zhang and Bannister, 53 Gunay et al., 54 Shea, Kissock and Selvacanabady, 55 Hobson et al. 20 ). Although inappropriate sequencing of operations is common, the attention given to this topic by researchers and building operation stakeholders is disproportionally low. Common inappropriate sequences of operation include, but are not limited to, poor supply air temperature control (e.g., static or suboptimal reset schemes), inappropriate temperature setpoints, inappropriate use of the economizer cycle, and inappropriate scheduling (e.g., hours of operations). 56 For example, Shea, Kissock, and Selvacanabady 55 investigated 12 AHUs of university buildings in Dayton, Ohio, USA, and were able to achieve 19% savings in electricity use by decreasing the supply air pressure, 35% decrease in energy use by adjusting operation schedules, and 17% decrease in cooling energy use by correcting the settings of the economizer cycle.
Next-generation sequences of operations
Typically, building equipment is operated based on preset schedules and setpoints for parameters such as indoor air temperature, outdoor airflow rates, or artificial lighting levels, regardless of occupants’ presence or preferences. This traditional way of controlling the indoor environment might lead to excessive energy use and decreased occupant comfort. For example, Gunay et al. 54 conducted a review of setpoints and operation schedules in 14 governmental office buildings in Ottawa, Canada. The results indicated that a constant year-round temperature setpoint of 22°C was implemented with no seasonal switch over. Additionally, the study reported that 60% of the AHUs were operated continuously without any setbacks during weekends or unoccupied hours.
While lighting controls have some degree of adaptability to occupancy (i.e., lighting off with vacancy detection using motion sensors), studies such as Gilani et al. 57 and Gilani and O’Brien 58 have highlighted the benefit of increased granularity of lighting control tailored to individual occupants’ preferences (e.g., 30% and 60% reduction in artificial lighting load when going from zone-level vacancy off to workstation-level vacancy off, respectively).
It is common practice in building operations to set the zone-level equipment (i.e., VAV terminal unit) airflow to a minimum airflow rate of 30%–50% to ensure adequate ventilation for acceptable IAQ (e.g., ASHRAE 62.1 59 ) for fully occupied zones. 60 At the system level (i.e., AHU), maintaining an outdoor air damper at a constant minimum position of 10%–40% during the peak of the heating and cooling seasons is a common practice to maintain the minimum outdoor air requirement for acceptable IAQ for a fully occupied building. 61 While most buildings are operated based on the assumption of full occupancy, many field studies have provided evidence that actual occupancy of commercial buildings rarely exceeds 50% of the full occupancy (e.g., Refs [62–64]). This is similar to lighting, where several studies (e.g., Refs [65–68]) have shown that occupants’ preferred illuminance setpoints (i.e., the threshold whereby occupants no longer desire additional lighting) are often below the thresholds specified in documents such as ASHRAE 90.1 69 or building codes, resulting in excessive artificial lighting and energy use.
Overall, building automation and scheduling is heavily based on conservative assumptions.70,71 These conservative assumptions at the system and zone level can diminish energy savings and compromise building energy performance. 66 Therefore, next-generation sequences of operation such as occupant-centric control (OCC) offer significant potential for improving sequences of operation and achieving improvements in energy performance if building operations can be automated to adapt to occupants’ presence and preferences. Although OCC has been around for almost two decades, it has not gained momentum until recently with advances of sensing infrastructure and data collection techniques.
Examples of OCC include the tuning of ventilation rates and equipment schedules to suit occupancy at the zone and building level, as well as adapting lighting to occupants’ preferences. The tuning of building-level ventilation can be achieved by deploying adaptive technologies such as demand-controlled ventilation (DCV). DCV is implemented by tweaking the HVAC system program in a way that regulates the intake of outdoor air to be proportionate to the building’s real-time occupancy. 72 Real-time occupancy can be estimated by several sensing technologies such as motion detectors, or carbon dioxide (CO2) concentration can be used as a proxy for occupancy.73,74 DCV increases energy savings by avoiding the unnecessary conditioning of outdoor air, which accounts for a significant portion of the HVAC load in heating and cooling dominated climates. 75 Zone-level ventilation can be tuned to real-time occupancy by implementing occupancy-based VAV control. Occupancy-based VAV control enhances energy savings by regulating the distribution of ventilation across a building’s zones in a way that assists in eliminating the discomfort and inefficiencies that result from the over-ventilation of under-occupied zones, and under-ventilation of over-occupied zones.76,77 Lighting can be adapted to occupant presence using motion detectors at various levels of granularity, with high energy savings generally possible as the sensor grid density increases. 57 Online learning algorithms can be deployed in controllers to passively inferring occupants’ preferred illuminance setpoints in real time (e.g., Gunay et al. 22 ); occupants’ preferences can also be learned actively by explicitly asking occupants using enabling technologies such as mobile applications or wearables (e.g., Jayathissa et al., 78 Sood et al., 79 Konis et al. 80 ). Similar passive or active approaches can also be applied to occupants’ preferred temperature setpoints where HVAC infrastructure allows individual control (i.e., single occupant and single VAV zones). Schedules for system-level equipment can be adapted based on the earliest arrival times and the latest departure times of occupants, while zone-level schedules can be based on similar arrivals and departures, with the added benefit of the ability to account for occupants’ breaks. 71
It is important to note that the implementation of OCC cannot be achieved successfully without first undertaking the previously mentioned metadata and fault correction portions of the workflow. For example, consider a system-level implementation of DCV that requires modulation of AHU(s) outdoor air damper(s) (e.g., Hobson et al.
20
). Such an OCC can significantly lower heating and cooling energy in the heating and cooling seasons, respectively, as the operating states (OSs)
17
that use a minimum outdoor air damper position (i.e., the constant position maintained in OS#1 and OS#4) can be lowered based on a building’s estimated occupancy, see Figure 7. However, if a soft fault exists in the AHU programming that causes the economizer to operate continuously during the heating season, or an operational inefficiency such as an excessively low economizer low-limit is used (i.e., a long-tailed OS#2, see Figure 7), the unit will never switch to the minimum position mode, meaning that simultaneous heating and cooling can occur, and the conditions will never be satisfied for OCC to take effect. This problem was encountered when implementing OCC in building A. OA damper positions when sequences of operation and OCC have been implemented properly, is functioning properly, compared to when an excessive economizer low-limit is present.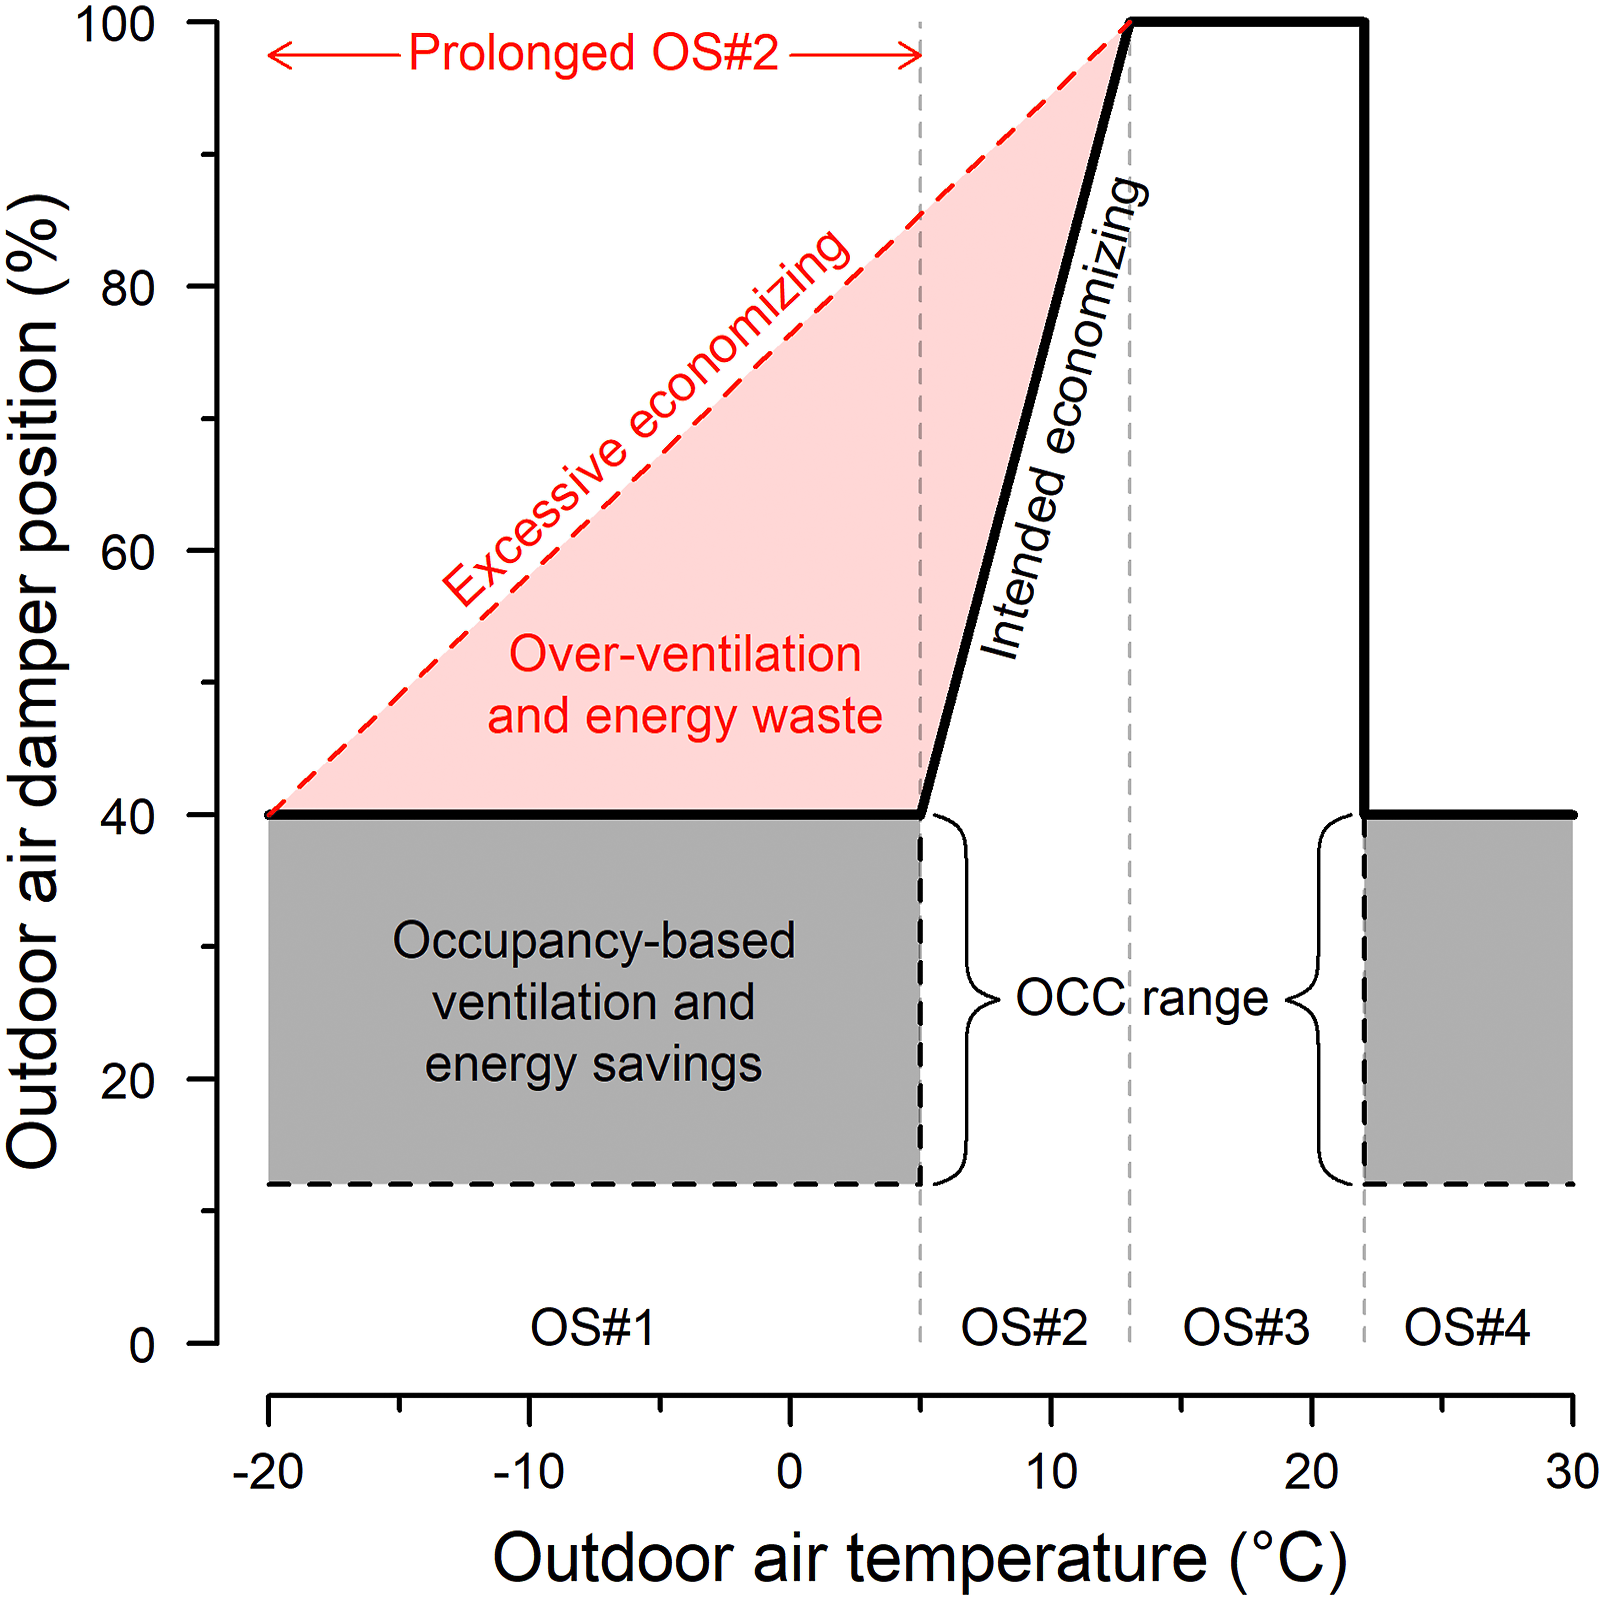
Monitoring
Common challenges with performance monitoring
One of the major challenges regarding monitoring energy flows in existing commercial buildings is the lack of submetering data that breaks down energy end-use categories (e.g., heating, cooling, lighting energy, fans, and pumps) or per space (e.g., floor, subset of zones, or zone-level).25,26 Tracking and understanding energy end-uses in buildings is fundamental to energy management processes and ultimately achieving performance targets. 28 However, installing submetering infrastructure in existing buildings is still considered a barrier due to the associated costs and feasibility.
The most common data type that is available in commercial buildings is bulk metered electrical and/or natural gas data. Although bulk metering has uses for evaluating the overall energy performance of buildings, it does not provide enough insights about potential excessive or anomalous energy use by subcategories or space (e.g., excessive fan energy use due to inappropriate scheduling and occupants using space heaters in certain zones).
Recently, some codes and standards have begun recognizing the importance of reporting energy use by subcategories. For instance, ASHRAE 90.1 69 now recommends submetering energy use for HVAC, lighting, and plug-in equipment in buildings with floor areas larger than 2500 m2. LEED V4 BD + C offers additional points for submetering energy uses that equal or exceed 10% of the buildings total annual energy use. 81 Other building certifications such as BREEAM, BOMA Best 3, Green Globes EB, and Well v2 promote operational data collection by specifying it as a prerequisite or by granting credits for implementation. 82 However, these requirements do not apply to existing buildings (i.e., the majority of the building stock), which continue to rely largely on bulk metering of energy resulting in missed opportunities to address operational issues that might affect energy use and occupants’ comfort.
Energy flows and load disaggregation
An emerging non-invasive method has been investigated by researchers that would fill in the gap in energy submetering infrastructure and enable energy flow monitoring by energy management practitioners. Load disaggregation techniques offer a significant opportunity to use untapped BAS data to estimate energy end-uses. There have been many efforts dedicated to developing methods for load disaggregation in low-rise residential buildings (e.g., Refs [83,84]). Conversely, load disaggregation in commercial buildings is uniquely challenging due to the curse of dimensionality (i.e., the sheer volume of sensors and data in commercial buildings compared to low-rise residential buildings) and has matured at a comparatively slower rate.
Various studies investigated load disaggregation in commercial buildings. For example, Batra et al. 85 conducted a study to disaggregate bulk electricity use of a campus building to highlight the differences between commercial and residential buildings in terms of energy use in order to demonstrate the importance of load disaggregation in commercial buildings. Shao et al. 86 conducted a study using temporal data of the state of electric devices to map energy use patterns by different devices in commercial buildings. Norford and Leeb, 87 Rogriguez et al., 88 Doherty and Trenbath, 89 and Rafsanjani et al. 90 also introduced different techniques for electric load disaggregation in commercial buildings.
Load disaggregation in commercial buildings is performed by applying algorithms that disaggregate total loads into energy end-uses using BAS trend data and bulk metering data. Examples of trend data are perimeter heaters valves, AHU heating/cooling coil valves, and AHU supply air pressure data. Bulk metering data includes heating meters, cooling meters, and electricity meters. Trend data contains information about the operating state of each energy-using equipment—at any given time there will only be a subset of heating coil or reheat coil valves that will be open. Unique combinations related to their use over many timesteps offer insights into their individual contribution to a bulk energy meter’s reading. Figure 8 presents a conceptual workflow of load disaggregation using energy meters data and trend data from BAS. Load disaggregation conceptual workflow.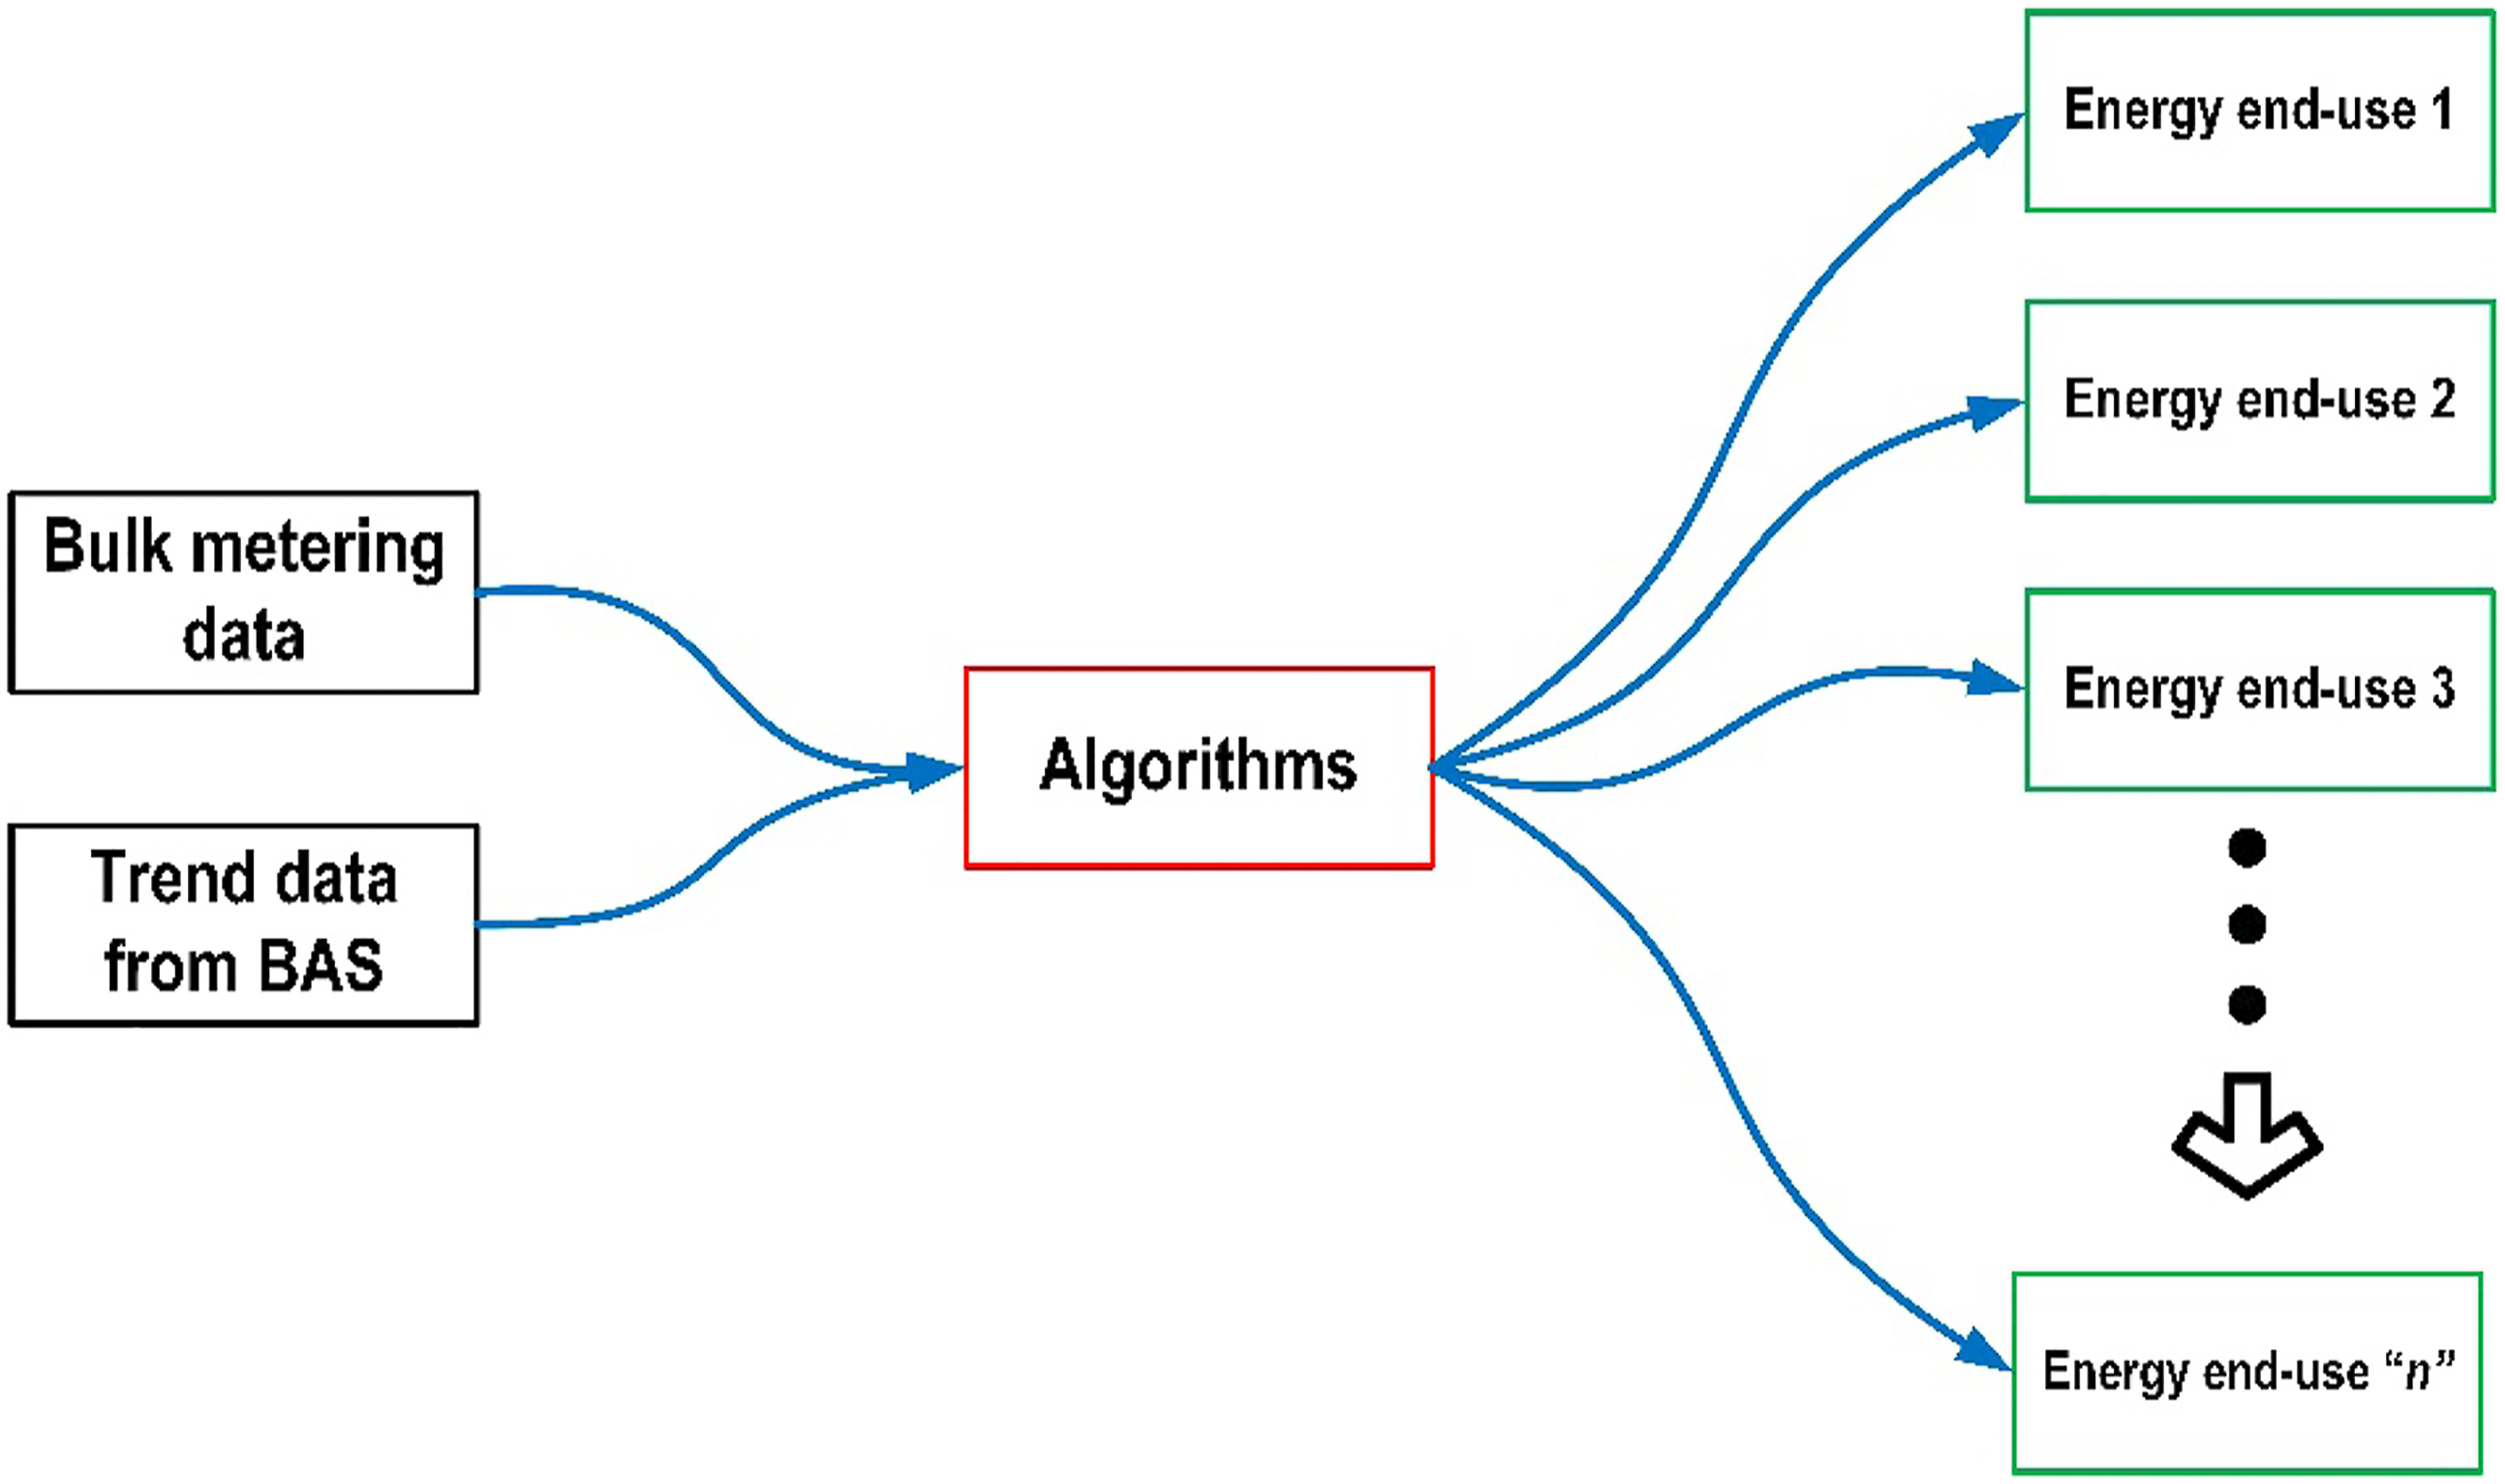
Figure 9 shows an example of disaggregated bulk metered steam data from building C for five business days. The bulk steam data were disaggregated into heating coil energy, perimeter heater energy, and domestic hot water (DHW) energy use. The results in Figure 9 indicated that there is an excessive proportion of energy use by perimeter heaters, which indicates that perimeter heaters are used as the primary (and sometimes only) heating equipment in many instances; this is an issue with the way the building is operated. An excessively low supply air temperature setpoint was identified to be the cause of this energy-use anomaly. An example of disaggregating bulk metering data into subcategories using data from an institutional building.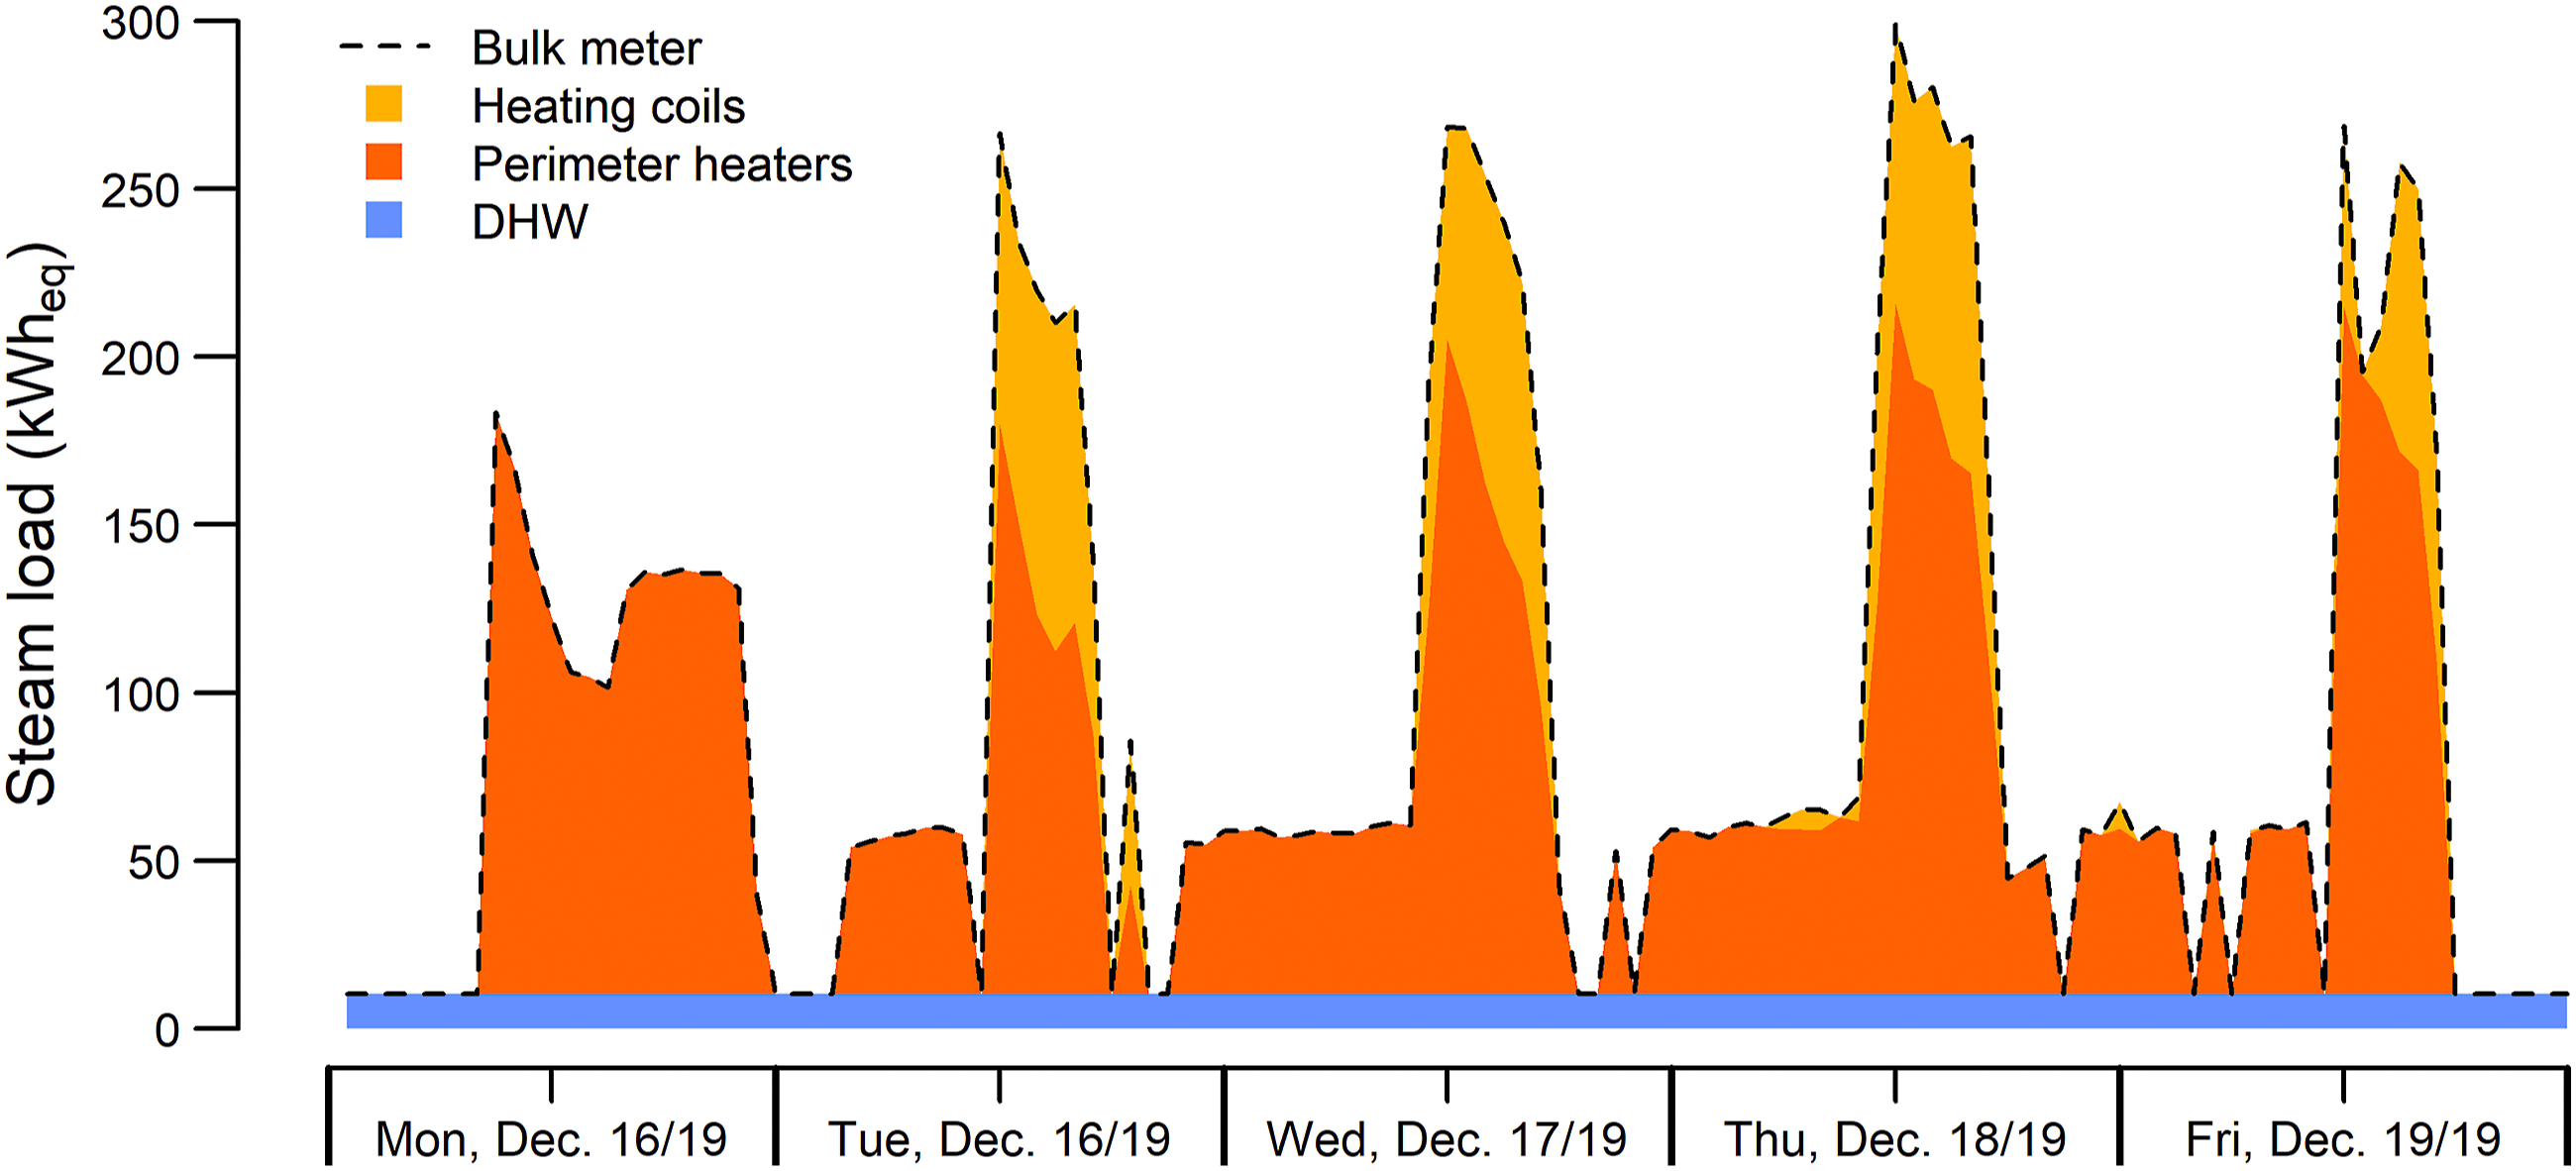
Enhanced key performance indicators
On another front, energy management professionals typically rely on standard key performance indicators (KPIs) such as total energy use, total electricity use, total natural gas use, and energy use intensity (EUI) to monitor the energy performance of buildings. Although these KPIs can provide high-level insights into the energy performance of a building or portfolio, they do not highlight performance issues in particular systems that might go undetected and compromise energy performance. For example, a lack of available information about energy end-uses might cause issues such as excessive after-hours HVAC energy use and excessive perimeter heater energy use during the heating season to be overlooked. Therefore, monitoring a wider range of useful KPIs that can concisely evaluate the performance of zone-level equipment would enable energy management professionals in commercial buildings to more comprehensively monitoring energy flows and detect energy use anomalies.
It is also worth noting that load disaggregation in commercial buildings relies heavily on the availability and the quality of data used. This brings us back to the importance of improving and standardizing metadata. Poorly labeled data with inadequate temporal and spatial resolutions can become a barrier for performing effective load disaggregation and, consequently, calculating useful KPIs.
Conclusions and recommendations
In this paper, a tool-agnostic data-driven building energy management workflow was outlined based on a literature review and anecdotes from three institutional buildings. The workflow was developed based on the results of a multi-stakeholder research project that aims to develop and introduce next-generation actionable building energy performance metrics, data analytics, and visualization. The workflow includes four major steps: (1) improving metadata, (2) correcting hard and soft faults, (3) implementing next-generation sequences of operation and OCC, and (4) monitoring energy flows and enhanced KPIs. This paper suggests that a holistic approach that addresses the different inefficiencies in building operation is required. Addressing individual issues in building operations (e.g., fixing hard faults only) might result in marginal improvements to building performance, while more significant opportunities may be missed if hierarchical dependencies among metadata, hard and soft faults, OCC, and continuous high-resolution energy performance monitoring are overlooked. Metadata quality plays an important role on the cost-effective deployment of AFDD algorithms at scale, and it is essential for end-use disaggregation algorithms which are needed for continuous high-resolution energy performance monitoring. The presence of hard faults affects the detectability of programming logic faults, and the presence of programming logic (i.e., soft) faults hinder the potential of OCC. In this paper, these dependencies were demonstrated with illustrative examples from three institutional buildings and examples from the literature.
The operation of buildings is an inherently risk-averse activity given both the implications operations have on indoor environmental quality (i.e., the mental and physical health of occupants) and the contractual obligations operators and/or energy managers may have to the building owners. 91 Given the invasive nature of many of the proposed interventions, researchers must demonstrate to operations stakeholders that such actions can generate tangible energy savings and comfort improvements. One low-risk method by which this may be achieved is by the use of data-driven software tools that use real operational data to generate insights into these interdependent domains of research, such as that employed by Markus et al. 92 Further research should also be dedicated to the use of building performance simulation (i.e., virtual clones/digital twins93,94) as another low-risk means to evaluate the proposed workflow and quantify energy and comfort implications.
Footnotes
Declaration of conflicting interests
The author(s) declared no potential conflicts of interest with respect to the research, authorship, and/or publication of this article.
Funding
The author(s) disclosed receipt of the following financial support for the research, authorship, and/or publication of this article: This research is supported by research funding provided by Natural Resources Canada, CopperTree Analytics, Sensible Building Science, Delta Controls, Bentall GreenOak, and National Research Council Canada.