
Abstract
Occupant behaviour is a key factor in the energy consumption and performance of a building. However, it is difficult to model and simulate hence there is often a mismatch between the predicted and actual performance of a new or refurbished buildings and surprising variations in the consumptions of similar and identical buildings. Although environmental conditions affect people significantly, there are also non-environmental factors including how well employers manage people and how well dwelling occupants understand their controls. Rarely are these factors considered in building performance, especially commercial buildings. Poor management can lead to varying degrees of occupant maladaptation. Maladaptation taken here to mean behaviour patterns that are detrimental to the optimal functioning of the building. This paper proposes a novel concept for designers that examines the worst possible energy performance gap (“extreme” scenario testing) where the theoretical occupants do their best to make the building consume as much energy as possible. The novel concept is called “maxmaladaptation”. By considering maxmaladaptation, designers can attempt to reduce it, so reducing the energy gap. This paper briefly reviews the energy gap and social psychology and its contribution to understanding energy consumption with some examples, underlying the concept of maxmaladaptation.
Introduction
Simple models are often used to establish that a building complies with Building Regulations1–3 with set occupancy patterns and set loads to consider. So there is often a performance, energy gap as when in use the building will most likely have a different occupancy pattern and “unregulated loads” (not required in the compliance model) such as computers etc. This results in non-domestic buildings having typically energy consumptions 1.5 to 5 times greater than the simple design for regulation compliance. 4 However, detailed simulation used for design where unregulated loads and expected occupancy patterns can be included, also often shows a wide discrepancy with the actual building energy use.
A paper in 2016 revealed that the area-normalised annual energy consumptions of 76 new low energy houses had a ratio of almost seven times between the best and worst. 5 A similar study of low energy non-domestic buildings 6 showed similar variations in energy consumption. The recent CIBSE TM61, Operational performance of buildings, confirms similar discrepancies and that these are a cause for major concern. 7
Buildings are complex and “influenced by a large number of independent and interdependent variables, making it difficult to achieve an accurate representation of real-world building energy in-use. 8 ”A recent state of the art review on occupant behaviour and energy efficiency in residential and commercial buildings 9 concluded that occupant behaviour has a significant impact. It further stated that the impact was difficult to quantify and that factors influencing behaviour are complex. Other studies confirm the influence of occupant behaviour.10–12
The role of tenant–landlord conflict has been considered as an additional potential cause of the energy gap. 13 Added to which the “rebound effect” (where occupants of low energy dwellings use more energy than predicted) or a “prebound effect”, where occupants of refurbished dwellings use less energy than predicted further complicates matters. Using a comparison of dynamic thermal models and measurements in “synthetically” occupied test houses gave small performance gaps 14 showing that the basic physics of the thermal models was sound. Although the basic physics of simulation is sound, Imam et al. 15 suggest that a contribution to the energy gap could be due to poor use of the software by designers. It has been suggested that simulations should produce a distribution of energy consumptions to account for the variability in actual use 16 and stochastic models used to generate random, non-repeating occupancy profiles.17,18
A major development in the modelling of occupant behaviour has come from the International Energy Agency (IEA) Annex 66, Definition and Simulation of Occupant Behavior in Buildings 19 , 20 producing a methodology and tools to guide occupant behaviour (OB) modelling in simulation. Figure 1, from an Annex 66 paper 21 shows the complexity of occupant feedback and identifies the “psychological” loop. It does not investigate it in depth.
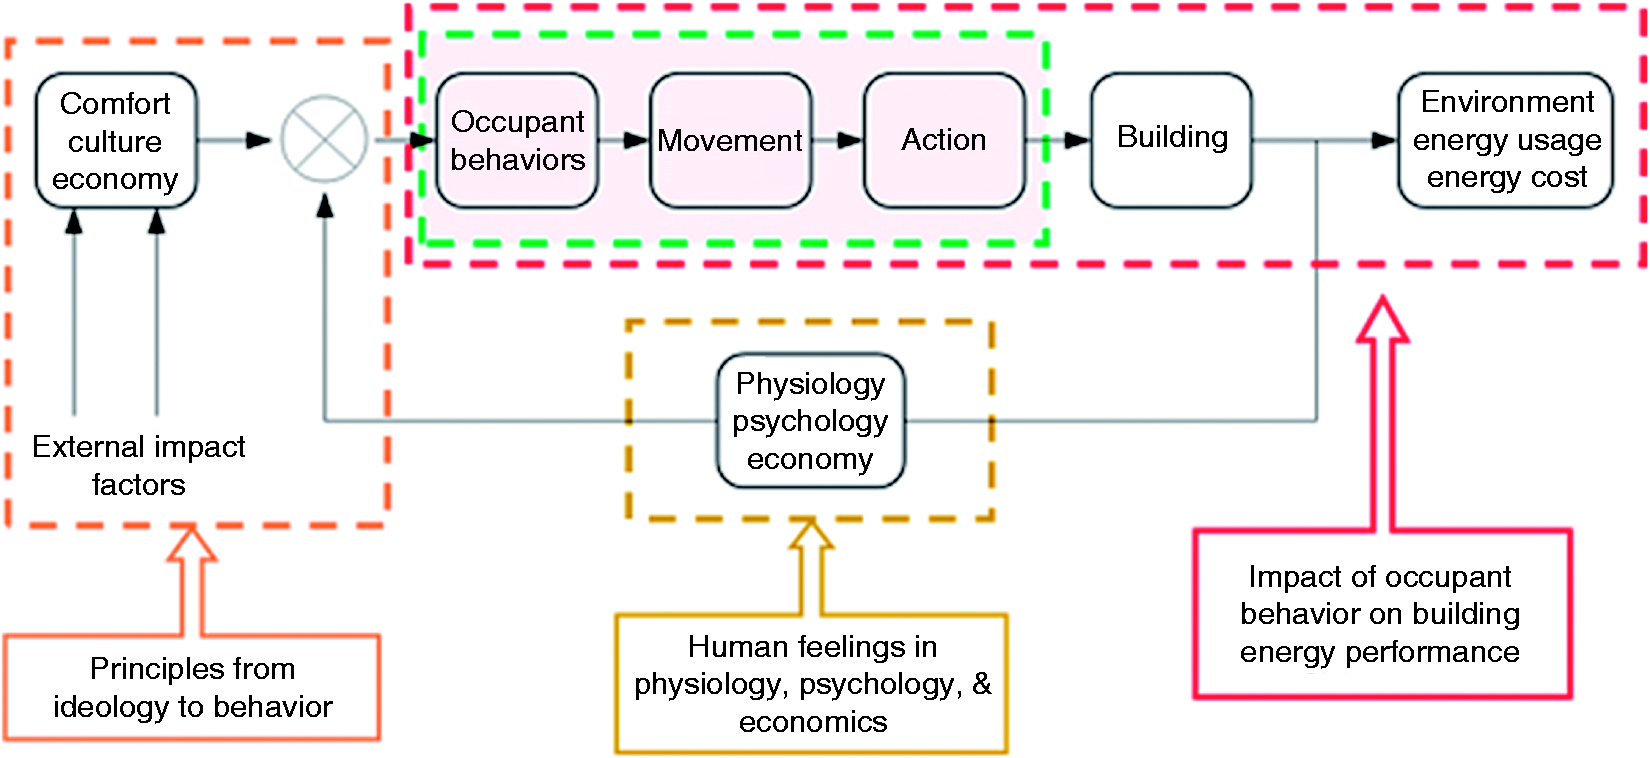
Relationship between occupants and buildings. 21
However good the simulation it is still difficult to model occupants not “behaving” as they are “supposed to” in newly built dwellings, 22 remembering that “buildings don’t use energy, people do”. 23 The new ASHRAE Handbook 24 confirms this difficulty saying, “the functionalities of modelling occupant behaviour and HVAC controls among simulation tools are generally inconsistent and lack flexibility”.
D’Oca equates the human factor to be as significant as the technological advances in buildings but states that the “human dimension” is not well understood and often ignored or simplified 25 ”
This paper examines the influences of the occupant human factor, proposing a novel method to assess the maximum, theoretical, worst impact on building energy consumption. Knowing these should be an incentive to designers and stakeholders to avoid.
The human factor
The basis for understanding the human factor lies in social psychology which has its roots in examining efficient industrial production. A significant researcher was Elton Mayo whose work contributed to the start of scientific social psychology.
Between 1924 and 1932 Mayo examined the Hawthorne Works in the USA. 26 , 27 Here productivity was low in the assembly of telephone coils and relays; small intricate work. Mayo and his researchers, prompted by the lighting industry, justifiably considered that the lighting level might need improvement. In the early part of his study Mayo set up two groups of workers. For one group the lighting was changed (the variable group) whereas for the other group, the lighting was not changed (control group).
When the lighting for the variable group increased so did the productivity. It also increased when the level was reduced! Interestingly, the productivity of the control group had also increased in line with the variable group. The “human factor” was present, i.e. humans are not “machine-like” in their work but social beings. Also the two groups were interactive and talked to each other. The study continued over many years with other assessments and also extensive interviewing of the 21,000 staff members at the site to gain greater understanding of the “Hawthorne Effect”. 28 One example was of an interviewee reporting how poor the canteen food was. The interviewer noted this down, making no comment. The following week the interviewee thanked the interviewer for having a word with the cook as the food that week had been a great improvement. The interviewer had not spoken to the cook. The fact that the interviewer had listened was important
Mayo considered that the efficiency of industry cannot be weighed solely in terms of the amount of goods it produces or its financial profits, but should also consider the cost of human health and happiness in producing these goods.
Mayo’s work was and is influential but some researchers have questioned the methodology of the studies. Levitt and List, 29 re analysed this early data and questioned some of the findings. However, this related to the early Hawthorne work and as with other critical reviews, looked at the early work and ignored the extensive later work. 29 The “Hawthorne researchers increasingly recognized the importance of grasping the “total situation” of the workers both on and off the job and their “sentiments”–their emotional life, cultural values and personal aspirations 22 ”. The Hawthorne work far outweighs its limitations because of its positive effect. 30
The Hawthorne studies showed the importance of the human factor whereas F W Taylor, 31 the father of time and motion study, considered that the right conditions, the right people and the right equipment would give 100% of the expected output.
For further work on occupant productivity and the indoor environment see Jamrozik and Clements, 32 and Al Horr et al. 33 Social psychology related to buildings (the social cognitive theory, the theory of planned behaviour, the drivers-needs-actions-systems (DNAS)) is discussed by D’Oca et al. 34 and Stevenson. 12
Examples of the influence of the occupant human factor in energy consumption
In the Hawthorne work the importance of listening to people in the work place has been clearly shown. The author of this paper has observed this importance in a new lighting installation. Efficient high intensity discharge, HID, lamps had been used to replace less efficient fluorescent lamps in a half-cylindrical Nissen hut workshop. Unfortunately the new lighting scheme was poor although more efficient. The small workforce went on strike. The shop steward was very forceful in his condemnation of the lighting. A more diffusing HID lamp would make a very small improvement. New lamps were installed under the watchful eye of the shop steward and his colleagues. The shop steward said the new lighting “was a 100% improvement”. The strike was called off. The poor lighting situation had hardly been improved but action had been seen to have been taken in response to the complaint. This resonates with Mayo’s work. However, the HID lighting intervention did not increase the productivity but reduced it; the workers went on strike. An example of justifiable maladaptation.
Gas consumptions at identical buildings
A similar resonance to Mayo’s work relates to the work on energy conservation in a London Borough. A number of different energy conservation measures were conducted on nine children’s homes of identical design and identical gas central heating systems. The exercise was to see which conservation measures would save most energy. 35
Two homes had thermostatic radiator valves (TRVs) installed, two had extra loft insulation (LI), two had the wall cavities filled with insulation (CF) and three had nothing done. All homes had the heating controls set correctly with reduced night heating (RNH). The normalised annual gas heating consumptions before and after the measures are shown in Figure 2. The variation in savings and consumptions is striking, the best consumption being 30% lower than the worst. There is no obvious measure that saves most energy. Two of the best savings were in homes where there were no measures, except the reduced night heating that all had.
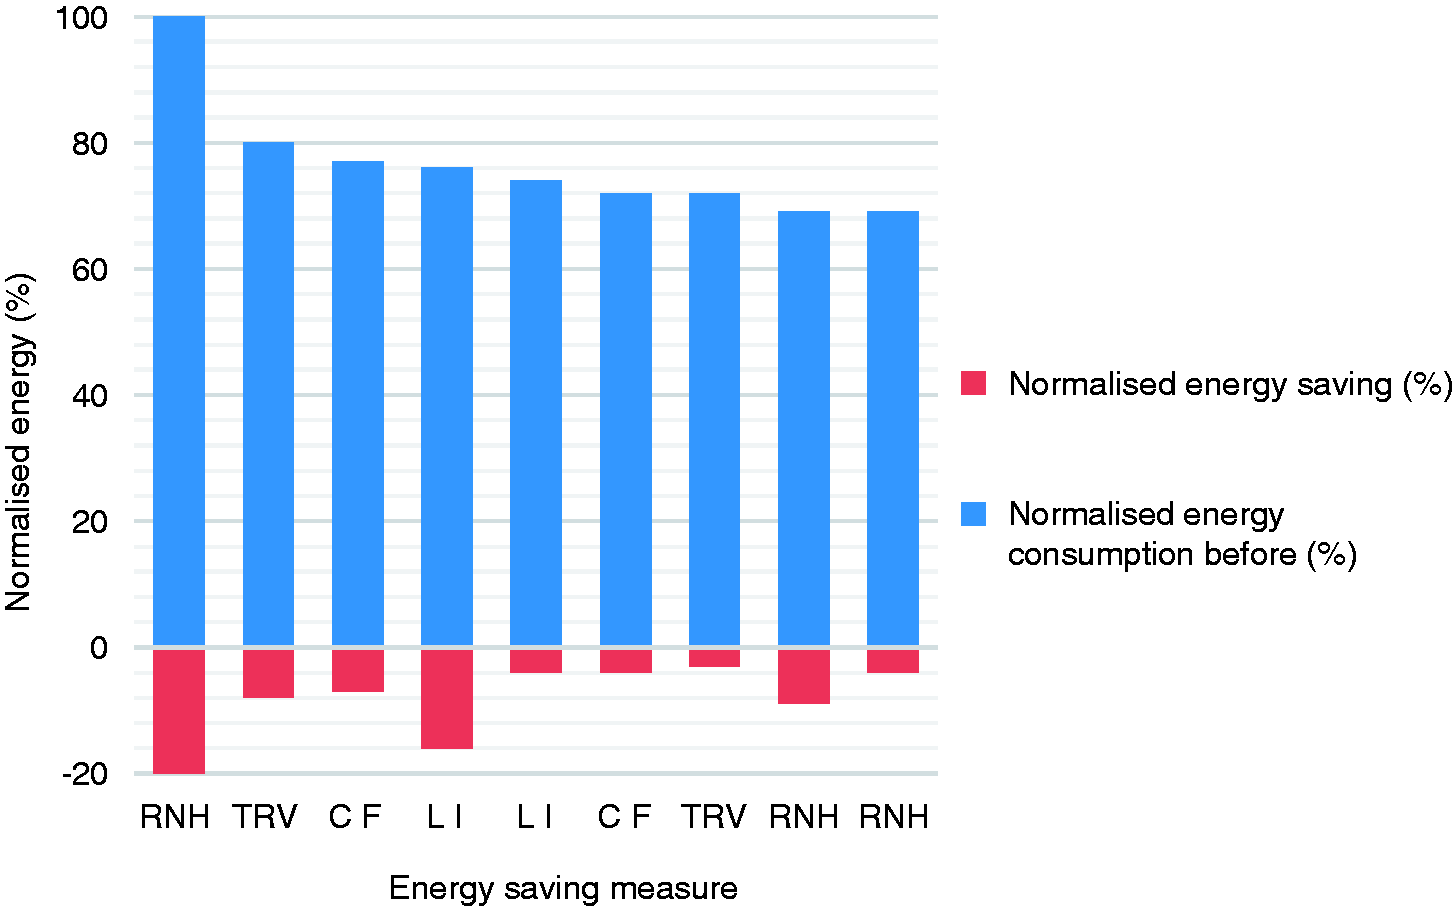
Normalised annual heating energy consumptions of 9 children’s homes of identical design before and after energy conserving measures were made. RNH = reduced night heating only, TRV = thermostatic radiator valves, LI = loft insulation, CF.
Electricity consumptions at identical buildings
The electricity consumptions of six of the identical homes were measured before and after the above heating measures to save gas. Figure 3 shows the wide variation in electrical consumptions. Significantly all the homes saved substantial amounts of electricity although nothing had been done to the electrical systems! Another Hawthorne resonance.
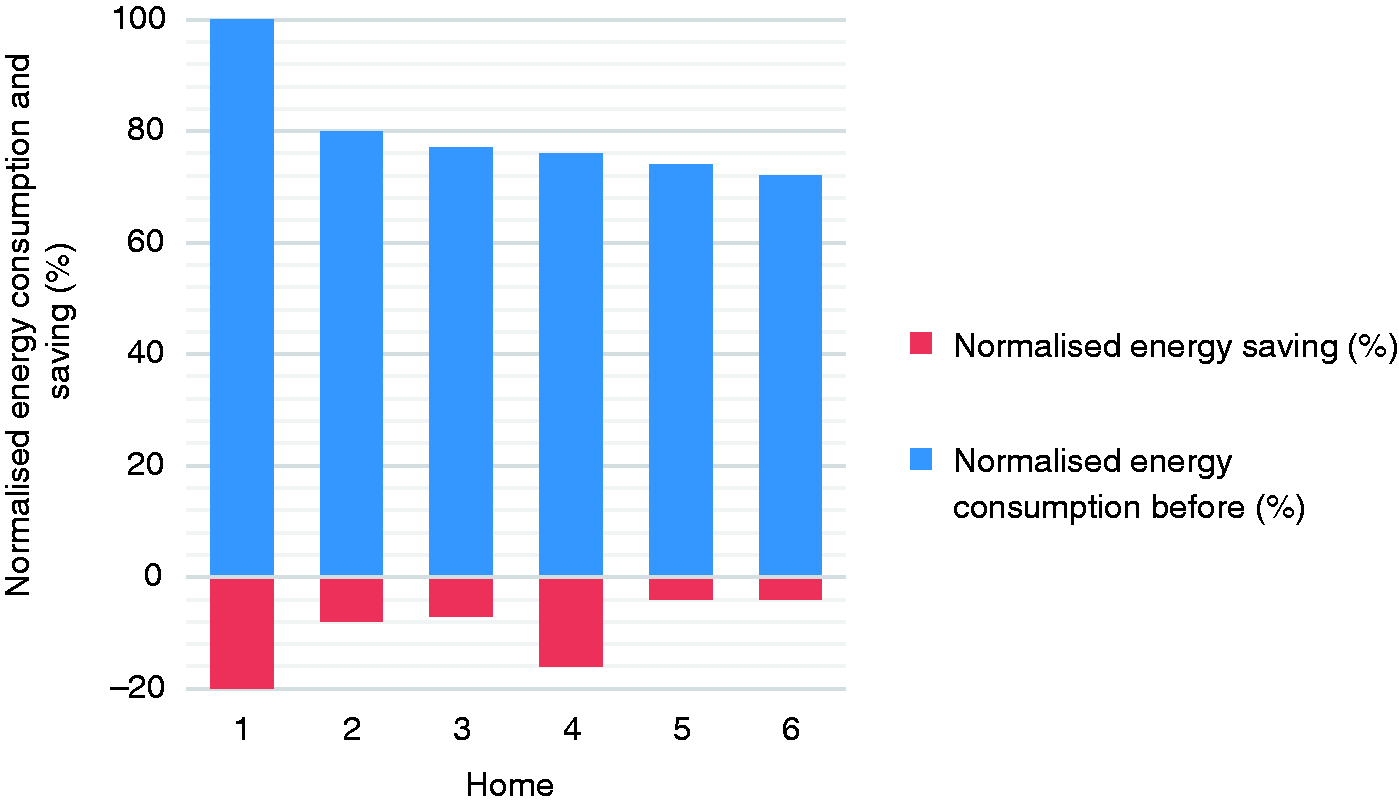
Normalised annual electricity energy consumptions of 6 children’s homes of identical design before and after heating only energy conserving measures were made.
Occupant questionnaires and maladaptation
To explore perceptions of the interior environment one can use an occupant questionnaire. Most questionnaires, however, rarely delve into the human factors. CIBSE TM62 describes in detail how to conduct an occupant survey. 36 The Center for the Built Environment (CBE) at the University of California, Berkeley, has developed a cost-effective, web-based survey that is quick to fill out. 37 It uses a Likert scale ranging over 7 points to select from satisfaction to dissatisfaction with a neutral point in the middle.
A further development in Manchester was a questionnaire with a double Likert scale, 38 , 39 where alongside the satisfaction scale is a second scale for importance, i.e.how important that particular parameter is to that occupant. This allows for more occupant feedback. The importance scale also gives an insight into occupants’ hierarchies, similar to the Maslow hierarchy of needs. 40
The added importance votes can also be used to weight the satisfaction votes to give an overall occupant score for the building. It can be normalised, between +100(%) and -100(%), the minus indicating a dislike score, the positive a liking score. The average of all the occupants’ scores gives the overall liking score (OLS). Average votes for each question can be shown on a ranked histogram, providing a fingerprint as shown in Figure 4. The fingerprint and OLS can be easily understood without detailed statistics and complex graphs.
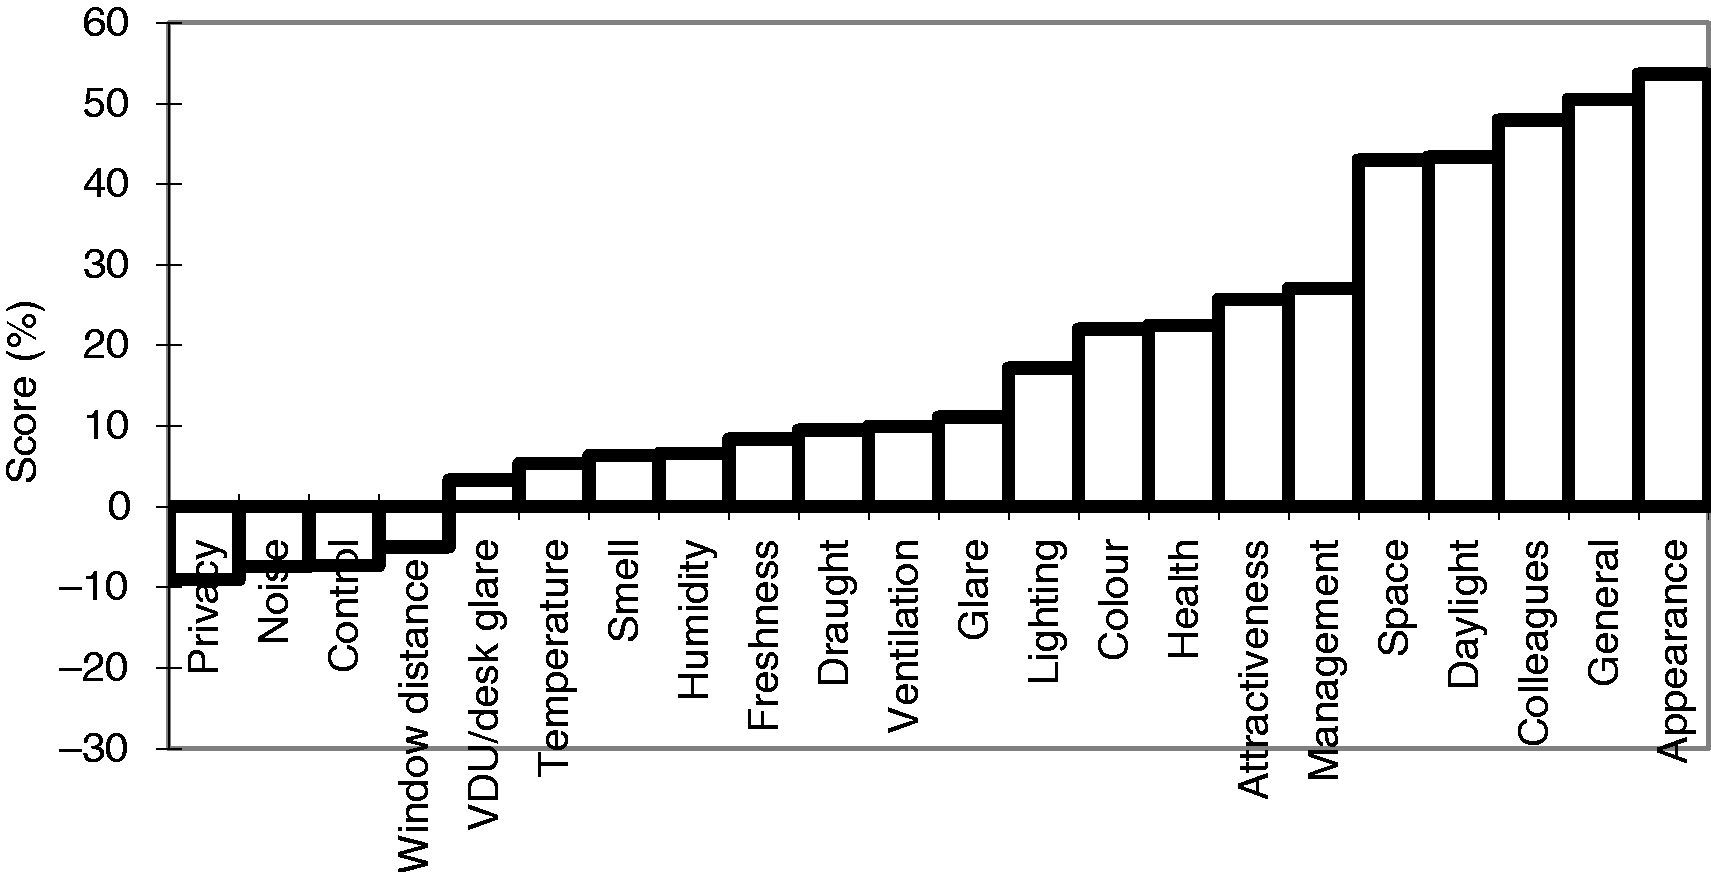
Fingerprint of a deep plan office with atrium and underfloor delivered air conditioning (OLS +17%).
Figure 4 shows the fingerprint of a new office block with underfloor delivered air conditioning. It is well liked with an OLS of +17%. Figure 5 also shows a new building which is naturally ventilated and which won a design award. So it is surprising that it is disliked by the occupants shown by an OLS of -15%. Two of the three most disliked factors were the control the occupants had over their heating (c/heating) and the control over the ventilation (c/vent). The management is not liked much either. There is often a positive correlation between the management score and the OLS and Figure 4 shows both a higher OLS and management score than Figure 5. If the management does not allow this question the occupants’ liking of the building is often low. 41 These human factor questions (management, control and colleagues) could well be an indication of maladaptation, (management and occupants) which is detrimental to the optimal functioning of the building.
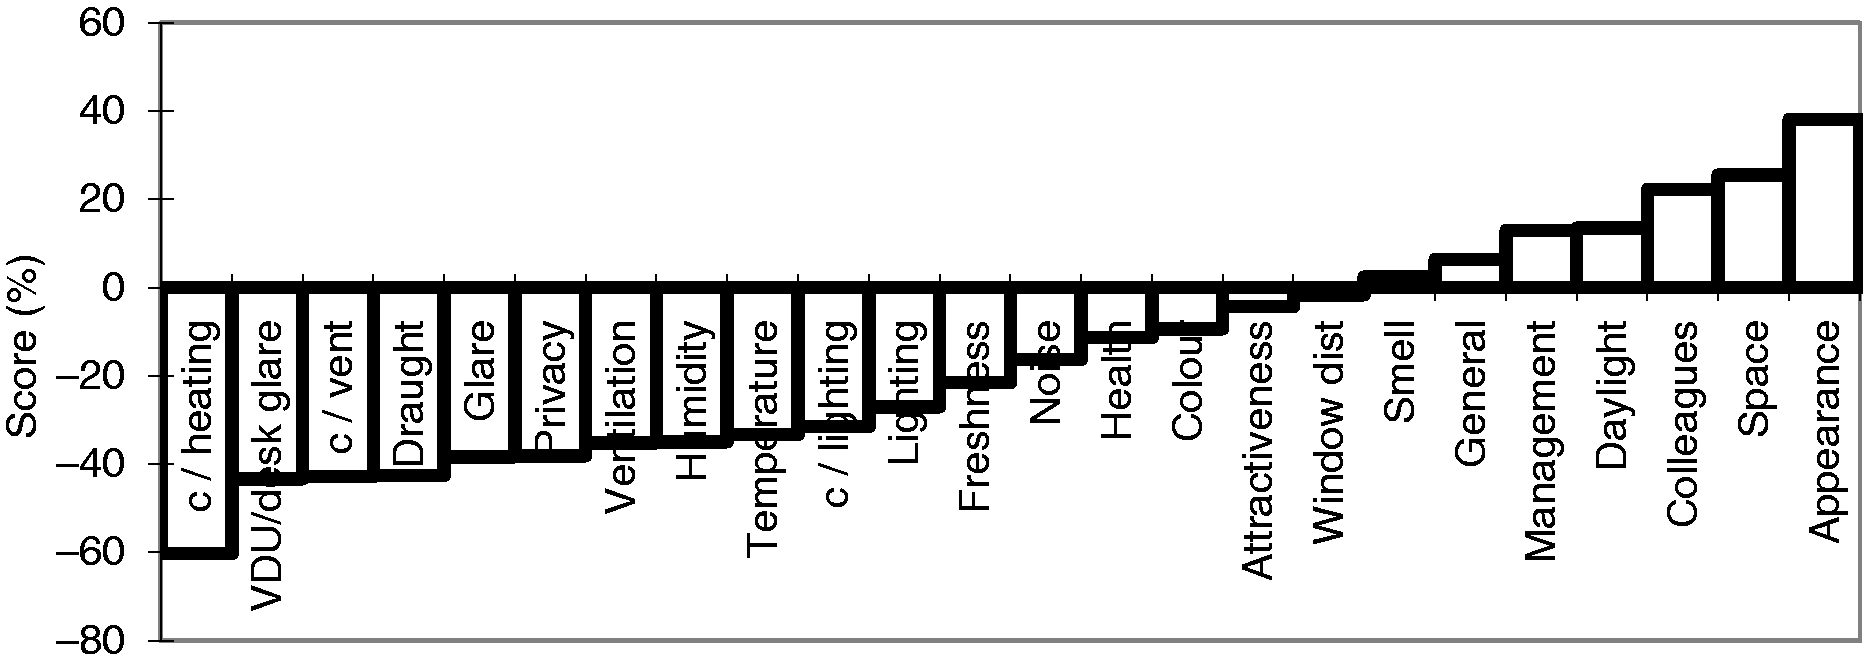
Fingerprint of a deep plan, modern, naturally ventilated building, (OLS -15%).
Closing the energy gap
How can the energy in use be brought down to the design energy? Post occupancy evaluation (POE) is very useful (see The Post-occupancy Review Of Buildings and their Engineering (PROBE).42,43 Utilising POE “Soft Landings” is a methodology and strategy to “smooth the transition into use” of new and refurbished buildings” as “it is widely acknowledged that post-construction buildings often do not perform as well as they could when entering use”.44–46
Maxmaladaptation
Considering the maxmaladaptation concept as the maximum maladaptation that could occur (the theoretical occupants do their best to use as much energy as possible) allows one to see how susceptible a building and plant are to an extreme scenario of extravagant usage i.e. maximum, mal (bad) adaptation by the occupants in their building.
The maxmaladaptation concept could be used at the start of the building design process. An example is the “fabric first” principle in building regulation. 47 The better the fabric performs thermally the less maladaptation can waste energy. Similarly smaller boilers and more efficient lights should consume less energy unless maladaptation (or the rebound effect) means that the boiler and lights are left on for much longer. But smaller boilers and lights use less energy than bigger versions when left on all the time.
After fabric first, controls are a good start for maxmaladaptation, especially, as in new low energy housing, “heating, lighting and renewable energy system controls are often too complicated for people to use confidently” 35 and developers “often neglect handover and commissioning when rushing to finish projects” Added to which new technologies often experience teething problems with control systems “which just do not work, or have poor management and user interfaces. 48 ” In the domestic situation many solar water heaters do not provide the savings predicted as the existing boiler is not switched off appropriately. In 55 solar installations examined, 65% were found to be forgoing 75% of their potential savings. 49 Summer overheating can also be a problem even in modern low energy Passivhaus buildings when window blinds have been specifically installed to stop overheating but their use is not fully understood. 50
Maxmaladaptation can be examined with the use of simple models (even steady state models) or just an average or design day of weather data, to get the importance across to designers, clients, occupants and commissioning agents.
Maxmaladaptation concept example 1
A simple example is the use of a thermostat control in a domestic house. Maxmaladaptation analysis can start by considering a heating system without a thermostat.(The extreme occupant could short-circuit it). The time switch could be set to “continuous” (24 hour operation, every day of the year). Consumption would be considerable, although the boiler would cycle through its thermostatic differential. 19 This is an extreme case and very unlikely, but in a recent survey of low energy homes some households had living room and bedroom temperatures approaching 30 °C average in winter. 51 The recommended comfort criterion for living rooms is 22 °C to 23 °C and for bedrooms it is 17 °C to 19 °C. 52 It is surprising that typical thermostats in the UK do actually have settings up to 30 °C. An example of “maxmaldesign”?
Figure 6 shows the results of a maxmaladaptation exercise for the above house (details in Appendix 1), The maximum worst scenario is with the thermostat set point at 30 °C and the heating on every day of the year its time switch set to continuous (on all day, every day). (This assumes that the boiler is sized to cope, which it often is). This is the base case with its consumption at 100% in Figure 6. The ultimate maxmaladaptation, or rather “maxmaldesign”, is to install an air conditioning system for cooling. This raises the normalised annual energy consumption to186%, well above the base case. But this is probably stretching the maxmaladaptation concept. Heating consumption for a whole year standardised on the set point of 30 °C all day every day (100%).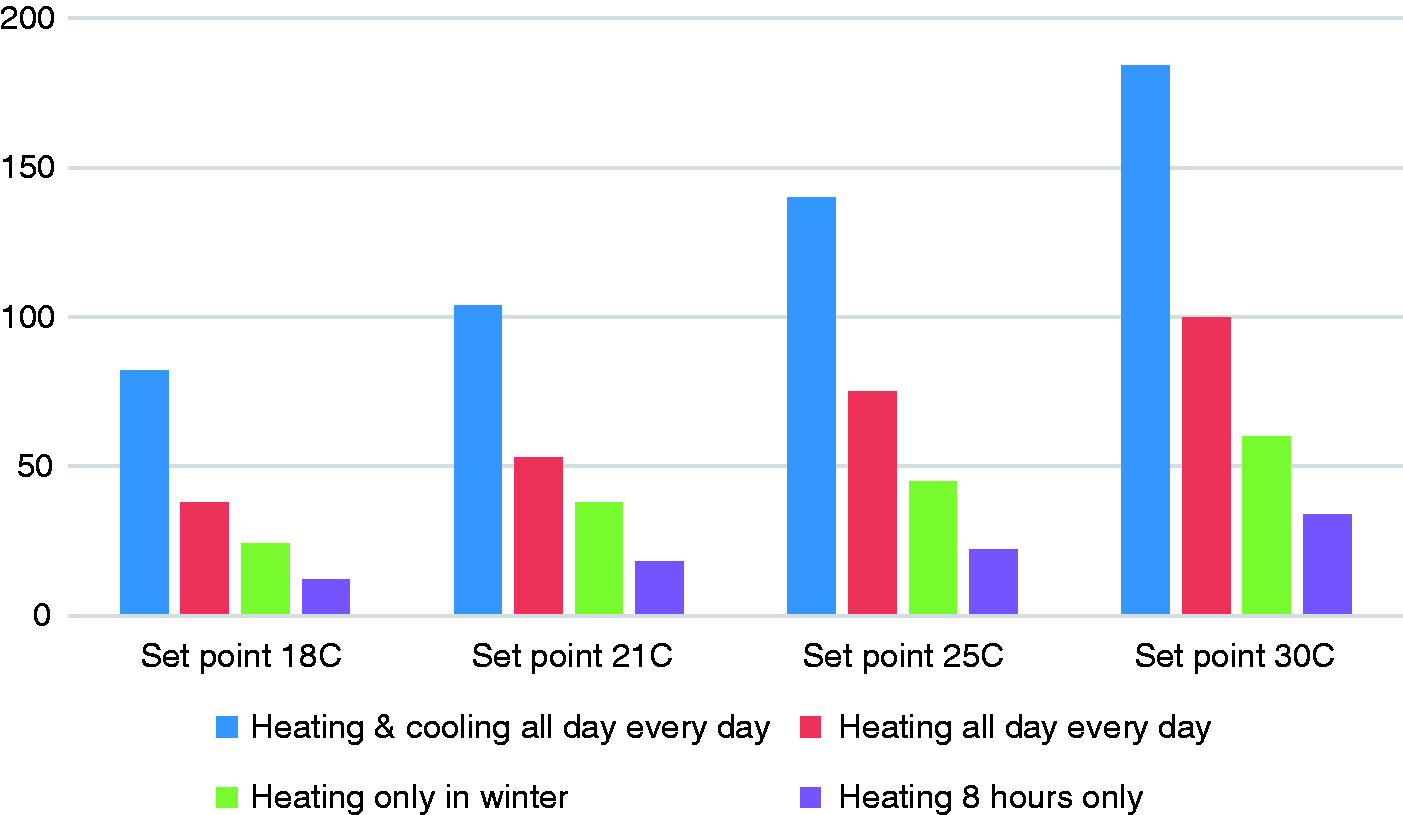
As the thermostat set point is reduced the four histogram sets in Figure 6 show a reduction. Also each histogram set shows a reduction in energy as the maladaptation is minimised by reducing the hours of heating (and cooling).
Comparing the base case in Figure 6, (set point 30 °C, heating all day every day) to the best or lowest energy consumption on the left most histogram set, (set point 18 °C, heating 8 hours a day only) the ratio is 8:1! If the extreme cooling is the base then the ratio is 15:1. This brings home the importance of the control and maladaptation.
Optimisers, compensators, dead bands between heating and cooling, 38 occupancy detectors and daylight switching can all alleviate the actions of maxmaladaptation as long as they do not antagonise the occupants and take away too much control. In one large shallow, open plan office with good daylight penetration pull cords were installed to switch on the lighting (it went off after a set time but not the background lighting). One architect, in the middle of important drafting, when the lighting went off and the daylight was small, pulled so hard on the cord that it pulled the end cap off the luminaire and the fluorescent lamps came out. The pull cords had saved almost 70% of the lighting electricity. Changes were made after staff consultations to alleviate such problems.
Maxmaladaptation example 2
An excellent study 53 (also quoted in a recent CIBSE publication 5 ) of occupant behaviour, in a single-occupancy private office uses three hypothetical types of occupant behaviour for simulation. An austerity occupant, proactive in saving energy, a standard “average” occupant and a wasteful occupant not caring about energy use. The simulation is run with three different climate zones in the USA. The occupant controls the heating and cooling set points, the occupancy controls for the HVAC, lighting and office equipment, HVAC operation time within limits, daylight control cooling startup control. The cooling set points assumed are 26 °C (austerity) 24 °C (standard) and 22 °C (wasteful). The heating setpoints assumed are 18 °C (austerity) 21 °C (standard) and 23 °C (wasteful). The simulations showed that the austerity workstyle saved up to 50% of energy compared to the standard workstyle, whereas the wasteful workstyle consumed up to 89% more energy. The wasteful workstyle is an example of maxmaladaptation and the austerity perhaps an example of “maxbenadaptation” (max good adaptation). Social interactions are absent as the study is only of a single-occupancy private office with personal control.
Conclusion
The human factor has been shown to be a vital ingredient in building energy use which is often overlooked in prescriptive designs. Maxmaladaptation is based on the human factor being dominant in an extreme, theoretical scenario. The concept of maxmaladaptation has been shown to be a possible tool in showing how buildings can perform badly and so allow the designers to take remedial action to avoid an energy gap between design and actual performance. This should be considered in not only in the design process but in the building regulations. Maladaptation itself, intentional or unintentional, can occur.
Using a double Likert questionnaire with non-environmental questions, especially about management and colleagues, can reveal possible maladaptation and also reveal what is actually most important for occupants. Maxmaladaptation considers the human factor which emerged from the work of Mayo at the Hawthorne Works. Referring to modern organisations, Brannigan and Zwerman said, “having stripped people of job security and reduced workers to “skills sets,” they have created a genre of reactions that are generally predictable except in the specifics of the individual occurrences. The human resources specialists seem to be caught off guard, but these reactions would not surprise the pioneering analysts of the early 20th century. Isn't it time to have another look at Hawthorne? 54 ” The maxmaladaptation concept, with resonances to the Hawthorne studies provides such a look for the built environment and its occupants.
Footnotes
Acknowledgements
The author would like to thank Dr Margaret Carter for her comments on and discussions of this paper.
Declaration of conflicting interests
The author(s) declared no potential conflicts of interest with respect to the research, authorship, and/or publication of this article.
Funding
The author(s) received no financial support for the research, authorship, and/or publication of this article.
Appendix 1
Appendix 1 Simple house model
Detached House Length L 10m breadth B 20m height H 6m
Wall + glass area Aw+g 360m2
Wall (-glass area) Aw 288m2
Roof area Ar 200m2
U wall Uw 0.5 Wm-2K-1
U roof Ur 0.5 Wm-2K-1
glass (% of wall) g% 20%
Area glass Ag 72m2
window U Uwin 1.55 Wm-2K-1
Volume V 1,200m3
Air change rate N 1 h-1
Des tai destai 21°C
Des tao destao -3°C
Total UA Tot UA 352 Wm-2K-1
Vent (1/3)NV 400 Wm-2K-1
Des ht loss deshtloss 18,048 W
Boiler size Qboiler 22,560 W
Boiler plant size p 1.25
Weather data used for calculations, Heathrow Test Reference Year