
Abstract
In dwellings connected to district or communal heating schemes occupants are commonly charged based on actual heat consumption, providing a direct link between heat consumption and weekly heating cost. This article investigates how the use of fixed-rate, shared-cost charging without dwelling-level metering affects the heating and controls use in communal network social housing. Living room and radiator temperatures in 50 flats were monitored over a winter heating season and occupants surveyed at monitoring install and removal. The primary stated and observed heating strategy was to leave the heating always on and control through the radiator thermostatic radiator valves. Of people who used timer control, total heating hours reduced with increased frequency of manual intervention. Mean indoor temperatures up to 27.7°C were observed, implying many residents are adapted to higher indoor temperatures. Thus, the current model encourages wasteful behaviour and education on use of controls is key to transitioning residents to charging for actual heat use.
Keywords
Introduction
The use of district heat-networks and communal heating offers residential housing blocks an efficient solution to meet carbon emissions targets. A significant benefit to using a communal heating system is that an entire building or network can be upgraded to a more fuel-efficient and/or lower-carbon heating solution in one instance. The continued development of heat network technology has seen the gradual reduction in distribution temperatures. This improvement is predicted to continue in the future and will further reduce best-practise network energy losses and resulting carbon emissions.1–3 Therefore, heat networks and communal heating schemes can provide an element of future-proofing to the building or network. The addition of combined heat and power (CHP) as a heat source can further reduce operational costs if the electricity produced can be used on-site. 4 The inclusion of CHP requires constant management to ensure an efficient run-strategy and optimal electrical generation is maintained. 5
These benefits make district heat-networks and communal heating an inviting proposition for local authority (LA) owned social housing, where the provision of an economic and consistent heating supply is essential. Furthermore, the existing building stock is likely to make up approximately two-thirds of the total UK housing stock by 2050, 6 thus, it is essential that these buildings were maintained and improved, to provide adequate housing for the coming decades.
New and existing heat networks and communal heating schemes are required to provide individual heat metering and billing to each paying tenant. However, existing networks are able to continue to operate without individual metering where it is not cost effective and technically feasible to install them. 7
The temperature to which occupants heat their homes can have a significant effect on the amount of energy used within a residential housing block and in-turn, the cost of bills and carbon emissions. Furthermore, living at too low an indoor temperature can be detrimental to an occupants’ health, whilst there is little evidence that living at temperatures greater than 21°C is beneficial to health. 8
The World Health Organisation (WHO) recommendation that healthy and active people heat their homes to 21°C in living rooms and to 18°C in bedrooms and other occupied spaces is widely accepted. 9
However, Public Health England published guidance for over 60-year olds, low-income families and people living with a disability states that indoor temperatures of at least 18°C should be maintained in the winter, and temperatures ‘slightly above 18°C’ could be good for occupant health. It also states that appropriately dressed occupants under the age of 65 and still active can heat their homes to ‘slightly less than 18°C’ if it provides a comfortable environment. Rooms in which young infants sleep are instructed to be heated to 16–20°C to prevent sudden infant death syndrome. 10
Previous research conducted by the authors highlighted a scenario where social housing tenants were fuel poor and subsequently living at temperatures below the WHO and Public Health England recommendations. In this instance, the building heating strategy was expensive to run, as heating controls were not fully understood and so the system was not operated efficiently. 11
There is also an issue of fairness when charging for heat within a communal housing block. In instances where communal heating has been retrofitted, there may not be sufficient metering installed to charge each flat based on the actual consumption. Splitting the heating costs between all the flats in the block is a simple solution, which is sometimes applied in the UK and used extensively in Northern China, where communal heating systems are common. Research suggests that these shared cost methods of charging for heat result in higher heating costs than expected and alternative solutions could be designed which are more appropriate on a scheme by scheme basis. 12 More extreme alternative methods could include charging based on indoor temperature; 13 however, this would largely require as much metering equipment and charging infrastructure as a typical metered heating system.
Shared cost recovery models can also result in low heat users subsidising the costs of the higher heat users, 14 whether due to variations in thermal efficiency between blocks on a network, adapted thermal comfort temperature, or wasteful behaviours.
The current indicator for fuel poverty is based on the findings of the Hills Review, 15 and states that a fuel poor household has an annual income of less than half the typical English household, with energy needs that are more than 20% higher. 16 The government strategy for tackling fuel poverty highlights that in 2012, just 16% of fuel poor households in England were social housing. Most dwellings were low income, within the private sector.
The inability to afford enough heat to achieve the WHO or Public Health England recommendations for indoor temperature can also impact on tenant health. Physical impacts, such as high blood pressure, respiratory tract infections, allergies and respiratory conditions can all be increased, in addition to psychological effects such as depression, stress and general low wellbeing. 17 Furthermore, doctor diagnosed asthma has been shown to be common in homes with high indoor relative humidity and mould odour. 18
An extreme solution to reduce fuel poverty and also reduce the impacts of ‘fairness’ at communal heating schemes is to almost eliminate the heating demand. This could be done through the renovation of the block to the EnerPHit standard (the passive house retrofit standard) which would ensure that the design heating demand is less than 25 kWh/m2/yr. 19 Whilst new build passive house schemes can almost remove the heating demand, 20 the same task is not as straight forward in a retrofit scheme, thus it is unlikely that the heating demand, and consequently the issue of ‘fairness’ in charging for heat, would be removed entirely. Whilst this building standard may be achievable in design standards, if occupants are adapted to higher temperatures, it is not likely to be achieved in practise.
In the instance of this study, the LA believed that heat consumption at the case study site was higher than expected but had no metering at the building or flat level to assess this.
As such, the objective of this study was to (i) investigate the indoor environment of the flats to evaluate the likelihood of fuel poverty or high adapted thermal comfort temperatures and (ii) investigate heating controls use to better understand the behaviours resulting from the shared cost recover model implemented at the site.
Case study site
The case study site used for this article is the Charles Dickens Estate (CDE) community heat-network, Portsmouth, UK.
Portsmouth is situated on the south coast of England. The city is primarily located on Portsea Island, whilst the city boundary spreads onto the mainland. The climate in Portsmouth is typical of the UK with a Köppen climate type defined as Cfb. This climate is also typical of North-Western Europe and can be found in other areas of the world including North and South America, Australasia and East Asia.
The City of Portsmouth is the 89th largest LA area out of a total of 326 in England, 21 in terms of population, whilst Portsmouth also has the highest population density in the UK, outside of London, with 5141 people per square kilometre. 22 The average Index of Multiple Deprivation score for the LA ranks Portsmouth in the lower quartile of the country at 63rd. 23 This score considers employment, income, education and skills training, crime, living environment and more, and thus, overall Portsmouth should be considered one of the more deprived LA areas in England. 24
The CDE community heat-network is located within the ward of Buckland on Portsea Island. The network was retrofitted to the site in 2003, before this, each building that is now served by the network had either a building level communal heating system or flat level individual gas boilers.
The heat-network is categorised as an ‘Option B2’ scheme under Table 5 of the CIBSE Heat Networks: Code of Practise for the UK. It is defined as such as the network is owned by Portsmouth City Council, but operated, managed and maintained by a Private Sector Company. Portsmouth City Council is responsible for billing the tenants for heat. 25
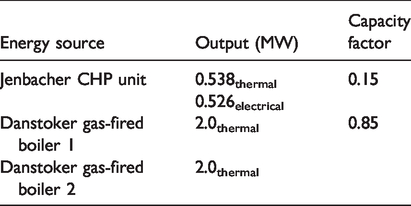
The network itself has three heat sources, situated in a central energy centre. Heat is generated from one CHP unit and two gas-fired boilers. Heat is generated from one CHP unit and two gas-fired boilers, as detailed in Table 1. The energy centre also has an external, 70,000 L hot-water storage tank. The electricity generated by the CHP is sold directly to the National Grid, except for the parasitic load of the energy centre. This is because there is no private wire network to allow the electricity to be used within the buildings on the network or surrounding it.
The network serves 536 flats, within eight housing blocks. All eight blocks are owned by Portsmouth City Council and the flats are let to social housing tenants only. The eight blocks are made up of four matching pairs, of varying size and construction type, as shown in Table 2.
Energy sources installed at the CDE Heat Network.
Summary of network housing blocks with construction and performance.
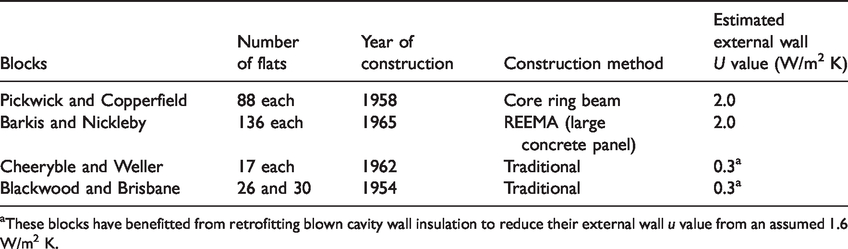
aThese blocks have benefitted from retrofitting blown cavity wall insulation to reduce their external wall u value from an assumed 1.6 W/m2 K.
Heating controls
Each flat on the CDE Heat Network has a radiator in each room connected via a single circuit distribution network. A heat interface unit (HIU) transfers heat via heat exchangers from the single circuit building distribution loop into the flat’s local system to provide space heating or hot water. A controller is fitted near the HIU, commonly within the kitchen. The controller allows for the heating to be set to one of three options, (i) heating is permanently on, (ii) heating is permanently off or (iii) heating is controlled by the timer. The timer on the controller had a wheel which represented a 24-h period, split into 15-min segments. Depressing that segment would turn the heating on for that duration. As such, multiple heating windows could be set within a single 24-h period. The timer function was therefore very basic, but very simple for the occupants to use – assuming some prior knowledge or training was provided. Each radiator within the flat was also fitted with a thermostatic radiator valve (TRV). This allows the independent control of each radiator and therefore independent control of each room temperature.
Existing method of charging for heat
According to Portsmouth City Council, due to the high demand for social housing in the city, tenants are rarely able to specify which housing block they live in. As such, Portsmouth City Council have decided to use a shared cost recovery model at the CDE heat-network so that tenants are not penalised for living in less thermally efficient buildings, such as Pickwick as compared to Cheeryble in Table 2. This charging mechanism ensures all tenants pay the same for heat in relation to the size of their flat. The tenants do not receive any instruction on how to operate their heating system or controls.
Each year the council calculates the costs of running the network, less the income generated from the sale of the CHP electricity to the National Grid, based on the average of the past five years. This five-year averaging smooths out the effect of a particularly cold winter season, such as 2017/2018. The five-year average cost is divided between each flat, based on the total number of bedrooms and billed with their rent each week. Incorporating this fixed weekly charge into the housing charge also reduces the chance of non-payment by the tenant.
Method
To evaluate the indoor environment of the participating flats, this study used two methods of data collection; monitoring of the living room temperature which was supported by face-to-face interview surveys with the tenants. The indoor temperatures were analysed using simple analysis of room temperature data and an algorithm developed as part of this study to analyse the radiator temperature data. The analysis of this data was undertaken to understand (i) the environmental conditions within the living room of each flat and (ii) how the tenants were interacting with the heating systems and controls.
The study conducted space environmental conditions monitoring within 50 occupied flats across the CDE heat-network. Sixteen participants were put forward by the scheme managers of the four high-rise blocks, these participants were monitored for an initial two-month pilot-study in February/March 2017 and all, except one who was moving house, were willing to continue participation in the subsequent full study, conducted from September 2017 through until April 2018. The study period of the full monitoring study therefore coincided with the 2017–2018 heating season. The additional 35 participating flats volunteered for the study by responding to a letter delivered to all the flats on the network. These flats were monitored for the duration of the full study only.
Two Madgetech data loggers (type RHTemp101A) were placed within the living rooms of each participating flat. These loggers took temperature and relative humidity readings at 5-min intervals. To determine the radiator temperature, measured as the convected air temperature from within the radiator fins, one logger was attached, by a cable tie, to the top of the radiator – where possible, out of direct sunlight; whilst to measure the room air temperature, the second logger was placed on a shelf or bookcase in the same room, away from heat sources and out of direct sunlight.
Flats at the study site have a radiator in each room connected via a single circuit distribution network. A HIU transfers heat via heat exchangers from the single circuit building distribution loop into the flat’s local system to provide space heating or hot water.
The same process was replicated in an unoccupied flat over a three-day period to demonstrate how interactions with the heating system (adjusting the TRV set points) and flat windows affect the radiator and room temperature profiles. These interactions and the pilot study data were then used to validate the developed TRV status algorithm.
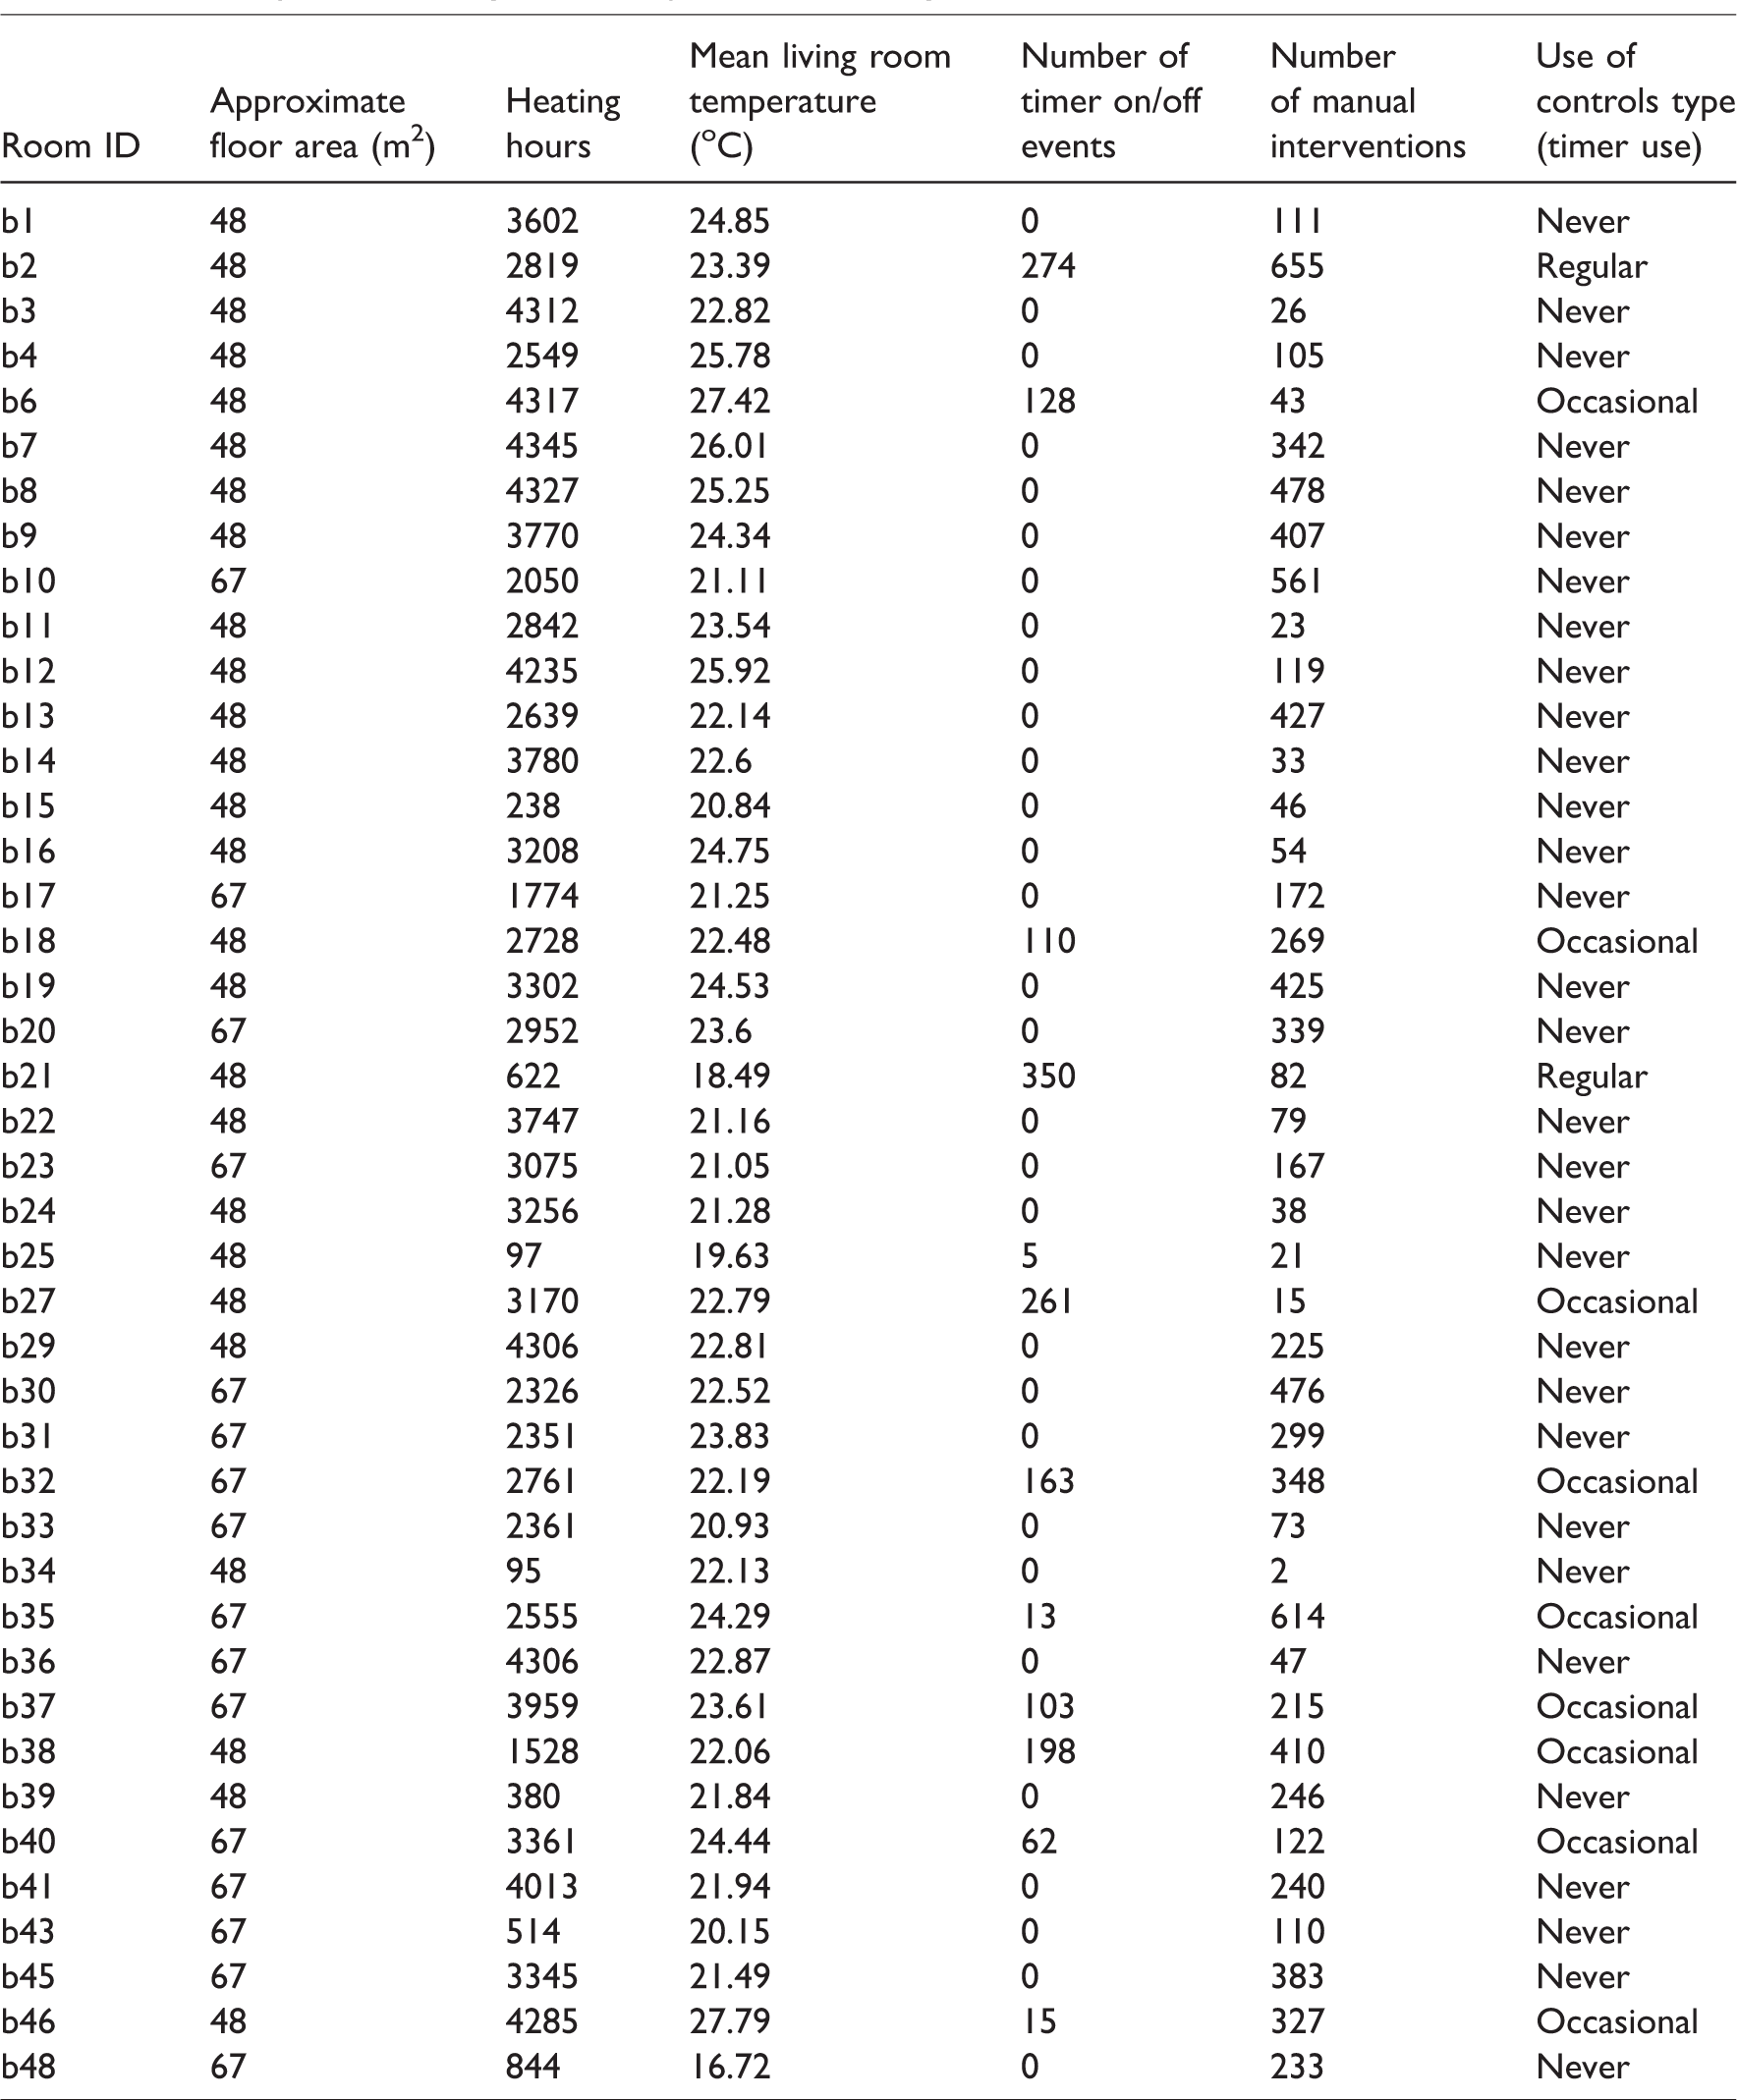
Of the 50 flats monitored in the full study, full radiator and living room temperature data were collected from 48, located within six of the eight blocks. It was not possible to recover both radiator and living room temperature data loggers within two flats, as they were reportedly moved and misplaced during the study period.
The data collection was backed up by face-to-face interview surveys, conducted at both the beginning and end of the full study to understand self-reported occupancy profile and heating behaviour.
In September 2017, at the beginning of the study period, 48 participants each completed an ‘entry’ survey. This asked seven questions, reviewing (i) occupant ages, (ii) approximate hours occupants spent in at home, (iii) an open review of the heating and level of comfort with the home, (iv) estimated target living room temperature throughout the heating season, (v) heating control strategy, including interaction with windows, (vi) what the fixed cost of the heating is and, (vii) whether they deemed the current costs to be fair.
In April 2018, at the end of the study period, 45 participants completed an ‘exit’ survey. This reviewed the study period in relation to (i) heating system performance, (ii) perceived level of comfort, (iii) heating control strategy, and (iv) overall heat use.
Although the flats connected to the Heat Network are part of a highly maintained LA portfolio, it is important to confirm that the system is operating correctly. Within the exit survey, we asked ‘Have you had any problems with your heating system or living room radiator this winter?’ No participants reported an issue with a TRV. As such, we can assume that all TRVs are operating as expected by the user.
Furthermore, all flats within the data set show radiator temperature profiles that fluctuate whilst heat is delivered to the radiator. As such, we can infer that the TRVs are all able to maintain variable temperatures, and do not suffer from damaged valves, which leave them fully open. Nor were there any reported instances of damaged or ineffective TRVs during the study exit survey.
For many flats set points are not consistent. The authors believe this to be indicative of manual intervention with the TRV, not the limiting capacity of the system. There are instances within several flats where a consistent room temperature (staying within ±1°C) is maintained, and the radiators are seen to modulate accordingly to maintain this room temperature. During these periods the radiator temperature is lower than the observed maximum, therefore we can infer that the TRV is set below the maximum output. This demonstrates that the TRVs can maintain a fixed room temperature setpoint.
An algorithm has been developed within R, a statistical computing software, to analyse the radiator temperature data and define the radiator status for each reading taken by the data logger. Each readings’ status is based on a set of conditions which compares the current reading to the value of other readings at given time steps. The set of conditions must be true for the status to be applied to that reading. The reading to which the set conditions are being applied is labelled TS0.
The time steps vary in duration and compare the radiator temperature at TS0 with both future and recent radiator temperatures. Time steps TS1 and TS−1 are 5 min after or before TS0. Time steps TS2 and TS-2 are 30 min after or before TS0.
An example of the conditions which must be true, in relation to the current time step (TS0), for the status of ‘TRV turned up’ to be applied are as follows:
The radiator temperature at TS−2, TS0 and TS2 must all be greater than 30°C (TMIN) and; The radiator temperature change between TS−2 and TS0 must be less that 1°C and; The radiator temperature increase between TS0 and TS1 must be greater than 2°C and; The radiator temperature increase between TS0 and TS2 must be greater than 4°C.
‘TRV turned up’ highlights an event where the radiator temperature is increased from a ‘steady’ lower, ‘on’ temperature to a greater temperature, where the temperature also remains ‘steady’. This change is classified as a manual interaction with the TRV. Where the TRV is ‘self-regulating’ we commonly see the temperature fluctuating between similar peak and low temperatures. This contrasts with a manual interaction where the temperature change is variable. The algorithm ignores the repetitive events and only highlights the single, variable ones.
The algorithm highlights key interactions as (i) each time the TRV setting is adjusted up or down, (ii) each time the radiator is turned on or off, and (iii) determines whether the on/off status is a timer event or a manual event. When compared with a visual interpretation of the code, the heating algorithm achieved a 90.1% agreement.
Figure 1 shows an example 24-h profile based on the four incident criteria listed above. The heating algorithm read the radiator temperature profile and highlighted the following events:
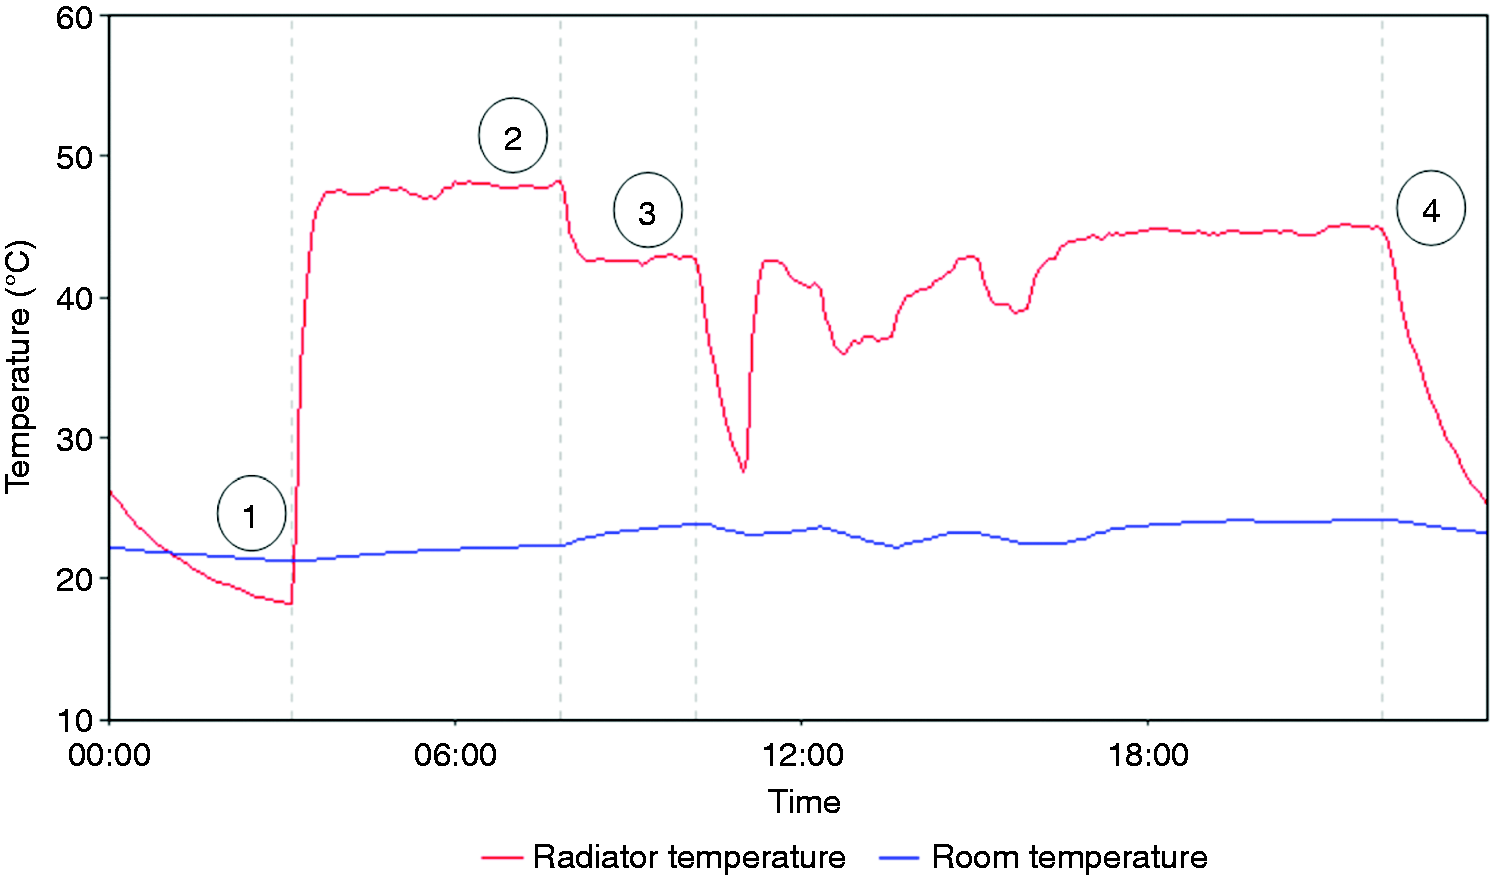
Example of 24-h radiator and living room temperature profile.
Radiator turns on – this is a timer event as the heating turns on daily at 03:10.
TRV turned down.
TRV turned down.
Radiator turned off – this is a timer event as the heating turns off daily at 22:10.
As described above, the four low-rise blocks on the network have had the external walls thermally upgraded. This makes the main element of the external building fabric significantly more thermally efficient than the four high-rise blocks. Therefore, to allow a uniform comparison of the data and effects, the data collected from flats from within the low-rise blocks were not used within this study. The removal of these flats reduced the participating flat sample to 42.
Findings
During the entry survey undertaken at the beginning of the study period, the participants were asked what temperature they know or expect they heat their homes to during the heating season. Fifteen participants gave values, ranging from 15°C up to 27°C, with a mean expected temperature of 20.6°C. Twenty-two participants said they did not know and two chose not to answer the question. This question highlighted that more than half of the residents did not know what temperature they planned or were likely to heat their home to.
Figure 2 shows the daily mean living room temperature for each of the 42 flats within the four high-rise tower blocks. Within the 42 participating flats, overall mean daily living room temperatures were observed from as low as 16.7°C to as high a mean temperature of 27.7°C. The mean and median temperature observed across the participating flats was 22.8°C.
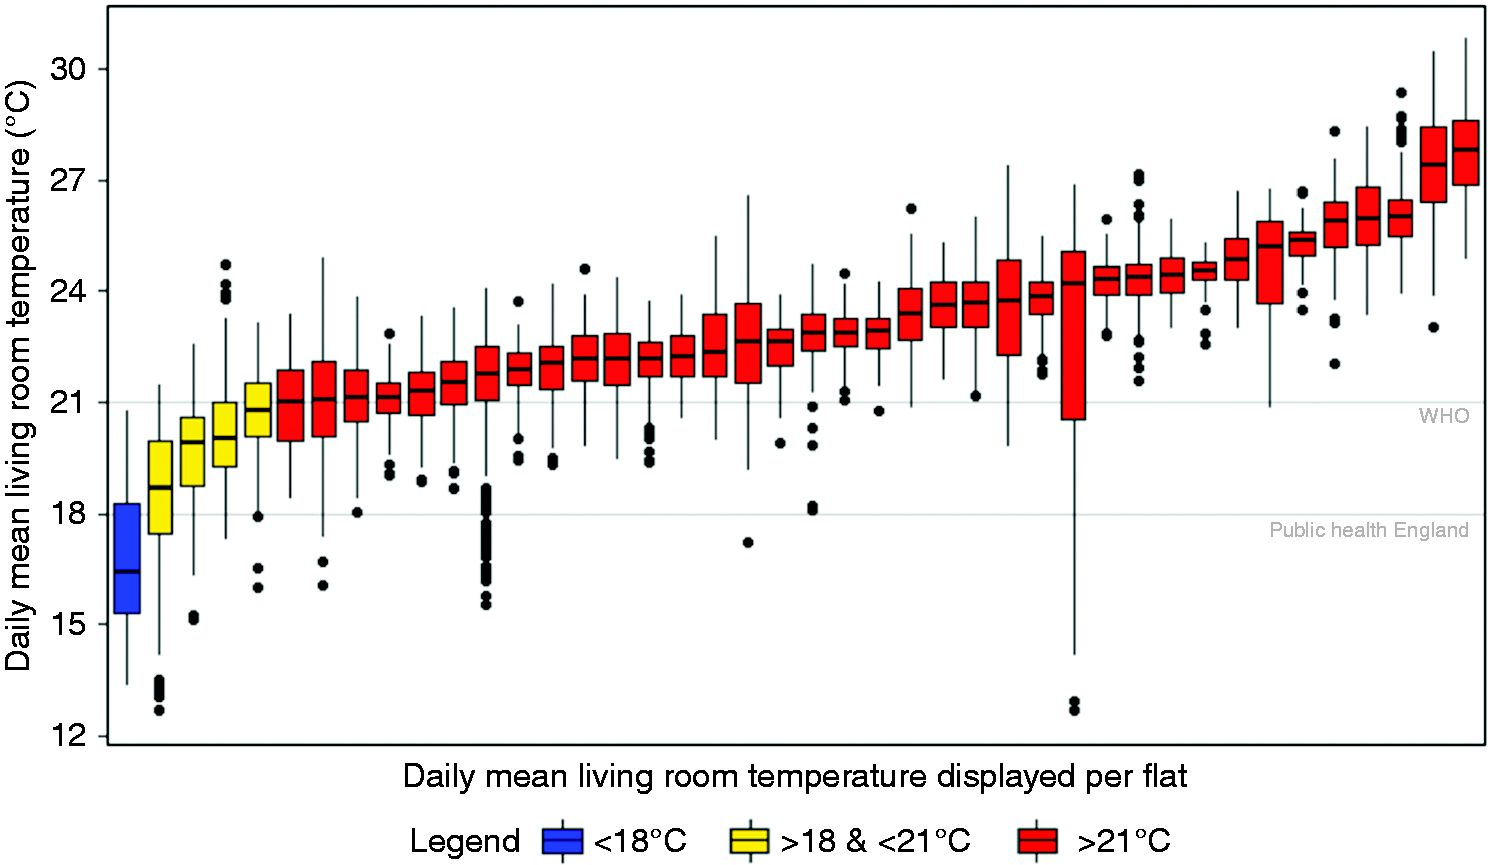
Daily mean living room temperature (00:00–23:59) by flat (October 2017–April 2018).
Only one flat had an overall mean temperature of below 18°C. Whilst the mean temperature of this flat sits below the WHO and Public Health England recommendations, the upper range of the daily means does extend above 20°C. As no residents reported an ongoing or extended duration of heating-system failure via the exit survey undertaken at the end of the study period, it is believed that this indoor temperature is maintained by choice.
Four flats have average living room temperatures that sit between the Public Health England and WHO living room recommendations of 18°C and 21°C, respectively. The remaining 37 flats all had a mean living room temperature of greater than 21°C. Furthermore, only three of these flats had any single daily mean temperature that dropped below 18°C.
This indicates that that tenants of the CDE Heat Network are adapted to living at temperatures higher than those recommended as necessary in the UK.
Figure 3 shows a positive correlation between total heating hours and the mean temperature of the living room over the heating season. It is shown that, generally, as would be expected, the more total heating hours, the higher the mean living room temperature observed.
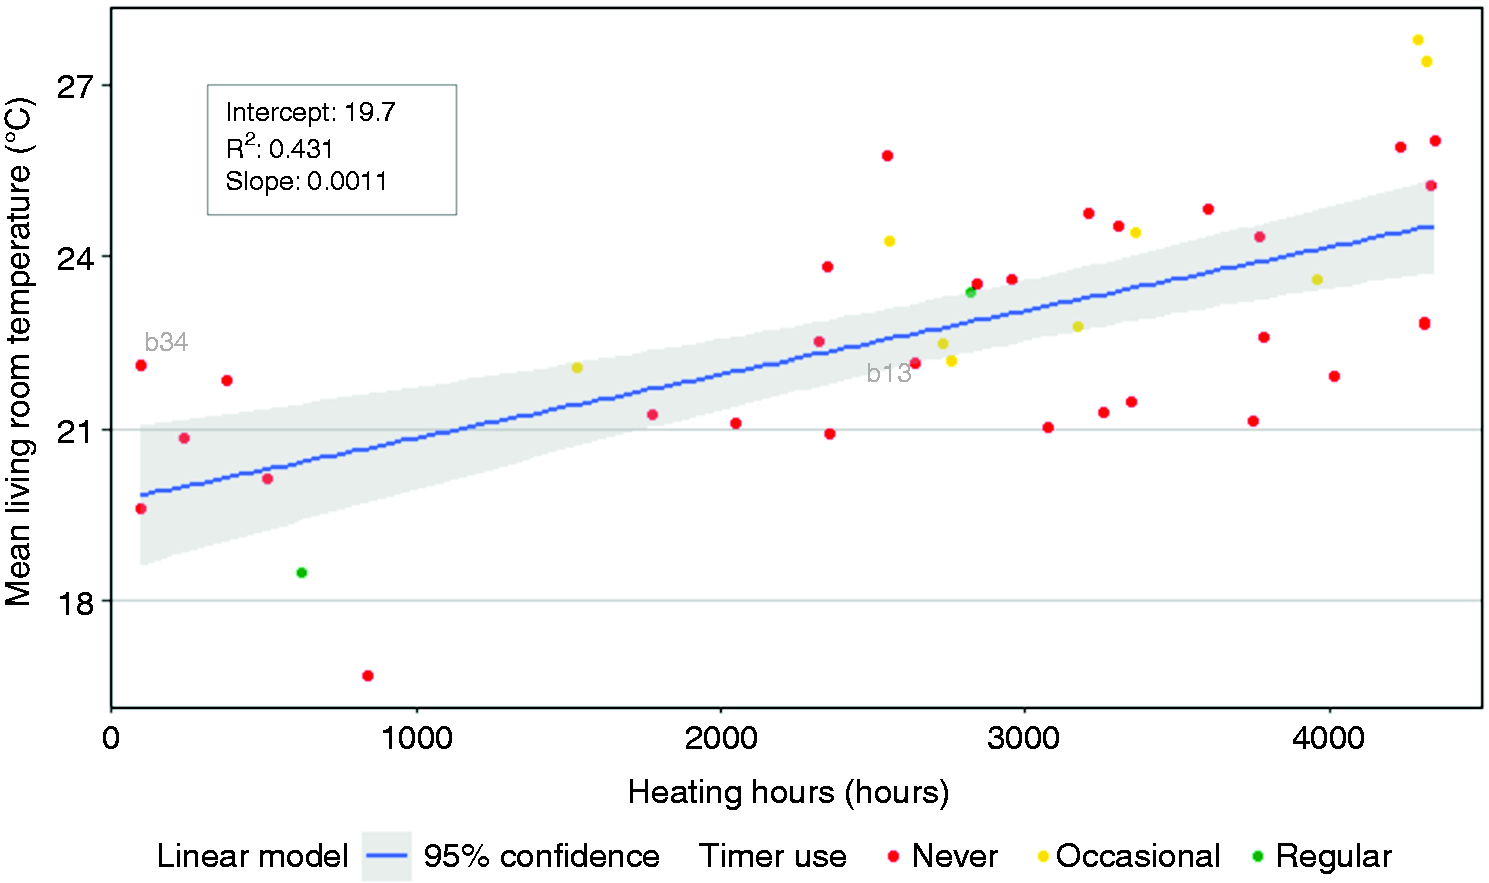
Mean living room temperature for heating season (00:00–23:59) vs. heating hours (October 2017–April 2018).
There was a large variability in the heating hours across the dataset, from just 95 h (2% of the heating season), up to 4345 h (99% of the heating season). This wide variation in heating hours could be due to several reasons. First, generally, the occupants of flats with a few heating hours lived at a lower indoor temperature compared to the flats with very high heating hours as mean living room temperature and heating hours are positively correlated. Second, the flats with lower heating hours could be surrounded by flats on all sides. They may therefore rely on the transfer of heat from these surrounding flats to maintain comfortable temperatures rather than using their own heating, potentially increasing the heating hours required in these surrounding flats. Interestingly, the flat (b34) in which the heating ran for only 95 h had a mean living room temperature of 22.13°C. In another flat (b13) a mean living room temperature of 22.14°C was achieved but the heating ran for 2639 h (60% of the heating season). This variation in heating runtime whilst achieving the same mean living room temperature could be due to several factors.
Figure 3 does not account for the average radiator temperature, therefore flat b13 may have had its heating on at a low TRV setting for a lot of the time. Alternatively, it could have the heating on at a higher temperature whilst keeping the windows open to maintain high ventilation levels. The exact reason cannot be inferred from the radiator temperature data.
However, within the exit survey, participants were asked ‘which of the following statements best describes how you used your living room windows over the last winter?’
I keep them closed in the winter. I sometimes open the window for short periods of time (10 mins max), to cool the living room. I sometimes (daily, for an hour or two) have a living room window open (to any degree). I almost always have a living room window open to some degree.
Flat b13 answered ‘Statement 4 – I almost always have a living room window open to some degree’, whilst flat b34 answered ‘Statement 3 – I sometimes (daily, for an hour or two) have a living room window open (to any degree)’. An increased ventilation rate in flat b13 resulting from ‘always having a living room window open to some degree’ is most likely the reason why heating hours is 2544 h higher than flat b34, despite both having near identical mean living room temperatures over the heating season.
Each flat is fitted with a programmer and TRVs. The programmer allows the heating to be set to ‘On’, ‘Off’, or ‘Timer’. The timer is controlled by a dial which allows multiple heating periods per day to be set. During the entry survey, participants were asked ‘What do you use to control the heating and temperature of your home?’ Figure 4 shows the results of this survey question.
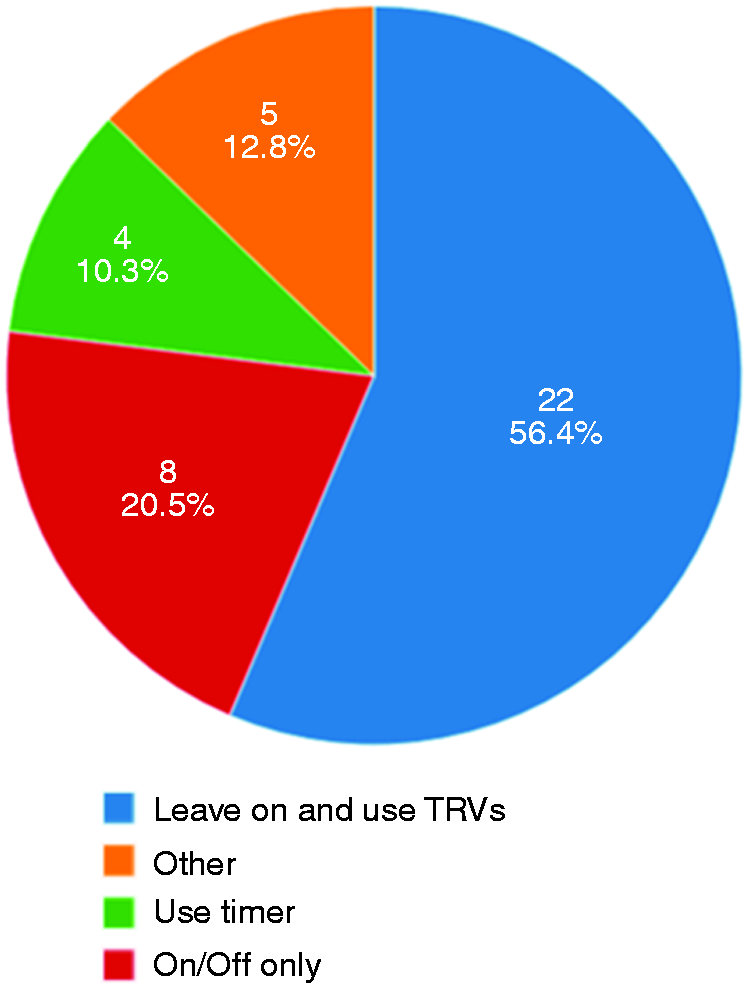
Tenants’ self-reported heating control strategy.
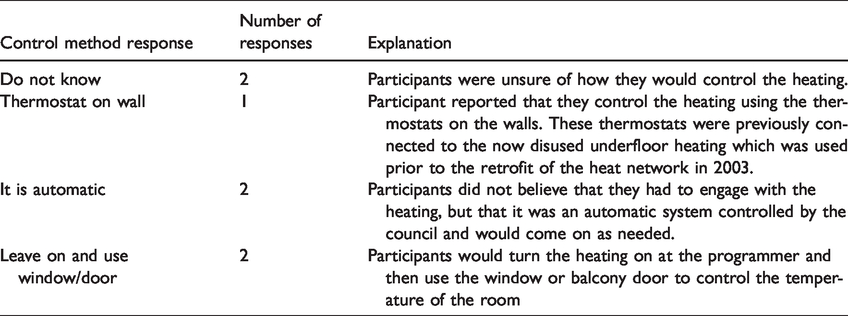
Eight participants reported that they only turn the heating on or off at the programmer, and do not engage with the timer function or TRVs on individual radiators. Twenty-two participants (almost 60%) reported that they turn the heat ‘On’ at the programmer and then adjust each radiator using the TRVs. In some instances, it was reported that, once the heating was needed, they would turn the heating on at the programmer and not engage with it again until the end of the heating season. TRVs would be used to turn individual radiators on or off. Only four participants reported that they would use the timer function. Whilst the remaining seven participants reported a variety of other control methods (5 other and 2 do not know) which are included in Table 3.
‘Other’ tenants’ self-reported heating control strategies.
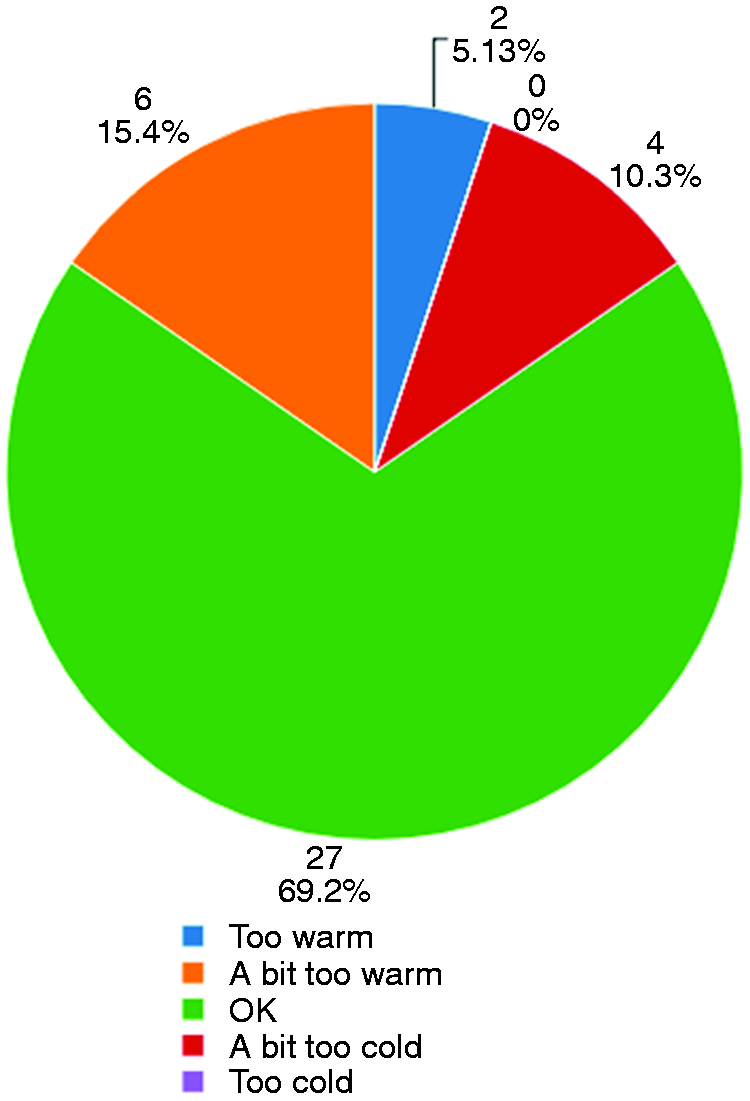
Participants were also asked ‘In general, how would you describe the temperature in the living room this winter’ and given a choice of five options. The overwhelming response was ‘OK’, with 69.2%, just over 20% responding ‘A bit too warm’ or ‘Too warm’ and 10% stating it was ‘A bit too cold’. No participants reported that the living room was ‘Too cold’.
From this data, see Figure 5, we can assume that the participants who responded with ‘OK’ were generally comfortable. Therefore, a large number of tenants, many of whom are adapted to living at higher temperatures than recommended, are comfortable within their current indoor environment over the heating season.
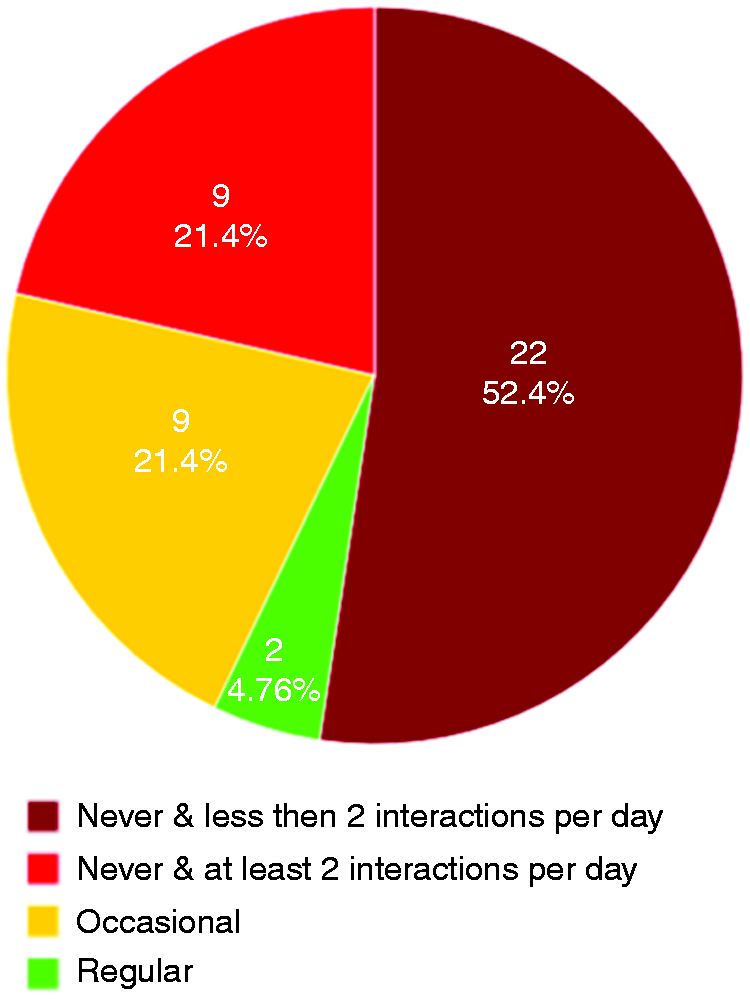
The observed data, Figure 6, showed that only two participants regularly used their timer, whilst nine used it occasionally. Overall, a greater number of participants used their timer than said they would in the entry survey. However, in agreement with the entry survey, the data infers that most (31) of the participants never used the timer function. Less than half of these (9) engaged with the heating system, on average, at least twice per day. This means that 22 of the participants did not, on average, turn the heating on and off at least daily over the heating season.
Participant perceived thermal comfort levels.
Participant inferred engagement with the timer function from observed radiator temperatures.
For the flats who never use the timer, when plotting the heating hours against the number of manual interactions with the heating system (see Figure 7), one can observe three types of users.
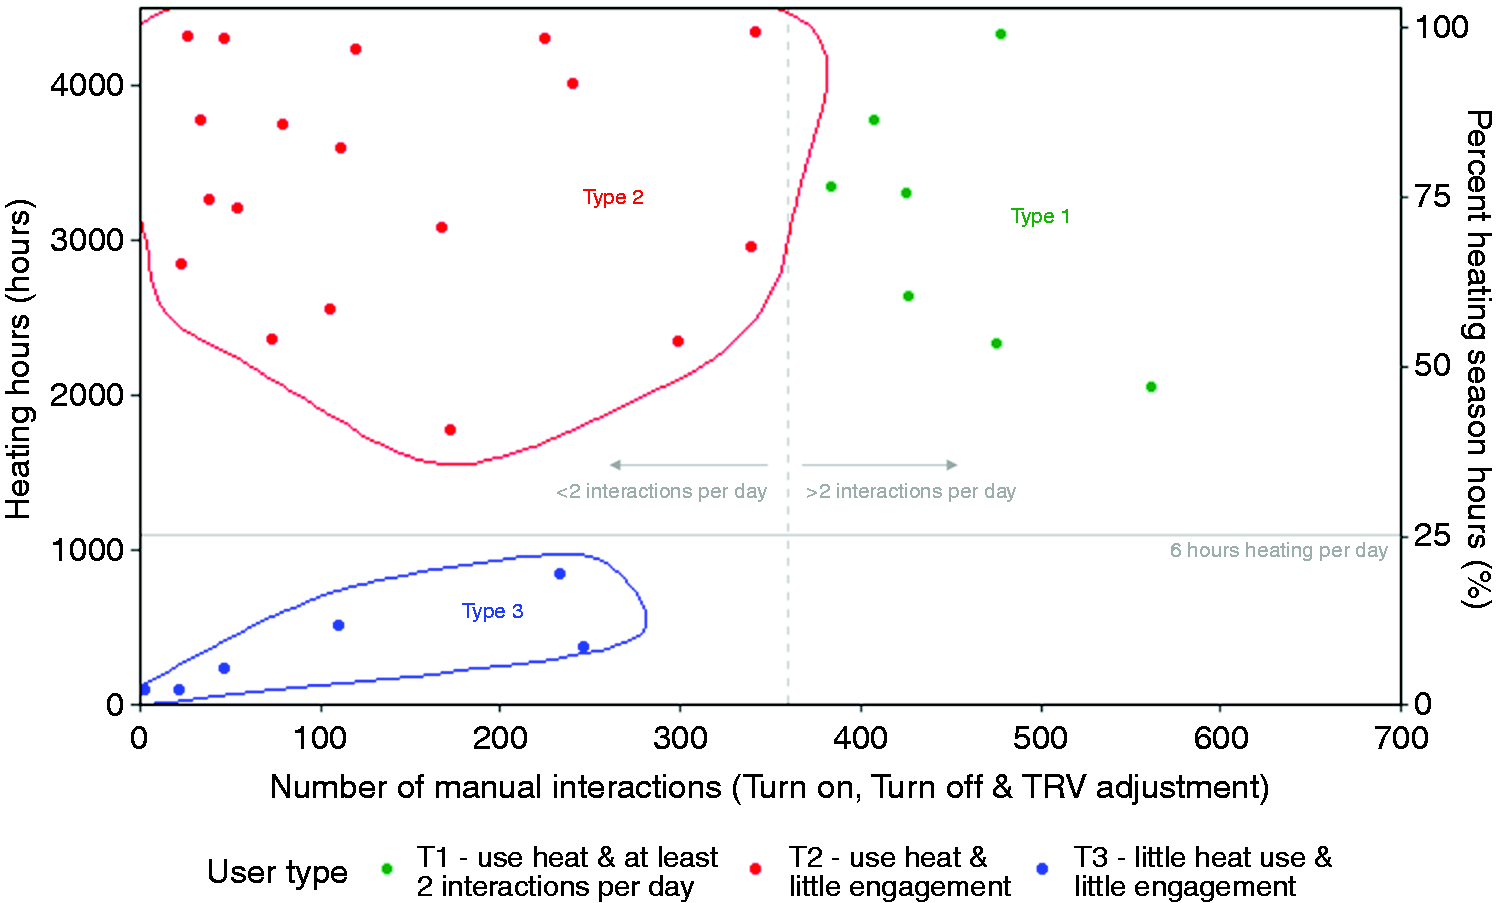
Heating hours vs. number of manual interactions – flats that never use the timer (October 2017–April 2018).
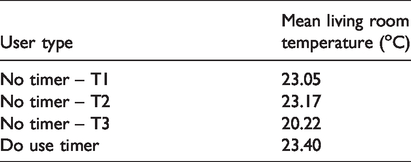
Type (T)1 use their heating regularly and engage with it at least twice per day. T2 users also use their heating regularly but engage with it less than twice per day. T3 users use their heating less and do not engage with it at least twice per day. The mean living room temperature of each user type is shown in Table 4. In flats that do not use the timer function, there is no apparent correlation between the number of hours heating runs and the number of manual interactions.
Mean living room temperatures by user type – flats that never use the timer and flats that do use the timer.
Summary of flats, living room temperatures, heating use and control method.
The tenants who use the timer function of the programmer demonstrate their ability to use the most complex functionality of the heating controls. This indicates that they may have a better understanding of how to control the heating system than the participants who never use the timer function.
Figure 8 shows heating hours against the number of manual interactions with the heating system for flats who regularly or occasionally use the timer function, and in contrast to Figure 7, there appears to be some correlation.
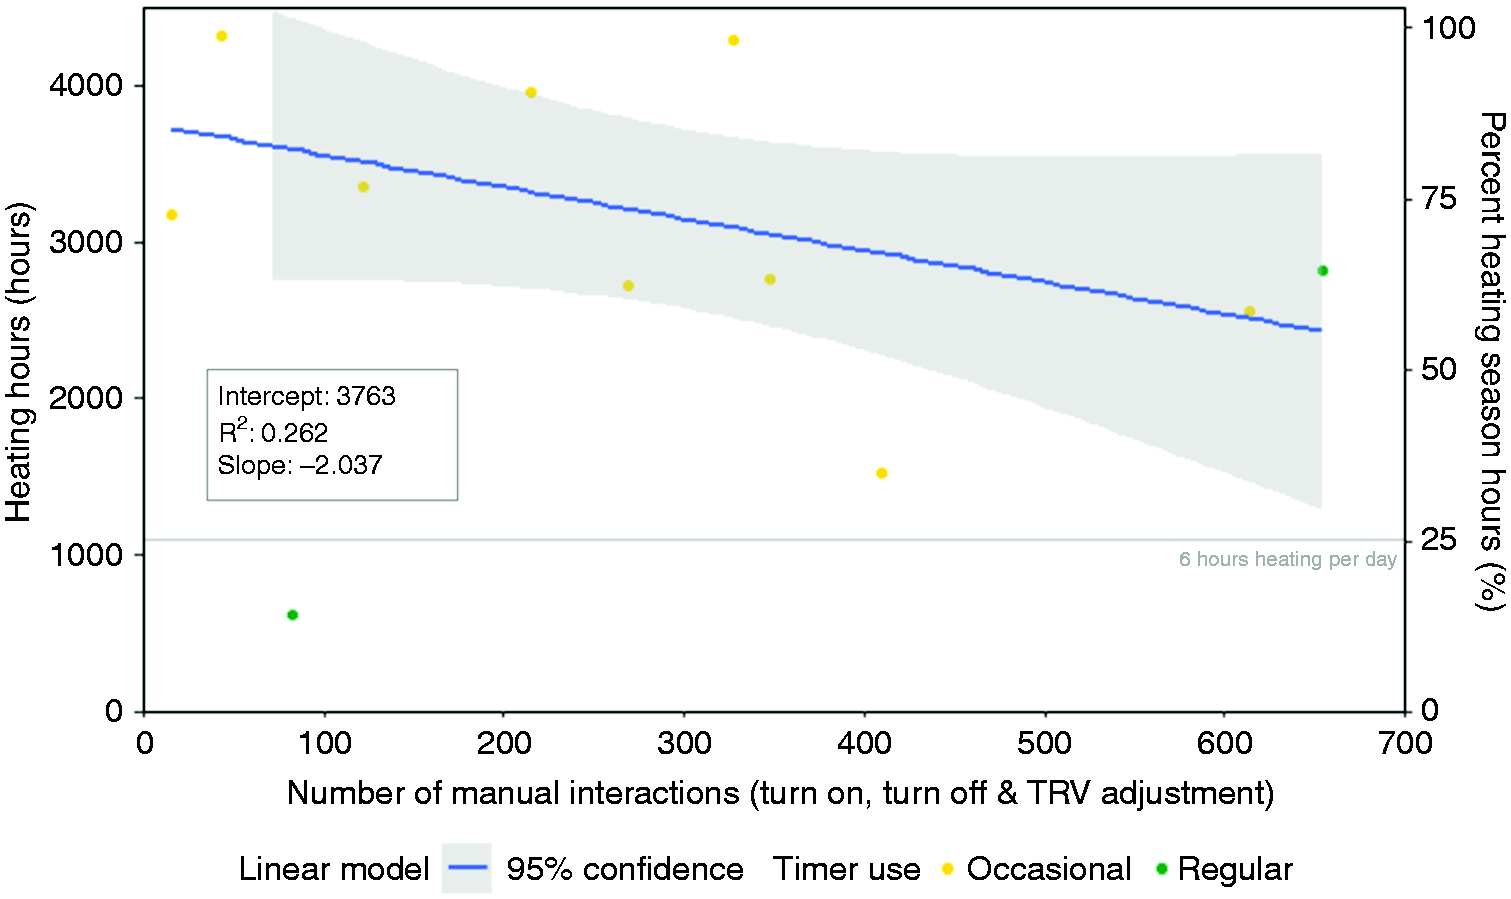
Heating hours vs. number of manual interactions – flats that use the timer (October 2017–April 2018).
The linear model, applied to the plot as a line of best fit, shows a modest negative correlation between the two variables through the r-squared value of 0.26. For comparison, an r-squared value of 1 would be a perfect fit of the linear model to the data. The linear model does not include the data point below the ‘6 hours heating per day’ as it is a clear outlier compared to the rest of the dataset. This therefore indicates, that in addition to using the timer function, the more that occupants manually interact with the heating controls, the fewer hours the heating runs. The mean living room temperature of these flats was 23.4°C. This was higher than the mean observed in the three user types within the flats that do not use the timer.
Figure 9 shows that there is no significant negative correlation between the mean living room temperature and the number of manual interactions with the controls.
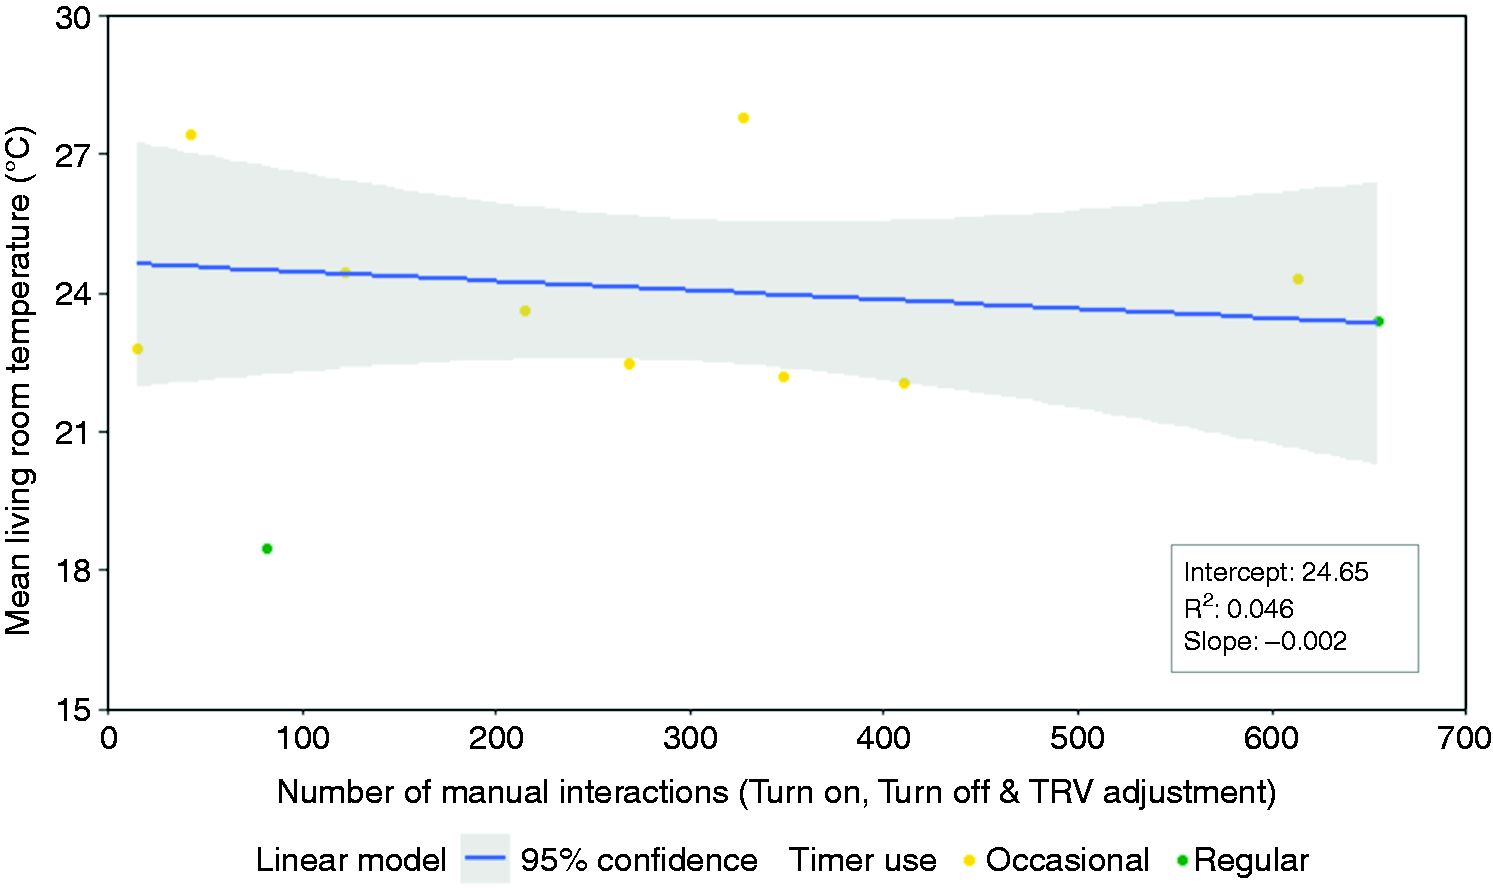
Mean living room temperature vs. number of manual interactions – flats that use the timer (October 2017–April 2018).
In flats that use the timer function, whilst there may not be a significant correlation between the number of manual interactions with the controls and the mean living room temperature. Figure 10 shows a moderately strong correlation between the mean living room temperature and heating hours. As such, in flats that use the timer function, if the number of manual interactions with the heating controls in increased, this may lead to a reduction in heating hours over the heating season. A reduction in heating hours should then result in a lower mean living room temperature for that flat.
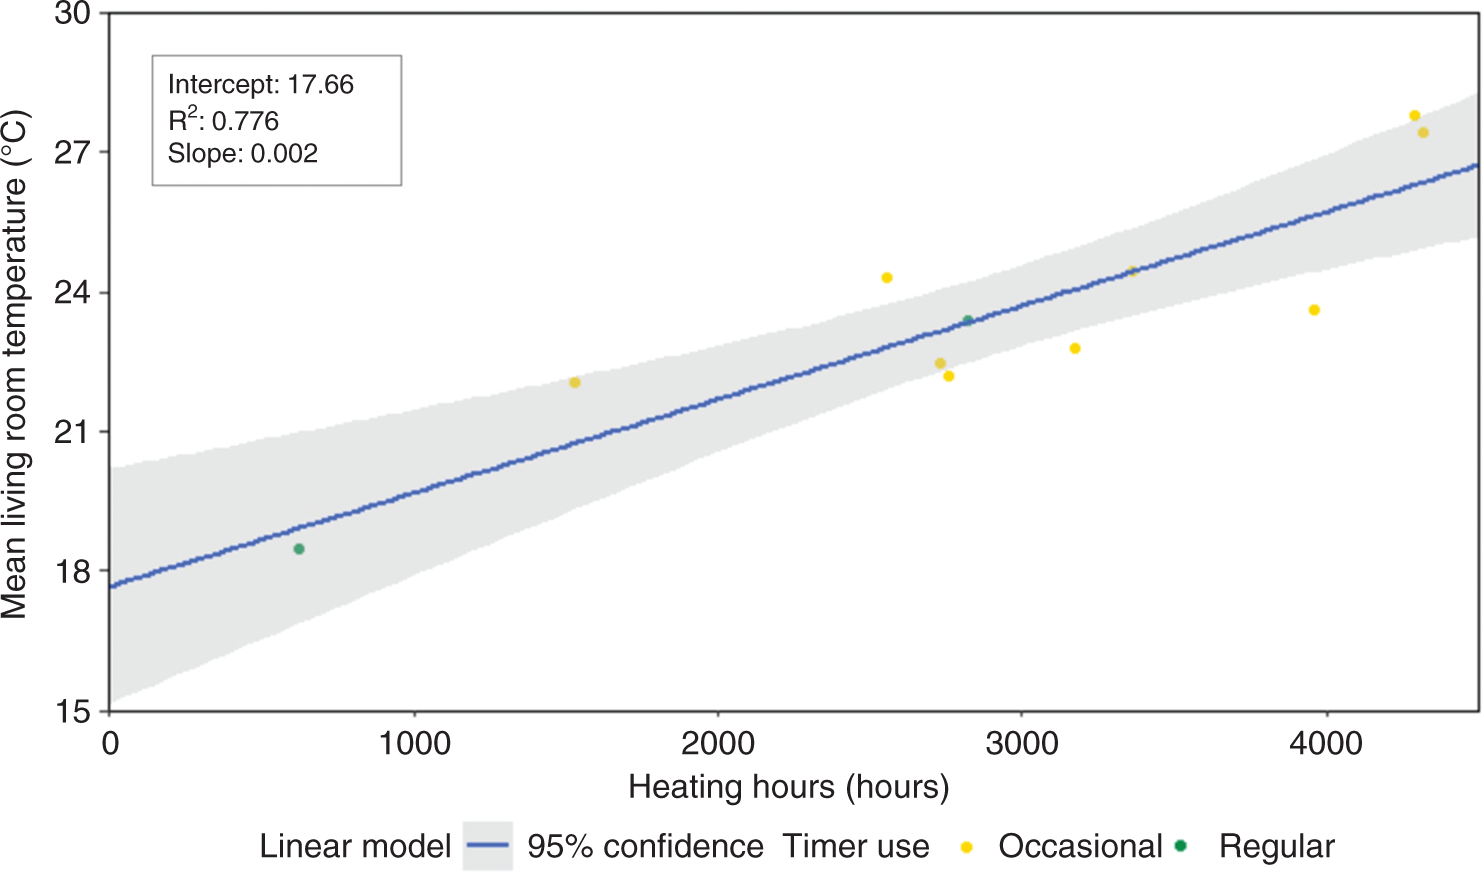
Mean living room temperature vs. heating hours – flats that use the timer (October 2017–April 2018).
Conclusions
This study has shown that most of the tenants of the Charles Dickens Estate Heat Network are adapted to living at temperatures higher than the self-reported expected temperature of 20.6°C and above the WHO and Public Health England recommendations.
This is potentially precarious for the tenants, who may struggle to adapt to lower internal temperatures or face much higher heating bills if the method of charging for heat were to change or the tenant had move to a dwelling where heat is charged based on individual use.
The primary method of heating control demonstrated within the flats on the heat network is to ‘Leave on and adjust TRVs’ and amongst these users, more than half do not interact with the heating system at least twice per day. The observed primary control method is inherent to the current method of charging for heat. Such shared heat cost recovery models allow tenants to use large amounts of heat without any perceived financial penalties, which results in wasteful behaviour. As previously discussed, in practise, the current model is calculated from the average actual network costs over the past five years. Therefore, the model would account for a continual increase in heat use across the site and slowly recover the resulting costs from the tenants. Thus, the lack of financial penalty for excessive heat use would be falsely perceived.
This area of Portsmouth is one of the most deprived areas in England in terms of Index of Multiple Deprivation. Yet by charging for heat as a fixed weekly cost as part of the tenants’ rental fees, the Council provides heating to over 500 dwellings on the network and consequently none of these suffer from fuel poverty.
However, the Council must find a solution to increase tenant engagement with the heating controls and reduce the adapted high indoor temperatures observed, without negatively impacting wellbeing, be that physical or financial.
This article has clearly demonstrated in Figures 3 and 10 that there is a positive correlation between the mean living room temperature and heating hours. Therefore, a reduction in heating hours across the network would help to decrease the mean living room temperatures.
Figure 8 showed a modest negative correlation between heating and the number of manual interactions with the heating controls, where interaction is in addition to the use of the timer function on the programmer.
This study therefore recommends:
The introduction of a programme to educate all the tenants of the four high-rise tower blocks on the CDE Heat Network to better understand the heating controls and their operation. It is hoped that a developed understanding of the heating controls would lead to greater manual engagement, in addition to the use of the timer function. To implement a targeted educational programme to tenants who never use the timer function, phased by the user types highlighted in Figure 6. T1 tenants would be a good starting point. These tenants showed that, on average, they interact with the heating at least twice per day, and significantly more in some instances. As this group has demonstrated a higher level of engagement with the heating controls already, they may be able to quickly understand and implement the use of the timer function. T2 users showed little engagement with the heating controls but did use the heating for more hours across the heating season than T3. In addition to introducing the use of the timer function, these users may need to be frequently re-educated to encourage greater manual engagement with the heating controls. T3 users are the least time-sensitive group for education. They currently engage less with the heating, resulting in lower heating hours and interactions with the controls. They have a mean living room temperature of 20.22°C, which is within the WHO guidelines. It is assumed that these tenants choose to live at this temperature so do not require immediate engagement with the education programme.
These findings are intended to inform Portsmouth City Council on how they can successfully encourage a reduction in the high adapted indoor temperatures observed at the CDE Heat Network, through greater occupant engagement with the heating controls, without negatively impacting on wellbeing. However, these findings may not be unique to this site. Heat networks and communal heating schemes which implement the same type of fixed-rate, shared heat cost recovery model may benefit from a review of indoor temperatures and heating behaviours using the approach outlined in this study.
Footnotes
Acknowledgements
Declaration of conflicting interests
The author(s) declared no potential conflicts of interest with respect to the research, authorship, and/or publication of this article.
Funding
The author(s) disclosed receipt of the following financial support for the research, authorship, and/or publication of this article: It is also supported by EPSRC under grants: EP/J017698/1, Transforming the Engineering of Cities to Deliver Societal and Planetary Wellbeing, EP/N010779/1, City-Wide Analysis to Propel Cities towards Resource Efficiency and Better Wellbeing and EP/K012347/1, International Centre for Infrastructure Futures (ICIF).