
Abstract
The Low Carbon Futures tool provides a probabilistic assessment of future overheating risks and cooling demands for domestic and nondomestic buildings in the UK. The approach adopted for the development of the Low Carbon Futures tool includes academic rigour within the development of the calculation engine, and also practitioner feedback throughout the process. This paper discusses the journey of the tool from modelling and simulation to the practitioner engagement, which took place by means of a questionnaire, focus groups and interviews with building design professionals aimed at understanding how the issue of overheating in buildings is being addressed. Throughout these events, the synergies between designing for low-carbon targets and designing for a future climate were explored. A final dissemination event was held to identify output styles that could be generated by the Low Carbon Futures tool that would be more practical and useful for specific client types. The workshop discussions serve to shape the outputs from the tool, and the feedback gathered will be used to inform a number of output styles, based on client type.
Introduction
The effects of changing climate in the UK are leading towards potentially hotter, drier summers and milder, wetter winters. 1 The significant risk of increases in mean temperature by the end of this century might mean uncomfortable high internal temperatures for building occupants. Some modern highly insulated buildings are already experiencing uncomfortably high internal temperatures, even in fairly moderate summers. This demands us to adapt the way in which we design, construct and use our buildings to combat the anticipated changes. Excessive heat gains from both internal and external sources alongside inappropriate or ineffective ventilation strategies are amongst the fundamental concerns that must be understood and addressed by designers. 2 Mechanical ventilation is an energy-intensive process, and air-conditioning is even more so. The major challenge faced by the building industry is, therefore, to design energy-efficient buildings that not only provide thermal comfort and acceptable indoor air quality but also consume less energy.
Significant efforts are required to inform building design processes to best adapt to changing climates. Any message that warns of the dangers of climate change should also clearly provide solutions – solutions that are both effective and possible for industry to perform or support. 3 The 2010 release of the UK probabilistic climate data projections (UKCP09) by UK Climate Impacts Programme (UKCIP) provides in-depth information to understand the risks posed by an uncertain future. 4 The Low Carbon Futures (LCF) project has developed a tool to integrate these complex probabilistic projections to understand potential overheating risks in buildings. The academic rigour of the LCF tool indicates that this will help design teams make early provisions (adaptation) to avoid these future risks.5,6 However, this raises the question of whether practitioners think the same? Often the best research ideas are poorly communicated to industry practitioners and thus they cannot be meaningfully adopted and used to affect change. Throughout the development of the LCF tool, feedback was sought from building professionals to tailor and steer the format and outputs of the tool to increase relevance and practicality.7,8 This two-way communication also served as a medium to bridge the gap between research and practice, by raising awareness of future overheating risks in buildings.
This paper presents the journey of four years of intensive research of the LCF tool development and sums up the modelling and simulation process as well as the practitioner engagement process. In particular this paper talks about a specific dissemination and discussion workshop that was held with a targeted audience, to better understand how the LCF tool can be adapted and used in industry, particularly for overheating analyses. The workshop discussions serve to inform how further investigation should be made into expanding the use of the tool and to shape a number of output styles, based on client type.
The LCF tool development
At a glance, the four-year journey (2009–2013) of the LCF tool development can be seen in Figure 1. The modelling and simulation process involved producing a calculation engine, which provides significant simplification to the complex building and climate information in determining the risk of a specific building overheating in the future.5,6 The practitioner engagement process involved interaction with representatives from the building industry to assess attitudes, opinions and preferences and to tease out the issues of designing buildings for potential future summer overheating risks.7,8 How the two processes are linked and how it led to the evolution of the LCF tool is explained in the sections given below.
The journey of the LCF tool.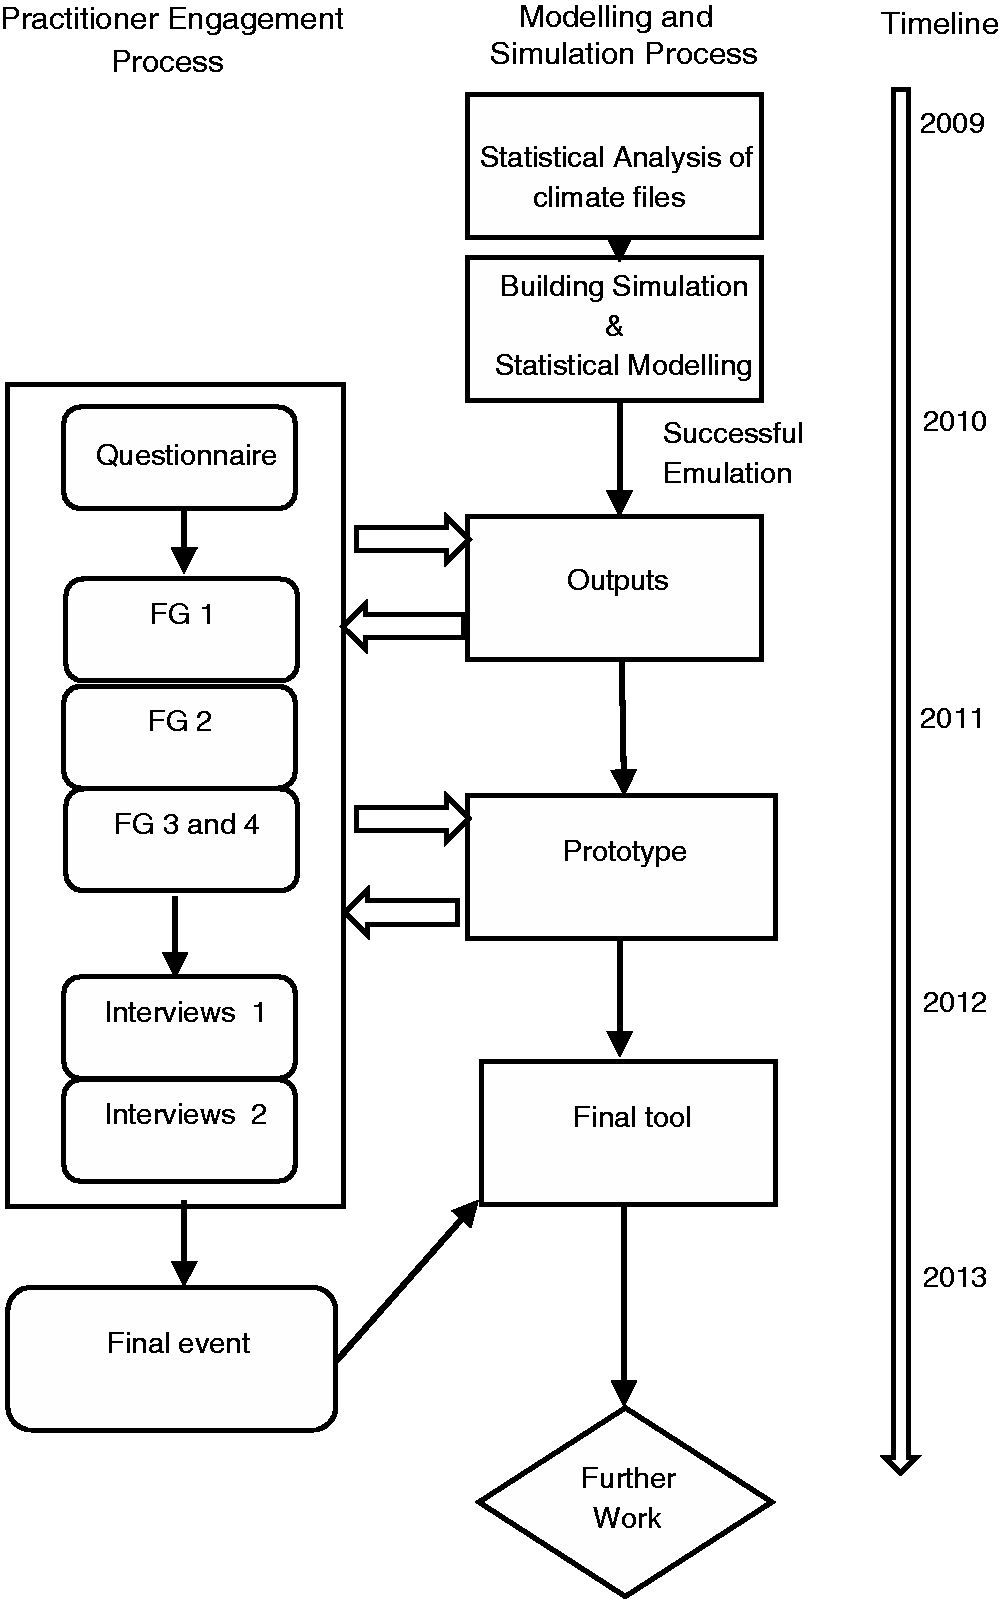
Modelling and simulation
This section presents some brief accounts on the modelling and simulation process involved in the development of the LCF tool.
Statistical analysis of climate files
The LCF project proposed to explore the potential of the latest climate information developed by the UK Climate Projection (UKCP09) programme with dynamic building simulation, for conducting detailed overheating risk analyses of the UK built environment in a future climate. The first step in the development of the LCF tool involved the processing of the climate information effectively for use with the dynamic simulation modelling (DSM), processed consistently with the different climate scenarios. The LCF study employed ESP-r 9 as a building simulation engine, which requires annual climate files at an hourly resolution. For each user-specified climate scenario, the ‘Weather Generator’ tool available from UKCP094 can generate up to 100 time series of 30 climate years at an hourly resolution. To create these 100 time series, the Weather Generator samples 100 points consistently from the underlying probability distribution of the specified scenarios and exploits the statistical characteristics of the historical data to generate these 30-year time series. With each of the 30 climate files within each of these time series having similar statistical properties, the LCF method applied a random sampling algorithm to select a single climate year randomly from each of these 100 time series to create a sample of 100 climate files for a selected scenario, which retains similar probabilistic aspects and statistical properties of the entire data set of 3000 climates years.
Detailed information on the random sampling algorithm method used in the development of LCF tool has been described elsewhere, 5 including a further justification for applying this method.
Building simulation
The probabilistic climate information is processed specifically for use with DSM (where the project carried out simulations 10 using the aforementioned ESP-r but also the commercial software IES-VE (Integrated Environmental Solutions–Virtual Environment). 11 The result is an output that preserves the hourly resolution of the simulation, but also retains the probabilistic description of the input climate data. However, the regression equation (Regression and Validation (Successful Emulation) section) that produces this probabilistic output requires an initial dynamic simulation of a building to calibrate the regression coefficients. A user of the tool would therefore carry out a building simulation for a specific design under any test weather file, much like they would for any normal building project to estimate heating–cooling loads. The tool allows the user to select what type of metric they are interested in and, therefore, what metric the regression tool will be applied to (e.g. internal temperatures, heating or cooling loads). The focus could be an individual zone or the building as a whole, using room-averaged output metrics. With the output metric chosen, the hourly output file is paired with the hourly climate file (used for that simulation) and prepared for the regression tool itself.
The use of DSM, while posing a challenge for multiple-climate simulations, is crucial for most energy analyses of more complex buildings, but particularly for overheating. Understanding how a building responds over time to transient parameters (including internal heat sources as well as weather) is important when, for example, looking at the number of hours that might exceed a temperature threshold within the building. The LCF tool is thus only applied for DSM studies.
Regression and validation (successful emulation)
In practice, DSMs are designed (particularly within commercial practice) to simulate one weather file per simulation, and simulating 100 s of UKCP09 probabilistic climate files is unlikely to be practical for a typical building project. This challenge motivates the development of the LCF tool, which involved an intensive analysis of the probabilistic climate projections by means of statistical data reduction techniques such as principal component analysis (PCA). PCA has been used to significantly reduce the dimension of weather variables that are required to calibrate a robust regression model for interfacing climate information with the DSM simulation outputs. To establish such a robust regression-based model, 72 h of historic hourly values corresponding to seven different weather variables (i.e. 72 × 7 = 504) need to be regressed against hourly DSM outputs, such as internal temperature–heating–cooling load values. However, the PCA technique used in the modelling process effectively reduces these 504 weather variables into a set of 33 components after retaining 95% of the total variability of the climate information. This makes the regression process much more efficient and allows even an ordinary desktop computer to carry out the calculation within a reasonable timescale (e.g. the regression model can produce the equivalent of 400 building simulations within an hour).
As discussed, the regression model requires just one DSM simulation for calibration and has been vigorously validated for a range of case study buildings and adaptation scenarios.5,6,8 Once calibrated, the regression model can be used to process hundreds of probabilistic climate within minutes to emulate corresponding DSM outputs and, more generally, encapsulates how that particular building will respond to climate (such that it would not require resimulation for any change in climate scenario or location). More details on the statistical methods described here can be found elsewhere. 6
Outputs
While the regression tool abbreviates the required simulation process, it still produces hundreds of hourly output files that require collation into something useable. Without this stage, the tool would not have any practical usage for a real building project. As described in Practitioner Engagement section, practitioner engagement was critical to this process. The final tool uses two types of output formats (see Preferred choices section Figure 3(a) and (b)) for different users. The first output, a probabilistic graph, emphasises the spectrum of probabilities that the tool generates and might be used for a more detailed exploration of how a building might perform under different future climate conditions. This would usually only be appropriate for someone with building modelling experience, but might be suitable for a cost–benefit analysis (e.g. deciding whether a given level of failure risk is worth achieving at a given capital cost for specific adaptation measures for that building).
The second output format is a simpler, colour-coded risk matrix that demonstrates how, for example, an overheating risk might change for future climates as well as chosen adaptations. This would be tailored towards a single failure threshold (e.g. risk that the internal temperature exceeds 28℃ for more than 1% of occupied hours) and, due to this increased clarity, might be more suitable for a client of a building project.
For more involved analysis, the individual files generated by the regression tool would also be available to any user of the model; that is, the resulting output files for every single climate file run through the tool for that building. This would be superfluous for many users, but allows for error checking and more detailed building failure identification.
Prototype
Though the engine of the LCF tool is based on complex regression techniques, it has been designed to integrate practitioner feedback (collected at different stages of the project) to develop a proficient prototype, which can be easily used by building professionals. The prototype LCF tool relies on just basic information from the user (including one DSM output file) to generate a range of probabilistic outputs indicating how a building might perform in a future climate. In addition to the climate file and building simulation file (for calibration), the user is also asked for the following input, all of which would already be known for any building simulation exercise. While ESP-r is referenced, an identical process would be carried out for other dynamic simulation software):
Number of zones used in ESP-r simulation. Floor area of each zone. Year and day type used for ESP-r simulation. Occupancy profile specifying occupied and unoccupied hours during a typical weekday and weekend. Internal heat gain and air change profiles for weekday and weekends. Total number of probabilistic climate to simulate with regression tool. Threshold values for overheating analysis. Similarly, threshold for cooling and heating plant risk analysis. Any definition of failure can be used providing it can be calculated from hourly building simulation output (e.g. a definition of overheating would not be restricted by the LCF tool, it only needs to be calculable from dynamic simulation). Geographic location and future climate scenario for overheating risk analysis. Bin size for generating probabilistic–cumulative distribution function and plots (with a default value provided). One ESPr simulation output file to calibrate regression coefficients.
The final tool
The user interface of the final tool is still in development, though the forms of output have been finalised (based on Practitioner Engagement section). Also, while further validation would allow the tool to be tested for a wider range of scenarios, building types and software (i.e. tested for emulation of software beyond just ESP-r and IES-VE), the basic calculation engine is robust for the stated applications. Further changes would be focussed on improving the efficiency even further; this could be achieved by directly integrating the tool into a specific building package, so that the regression tool could run automatically following a single building simulation.
Practitioner engagement
The research instruments for this process consisted of a preliminary online questionnaire, focus groups (FGs) and interviews aimed at getting insights into where the industry stands in relation to adapting for climate change and how to best apply the LCF project research.
Questionnaire
The practitioner engagement process began once the validation exercise (Regression and Validation (Successful Emulation) section) confirmed that a building simulation based on one climate can be adequately represented for multiple climates through a regression approach. An online preliminary questionnaire was distributed at this stage to building design professionals to get a feel for the current building design procedures as well as how typical practice differs from best practice.
7
The survey link was provided through one of the fortnightly Chartered Institution of Building Services Engineering newsletter where a total number of 43 people responded to this survey. The results indicated that the majority of the respondents do not employ any practical techniques to increase the resilience of buildings they design in order to overcome future overheating risks. Figure 2 depicts a summary of the difference between typical and best practice where the overlapped area shows parameters that are always considered. Based on the responses, it can be seen that the key focus in a typical practice is capital costs and available budget, whereas the running costs and building orientation are the key priorities within best practice. The results demonstrated that the typically adopted adaptation measure is the use of air-conditioning in nondomestic buildings where the majority of the respondents voted strongly for this followed by opening windows and the use of internal blinds. This initial exercise identified the key issues that are considered during typical or best practice design indicating the importance of these parameters for a successful adaptation strategy. These include building regulations, energy targets, client’s requirements and internal air quality. Due to the relatively low response rate, the questionnaire results were regarded as indicative only and further exploration into these issues was carried out by means of FGs and interviews with practitioners to understand their perspective.
Typical and best practice design parameters.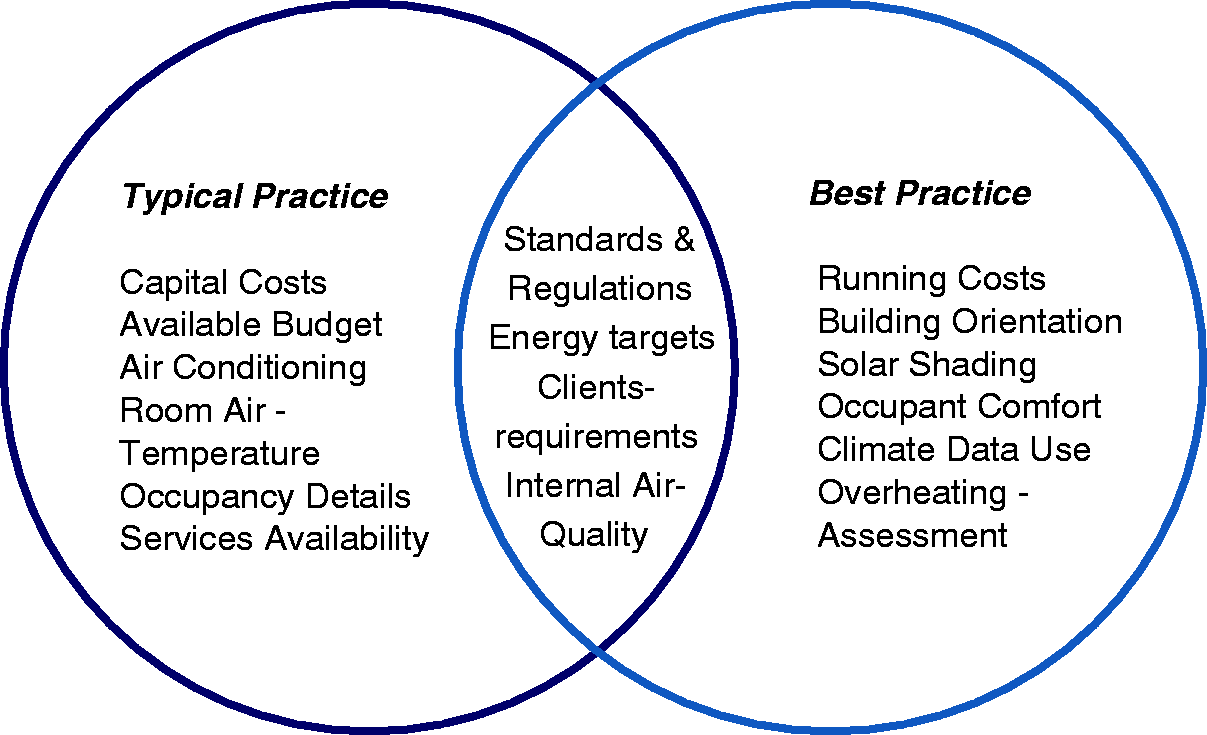
Focus groups
The second stage of the process was to interact with practitioners using FGs.7,8,12 A diversity of professionals consisting of architects, building services engineers, technical directors, energy consultants and sustainability managers were invited to participate in these sessions. The key objectives of this stage were threefold: (1) to get an indication of how welcoming the industry is for an overheating assessment design tool, (2) to identify practical ways of incorporating the LCF methodology into the current design process and (3) to get a consensus on preferred output indicating the risk for a building overheating. In this regard, four FGs were conducted: two for domestic buildings FG1 and FG2 (Figure 1) with six participants each and two (FG3 and FG4) for the nondomestic sector with seven participants each. The FGs indicated that overheating is not perceived as a significant risk, currently or in future, for the UK domestic sector. These sessions confirmed that an overheating risk assessment tool such as the LCF tool would have an impact in the nondomestic sector where the issue is gaining momentum. Where overheating assessments are currently carried out, they are usually based on the steady-state modelling which is required by current regulations and guidelines and no sophisticated dynamic modelling is used to calculate current or future overheating risks.
From this study, it emerged that for the tool to be useful and practical it needs to be efficient and in a form which can easily be incorporated into existing building modelling software. A plug-in tool to existing software as a check is deemed very useful. It has to be added to the way buildings are designed currently and not be used as a completely separate setup. This study highlighted that a complex and detailed output, accompanied by a relatively simple and understandable output, would be the most useful strategy. A simple plot or matrix with colour-coded scenarios to indicate the extent of a building overheating in current and future climates was suggested as the most useful output. The colour-coded risk matrix discussed in Outputs section was a direct result of this feedback.
Interviews
To get an in-depth insight and to confirm the trends that emerged from the questionnaire and FGs, 16 face-to-face interviews were conducted with building design professionals in two phases.7,8,12,13 Interviews 1 (Figure 1) explored the issues in the domestic sector (six in total) and interviews 2 (10 in total) were conducted with the professionals to explore the overheating risks for the nondomestic sector and in particular mechanically cooled office buildings. The practitioners agreed that the calculation of overheating is complex as there is no single fixed definition of overheating and sometimes overheating in buildings can be triggered by the cumulative effects of other factors e.g. unable to open windows due to concerns regarding security, pollution and noise or heat radiated from electrical appliances and building services such as boiler and hot water storage. Participants stated that increased levels of insulation, air tightness and inadequate ventilation can deteriorate indoor air quality, and need to be considered in the calculation. In the summer, in well-insulated and airtight homes, a higher rate of ventilation is desirable for air circulation and regulating internal temperatures preferably at all times; though changing summer temperatures in the future may result in warmer external air driving a cooling demand in the home through this supplied ventilation. Low internal air quality was deemed to psychologically encourage the perception of overheating for the building users as when people feel uncomfortably warm, they may complain about the humidity and air quality even though these are within normal limits. These interviews further explored the concept of the future failure of a cooling plant in office buildings. It was said that no such future failure exists for a cooling plant as it has a limited life time and can be easily replaced. It was said that producing an optimum solution when it comes to designing a cooling plant by modelling the entire building is sometimes difficult, as clients usually discourage carrying out significant modelling to test different options as it is time and cost intensive. It was stated that most clients think short term because it makes economic sense to apply that approach and if a measure is not likely to make a favourable return within five years then it is disregarded. The majority of the participants were of the view that a typical client would only deem adaptation strategies to be valuable if enforced by legislation.
Final workshop
To ensure the ‘message’ being communicated is appropriate and to get feedback on the LCF tool and its outcomes, a final workshop was held in London in September 2013. The target audience selected included experienced building design professionals in the private sector as well as in local authorities and housing associations (HAs), managers within architectural practices and building services engineering consultancies and experienced members of corporate (CE) organisations. This was to ensure the participants were in a position to facilitate adoption of the work by their organisations with the ultimate effects of (i) significantly reducing time for evaluating overheating risk of buildings at design stage and (ii) increasing confidence of clients in the resilience of the design proposals to future climate change. Both online and offline routes were used to promote the event to reach the target audience. Contact was made with 98 interested parties leading to 35 attendees: 34% from consultancy firms, 29% other academics, 9% local authority (LA), 9% independent industry body, 6% HA, 6% architects, 3% housing developers and 6% other (retired or unknown). The workshop comprised two sessions. Firstly, the research was explained in a series of presentations across the afternoon. These presentations were given by those who had led that particular research area, giving confidence to the attendees of the knowledge and familiarity of each subject.
Secondly, a discussion session asked attendees to work together to provide client-based solutions to the issue of how to represent overheating risk. The attendees were split into four potential client types based on the individual’s areas of expertise, requested at the time of registering attendance. The discussion required the attendees to work in groups acting on behalf of their particular client type. With eight groups in total, each client type had two groups taking part. The groups were to imagine an overheating assessment had been carried out, and that there were six potential output styles available to use (Figure 3).
The potential overheating analysis output types of the LCF tool.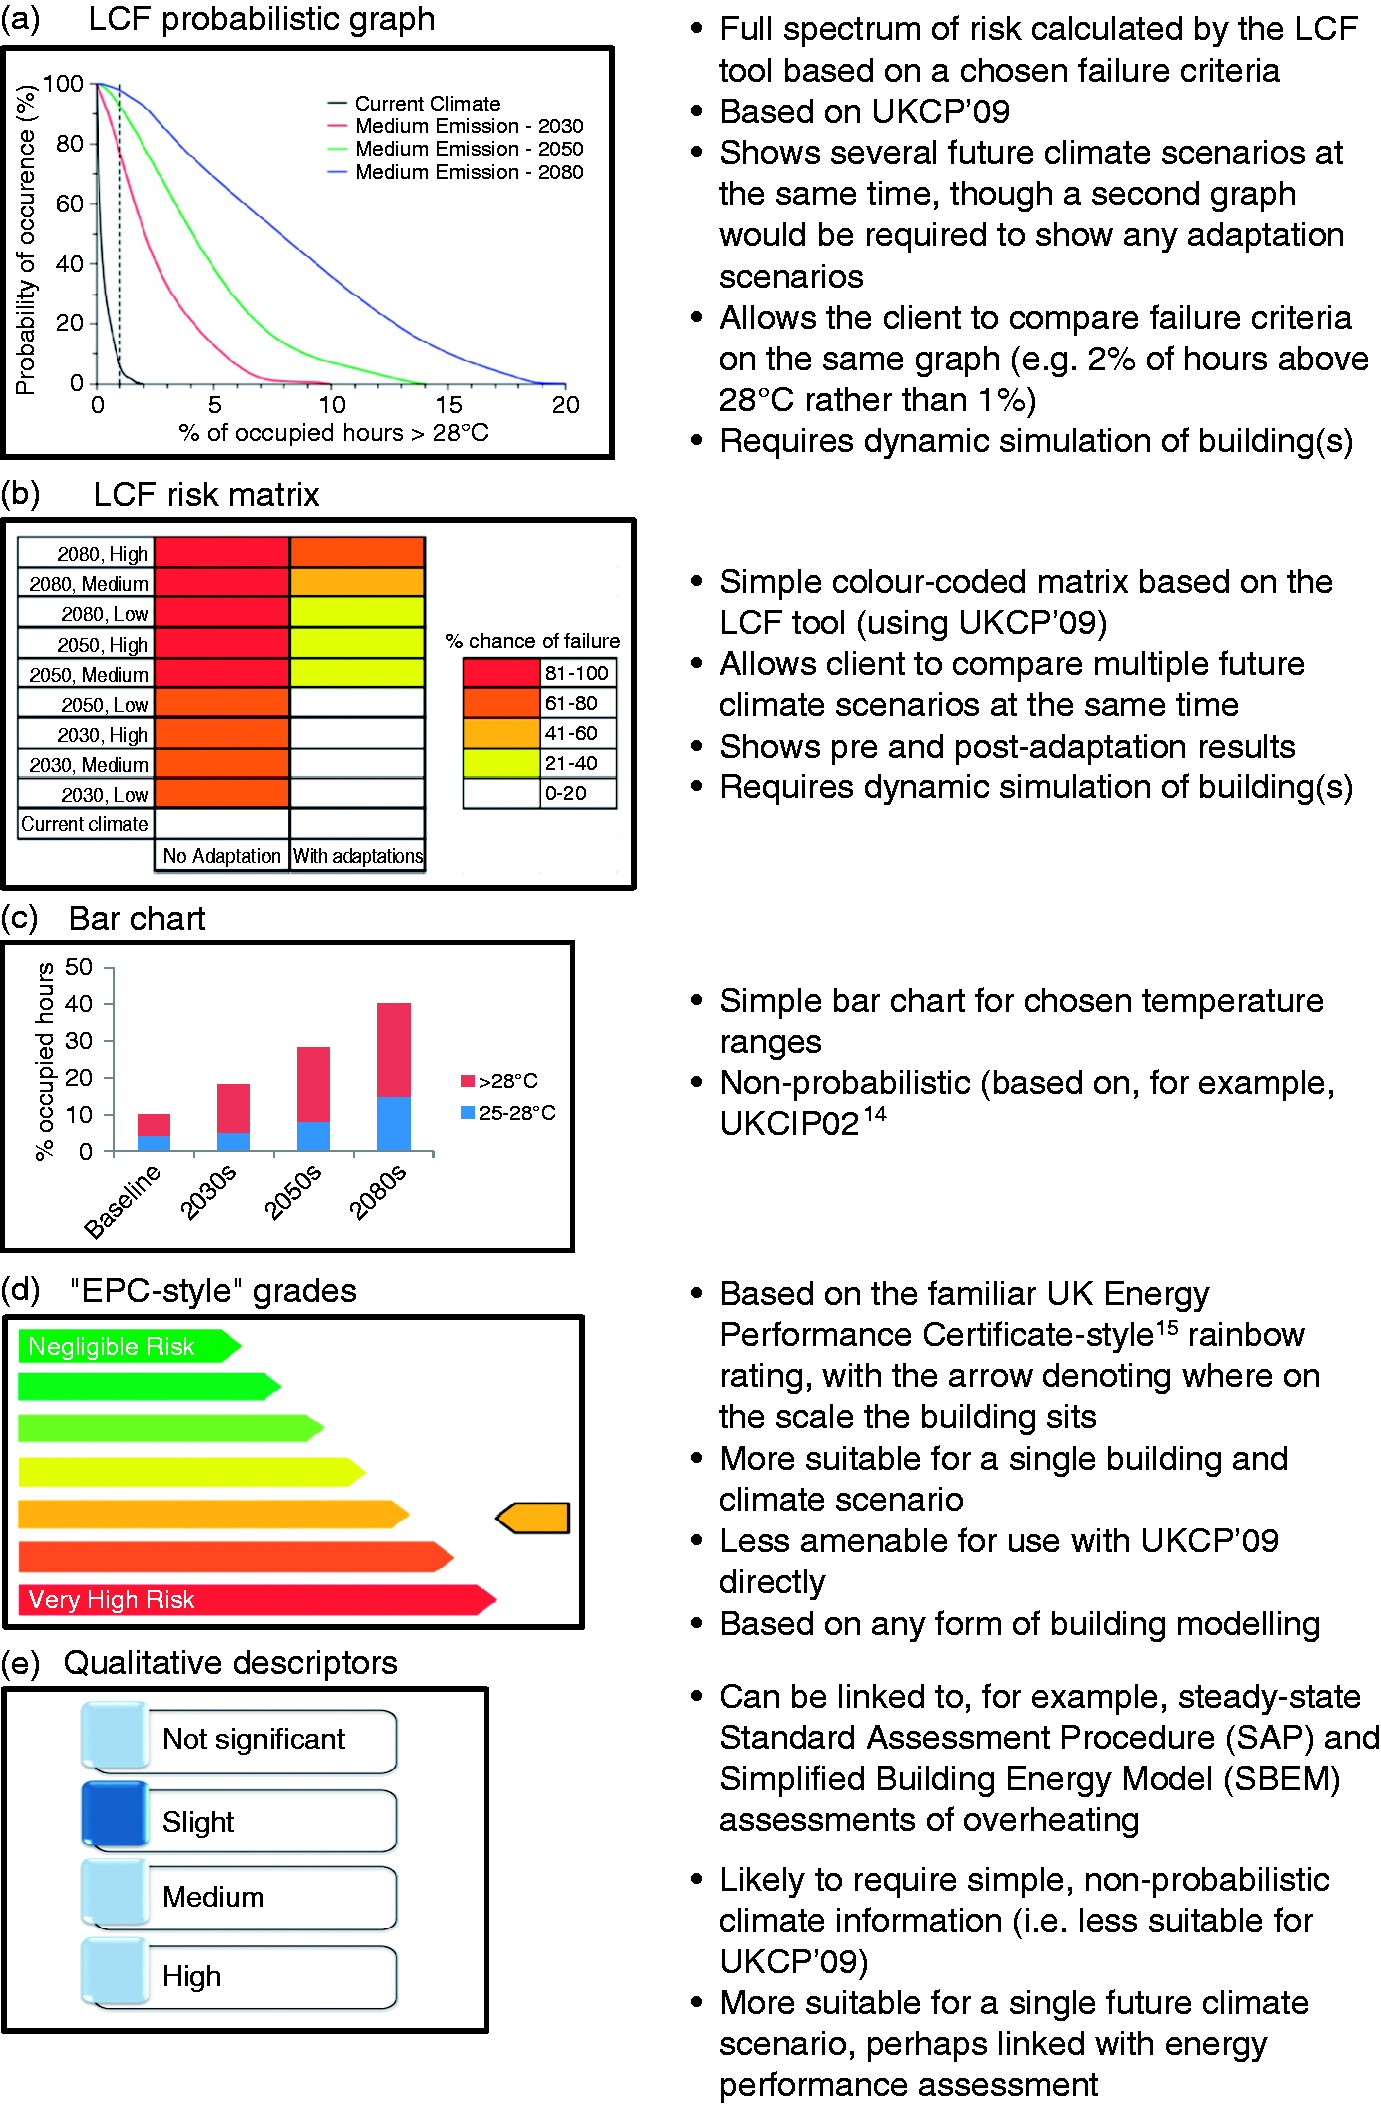
The client types and the provided scenarios are given below:
LA – with a limited budget requires an assessment of the risk of future and current overheating in its schools, with results to be displayed as an easy to understand certificate. HA – with varied stock of dwellings needs a report that indicates the likelihood of particular building designs overheating, which is easily replicable on their website and in company reports. Small–medium enterprise (SME) – with current focus on a single office building needs some guidance on whether the building can maintain summer comfort in the near future without the need for additional air-conditioning. CE – with a mixed building stock (office, retail and factory units) needs a detailed analysis on a small number of buildings to guide future decisions on heating ventilation and air-conditioning technologies and general building design.
Preferred choices
For each output type, the attendees suggested advantages and disadvantages, and identified a preferred output display. This information was collated so each client had four preferred output styles, coming from the two groups. The five main output types are described in Figure 3. The attendees were additionally invited to highlight a sixth option of their own design if the predetermined five options were not suitable. These are shown as the ‘Other’ options in Figure 4. The groups were asked to rank preferred outputs for their particular client, where each group (with two groups per client type) had a first and second choice, giving four choices for each client type. This is demonstrated by each row as shown in Figure 5.
The ‘Other’ options: Suggested overheating risk assessment output type for (a) LA, (b) SME, (c) HA and (D) CE. Preferred outputs for clients.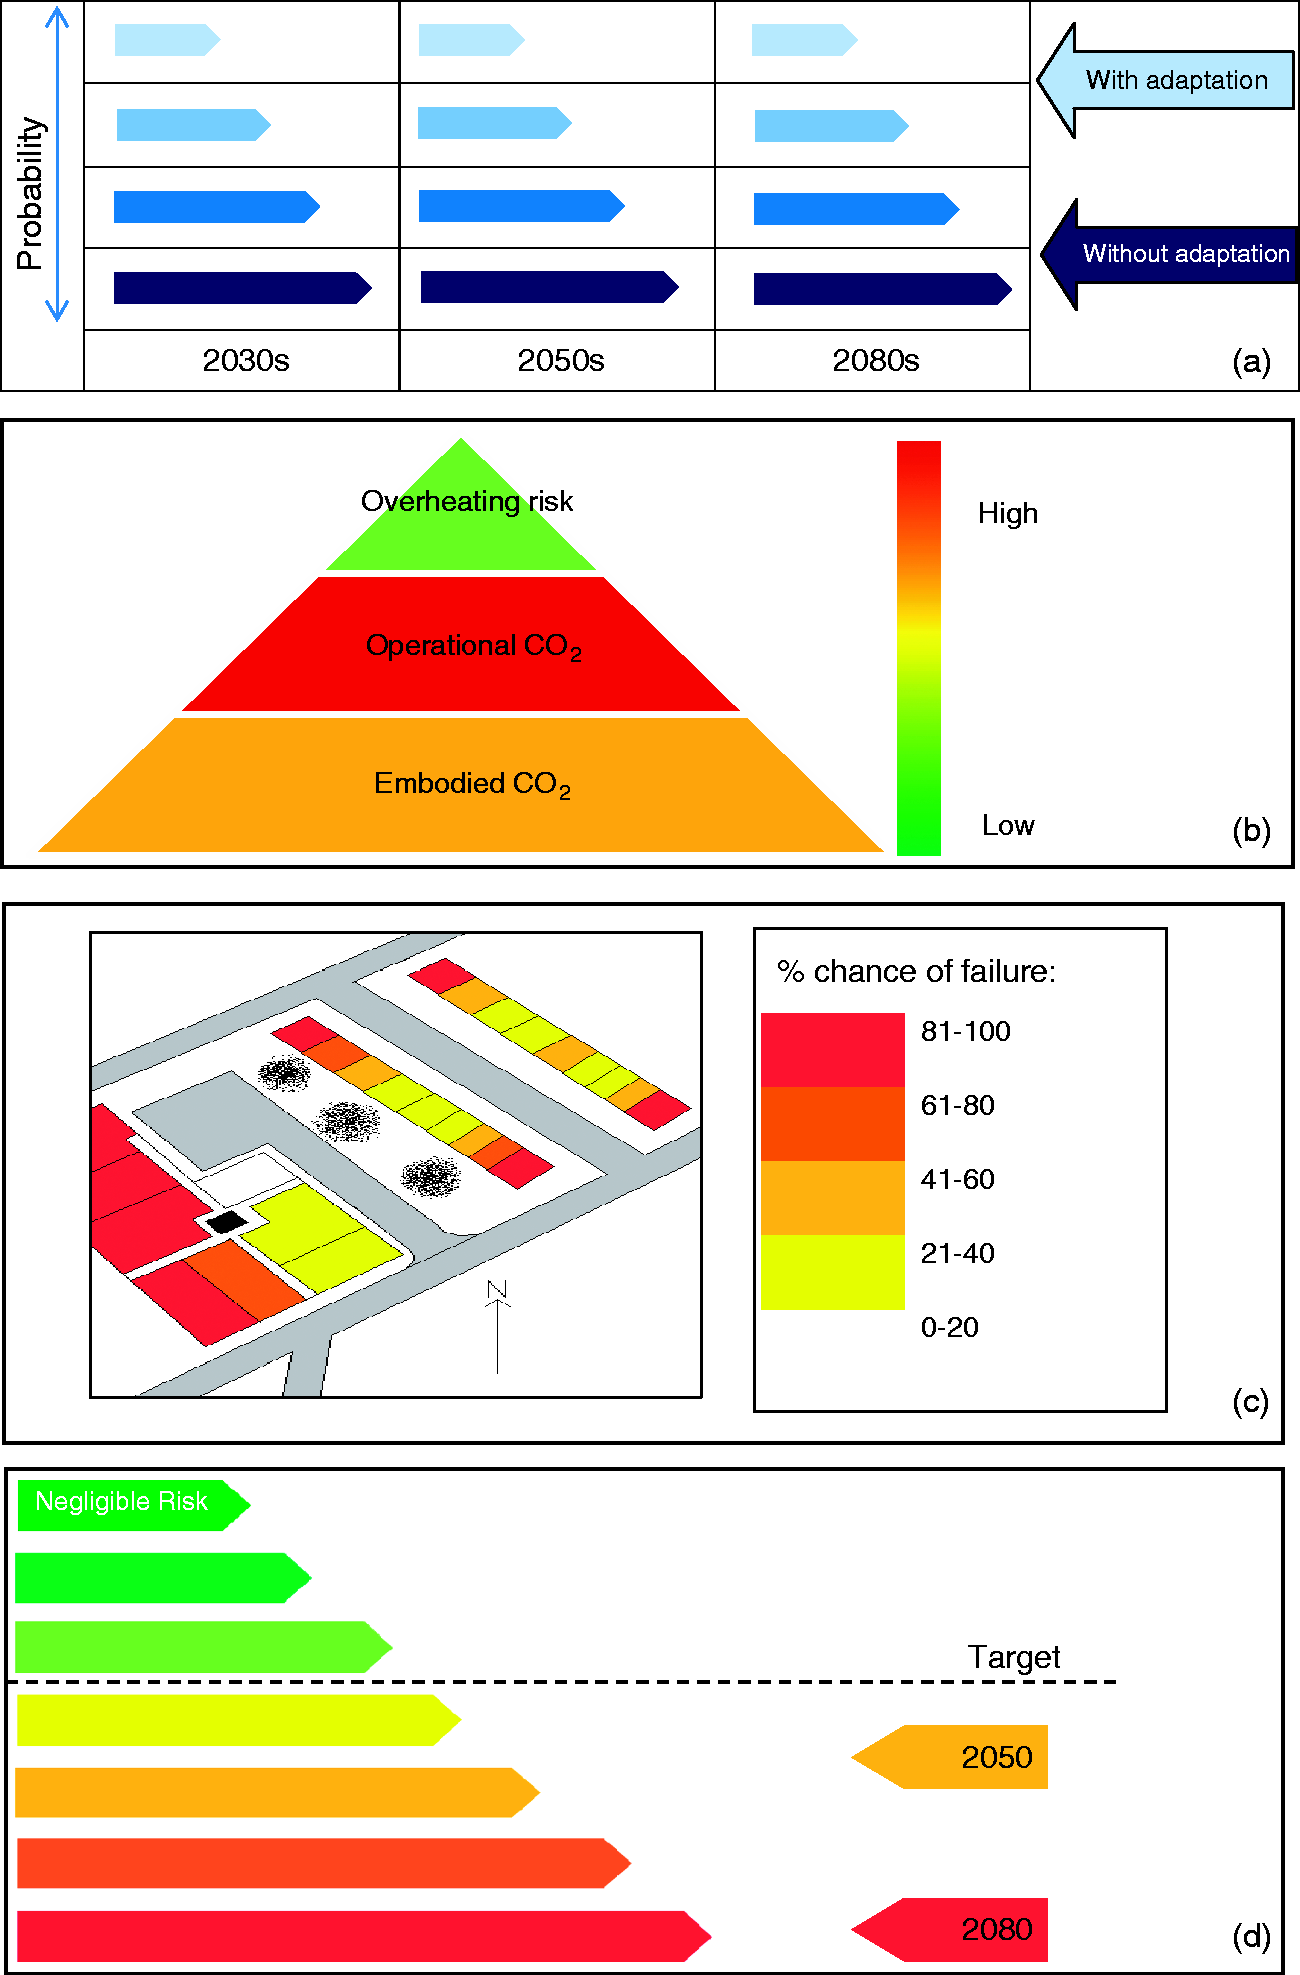
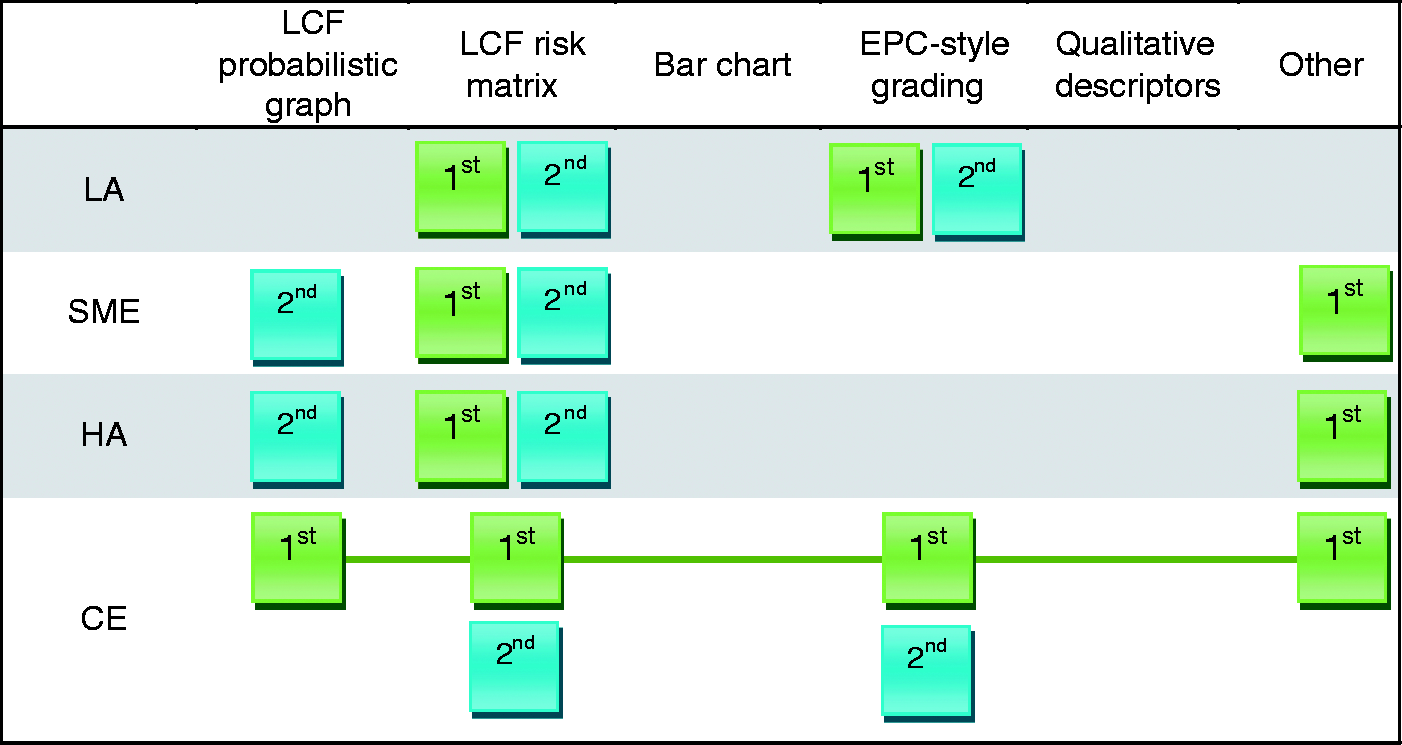
For the LA, the preferred output display was the risk matrix for decision making, ease of understanding, staged retrofit potential and ability to incorporate adaptations. Equally, the energy performance certificate (EPC)-style grading was preferred for the ease of display and fitting in with limited LA budgets.
The same output display options were chosen by those representing HAs. The risk matrix was preferred for estate agents and for existing stock, while the probabilistic graph was preferred for new-build stock. The ‘Other’ option preferred was the amended risk matrix on a site plan (Figure 4(c)) of the housing stock, with different maps for different adaptations. This could also include financial aspects for a cost–benefit analysis. The bar chart, EPC-style grading and qualitative descriptors were all too simple as they assumed identical stock.
For SMEs, the groups liked the risk matrix for its clear communication, and how it identifies where adaptations push failure further into the future. It is also a familiar style but more comprehensive than EPC-style grading. The probabilistic graph was selected to promote in-depth modelling, as it was felt that in-depth modelling should be done irrespective of cost. The ‘Other’ option preferred included a pyramid of embodied and operational carbon results in terms of primary colours (Figure 4(b)).
The groups discussing preferred outputs for the CE sector were unresolved on the ‘best’ option, as each has merit depending on the audience. For technical and professional analysis, the probabilistic graph was preferred. For decision making, the risk matrix was preferred, with the possibility of altering the colours used to a more traditional red–amber–green scale. For communication purposes, the EPC-style grading was preferred, as it is universally recognised. There was felt to be scope for extending the grading system to show the current situation as well as the situation in years to come. This is shown in Figure 4(d) and is deemed one of the preferred outputs.
Discussion and future steps
The academic research output of the LCF tool has been published previously and resulted in a relatively complex output that would possibly not be appropriate to a wide spectrum of building professionals. The practitioner feedback helped to inform how the LCF tool may be best used in the building design industry. Each step of the interaction (Practitioner Engagement section) has led to the modification or development of the tool. For example, the feedback that the future overheating assessment is not a current priority and the insights into the reasons for this has meant that the LCF tool needs to be simple, easy to use and time and energy efficient. The creation of additional outputs, which simplify the probabilistic output, is a response to feedback from the building industry. 12 Throughout this engagement process, it was highlighted that air quality is one of the key parameters considered in building design and therefore reducing the risk of overheating by performing an additional overheating risk calculation can result in improving the perception of users towards air quality.
The final workshop clearly identified that no one output is suitable for all client types. Clients have different requirements and therefore tailoring the outcomes to suit a particular client type will increase the uptake and affectivity of the tool. It was seen that there is a need to identify the audience prior to selecting a particular output type and there needs to be a balance between simplicity, complexity and content. A recurring theme was that the LCF tool is useful to all the sectors being discussed, and further investigation should be made into expanding its use. In its current state, the LCF tool is capable of providing in-house consultancy services to the interested parties and stakeholders. To provide greater accessibility, the tool could be further developed and based on practitioner feedback,12,13 this may be done potentially in three possible ways; (1) incorporating the tool into existing DSM packages, (2) formulating the tool as a stand-alone piece of software and (3) setting up the tool as an open access online tool. This however, would require further investigation and validation where each possibility has its merits and demerits. For example, option 1 means restricting to one DSM package only and therefore the users of that specific package can only benefit in comparison to option number 3 where an open access online tool can attract a large number of audience, but will require constant updating to stay efficient. For option 2, proposed software can exploit fast-processing programming languages and an efficient user interface.
Conclusions
The recent trend in the building industry has been to reduce the amount of energy needed for heating by utilising highly insulated fabric and passive solar design. While these measures have been effective in reducing the space heating demand in the winter, they can potentially lead to undesirable overheating in summer currently and in future. To deal with the consequences of the impact of overheating, knowledge of the probability of overheating in the future climate will be a key requisite. The LCF Project investigated the use of the UKCP09 climate projections within building performance simulations and developed a methodology to identify the risk of buildings failing in a future climate, due either to excessive overheating or to inadequate capacity in existing cooling systems. The LCF tool combines dynamic building simulation and probabilistic climate projections, both of which are computationally intensive, in a format that is potentially compatible with commercially available software. The LCF tool not only assesses the future overheating risks but also suggests the effect of the adaptation choices, so that the design can be sensitive to the uncertainties of future climate projections. The LCF tool can therefore be applied to the simulation results of any building and use any criterion for overheating or building failure.
This research has highlighted that the most important drivers considered at the design stage are the thermal characteristics of the building, available budget, comfort criteria and internal air quality. Low internal air quality was also deemed to psychologically encourage the perception of overheating for the building users. Respondents of this research exhibited a positive interest towards the use of probabilistic climate data in future designing for tackling overheating risks and encouraged further investigation into expanding the use of the LCF tool. This paper outlined the development of the LCF tool and discusses the practitioner feedback obtained from industry professionals on the use and applicability of the tool, in a final workshop hosted by the LCF research team in London. The general consensus from the final workshop reconfirms the outcomes of the FGs where it was said that the design tool would benefit from having a simpler form of output alongside a more complex research output. The qualitative descriptors were universally not selected as preferred outputs as they are too simplistic and do not contain enough information. The LCF probabilistic graph was considered too complex and expensive for clients with limited budgets such as HA or LA. Something quite visual and possibly for use in an EPC-style display was thought to be useful, but with a careful balance to be struck between the complex calculations required to draw reliable conclusions, and the ease of display and its understanding. The LCF risk matrix (or a variation of) was universally chosen as a preferred output, with its ability to include multiple adaptation variations and include probabilistic information projecting into the future. It represented a compromise between complexity of analysis and the simplicity of the output. A bespoke building or client-focused presentation of this matrix may however be preferred for different client types.
All practitioner workshop participants were keen to see the LCF tool used within the building design community and could envisage the advantages of having a comprehensive yet easily understood tool. In its existing form, the tool has a lot of potential to be further developed. This will require further investigation to look into avenues such as converting it into a commercial piece of software, integrating the tool with an existing DSM or developing it as an open access online tool.
Footnotes
Acknowledgements
Appreciation is also extended to Dr Vicky Ingram for successfully organising the final event in London funded by Heriot-Watt EPSRC Impact Acceleration Awards Grant.
Funding
Low Carbon Futures is part of the Adaptation and Resilience to a Changing Climate (ARCC) programme sponsored by the Engineering and Physical Sciences Research Council (Grant no. EP/F038240/1). This work is also sponsored by Heriot-Watt EPSRC Impact Acceleration Awards (Grant no. EP/K 503915/1).
Conflict of interests
None declared.