
Abstract
A comprehensive theory of child language acquisition requires an evidential base that is representative of the typological diversity present in the world’s 7000 or so languages. However, languages are dying at an alarming rate, and the next 50 years represents the last chance we have to document acquisition in many of them. Here, we take stock of the last 45 years of research published in the four main child language acquisition journals: Journal of Child Language, First Language, Language Acquisition and Language Learning and Development. We coded each article for several variables, including (1) participant group (mono vs multilingual), (2) language(s), (3) topic(s) and (4) country of author affiliation, from each journal’s inception until the end of 2020. We found that we have at least one article published on around 103 languages, representing approximately 1.5% of the world’s languages. The distribution of articles was highly skewed towards English and other well-studied Indo-European languages, with the majority of non-Indo-European languages having just one paper. A majority of the papers focused on studies of monolingual children, although papers did not always explicitly report participant group status. The distribution of topics across language categories was more even. The number of articles published on non-Indo-European languages from countries outside of North America and Europe is increasing; however, this increase is driven by research conducted in relatively wealthy countries. Overall, the vast majority of the research was produced in the Global North. We conclude that, despite a proud history of crosslinguistic research, the goals of the discipline need to be recalibrated before we can lay claim to truly a representative account of child language acquisition.
On current best estimates, there are approximately 7000 languages currently in use (Eberhard et al., 2021). A key feature of natural languages is their vast diversity, which is evident at every level of analysis (Evans & Levinson, 2009). At the same time, languages are dying at an alarming rate (Evans, 2010). Work by Campbell et al. (2013) and Seifart et al. (2018) shows that over 3000 languages are moribund, endangered or nearly extinct. Almost 50% of the world’s languages are projected to be lost by the end of this century, with one language dying, on average, every 3 months. In our recent history as a species, we have evidence for the loss of 100 language families (out of an estimate of around 420, Campbell et al., 2013). The overall effect is that the world is rapidly losing linguistic diversity at rates greater than biodiversity loss (Seifart et al., 2018; United Nations Intergovernmental Science-Policy Platform on Biodiversity and Ecosystems Services, 2019).
Such rapid language loss has serious implications. First and foremost, each death is a tragedy for the cultural groups who lose their language. Language plays an integral role in the lives of humans; the loss of language has profound human cost because it is through language that we encode and transmit cultural and intellectual knowledge (Evans, 2010; Holtgraves & Kashima, 2008; Vygotsky, 1962), or as Hale (1992) put it, ‘the priceless products of human mental industry’ (p. 36). Language also asserts our social identity as members of a particular culture or cultures (Gallois et al., 2005; Giles et al., 1991), and in minority groups its preservation is linked to higher wellbeing (Gibson et al., 2021; Hallett et al., 2007). Language loss also represents a significant loss for our science; in scientific terms, every language death represents a lost opportunity to understand the boundaries of diversity in the human language faculty. This point cannot be over-emphasised; the still waters of language diversity run deep (see, for example, Box 1 in Evans & Levinson, 2009). A comprehensive theory of any language phenomenon requires a representative sample that provides a solid foundation for theory building, and an even bigger sample for theory testing. As more and more languages disappear, we rapidly lose opportunities to better understand our object of study.
Language coverage across the sub-disciplines of the language sciences has been historically uneven. Reviewing progress in the field of language documentation (which emerged as a response to rapid rates of language loss, Hale, 1992; Himmelmann, 1998), Seifart et al. (2018) reported that we have basic word lists for around 89% of the world’s languages, and a grammatical description of some sort for around 60%, but that further effort to improve language coverage is needed because work on understudied languages continues to expand the hypothesis space of what is possible in natural language. 1 Indeed, instead of resulting in diminishing returns, the concentrated focus on documentation over the last 30 years has resulted in a rich new picture of what is possible in language, such that ‘the documentation of linguistic diversity keeps turning up new phenomena that had either been considered impossible or simply had not been contemplated as linguistic categories’ (Seifart et al., 2018, pp. e328–e329).
Although we are similarly bound to account for language diversity, psycholinguistics has a comparatively poor record of studying diverse languages. For instance, Jaeger and Norcliffe (2009) reported that adult language production studies have covered only 0.6% of the world’s languages. In a wider analysis, Anand et al. (2011) reported that 85% of adult psycholinguistic studies were based on only 10 languages (30% of which were on English). There has been no comprehensive study of the number of languages studied in the field of child language acquisition, although there have been a few estimates. Lieven and Stoll (2009) estimated that we have child language data for approximately 70 to 80 of the world’s languages (approx. 1%). In a retrospective look at articles published in the Journal of Child Language between 1974 and 2013, Slobin (2014, see also Crystal, 2014) 2 reported that the journal had published at least one article on 61 different languages. This figure, however, was skewed: 27/61 (44.3%) were from the Indo-European family, with the remainder coming from different language families and regions. There were several notable features of these skewed data: while more than half of the languages reported came from outside of the Indo-European family, a striking 1240/1425 (87%) of the total number of articles in the journal were on Indo-European languages, with most of those articles dealing with the acquisition of English (975/1240, 78.6%). Thus, English made up 975/1425 = 68.4% of the entire published work of the journal in its first 40 years, although there was an encouraging downwards trend, where the proportion of articles devoted to English had steadily declined across time. This downwards trend was complemented by a slow increase in the number of articles on new languages. Overall, while there is some degree of typological diversity in the published archives of the field’s longest standing journal, we know very little about languages outside of the Indo-European family. In fact, apart from a handful of languages that had ten or more articles (Cantonese, Hebrew, Korean, Japanese, Mandarin and Tamil), most non-Indo-European languages had only a few, with the modal number being one. A similar though smaller analysis by Kelly and Nordlinger (2014) showed similar results.
It is important to consider what is at stake here. Our field has a justifiably proud tradition of crosslinguistic work, as is most prominent in Slobin’s (1985–1997) Crosslinguistic Study of Language Acquisition series and in other landmark projects like Berman and Slobin’s (1994) crosslinguistic ‘frog story’ narrative project and MacWhinney and Bates’ (1989) Crosslinguistic Study of Sentence Processing (for overviews, see Bavin, 1995; Berman, 2014; Bowerman, 2011; Lieven, 1994; Lieven & Stoll, 2009). The Child Language Data Exchange System (CHILDES; MacWhinney, 2000), which pioneered data archiving and sharing, currently has naturalistic or semi-naturalistic data for 45 spoken languages across its monolingual and multilingual corpora (approximately 53% of which are Indo-European languages). 3 The goal of crosslinguistic research is to identify universal and language-specific components of language acquisition (Slobin, 1973, 1985–1997; Slobin & Bowerman, 2007). Insofar as language documentation research continues to extend the boundaries of what languages can do, it would seem that we should pay attention to a wider array of languages to avoid making errors regarding what might be universal. In casting the widest possible net, we, in words of Bowerman (2011), ‘guard against parochial explanations of language acquisition’ and move ‘towards theories that do justice to language diversity’ (p. 616). Otherwise, we run the risk of making incorrect generalisations on the basis of a limited and skewed data set.
A casual look back over some past theoretical debates in the field has shown that work on lesser studied languages has had a profound impact on theory testing and development. Work on child-directed language in languages like Kaluli, Samoan and K’iche’ challenged and ultimately falsified the assumption that the prosodic and grammatical modifications observed in ‘motherese’ in languages like English, German and French were a universal component of the child’s input (Bernstein-Ratner & Pye, 1984; Ochs & Schieffelin, 1984; Pye, 1986; see also Ingram, 1995). Work on K’iche’ (Pye & Quixtan Poz, 1988), Zulu (Suzman, 1987), Sesotho (Demuth, 1989) and Inuktitut (Allen & Crago, 1996) falsified arguments that the passive voice is late-acquired due to the delayed maturation of components of Universal Grammar (Borer & Wexler, 1987). Work on ergative languages challenged the utility of Pinker’s (1984, 1989) innate linking rules, and the inherent complexity and variability in ergative marking across languages questioned the likelihood that they could be described by parameter-setting approaches (Pye, 1990; Van Valin, 1992; see also papers in Bavin & Stoll, 2013). The graveyard of child language theory past is populated by the handiwork of crosslinguistic assassins.
Other crosslinguistic work has served as a testing ground for theory testing and refinement. Cross-cultural studies of children’s linguistic environment continue to expand the types of conditions under which children are socialised into language (Brown, 2012; Casillas et al., 2020; de León, 2012; Ochs & Schieffelin, 2012). Work on highly inflected languages has challenged theoretical approaches to morphological acquisition that postulate the use of abstract rules (Marcus et al., 1992; Pinker, 1999), and instead provide evidence in favour of schema-based generalisations (e.g. Dabrowska & Szczerbinski, 2006; Engelmann et al., 2019; Forshaw, 2021; Granlund et al., 2019). Work on sign languages, a large proportion of which are endangered (Woodward, 2018), places crucial constraints on theorising and reveals how the core features of the language faculty emerge independent of modality (Morgan, 2014; Sandler & Lillo-Martin, 2006). Our own work on children’s processing in languages like Cantonese, Mandarin and Tagalog has shown that online parsing choices are intimately tied to input frequency (e.g. Chan et al., 2018; Garcia, Garrido Rodriguez & Kidd, 2021; Yang et al., 2020), and cannot be explained solely with reference to abstract, language-independent grammatical principles. In terms of contribution, when we ask the right questions of them, research on lesser studied and typologically diverse languages can move us forward at a faster rate than work on typically studied European languages.
The predominantly Indo-European bias in our research raises other questions about diversity in our discipline concerning the producers of our canon of knowledge. As a discipline child language acquisition spans the fields of linguistics and developmental psychology, and the latter discipline is very much centred in the Global North. Nielsen et al. (2017) reported an analysis of articles published in the top-ranking developmental psychology journals (Child Development, Developmental Psychology and Developmental Science) between 2006 and 2010, finding that 90.52% of articles were based on participants drawn from the United States, Europe or other wealthy English-speaking countries (i.e. Australia, Canada, New Zealand and the United Kingdom). It is fairly safe to assume that the studies were mostly conducted by researchers in those same countries, suggesting that the means of research production is concentrated there. This is not surprising: research in the social sciences and humanities is a privilege afforded to us by wealth. However, if we truly aim to build theories of what it means to be human, we need to ask ourselves whether whole research disciplines that concentrate almost exclusively on Western, Educated, Industrialised, Rich and Democratic societies are an acceptable state of affairs (Heinrich et al., 2010). If it is not, then we need to develop ways to make it more accessible to a greater proportion of the world’s population (Defina et al., 2021; Hellwig et al., 2021; Pye, 2021).
In this article, we take stock of the last 45 or so years of modern child language research by analysing the distribution of languages and topics reported in our four main journals (Journal of Child Language, First Language, Language Acquisition, Language Learning and Development) from each journal’s inception to the end of 2020. We first ask (1) what kind of participant groups (monolingual, multilingual) feature in the journals? We then ask (2) for how many different languages do we have published articles? (3) what is the frequency distribution of languages across the data and, following Slobin (2014), has this changed across time? (4) what is the frequency distribution of topics studied in the field, and does this vary by language category and over time? and (5) who are the producers of our knowledge, and has this changed over time?
Method
Inclusion and exclusion
We screened 3123 articles published in language acquisition journals from their initial issue until the end of 2020: Journal of Child Language (JCL, from 1974: 1809 articles), First Language (FL, from 1980: 696), Language Acquisition (LA, 1990: 346) and Language Learning and Development (LLD, 2005: 272). This number does not include editorials, introductions, book reviews, commentaries, replies, corrections or errata, memorials, acknowledgements (e.g., of reviewers), dissertation notices, reprints, memorials, and award announcements, all of which were automatically excluded. We excluded a further 297 articles that did not report primary data on child language acquisition (96 JCL, 33 FL, 88 LA, 80 LLD). Reasons for exclusion included theoretical article, methodological article, insufficient information on data (e.g. anecdotal reports of children’s productions), only adult or non-human data (e.g. computational modelling or non-human animal), children’s real language skills not tested (e.g. artificial grammar learning study, non-word repetition), and reanalyses of previously reported data. Overall, 2826 articles were included in the analyses.
Annotation
The articles were distributed among three research assistants. They coded each included article on the following dimensions: (1) year of publication, (2) participant group type (mono- vs multilingual), (3) languages studied (including the language family), (4) topic/s studied and (5) country of the authors’ affiliations.
Participant group
Each article was coded for whether its participants were monolingual, multilingual or included both groups. For studies of child-directed language, we coded the adults’ language status. This variable thus reveals the degree to which articles in the four journals focus on monolingual or multilingual development. The information was typically gleaned from the Participants section of the article; however, not every author explicitly reported whether their participants were mono- or multilingual. In these cases, coders scrutinised the article further to find evidence that would allow a categorisation. If no further evidence was present, it was coded as ‘Not Reported’.
Language
Only the language(s) that the study’s participants knew and had been tested on were coded. If the participants were tested on an existing language that was unfamiliar to them (e.g. when English-speaking children were tested in Hindi phonemic contrasts, or participants were tested on an artificial language), the article was excluded because the study did not directly test the acquisition of the children’s input language. Similarly, if a multilingual group was tested on only one of their languages, only the language that was tested was coded. We included both spoken and sign languages.
Coding languages always result in dilemmas regarding the vague distinction between language and dialect. This issue occurred a few times in the data set. Sometimes, there were historical reasons for different language names. For instance, there were articles reporting data on both Serbian and Serbo-Croatian; the difference in language name reflecting geopolitical changes following the dissolution of the former Yugoslavia in the early 1990s. We coded these articles as ‘Serbo-Croatian’, which is accepted by Slavic linguists and captures the fact that the regional varieties comprise a polycentric language group. 4 Whenever there were issues in categorising language varieties, we consulted the authors of the articles, as well as other experts to come up with a decision. For example, after consultation with authors, we also decided to label the different varieties of Arabic as a polycentric language, under the broad term ‘Arabic’. We did the same for different varieties of English, Spanish, German and Greek. However, we coded articles reporting on Quechua into the following two varieties: Conchucos Quechua and Southern Peruvian Quechua, based on the typological work on the family (Torero, 1983). All sign languages were coded as separate languages.
No doubt some of these decisions would not please speakers of regional varieties (or sociolinguists). Some big languages exhibit greater variation within varieties than others (e.g. Arabic has been argued to have the same diversity as the Romance language family, Holes, 2004, although Modern Standard Arabic exists as a spoken register and literary standard). Our decisions tend to err on the side of conservatism. However, we note that, even if we did count all dialects as separate languages, it would only minimally change the estimate of language coverage.
The language family of spoken languages was coded using Ethnologue (Eberhard et al., 2021). While there have been recent efforts to establish a phylogeny of sign languages (e.g. Power et al., 2020), the topic is not without controversy (Chloe Marshall, p.c., 7 July 2021). In order to avoid making arbitrary decisions that were not based on solid evidence, we placed sign languages into one category. Creoles and mixed languages (e.g. Light Warlpiri) were also placed into one category. These categories – sign languages and creole and mixed languages – certainly involve more nuance than we have given them in terms of their broader linguistic categorisation, but dealing with the details was beyond the scope of the article. In general, there is very little research on these languages in our data set, which places them alongside most other language families in the sense that they are understudied.
Topic
The articles were coded as having one or more of the following topics: Phonology, Morphosyntax, Vocabulary and Semantics, Pragmatics and Discourse, Language and Cognition and Non-verbal communication. The Phonology topic was, in fact, broader than phonology, also including studies of phonetics and prosody. We chose to call the category phonology, rather than the superordinate but exclusionary term ‘Speech’, because the category also included studies of sign languages (e.g. phonological handshape types). Studies of grammatical relations were labelled Morphosyntax. Vocabulary and Semantics included studies investigating the acquisition of words and meaning (at the lexical level). Pragmatics and Discourse included studies investigating the acquisition of communicative intent, speech acts, conversation and narrative production and comprehension. 5 Language and Cognition included studies focusing on reading or literacy, metalinguistic ability and the interface between language and broader human cognitive processes (e.g. language and emotion). Non-verbal communication included studies investigating gestures (e.g. giving, pointing) and other communicative acts (e.g. eye gaze, facial expressions).
These topic categories are broad, but the nature of research is that it was not always easy to neatly place an article in only one. Therefore, coders were encouraged to list as many codes as were relevant. Most of the articles were categorised using one to two topics.
Country of author
We coded the country of the affiliation of each article’s authors. If an article had authors from different universities in one country, the country was counted only once. The same was done whenever the different authors of the article were from the same university. Thus, if an article had three authors, two from the United States and one from Spain, it counted as having contributions from those two countries, only counting the United States once. This variable is intended to estimate the locus of research production. The regions were assigned following the United Nations Statistics Division’s (2021) M49 Standard. 6
Coding and reliability checks
To check for inter-coder reliability, we pseudo-randomly selected 228 articles (7%) so that there was a representative number of topics covered. These were re-coded by a new coder, blind to the original coding, based on the following: inclusion or exclusion, languages, topic/s and participant group type (country of author was straightforward and did not need to be assessed). Given that an article could have more than one topic assigned to it, the reliability for this feature of the data calculated the degree to which two coders identified at least one matching topic.
The Cohen’s kappa scores for the different dimensions annotated by Coders 1 and 2 were all above 0.90 (inclusion: 0.94, language: 0.98, at least one matching topic: 0.91, participant group type: 0.96), indicating almost perfect agreement between the coders. Coder 3’s annotations were re-coded by the second author, with the Cohen’s kappa scores also indicating almost perfect agreement (inclusion: 1.0, language: 1.0, at least one similar topic: 0.97, participant group type: 0.95).
Analysis
All analyses were conducted in R version 4.1.2 (R Development Core Team, 2021). We calculated the number of articles published in child language journals per year, depending on the language, language group (English, other Indo-European languages, non-Indo-European languages, see below), topic, as well as the countries and regions of affiliations of the authors. We also fitted several Poisson regression models to the data to analyse whether the distribution of the articles changed across time. For this, we used the glm and predict functions of the lme4 package (version 1.1–27.1, D. Bates et al., 2015). Model fit was determined using the aictab function of the AICcmodavg package (version 2.3–1, Mazerolle, 2020) and base R’s anova function. Our data and analysis scripts are available on the Open Science Framework: https://osf.io/jmxnw/.
Results
Preliminaries
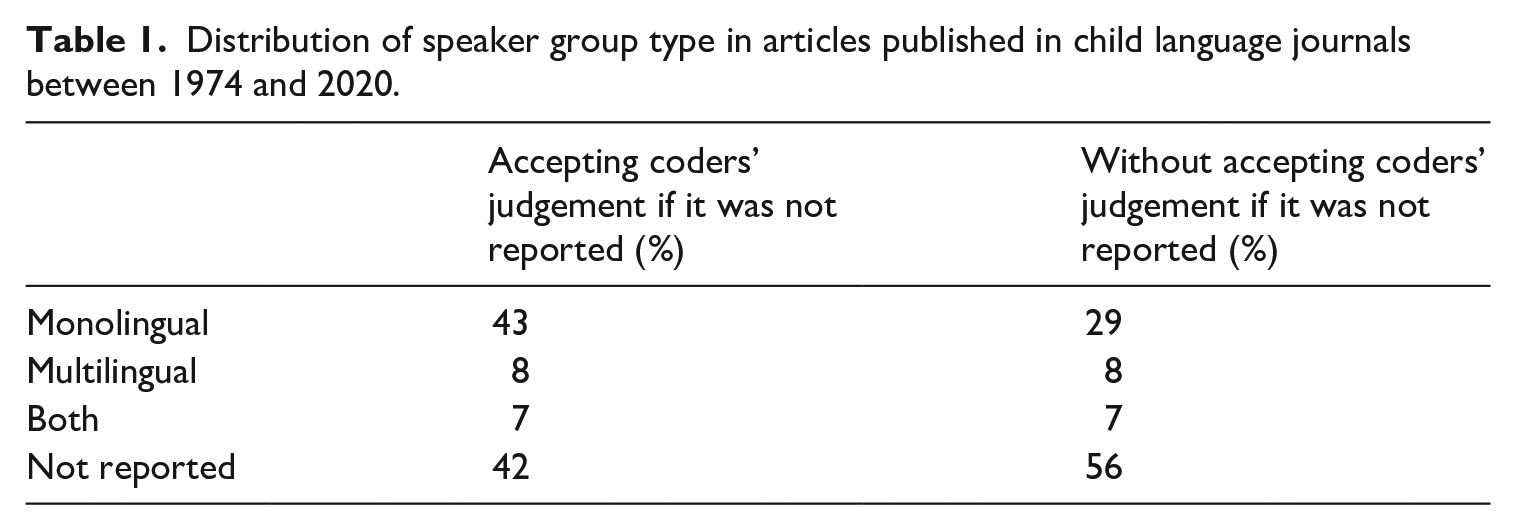
Of the 2826 included articles, 61% were from JCL, 23% from FL, 9% from LA and 7% from LLD. Table 1 reports the data on the distribution of participant group types. There were more articles with monolingual participants compared to those with multilingual participants or both. However, 56% of the articles did not report the status of their sample. We were able to code an additional 14% of articles by further scrutinising them. In each case, these articles reported on monolingual populations, yet this still left 42% as unclassifiable.
Distribution of speaker group type in articles published in child language journals between 1974 and 2020.
Languages
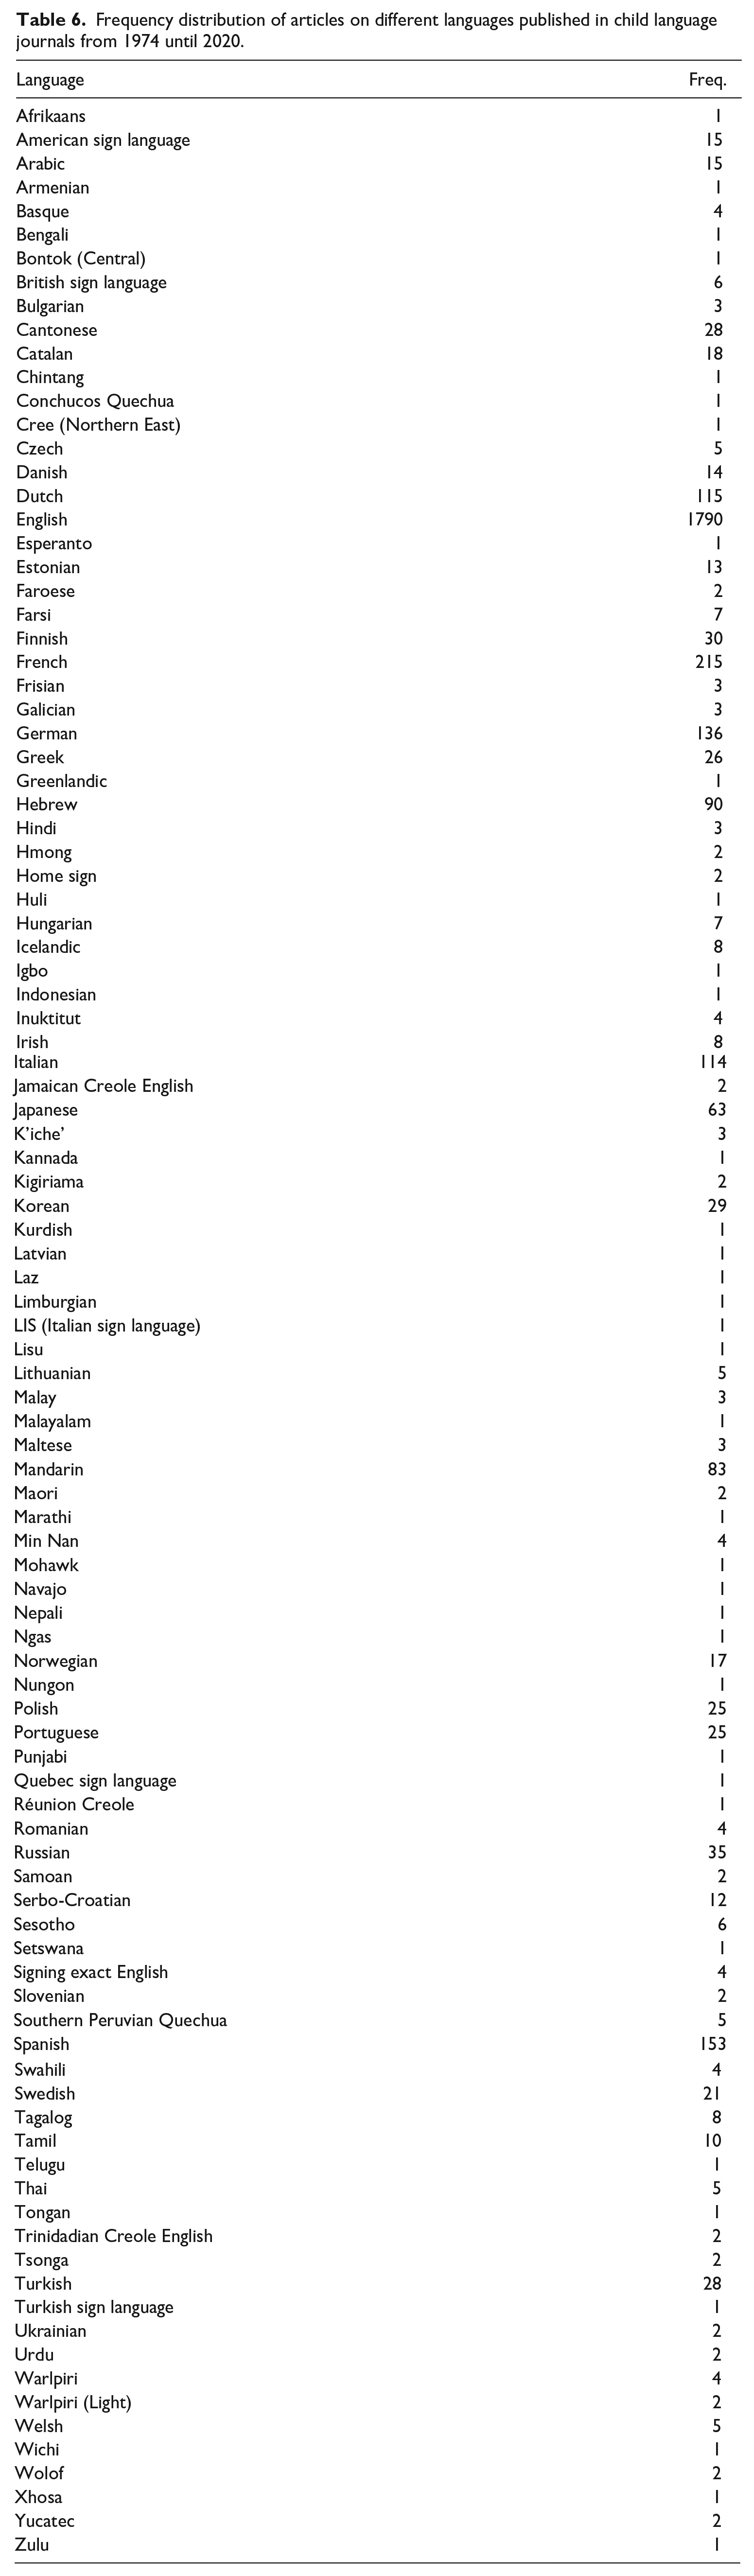
There is at least one article published in child language journals on a total of 103 languages. Thus, assuming that there are 7000 natural languages, the four major child language journals have published articles on around 1.47% of them. The number of articles is not evenly distributed across the language families of the world. The majority were on English (54%). Thirty-eight additional languages came from the Indo-European family, making up 30%, with the remaining 16% coming from 64 different languages that belong to 25 different language families. We use these three categories (i.e. English, other Indo-European, non-Indo-European – that is, all languages that are not in the Indo-European language family) in our subsequent analyses. Figure 1 shows the number of articles published in each category over time. Figure 2 shows the frequency distribution of the Indo-European languages, and Figure 3 shows the frequency distribution of the non-Indo-European languages (see Table 6 in Appendix 1 for raw frequencies per group). Figure 1 shows an increasing trend in the number of articles published across time, which is characteristic of all language categories.
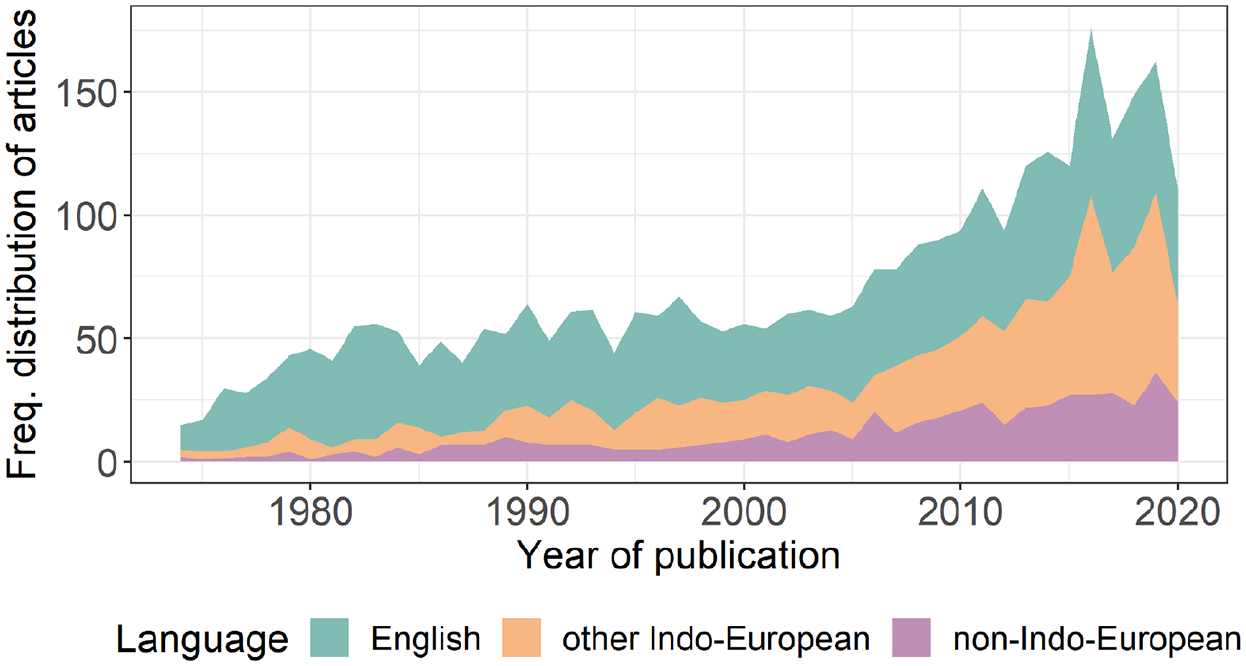
Frequency Distribution of Articles on English, other Indo-European Languages and Non-Indo-European Languages Published in Child Language Journals Between 1974 and 2020.
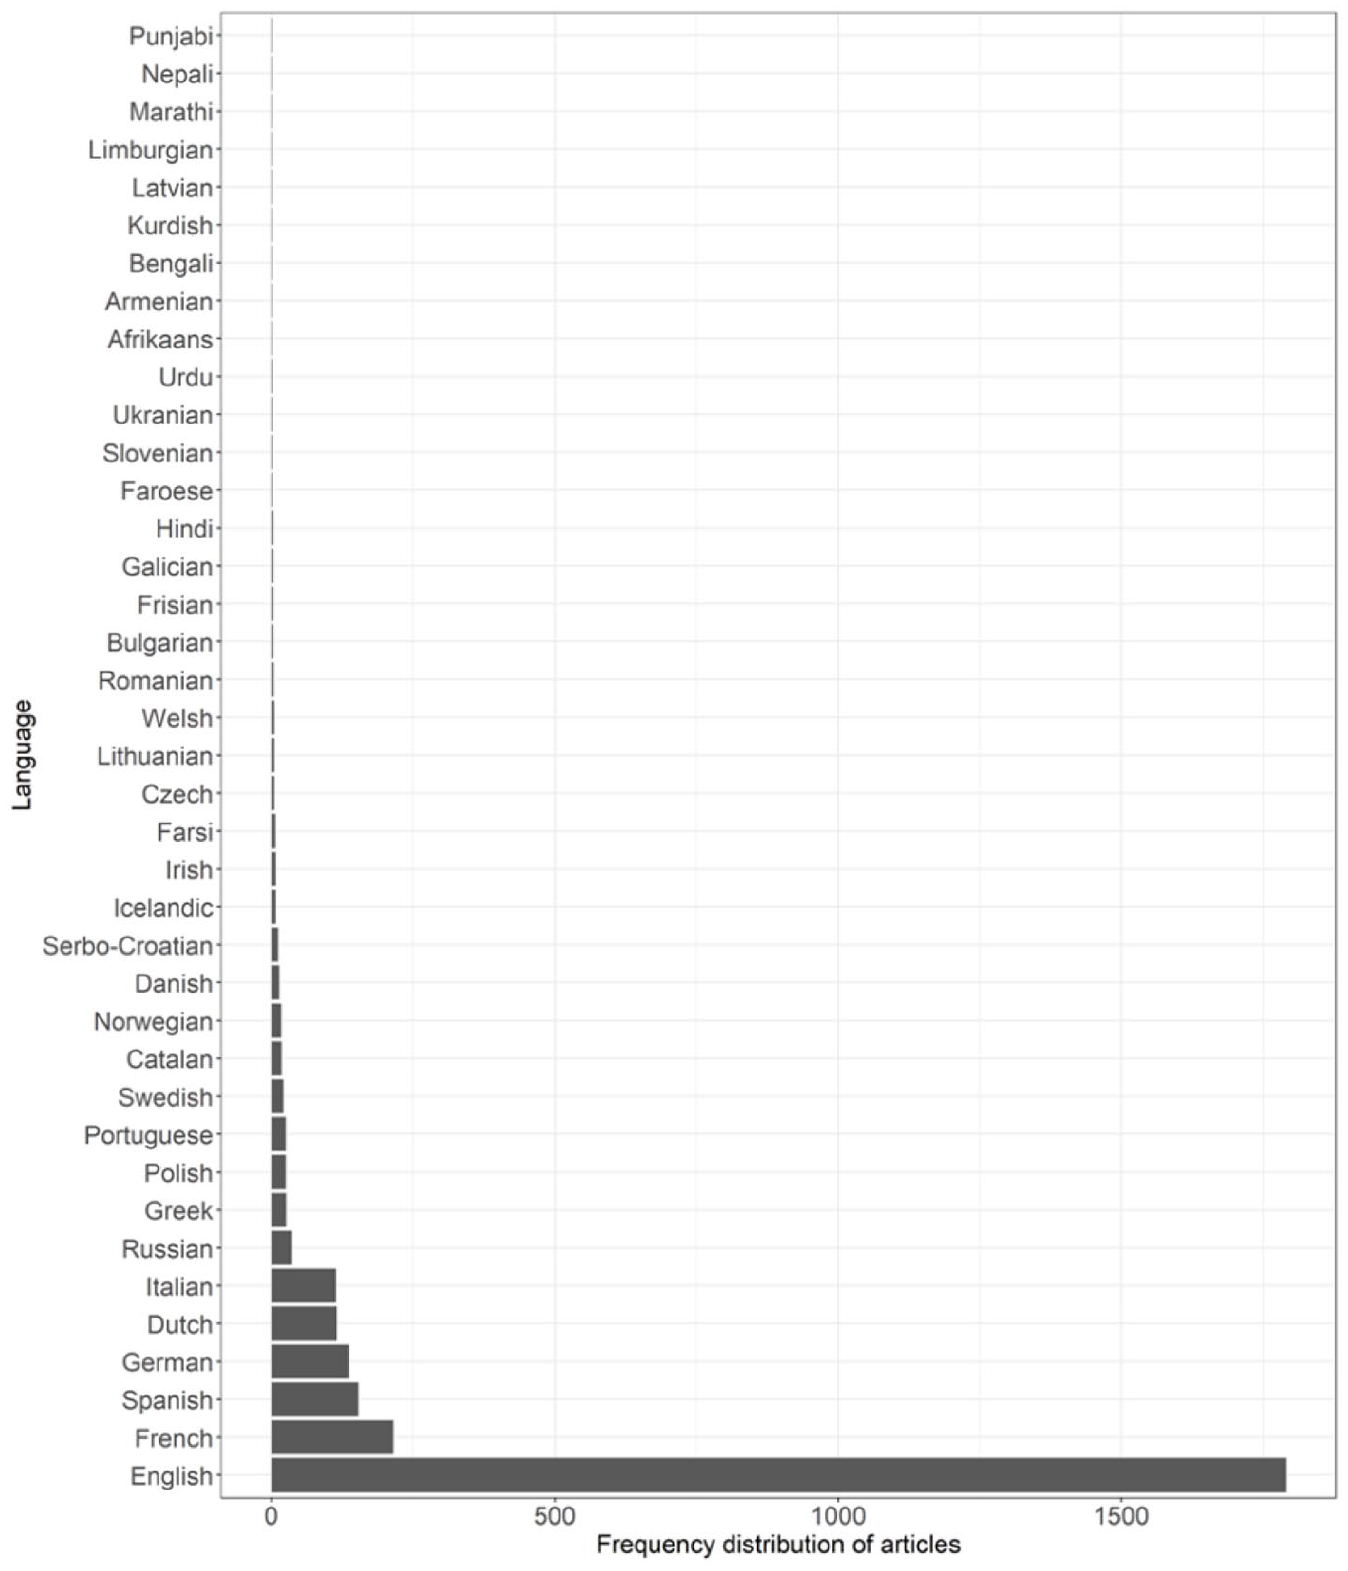
Frequency Distribution of Articles on Indo-European Languages Published in Child Language Journals Between 1974 and 2020.
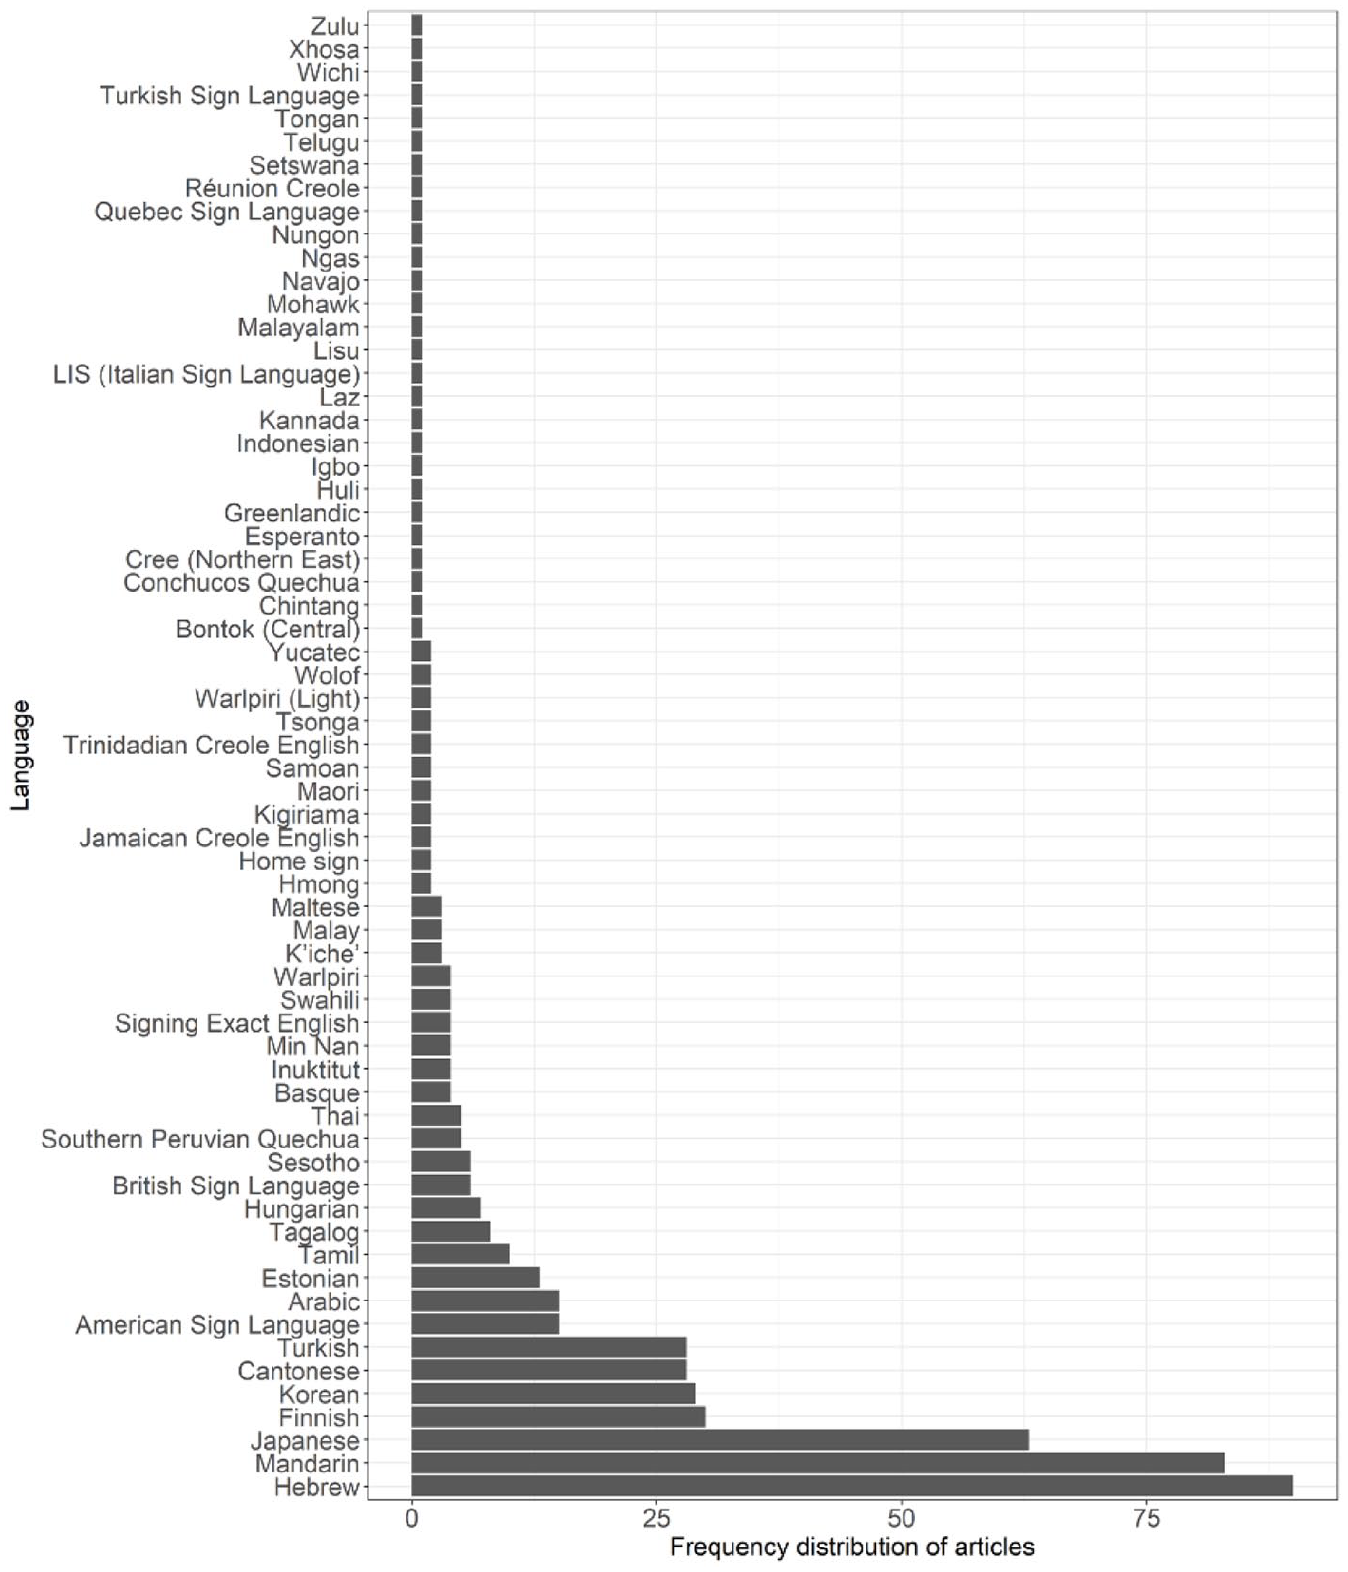
Frequency Distribution of Articles on Non-Indo-European Languages Published in Child Language Journals Between 1974 and 2020.
Figures 2 and 3 show that the frequency distributions of papers in both the Indo-European family and all other languages are skewed. In the Indo-European category, English and large Romance and Germanic languages have many articles, whereas the number for other languages is much smaller. The same right-skew is observed in the non-Indo-European language category; a few languages have many articles (e.g. Hebrew, Mandarin, Japanese), while the modal number is 1.
In order to investigate whether the distribution of articles across the three language categories changed across time, we fitted a Poisson regression model predicting the number of articles published from language group and year of publication. Language group was a categorical independent variable (English, other Indo-European languages, non-Indo-European languages) and was treatment coded: English was selected as the reference level so that the coefficients could be interpreted as how publication rates in the other two categories differed from the most frequent language across time. Year of publication was adjusted such that the first year (1974) was treated as 0, and the succeeding years were each year’s difference from 1974 (e.g. 1976 as 2). This way, the coefficients in the models refer to the difference between the language groups in the year 1974, instead of in the year 0 AD. Year of publication was entered as a continuous independent variable.
The best-fitting model included the main effects of language group and time, and the interaction between the two (see Table 2). To understand the interaction of year and language group, we plotted the predictions of the model with and without the interaction. The model with the interaction shows that the number of articles on English is growing linearly across time, while those on other Indo-European languages and non-Indo-European are growing more rapidly (see Figure 4). In other words, in more recent years, the growth in the number of articles on languages other than English is outpacing the growth in number of articles on English.
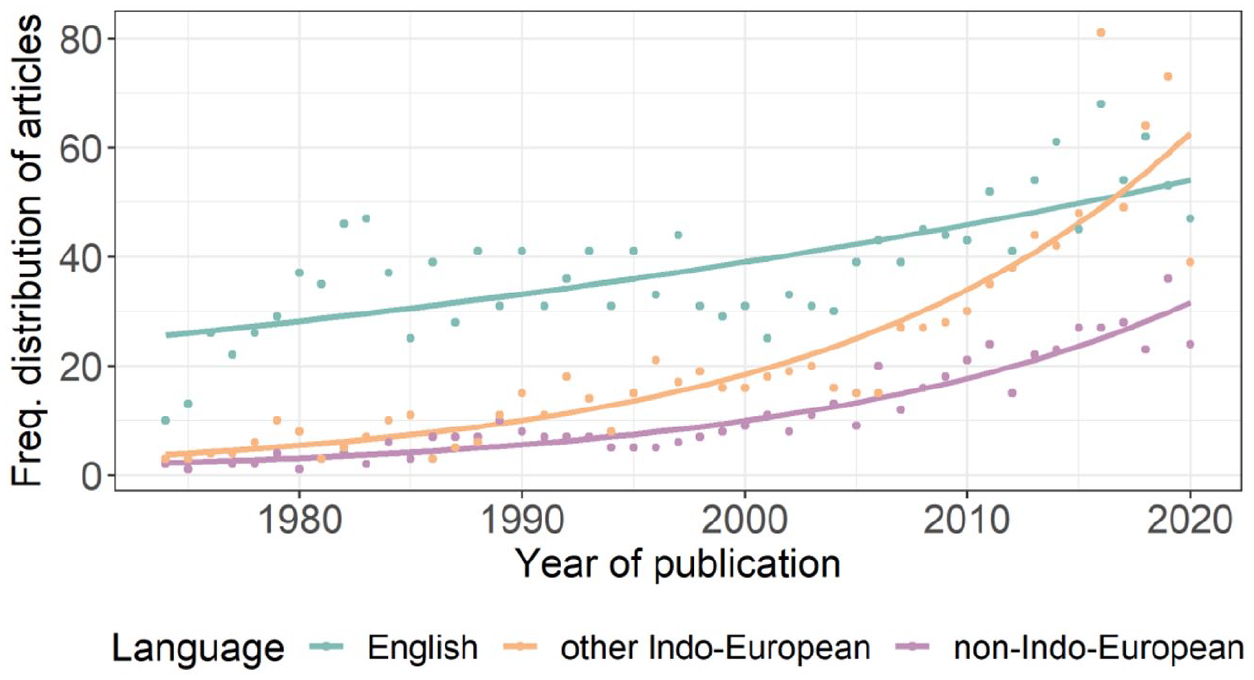
The Number of Articles Published on Different Language Groups Per Year. The Dots Correspond to the Actual Number of Articles (i.e. the Raw Data), While the Lines Correspond to the Values Predicted by the Regression Model.
Final regression model predicting number of articles by year and language group.
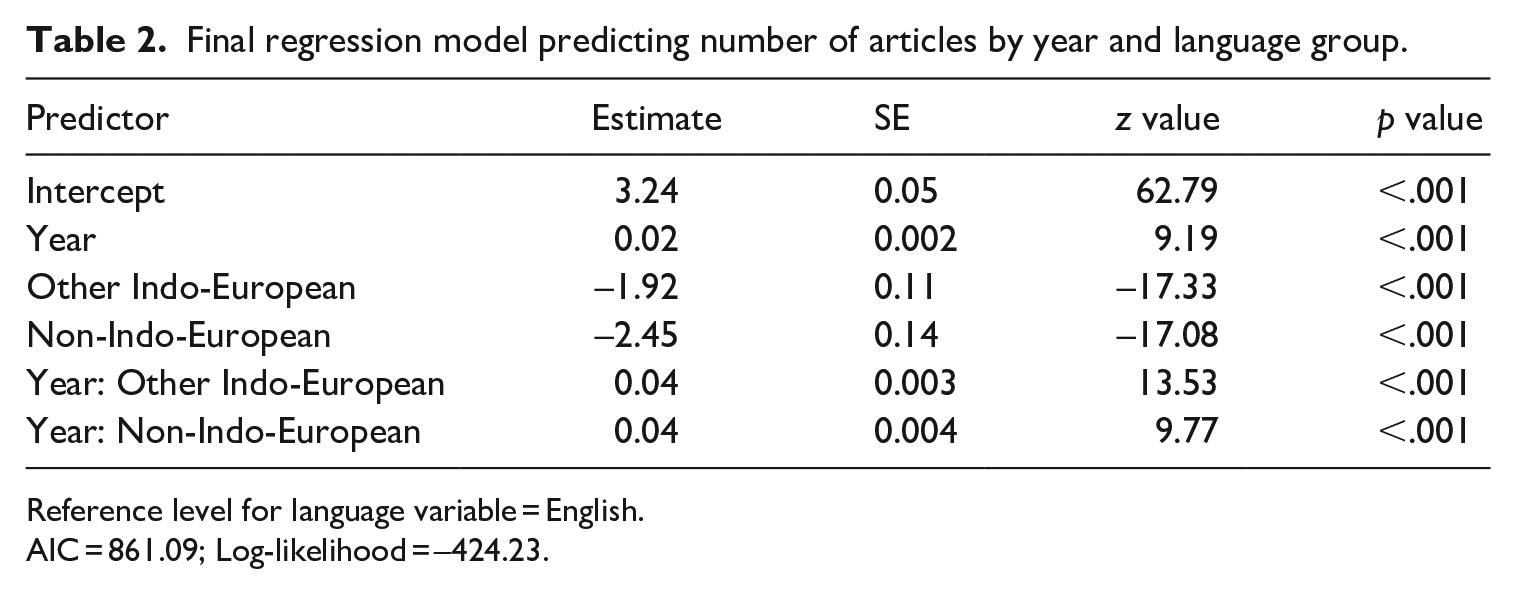
Reference level for language variable = English.
AIC = 861.09; Log-likelihood = –424.23.
Given the difference in growth between articles focusing on English versus languages other than English, a reasonable question to ask of the data is at what point would we expect the two other categories to match English? To answer this question, we computed a regression model on the cumulative number of articles. The best-fitting model included the main effects of language group and year, as well as their interaction (see OSF materials for modelling details). Figure 5 plots the model predictions, showing that, on current trends, we can expect the total number of articles in English and other Indo-European languages combined to be equivalent by 2048. That same figure for non-Indo-European languages is 2070. However, it is important to point out that, since the current distributions across Indo-European and non-Indo-European languages are severely skewed, these predictions do not mean that coverage will be even by these dates, only that the total number of articles will be equivalent. This means, unless something changes, the languages in each category will be skewed towards well-studied languages like Germanic and Romance languages, in the case of Indo-European, and languages like Hebrew, Japanese, Mandarin and Finnish, in the case of non-Indo-European languages.
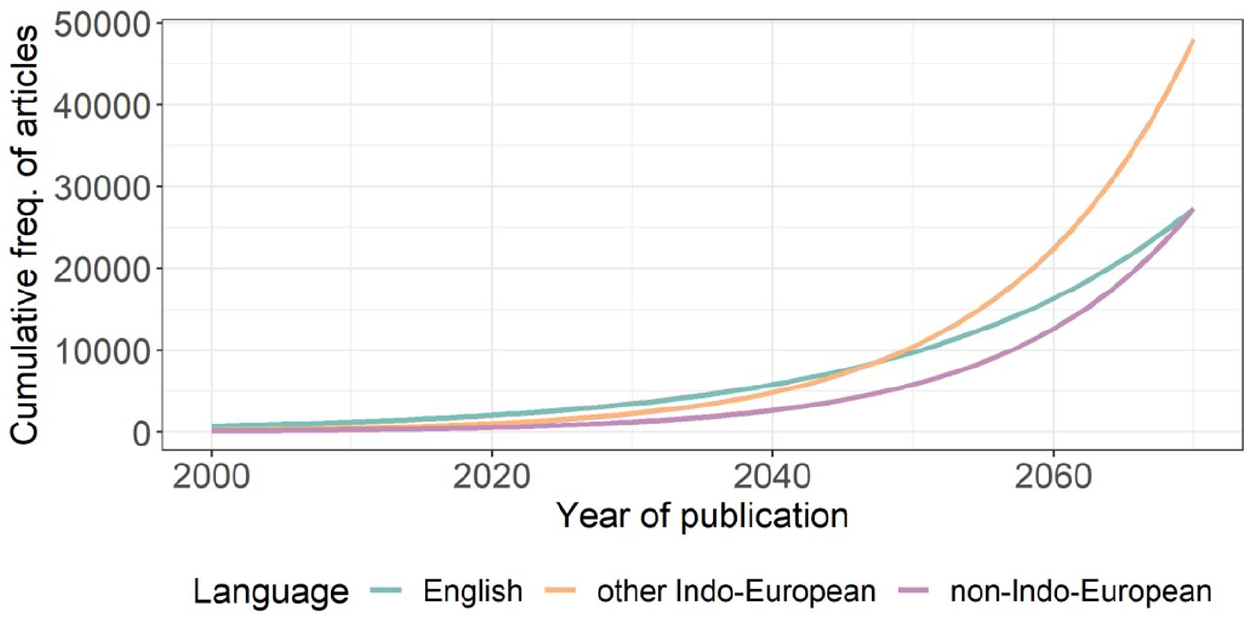
Predicted Cumulative Number of Articles in Child Language Journals Per Language Group, Based on the Regression Model.
Topics
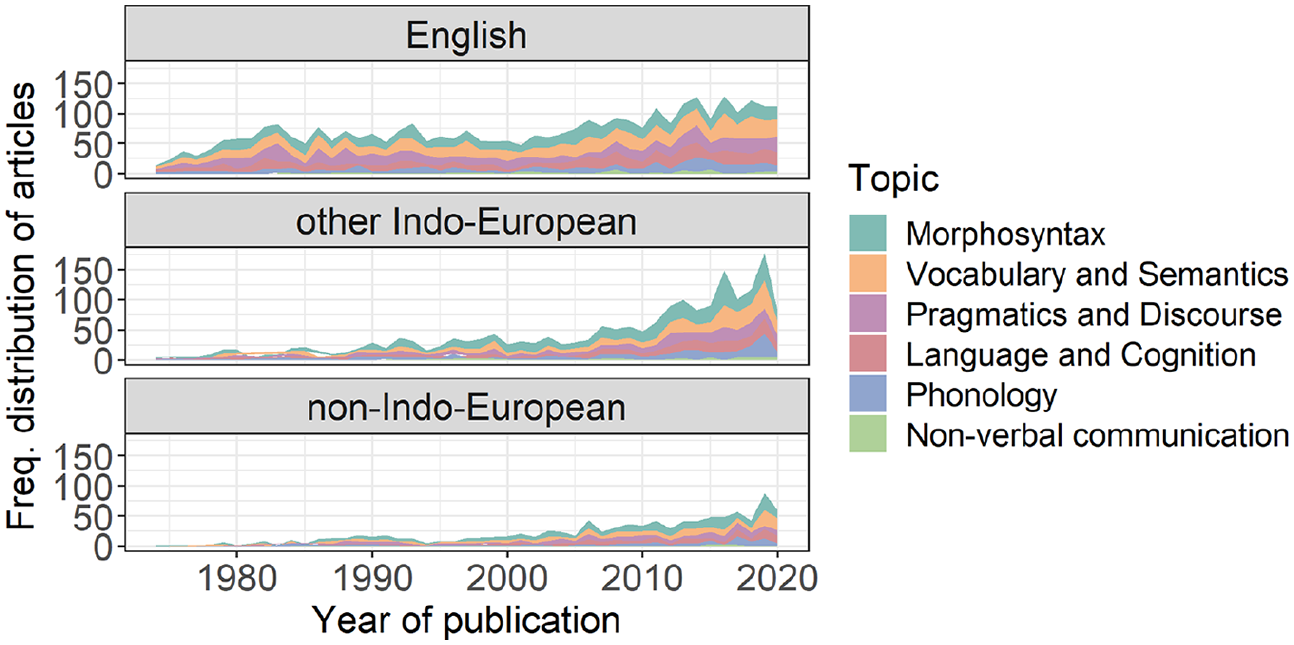
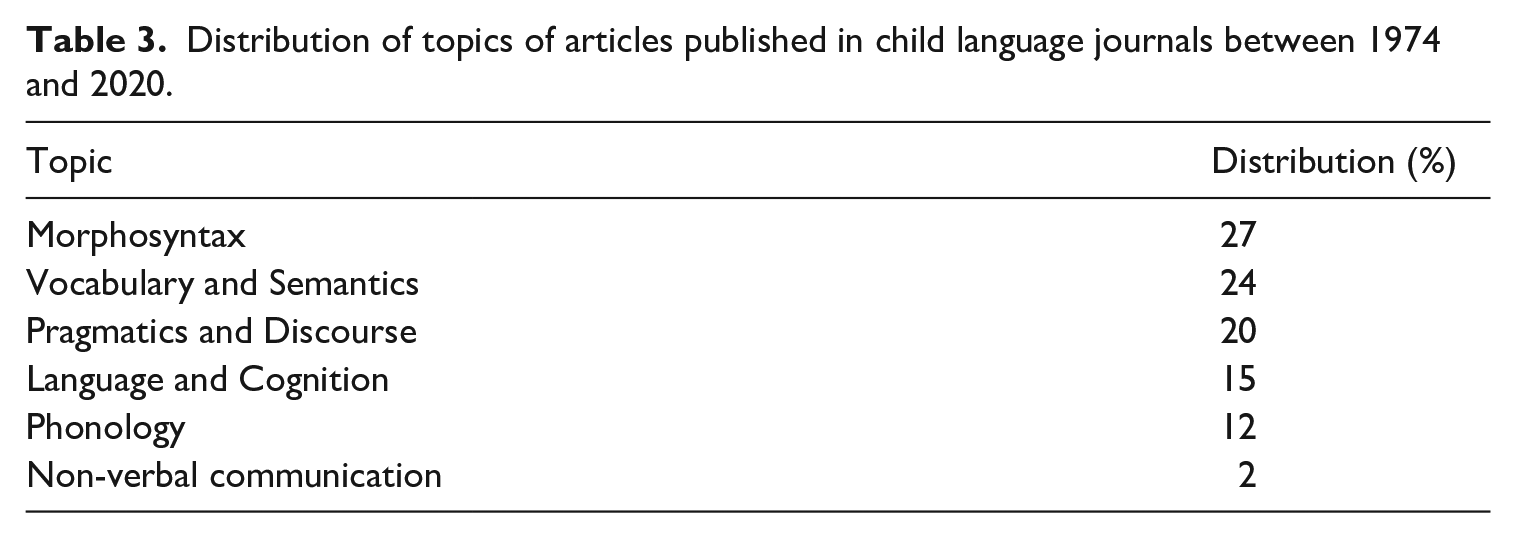
Table 3 shows the frequency of each topic across the whole data set. Morphosyntax was the highest, closely followed by Vocabulary and Semantics, which together account for just over half of the data. Non-verbal communication had the fewest number of articles. The topic distribution within the language groups, English, other Indo-European and non-Indo-European languages, can be seen in Figure 6, and across time in Figure 7. Figure 6 shows a fairly even overall distribution of topics across the three language categories; Figure 7, like Figure 1, shows a more recent increase in articles published on languages other than English compared to English.
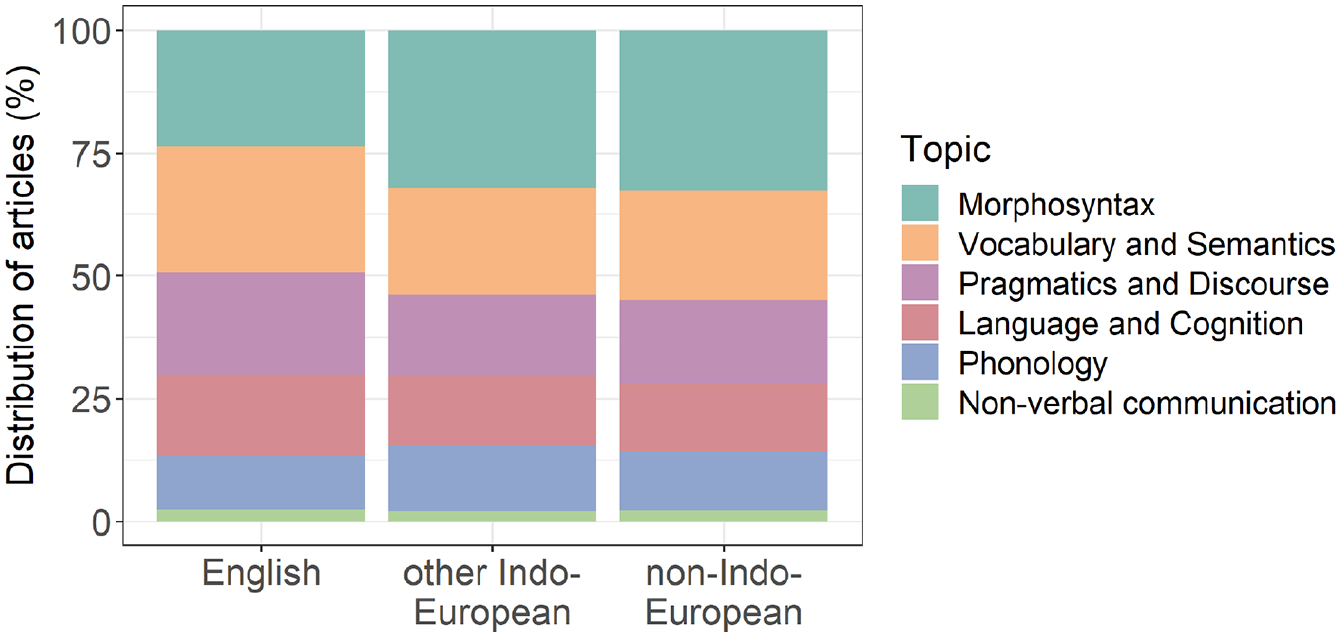
Distribution of Topics of Articles Published in Child Language Journals Between 1974 and 2020 in Different Language Groups.
Distribution of Topics of Articles Published in Child Language Journals Per Year Between 1974 and 2020 in Different Language Groups.
Distribution of topics of articles published in child language journals between 1974 and 2020.
We again fitted Poisson regression models to investigate whether there are differences in the growth rate of articles in a particular topic among language groups using the same strategy as for the overall data set. The data and model predictions for each individual topic are shown in Figure 8, with the model output in Table 4. The results show that the general trend across the three language groups (as reported in the ‘Languages’ subsection) is replicated in all of the topics except for Phonology and Non-verbal communication, which had the least amount of data. There is a linear growth for English, and greater, non-linear growth of published articles for other Indo-European and non-Indo-European languages. For Phonology, there seems to be linear growth for both English and non-Indo-European languages, but non-linear growth for other Indo-European languages. For Non-verbal communication, the predicted growth is linear for all language groups.
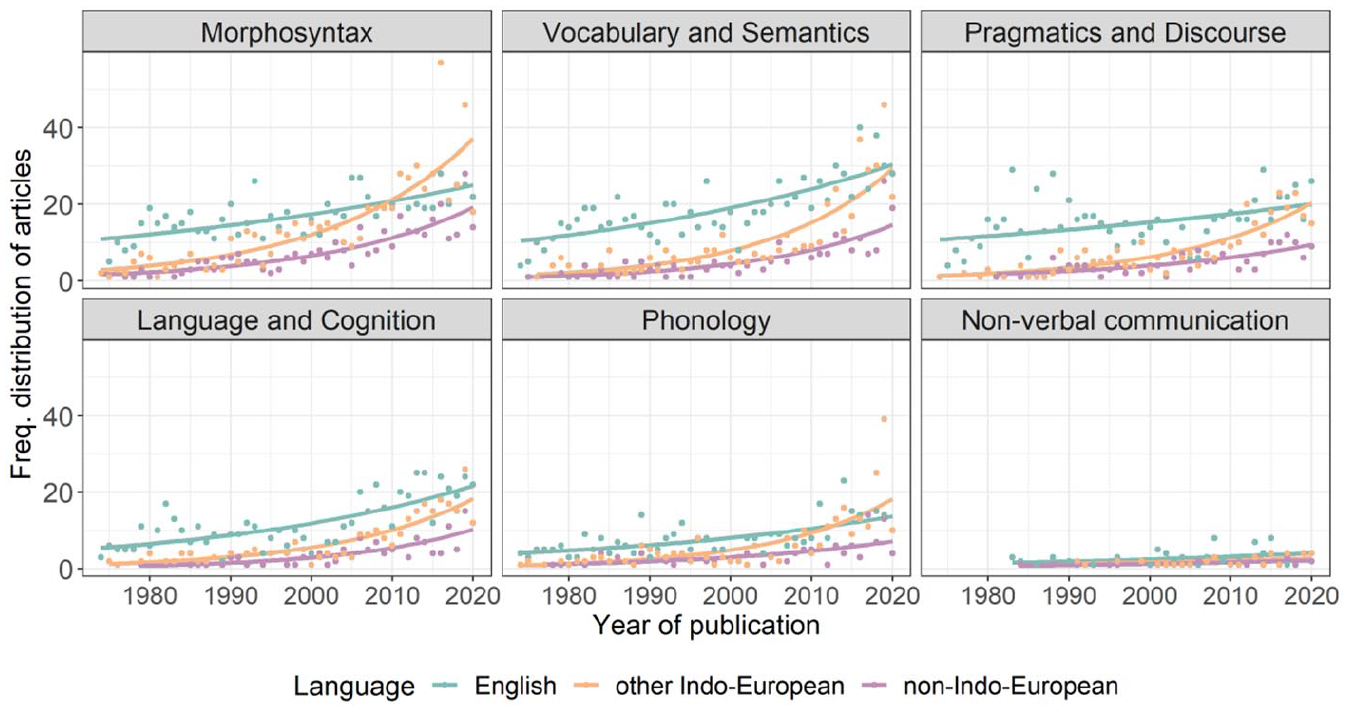
The Number of Articles Published on Different Topics and Language Groups Per Year. The Dots Correspond to the Actual Number of Articles (i.e. the Raw Data), While the Lines Correspond to the Values Predicted by the Regression Models.
Final regression models predicting number of articles by year and language group for each topic.
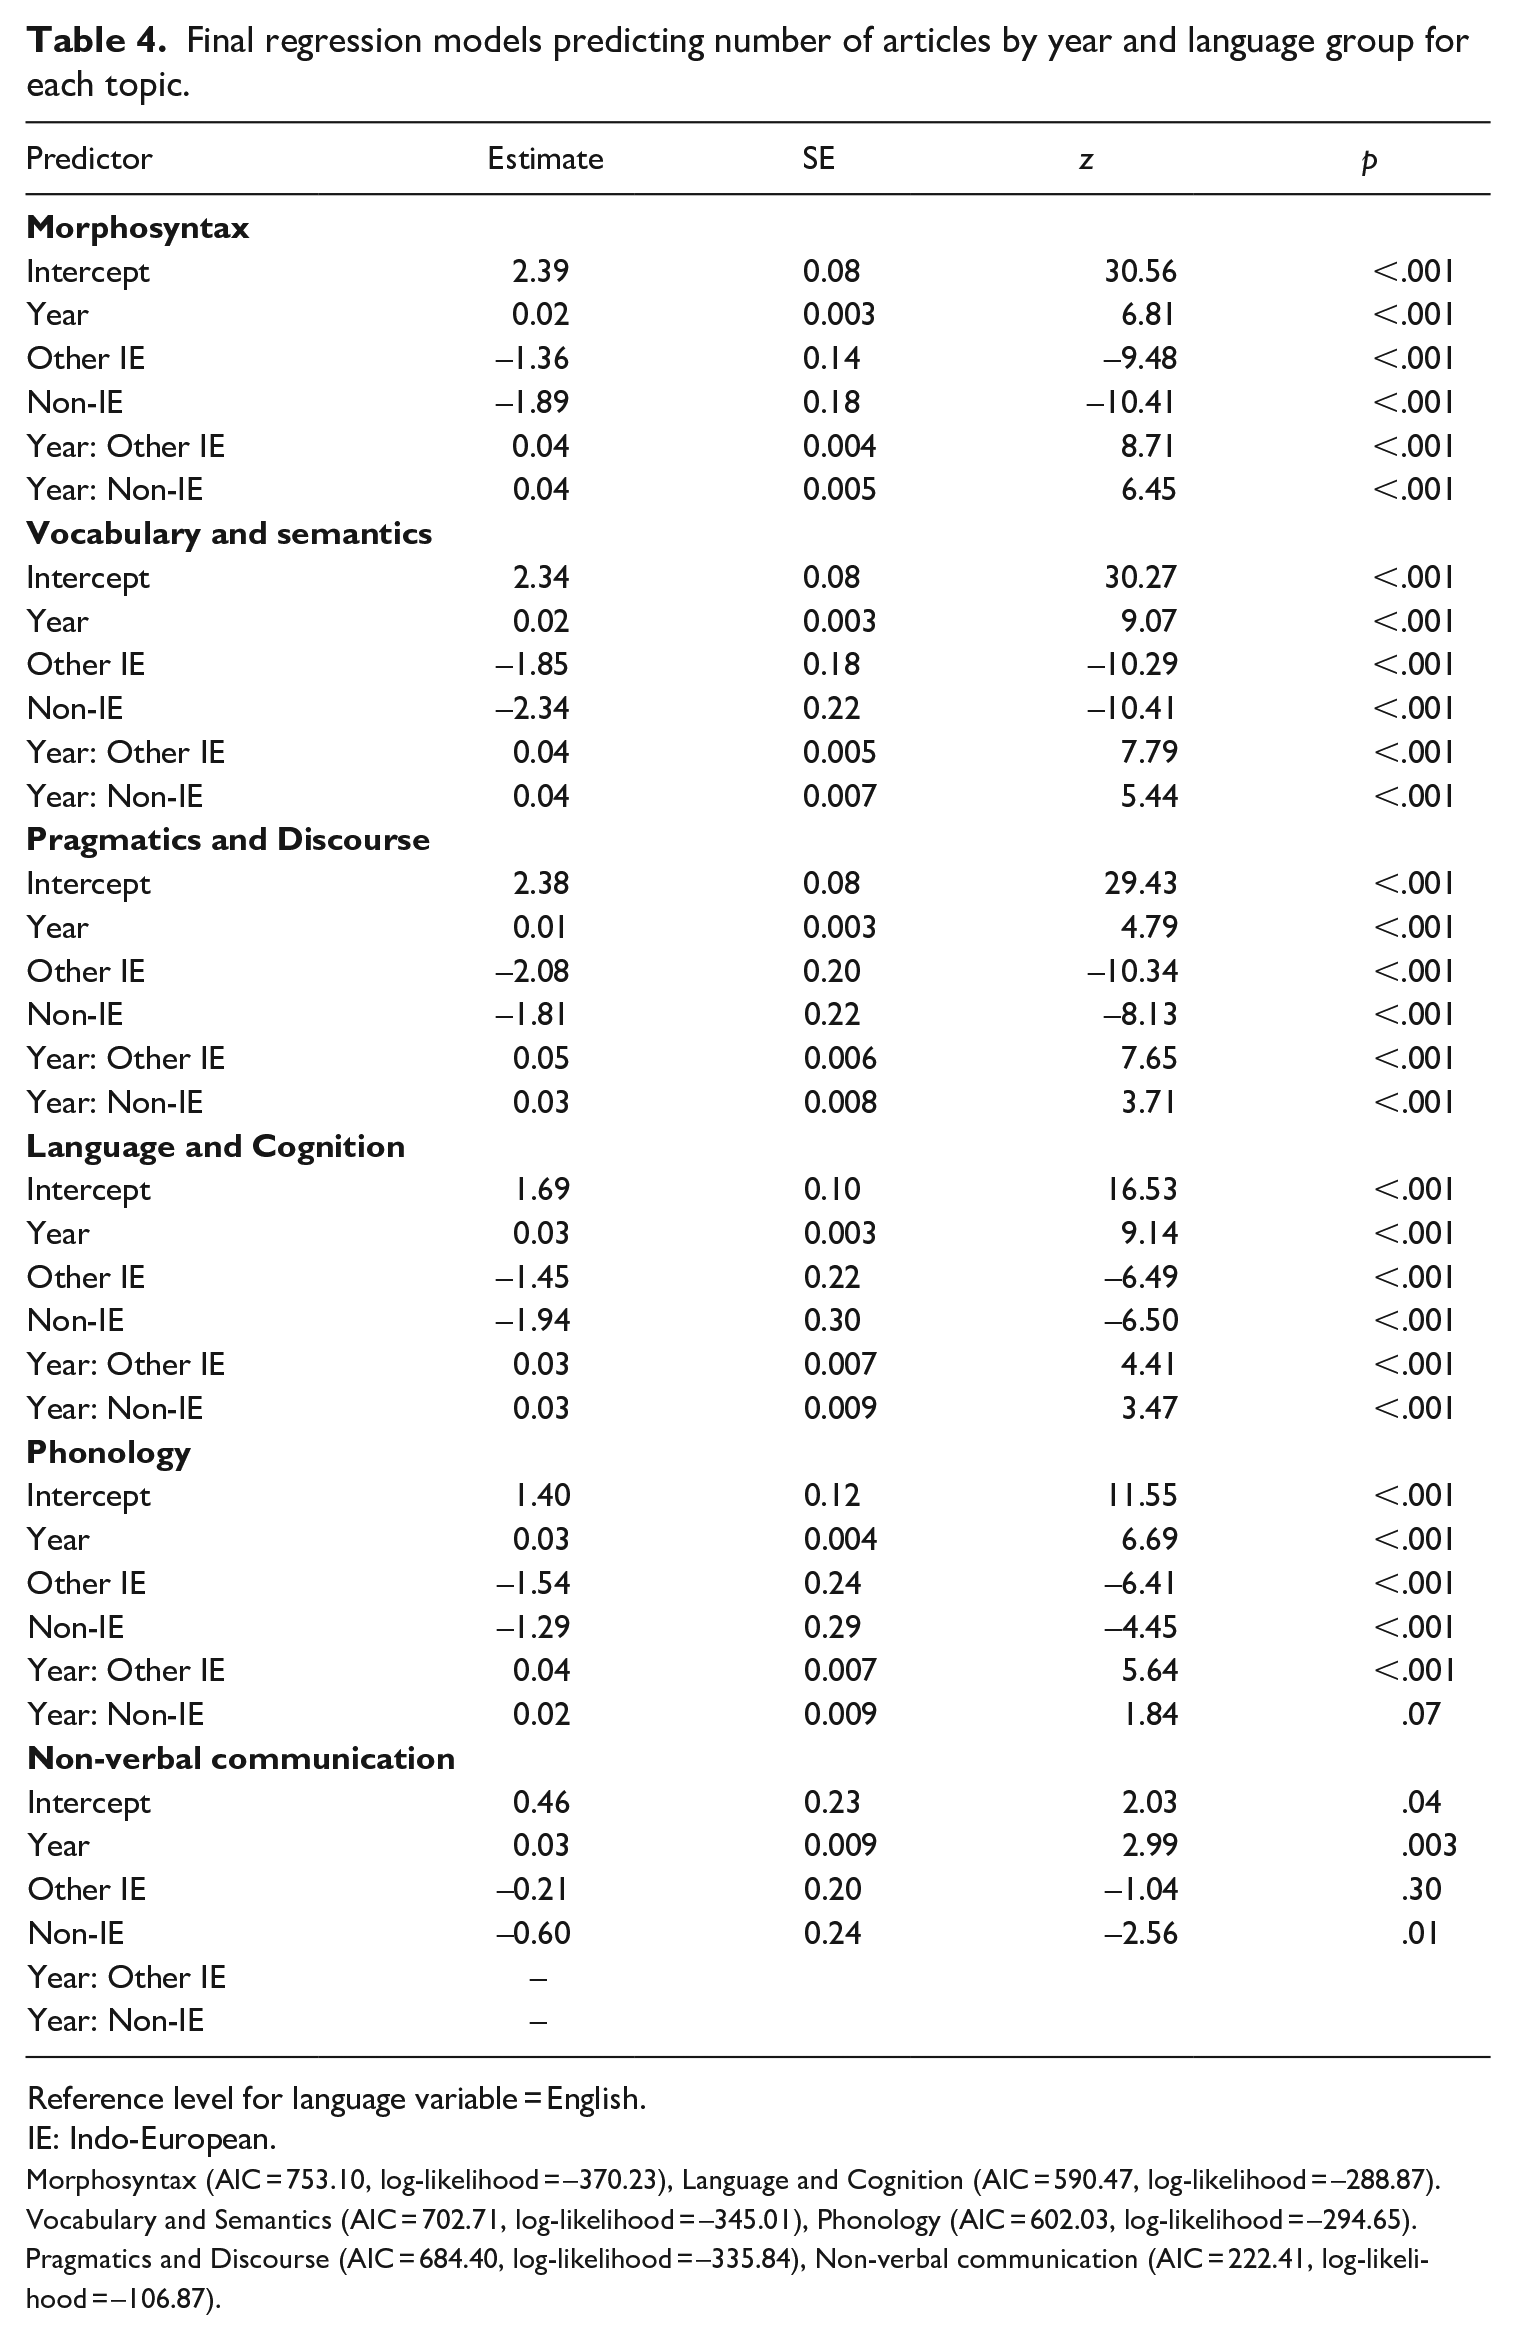
Reference level for language variable = English.
IE: Indo-European.
Morphosyntax (AIC = 753.10, log-likelihood = –370.23), Language and Cognition (AIC = 590.47, log-likelihood = –288.87).
Vocabulary and Semantics (AIC = 702.71, log-likelihood = –345.01), Phonology (AIC = 602.03, log-likelihood = –294.65).
Pragmatics and Discourse (AIC = 684.40, log-likelihood = –335.84), Non-verbal communication (AIC = 222.41, log-likelihood = –106.87).
Countries and/or regions
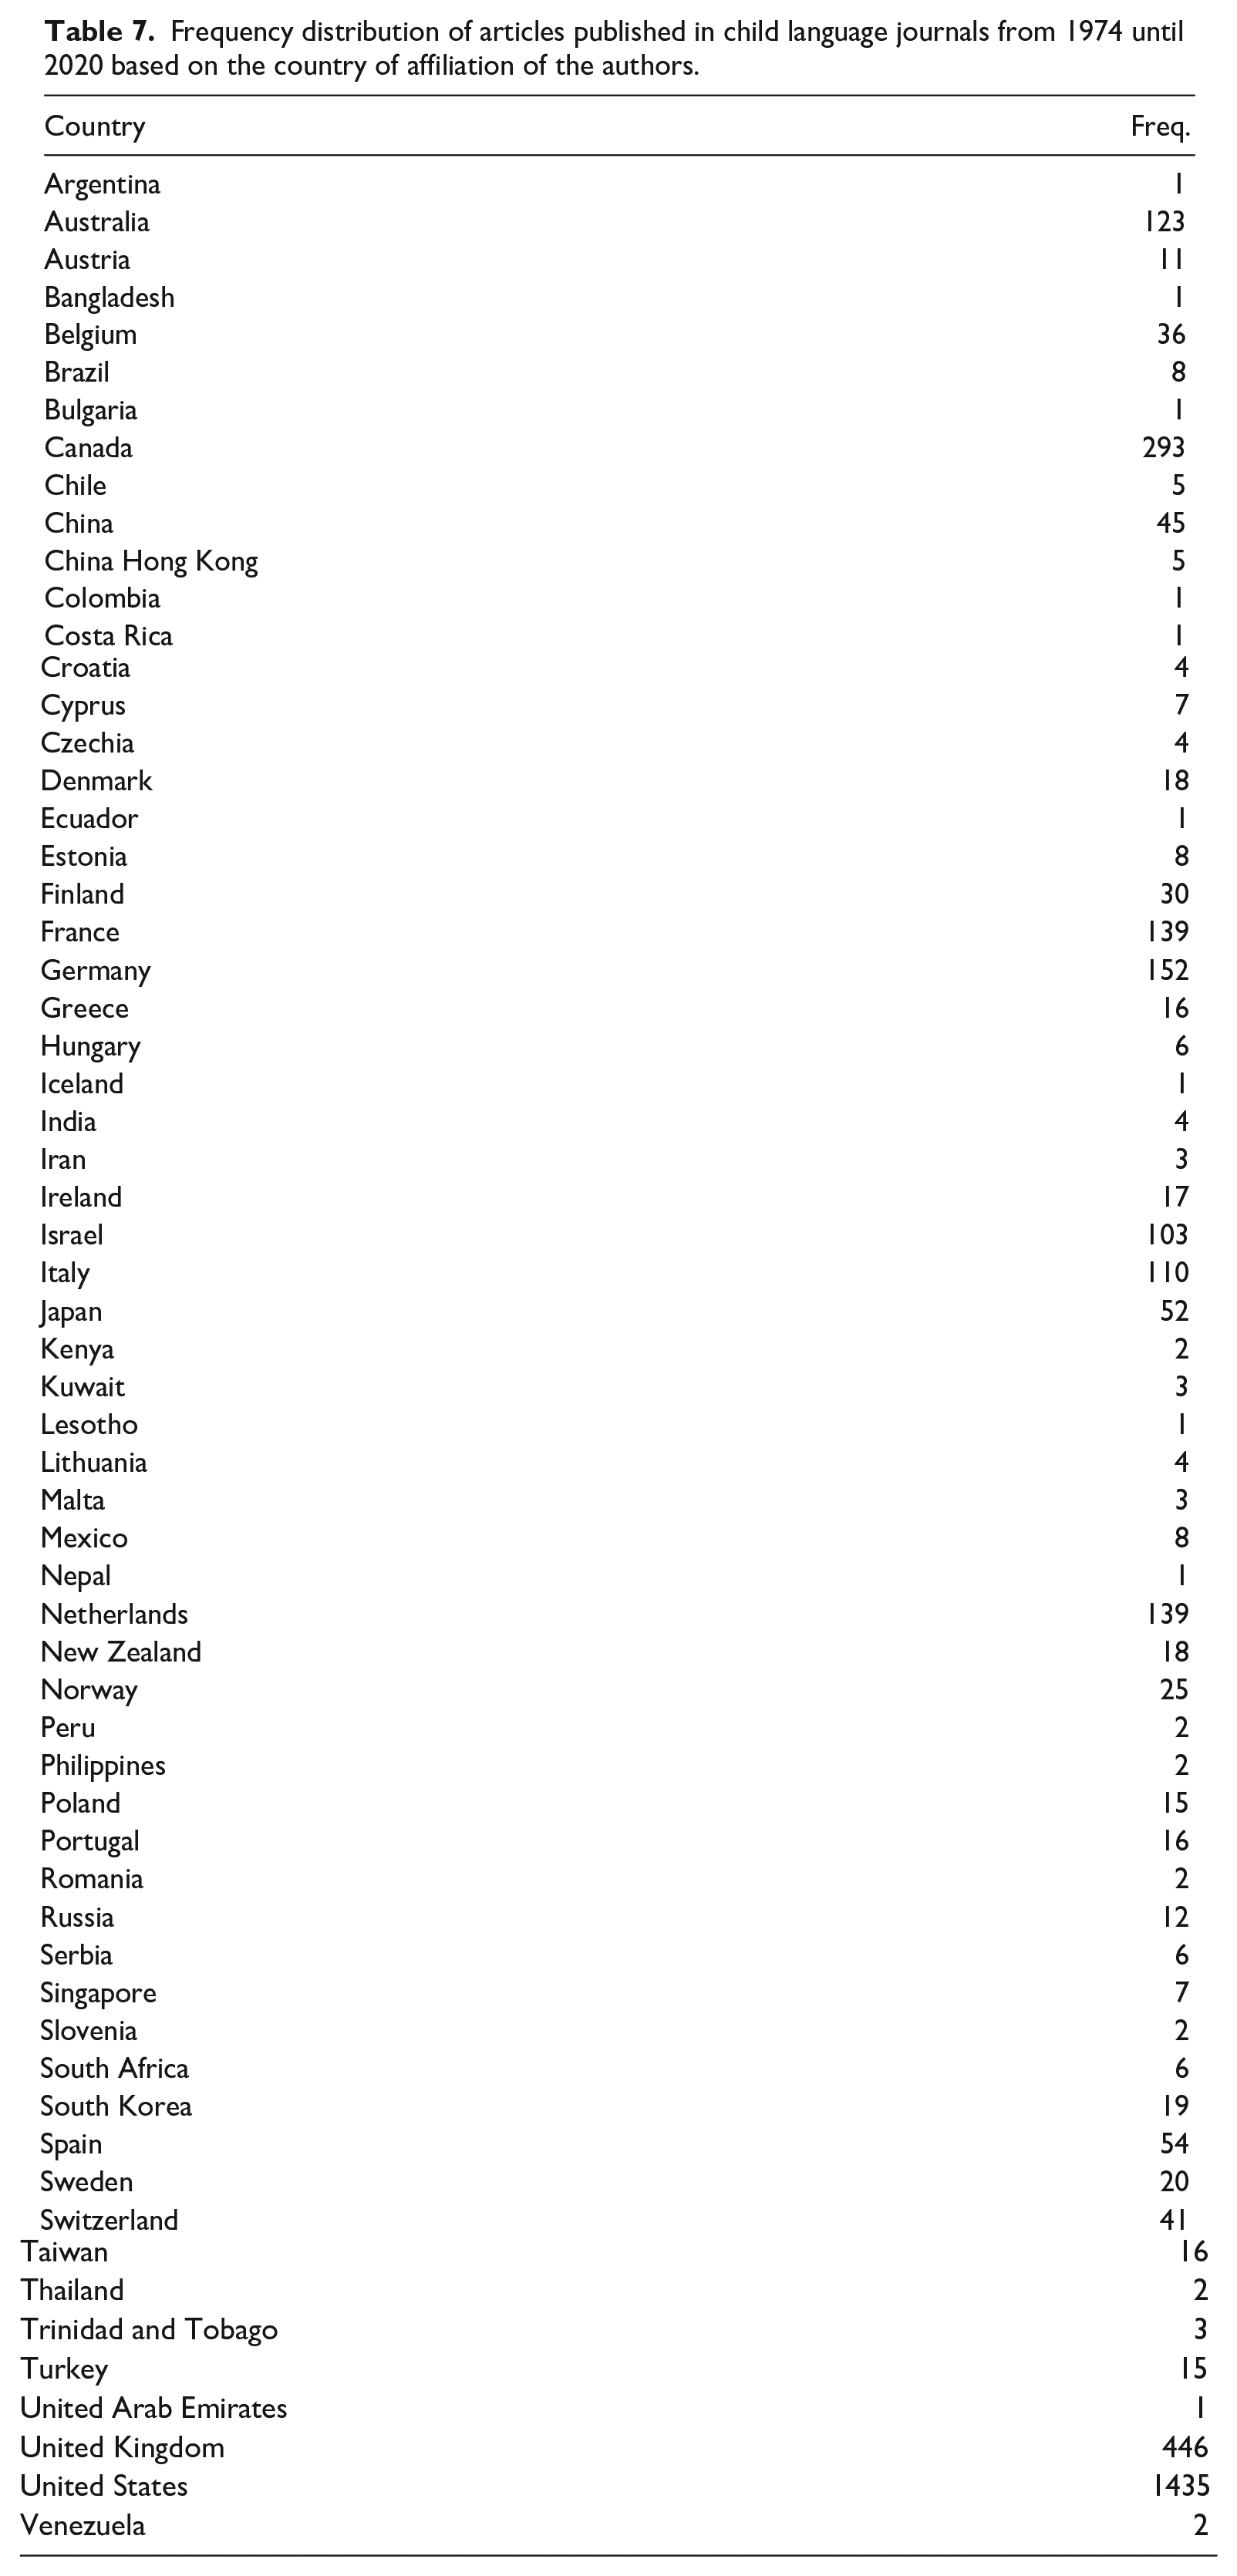
Figure 9 shows the distribution of region of author affiliations over time, divided into the following three categories: (1) North America, (2) Europe and (3) Others. The creation of these categories was data-driven, recognising the heavy skew towards North America (49%) and Europe (38%). That is, 87% of papers had authors from these two regions. The remainder had authors from institutions in Australia and New Zealand (4%), East Asia (4%), West Asia (4%) and only 1% for Latin America, Sub-Saharan Africa and South and Southeast Asia combined (for raw frequencies by country, see Table 7 in Appendix 2). Within-group analyses showed that most of the articles published by authors in Europe were from institutions in Northern and Western Europe (82%), with only 3% from institutions in Eastern Europe. These Northern and Western European countries in our list are traditionally the wealthiest in the region (Eurostat, 2021). In addition, 80% of the articles from institutions in West Asia were from Israel, with 12% from Turkey.
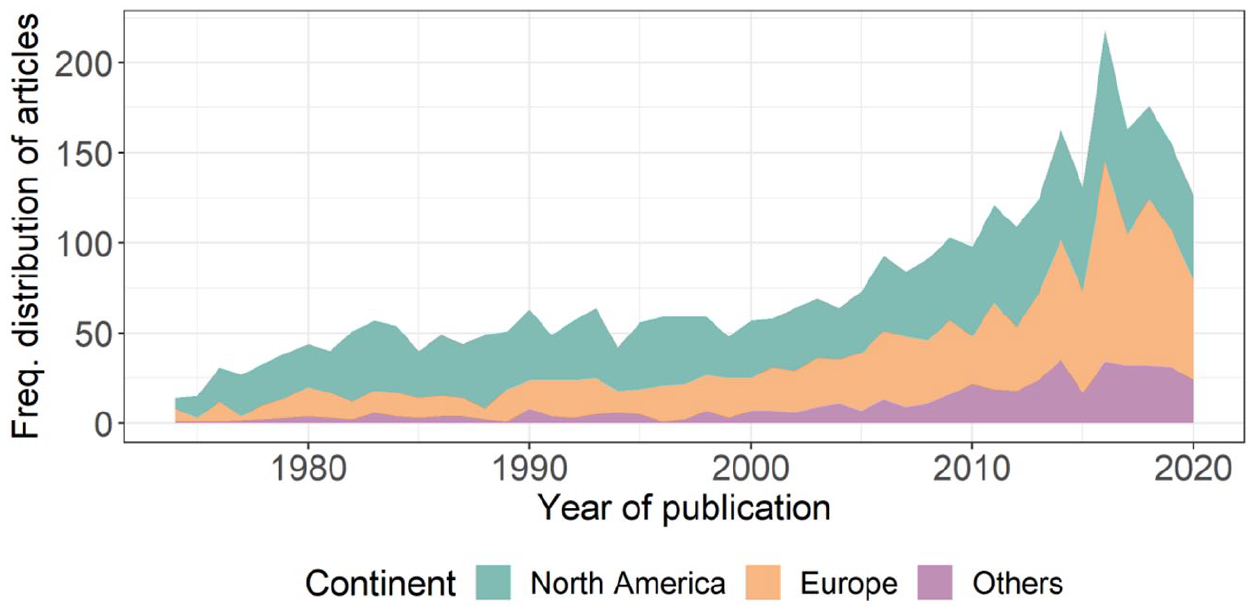
Distribution of Regions of Affiliations of the Authors Who Published Articles in Child Language Journals Per Year Between 1974 and 2020.
We analysed these data using Poisson regression. Region of affiliation (referred to here as ‘continent’: North America, Europe, others) was treatment coded, with North America selected as the reference level so that the coefficients could be interpreted as to how publication rates in the other two categories differed from the most frequent contributing region. Year of publication was entered as a continuous independent variable and was again adjusted so that the first year in our data set (1974) was treated as 0. The model showed significant main effects and a significant interaction of year and continent of author affiliation (see Table 5). Plotting the predictions of the model shows that the number of articles published by authors in North America is growing linearly, while the number of articles produced by authors in Europe and in other continents is increasing at a non-linear rate, as shown in Figure 10.
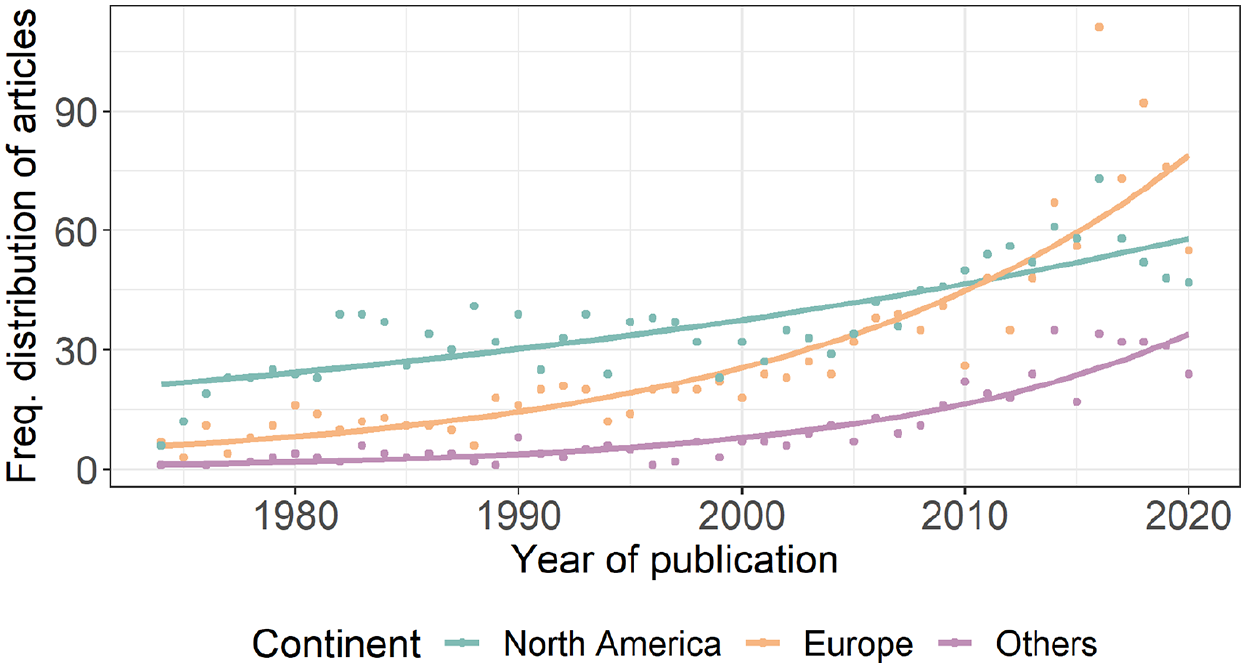
The Number of Articles Published by Authors with Affiliations at Institutions on Different Continents Per Year. The Dots Correspond to the Actual Number of Articles (i.e. the Raw Data), While the Lines Correspond to the Values Predicted by the Regression Model.
Final regression model predicting number of articles by year and continent.
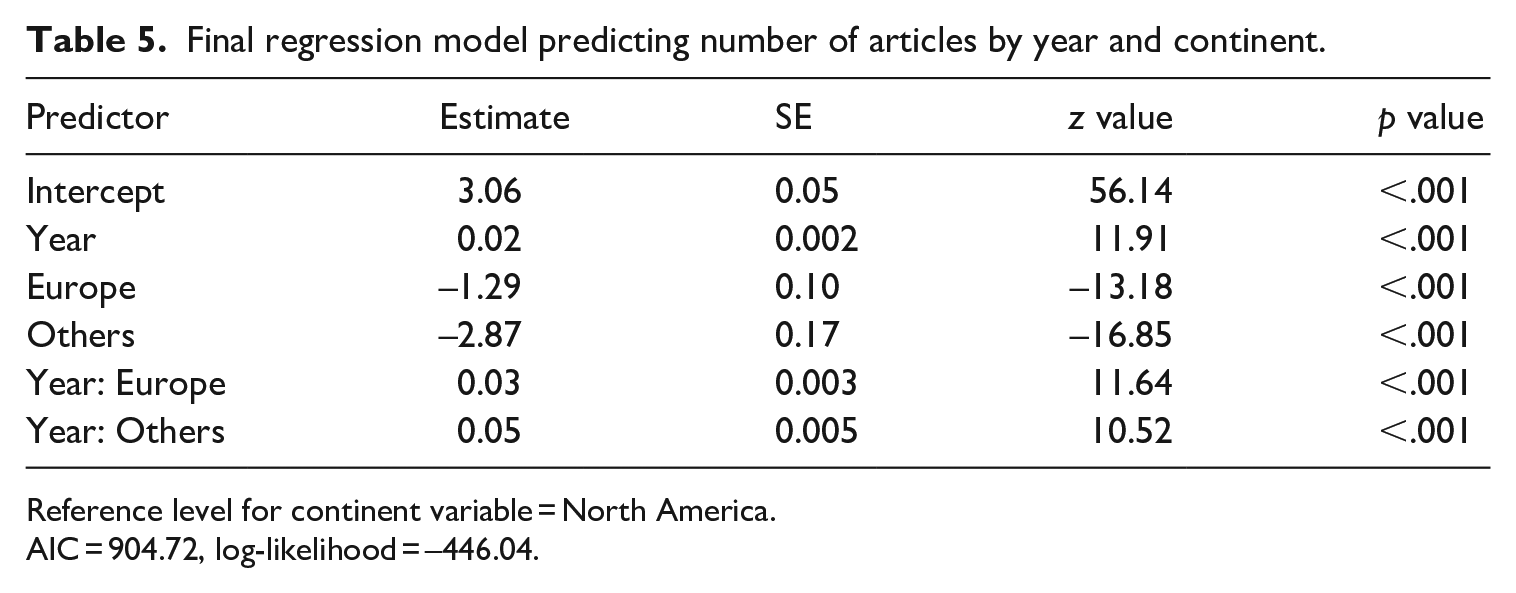
Reference level for continent variable = North America.
AIC = 904.72, log-likelihood = –446.04.
Figure 10 indicates that, collectively, the publication rate of authors outside North America is growing more rapidly than that of authors affiliated in North America. This is similar to the pattern of results in our analysis of languages, which reflects the fact that research on English, a large amount of which is produced in the United States, is growing at a slower rate than research on languages other than English.
Discussion
In this article, we aimed to determine the diversity of child language acquisition research over the modern history of the field by coding all articles published in the field’s four main journals, from their inception until the end of 2020. We were primarily interested in language coverage, but also analysed the frequency with which monolingual and multilingual groups were studied, the distribution of research topics, and the locus of research production, as defined by the country of authors’ affiliations. While we found a healthy distribution of topics covered, the field only has data for around 1.47% of the world’s languages, and predominantly focuses on acquisition in monolingual children. This sample is heavily skewed towards English and a few other Indo-European languages, a result mirrored in the analysis of who produced the research, where 87% of the articles had authors based in North America or Europe. Our knowledge of languages outside of the Indo-European family is comparatively poor, with most languages having only one article published on them. While there are signs that the field is diversifying in terms of the number of authors based outside of North America, authors from the Global South are rare. In the remainder of the article, we discuss the implications of the results, and review some suggestions for ways to increase data coverage.
The estimate of language coverage is slightly higher than previously reported by Lieven and Stoll (2009), Crystal (2014) and Slobin (2014), although it is not a great deal higher. We acknowledge that we might have underestimated the number of languages because child language research is published outside of the four journals we coded. Our research is published across a wide range of linguistics and psychology journals, and in edited volumes and conferences proceedings. Articles on non-Indo-European languages also appear in domestic or specialised linguistics journals (e.g. Lillo-Martin et al., 2016; Meakins & Algy, 2016; Pye, 2013). Unfortunately, we (somewhat pessimistically) doubt that widening our search would have changed the estimate drastically: developmental psychology journals appear to have an even more extreme bias than we see in child language acquisition (see Nielsen et al., 2017) and coverage in major child language conferences is quite similar to the larger set of findings we report here (Kelly & Nordlinger, 2014), suggesting that widening the search to other journals would not improve the result. Finally, all but two languages (Georgian, Kaluli) that appeared in Slobin’s (1985–1997) book series are contained in our data set.
It appears, then, that much of what we know about child language acquisition comes from a handful of Indo-European languages, with a weighty proportion of the published research coming from studies of English. It is important to consider the degree to which this might be a problem. While Indo-European covers the largest area of the globe and has the largest number of speakers (an outcome of colonialism), it is only the sixth-largest family in terms of number of languages, containing 445 (Eberhard et al., 2021). Compare this to the two largest families, Niger-Congo and Austronesian, which are estimated to have 1535 and 1225 languages, respectively. Or to Trans-New Guinea, whose 477 languages show remarkable diversity even though they are geographically packed into a comparatively tiny area (Pawley & Hammarström, 2018). Languages diversify unevenly across the globe, with greater diversity within the Tropics (Gorenflo et al., 2012), far away from the Global North countries that produce most of our research. In many respects, we will not be able to lay claim to having representative and generalisable theories of child language acquisition until we can redress this balance. Or as Pye (2021) puts it: ‘the data needed to construct a representative sample of languages to test acquisition theories in a meaningful way do not exist’ (p. 454).
It is instructive to consider the typological space our current data inhabit and what we might be missing out on. The majority of child language data comes from the languages of the European continent (thus even within the Indo-European family, coverage is skewed). While these languages show some diversity, they also have recognisable, common features, many of which are typologically rare in other language families. These include definite and indefinite articles, relative clauses with relative pronouns, the ‘have’-perfect, nominative experiencers, participial passives, negative pronouns and a lack of verbal negation, and verb fronting in polar interrogatives (for a full list of ‘Standard Average European’, see Haspelmath, 2001; on the exceptionality of north-western European languages, see Cysouw, 2011). This skew means that we know much less about features more common outside of European sprachbund, such as tone (Singh & Fu, 2016), polysynthesis (Kelly et al., 2014; Mithun, 1989), obviation (Henke, 2021), ergativity (Bavin & Stoll, 2013) and clause chaining (Sarvasy & Choi, 2020), to name but a few. It also means we have limited understanding of how children might acquire typologically rarer phenomena (e.g. symmetrical ‘Philippine-style’ voice, see Garcia & Kidd, 2020), which are existence proofs of what is possible in natural language and may be particularly challenging to theories built primarily on very different languages. We once again reiterate that these understudied features cannot be assumed to be surface variations masking the same underlying system; they represent unique design solutions to the core function of language – communication – having independently evolved across many successive generations of individual cultural groups. The degree to which such variation reflects any underlying core system of knowledge is an empirical question, but we will not answer it by concentrating on a handful of languages.
Some readers may rightly point out that we have mostly listed a range of morphosyntactic features, but no component of language is crosslinguistically invariable (Evans & Levinson, 2009). For instance, phonological systems vary as much as grammatical systems, and so too does the concept of ‘word’, which is less easily divorced from grammar in morphologically rich languages than it is in analytic languages like English. Thus, a child acquiring the polysynthetic language Murrinhpatha (non-Pama-Nyungan, Australia), where a whole clause is expressed in a complex verb phrase, is faced with a very different problem when learning verbs compared to a child acquiring English or German (Forshaw, 2021). The small amount of research on sign languages is also notable, meaning that we have yet to chart the wellspring of insights that the influence of modality has on the acquisition of linguistic systems. Taking a crosslinguistic approach seems even more important as we move away from the ‘nuts and bolts’ of language to topics that heavily interface with culture, such as pragmatics and discourse (e.g. event packaging in narrative, Berman & Slobin, 1994; politeness, Chang et al., 2021), non-verbal communication (e.g. gesture, Özyürek et al., 2008) and language and cognition (e.g. neo-Whorfian work, Majid et al., 2004).
It is important to emphasise that, while there is much more work to do in order to address sampling bias in child language acquisition research, there is no reason to think that some established patterns in acquisition would not replicate beyond self-evident aspects of learning (e.g. children’s productions become more grammatically complex with age). Our current evidence base contains many patterns that are suggestive of dynamic underlying organisation. For instance, early in acquisition young children produce prosodically constrained truncated words, with the manner in which they do so varying by language (Demuth, 1996; Fikkert, 1994; Forshaw, 2021). Crosslinguistically, there is an observable though not invariable preference to relativise syntactic subjects (see Lau & Tanaka, 2021). When and in what languages common patterns emerge provide important clues regarding the complex interplay between the mechanisms children bring to language acquisition and how those mechanisms act on the input throughout development. Crosslinguistic research is essential to this effort (Bowerman, 2011; Slobin & Bowerman, 2007).
Accordingly, the evidence base is in dire need of widening. We are currently working from such a skewed sample that we need data from big languages, smaller but healthy ones and most urgently, endangered ones (where those languages have children acquiring them). With respect to big (or at least ‘largish’) languages, there are real opportunities for researchers interested in languages such as Georgian, Kazakh, Indonesian, Telugu or Thai, to name but a few. However, unlike these languages, the majority of the world’s languages do not have millions of speakers. Citing Ethnologue, Pye (2021) notes that 80.5% of the world’s languages have under 100,000 speakers. Although speaker numbers are an imperfect guide to endangerment (i.e. many small languages thrive under the right conditions), the link between speaker numbers and language health is a legitimate one. Pye (2021) writes, Testing a theory of language acquisition with data from 19.5% of human languages cannot be justified. A sample that is typologically skewed toward Indo-European languages makes a bad situation worse. (p. 455)
Currently, our theories are based on less than 2% of the world’s languages, so we are some way from 19.5%. A reasonable question, then, is how can we begin to redress the imbalance? There are beginnings of movement in this space, but a step change in capacity is needed. Pye (2021) argues that one practical and productive way to widen the evidential base is to focus on lexical acquisition in endangered languages. Along similar lines, Defina et al. (2021) have developed a set of guidelines for an ‘acquisition sketch’, in which a researcher would write an overview of acquisition for understudied languages, endangered or otherwise, using a minimum of 5 hours of naturalistic data. Both of these approaches aim at rapidly widening the breadth of languages for which we have data, attempting to integrate insights from language documentation into child language acquisition. This breadth approach complements approaches that aim for greater depth, such as the ACQDIV project (Jansco et al., 2020), which samples typologically distant languages with good child language corpora to attempt to draw broadly generalisable conclusions about acquisition.
However, many aspects of working on understudied languages are time-intensive (and in the case of endangered languages, particularly difficult, Kelly et al., 2015), such that we will never achieve a representative sample unless we make drastic changes to the way we collect data and who collects it. Technology has a big role to play. In particular, there have been exciting developments in daylong recording technology (Casillas & Cristia, 2019), and we can hope for a day when much of the transcription bottleneck is alleviated by good speech-to-text transcription. Similar developments that would be beneficial to the production of sign language corpora, to our knowledge, do not currently exist. The COVID-19 pandemic has also ramped up the development of data collection through the Internet, such that it is possible to collect corpus data and run experiments through the Internet if participants have reasonable Internet connections (Garcia, Roeser & Kidd, 2021; Mai & Yip, 2017).
Even if we vastly improve automated transcription, we still need trained researchers to interpret and analyse the data. This process is made substantially easier if the researcher already has a good command of the target language. Here is where our results for the locus of research production are particularly pertinent. Child language acquisition, it seems, is dominated by researchers from wealthy, industrialised countries. Recent efforts at greater inclusion include the Truly Global /L+/ Summer/Winter School on Language Acquisition, 7 aimed specifically at students from the Global South. However, a much bigger effort framed around discussions concerning diversity in the workplace is required at the institutional level. It is incumbent on us as the custodians of the discipline to move the goals of the field into a direction that will more easily allow and reward research on child language acquisition in understudied languages across every component of the discipline, from student theses to professional recognition at the university and field level (e.g. for grant applications, in our journals, lobbying institutions for greater recognition of non-standard outputs such as corpora, see Thieberger et al., 2016). For many students who speak an understudied language, this may require alternative pathways to study and additional support in skills training. Insofar as this will diversify our discipline, it is hard work worth doing. 8
One encouraging feature of the results is that, while there is some variability in the topics to which child language research has been devoted, we observed almost the same distribution within our language categories, and the growth rates for each individual topic excluding Non-verbal communication are all qualitatively similar. That is, we found linear growth across all topics in studies of English, and non-linear growth in other Indo-European languages and non-Indo-European languages (although for Phonology the contrast between English and non-Indo-European was positive but not significant). The difference in result was most likely due to low numbers of articles investigating non-verbal communication, where growth across all language groups was linear, which likely reflects the relatively young age of this subdiscipline and the fact that there are specialist journals devoted to the topic (e.g. Journal of Non-Verbal Behavior, Gesture). Thus, when researchers have studied languages other than English, their questions are not skewed in ways that are not representative of the field as a whole. Overall, research on languages other than English is contributing at a more rapid rate to progress in the field than is work on English.
We also found that the four journals published research with monolinguals more frequently than research with multilingual populations. However, whether or not a sample was mono- or multilingual was not always explicitly stated, and being monolingual was often treated as an unspoken norm. This is likely attributable to several variables, including a general orientation of the journals towards monolingual research, the existence of journals devoted to bilingualism, and perhaps the Anglocentric bias of the field. A discussion of the impact a primary focus on monolinguals has for child language theory is beyond the scope of this article, but it is important to remember that a majority of children across the world grow up in multilingual settings (Tucker, 1998), which is more representative of how language has been acquired across the history of our species. We recommend that journal editors consider requiring authors to explicitly state their recruitment criteria to help contextualise the results of published work. This may add important nuance to discussions of comparability and replicability of experimental effects.
As a final point, we stress that we are not claiming that further work on well-studied languages is not needed. On the contrary, the large volume of past work on these languages allows researchers to ask different kinds of questions precisely because acquisition is so well mapped out. A lot of research on well-studied languages involves experimentation, which is not always as easy to conduct in understudied languages, where naturalistic data collection might be an important first step. Experimentation is the foundation of any science, and there are many important questions that we can ask of well-studied languages, provided that we are aware that the conclusions that we make and mechanisms we propose are reasonable and flexible enough to hold crosslinguistically. In addition, accurate measurement tools such as standardised tests of language proficiency and tests of cognitive function (e.g. memory, attention) most commonly exist for bigger, well-studied languages, allowing researchers to ask questions about the sources and consequences of individual differences in acquisition (E. Bates et al., 1995; Kidd & Donnelly, 2020). This research interfaces with work on language disorders and delay, which is an important applied outcome of our collective endeavours.
Conclusion
In this article, we have taken stock of the past child language literature published in the field’s four main journals to determine the degree of language coverage to which the field can lay claim, whether this has changed over time, the kinds of topics on which research is published, the participant groups we typically study, and from which regions researchers come. The overall finding echoes similar analyses in related disciplines such as developmental psychology (Nielsen et al., 2017) and adult psycholinguistics (Anand et al., 2011; Jaeger & Norcliffe, 2009): child language acquisition research is not very diverse. Our research base draws from less than 2% of the world’s languages, with most of our evidential base skewed towards English and other well-studied Indo-European languages. We found evidence that the field is moving away from a historical reliance on English (Slobin, 2014); however, it is important to remember that much of the linguistic diversity we found is concentrated in the Global North or in other comparatively wealthy countries with emerging research cultures. A concerted effort is needed to further diversify the field so that we can both build scientifically generalisable theories and a more diverse research community.
Footnotes
Appendix 1
Frequency distribution of articles on different languages published in child language journals from 1974 until 2020.
| Language | Freq. |
|---|---|
| Afrikaans | 1 |
| American sign language | 15 |
| Arabic | 15 |
| Armenian | 1 |
| Basque | 4 |
| Bengali | 1 |
| Bontok (Central) | 1 |
| British sign language | 6 |
| Bulgarian | 3 |
| Cantonese | 28 |
| Catalan | 18 |
| Chintang | 1 |
| Conchucos Quechua | 1 |
| Cree (Northern East) | 1 |
| Czech | 5 |
| Danish | 14 |
| Dutch | 115 |
| English | 1790 |
| Esperanto | 1 |
| Estonian | 13 |
| Faroese | 2 |
| Farsi | 7 |
| Finnish | 30 |
| French | 215 |
| Frisian | 3 |
| Galician | 3 |
| German | 136 |
| Greek | 26 |
| Greenlandic | 1 |
| Hebrew | 90 |
| Hindi | 3 |
| Hmong | 2 |
| Home sign | 2 |
| Huli | 1 |
| Hungarian | 7 |
| Icelandic | 8 |
| Igbo | 1 |
| Indonesian | 1 |
| Inuktitut | 4 |
| Irish | 8 |
| Italian | 114 |
| Jamaican Creole English | 2 |
| Japanese | 63 |
| K’iche’ | 3 |
| Kannada | 1 |
| Kigiriama | 2 |
| Korean | 29 |
| Kurdish | 1 |
| Latvian | 1 |
| Laz | 1 |
| Limburgian | 1 |
| LIS (Italian sign language) | 1 |
| Lisu | 1 |
| Lithuanian | 5 |
| Malay | 3 |
| Malayalam | 1 |
| Maltese | 3 |
| Mandarin | 83 |
| Maori | 2 |
| Marathi | 1 |
| Min Nan | 4 |
| Mohawk | 1 |
| Navajo | 1 |
| Nepali | 1 |
| Ngas | 1 |
| Norwegian | 17 |
| Nungon | 1 |
| Polish | 25 |
| Portuguese | 25 |
| Punjabi | 1 |
| Quebec sign language | 1 |
| Réunion Creole | 1 |
| Romanian | 4 |
| Russian | 35 |
| Samoan | 2 |
| Serbo-Croatian | 12 |
| Sesotho | 6 |
| Setswana | 1 |
| Signing exact English | 4 |
| Slovenian | 2 |
| Southern Peruvian Quechua | 5 |
| Spanish | 153 |
| Swahili | 4 |
| Swedish | 21 |
| Tagalog | 8 |
| Tamil | 10 |
| Telugu | 1 |
| Thai | 5 |
| Tongan | 1 |
| Trinidadian Creole English | 2 |
| Tsonga | 2 |
| Turkish | 28 |
| Turkish sign language | 1 |
| Ukrainian | 2 |
| Urdu | 2 |
| Warlpiri | 4 |
| Warlpiri (Light) | 2 |
| Welsh | 5 |
| Wichi | 1 |
| Wolof | 2 |
| Xhosa | 1 |
| Yucatec | 2 |
| Zulu | 1 |
Appendix 2
Frequency distribution of articles published in child language journals from 1974 until 2020 based on the country of affiliation of the authors.
| Country | Freq. |
|---|---|
| Argentina | 1 |
| Australia | 123 |
| Austria | 11 |
| Bangladesh | 1 |
| Belgium | 36 |
| Brazil | 8 |
| Bulgaria | 1 |
| Canada | 293 |
| Chile | 5 |
| China | 45 |
| China Hong Kong | 5 |
| Colombia | 1 |
| Costa Rica | 1 |
| Croatia | 4 |
| Cyprus | 7 |
| Czechia | 4 |
| Denmark | 18 |
| Ecuador | 1 |
| Estonia | 8 |
| Finland | 30 |
| France | 139 |
| Germany | 152 |
| Greece | 16 |
| Hungary | 6 |
| Iceland | 1 |
| India | 4 |
| Iran | 3 |
| Ireland | 17 |
| Israel | 103 |
| Italy | 110 |
| Japan | 52 |
| Kenya | 2 |
| Kuwait | 3 |
| Lesotho | 1 |
| Lithuania | 4 |
| Malta | 3 |
| Mexico | 8 |
| Nepal | 1 |
| Netherlands | 139 |
| New Zealand | 18 |
| Norway | 25 |
| Peru | 2 |
| Philippines | 2 |
| Poland | 15 |
| Portugal | 16 |
| Romania | 2 |
| Russia | 12 |
| Serbia | 6 |
| Singapore | 7 |
| Slovenia | 2 |
| South Africa | 6 |
| South Korea | 19 |
| Spain | 54 |
| Sweden | 20 |
| Switzerland | 41 |
| Taiwan | 16 |
| Thailand | 2 |
| Trinidad and Tobago | 3 |
| Turkey | 15 |
| United Arab Emirates | 1 |
| United Kingdom | 446 |
| United States | 1435 |
| Venezuela | 2 |
Acknowledgements
The authors thank Adam Usher, Marina Koleva, Jefta Lagerwerf and Inge Stok for help in coding the data, Jens Roeser and Seamus Donnelly for statistical advice, and Rachel Nordlinger, Nick Evans, Barbara Kelly, Birgit Hellwig, Caroline Rowland, Chloë Marshall and two anonymous reviewers for helpful comments.
Author contributions
Funding
The author(s) disclosed receipt of the following financial support for the research, authorship and/or publication of this article: The research was supported by the Max Planck Society and the Australian Research Council (CE140100041).