
Abstract
Lithium-ion batteries (LiBs) are well-known power sources due to their higher power and energy densities, longer cycle life and lower self-discharge rate features. Hence, these batteries have been widely used in various portable electronic devices, electric vehicles and energy storage systems. The primary challenge in applying a Lithium-ion battery (LiB) system is to guarantee its operation safety under both normal and abnormal operating conditions. To achieve this, temperature management of batteries should be placed as a priority for the purpose of achieving better lifetime performance and preventing thermal failures. In this paper, fibre Bragg Grating (FBG) sensor technology coupling with machine learning (ML) has been explored for battery temperature monitoring. The results based on linear and nonlinear models have confirmed that the novel methods can estimate temperature variations reliably and accurately.
Keywords
Introduction
Lithium-ion batteries (LiBs) are one of the most promising energy storage techniques in power systems and mobile facilities by virtue of its higher power and energy densities, longer cycle life and lower self-discharge rate qualities (Kang et al., 2014). These features are highly suitable for various types of portable electronics devices, electrical vehicles (EV), energy storage applications, aircrafts and even aerospace applications (Li et al., 2020, 2021). However, the extensive applications are usually operated under a wide range of extreme environments, like high-altitude/latitude, elevated temperatures and high charge/discharge rates (Richardson, 2016). This is likely to cause a series of issues in battery thermal management.
For instance, when the environment temperature is below 0°C, the depth of discharge (DoD) and the power output of the battery decrease significantly (Xie et al., 2022). However, operating at high temperatures (40°C) will also accelerate the chemical or mechanical reaction happening between electrolyte and the electrodes (Amine et al., 2005). In this case, solid electrolyte interphase (SEI) will be formed, which leads to the impedance increase at the anode and active lithium reduction in the battery (Liu et al., 2020). Furthermore, the decomposition of electrolyte results in active lithium loss. The aforementioned aging mechanisms lead to capacity fade (Liu et al., 2020). If the generated heat cannot be sufficiently dissipated, the battery internal temperature goes beyond the acceptable scope rapidly and then results in a great many exothermic events within the battery, such as fires, venting and electrolyte leakage (Feng et al., 2015; Liao et al., 2019). Moreover, the nonuniform thermal distribution inside the battery will result in the issues of inconsistent electrochemical processes and thus decrease the battery pack cycle life (Olabi et al., 2022). In this sense, maintaining the operating temperature of battery under safe and optimal conditions is extremely important. It is necessary to monitor and predict temperature variations through a reliable and effective method.
The conventional ways to detect the thermal features are to use flexible thin-film thermocouples (TFTCs) (Li et al., 2013) or micro-thin-film resistance temperature detectors (RTD) (Lee et al., 2011) attached to the surface or embedded into battery cores. These methods suffer from various limitations, such as vulnerability corroded by internal/external environment, complex to operate and low accuracy of detection (Lee et al., 2011). In contrast, electrochemical impedance spectroscopy (EIS) (Barsoukov and Macdonald, 2005) exhibits the advantages that no temperature sensors are required, thermal measurements are short and the measured battery cells are non-destructive while indicating the internal and external temperature of LiBs. At the same time, the sensorless methods also face the challenges of State of Charge (SoC) and ageing dependence on the impedance, measuring parameters crosstalk interference and operation frequency selection (Raijmakers et al., 2019). Johnson noise thermometry (JNT) method (Edler and Seefeld, 2015) is an appropriate candidate for measuring temperate that the applications working in a harsh environment (e.g. nuclear reactors). Nonetheless, there are relatively large errors in measuring the surface temperature of a battery pack when it is coupled with a giant magnetoresistance (GMR) sensor and a K-type thermocouple (Raijmakers et al., 2019).
In recent years, the methods for battery temperature monitoring based on various optical fibre sensing techniques have been explored (Han et al., 2021). For instance, with the assistance of optical fibre sensors, Yu et al. (2022) used the Rayleigh scattering approach to decode the internal temperature and strain evolution of a pouch battery cell. Wei et al. (2022) presented a method for real-time temperature distribution measurement by implanting the distributed fibre optical sensor (DFOS) into a battery cell. The configured smart cell can achieve a real-time distributed sensing of the temperature matrix with a high spatial resolution of 2.6 mm. Yang et al. (2022) proposed a distributed thermometry method using optical frequency domain reflectometry (OFDR). The technique was demonstrated on a three-cell pouch-type battery pack. The experimental results indicated that the sensor can simultaneously measure temperature distribution of multiple battery cells.
Particularly, fibre Bragg grating (FBG) sensors have been extensively investigated and used in monitoring battery thermal variations because the Bragg wavelength favourably shifts linearly with temperature under certain conditions (Han et al., 2021; Wei et al., 2021). Additionally, FBG sensor is superior to conventional thermal sensors in terms of its electricity immunity, high sensitivity, multiplexing, and the possibility of the integration inside the batteries. (Nascimento et al., 2017; Raijmakers et al., 2019).
Yang et al. (2013) initiated the investigation of optical fibre Bragg grating (FBG) sensors in LiBs to measure external temperature variations under normal (discharged at various current) and abnormal conditions (overcharge and external short-circuit). The results showed the FBG sensors have faster thermal response in comparison with the thermocouples. Moreover, this method can be also employed to detect temperature distribution of battery stack. Following this research, a number of experiments have been conducted in terms of the technical reliability and measurement complexity. For instance, Meyer et al. (2015) investigated the advantages of FBGs for enhanced battery safety by several different experiments. First, with the FBG sensor network, the temperature of each cell was recorded during fast charging, which showed FBG sensors can detect the maximum temperature more accurately than the thermistors. Second, the characteristic volume behaviour of LiBs was detected precisely by FBG sensors, although the sensors did not show a clearly detectable aging under nominal and accelerated conditions. In addition, it was found that the sensitivity of the FBG strain sensor is much higher (around 50 times) than the sensitivity of the temperature sensor. These results show that the FBG sensor application offers an alternative approach to avoid thermal runaway. Likewise, Nascimento et al. (2017) made a comparative study using FBG sensors and thermocouples to monitor battery thermal variations in real-time at three different battery locations (top, middle and bottom) under both constant current charge and various discharge rates (0.53 C, 2.67 C and 8.25 C) conditions. They found the responses of the two types of sensors under lower C-rates are closer to each other, whereas FBG sensors under abuse conditions (higher discharge rate) showed rapid response to the heat generation in all locations.
Furthermore, FBG sensors for permanent and immediate monitoring of the internal temperature were also studied. For instance, Schwartz et al. (2015) explored to use a single FBG sensor embedded directly into the electrode stack of lithium-ion pouch cells, which detected both mechanical strain from lithium-ion insert into the electrodes and thermal strain from temperature variations under normal charge-discharge conditions. At the same time, another FBG sensor without experiencing the mechanical strain was loosely attached to the top of cell surface as a temperature reference sensor to decouple the intercalation mechanical strain from the embedded FBG signal. The research showed signals obtained from the internal sensors were stronger (over four times) than those detected from external sensors of the pouch. Similarly, Novais et al. (2016) conducted research on measuring internal and external temperature variations through four FBG sensors during different C-rates. In their experiment, two FBG sensors were inserted between two separators layers, that is, at the centre of the electrochemically active site and near the tab-electrode connection. Meanwhile, another two external sensors were placed on the surface of the pouch cell, parallel to the above internal sensors. The study also indicated the observed external temperature variations were significantly lower than the internal temperature (e.g.
However, the aforementioned studies were conducted under ambient temperatures. Considering the wide range of practical working environments of battery-driven facilities (e.g. EVs), Nascimento et al. (2019) further proposed an FBG-based sensor network for monitoring the surface temperature of LiB in a smartphone under dry, temperate and cold environments, at constant charge and different discharge rates (1.32 C, 2.67 C and 5.77 C). In this experiment, it is interesting to note that five different spots of battery surface were monitored both in situ and in operando only using a single optical fibre. The results confirmed that the FBG sensor network is a precise and useful tool that can be employed to monitor the temperature variations of LiBs. More specifically, the thermal mapping demonstrated that the detected highest temperature was at the top of the battery (near of the electrodes), followed by the top-middle position. The temperature at the middle-bottom was slightly higher than that at the middle. The lowest temperature in all cases was detected at the bottom of the battery. These findings offered strong evidence for an effective cooling system design. Zhang et al. (2022) proposed a novel data-driven-based FBG sensor temperature calibration method that can achieve desirable estimation results under a wide range of environments. These make the FBG-based temperature monitoring methods more friendly to use in more real-life applications.
In summary, it can be concluded that the existing FBG sensor-based battery temperature measurement studies have demonstrated the great potential of FGB sensors in LiB temperature management, given their advantages such as rapid response and precise measurement under both normal and abnormal conditions. However, the aforementioned research on FBG-based temperature monitoring methods is still at a nascent stage. Using FBG sensors attached to the surface of battery or inserted into battery cell alone is not sufficient to monitor the battery states in full. Battery temperature estimation models still play a key role in keeping battery safety. Among the common battery thermal estimation models (Jiang et al., 2022; Karimi et al., 2022; Mahamud and Park, 2022), machine learning (ML) can be utilized to efficiently estimate the temperature variations of LiBs (Liu et al., 2018) as ML does not need the knowledge or data of the internal characteristics of the batteries (Li et al., 2022) and is able to learn the linear and/or nonlinear system dynamics.
In this paper, we explore to combine the wavelength of FBG sensors and battery working parameters with ML to monitor LiB surface temperature. In detail, multiple sensor signals, terminal voltage, battery current and surface temperature are obtained from a lab experimental setup. Then, a linear method and a nonlinear data-driven method are developed. The input terms with the maximum contributions are selected first by a fast recursive algorithm (FRA; Li et al., 2005). Then two data-driven models are constructed, and temperature estimation has been achieved by FRA-linear and FRA-nonlinear models separately. Finally, based on the experimental results, the battery thermal estimation performance under two different models is compared.
The remainder of the paper is organized as follows. Section ‘Preliminaries’ provides the details of the FBG sensor, linear/nonlinear modelling methods and the FRA. The experimental setup, the two-stage data-driven methods, and the estimation results are detailed in section ‘Simulation results and discussion’. Finally, section ‘Conclusion and future work’ concludes the paper and the future research is also discussed.
Preliminaries
FBG sensor
FBG sensor is an optical filtering device which enables a particular wavelength of the light spectrum to be reflected back while the remaining part is transmitted nearly without being affected (Raijmakers et al., 2019). The wavelength of the reflected signal is named as the Bragg wavelength

where
Linear model
The linear model assumes that the linear relationship between the independent input variables

where
Nonlinear model
A nonlinear model describes nonlinear relationship between the dependent variable

where
FRA
FRA (Li et al., 2005) can solve the least-squares problem recursively without the need for matrix deposition and transformation. Therefore, the method is efficient in constructing both model structure and calculate model parameters. In this work, the FRA is used to select the most relevant inputs and determine the parameters for linear and nonlinear models.
First, the FRA is introduced by defining a recursive matrix

where
Second, suppose


Suppose

From equations (8) and (9), the

Moreover, defining

From equations (5)–(7), equation (11) can become as

Equation (12) shows the net contribution of term
In order to simplify the computational complexity, two new quantities are defined

Based on equations (5)–(7) and equation (11), the following equation can be produced

From equation (15), we can get

Similarly, from equation (14), it can be derived

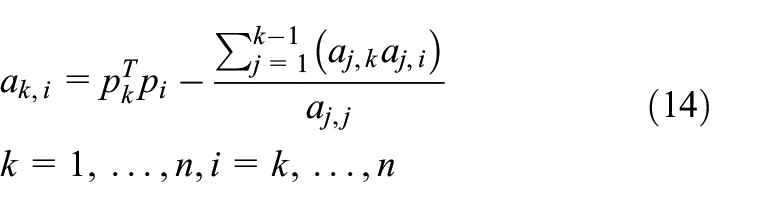
Finally, by substituting equations (16) and (17) into equation (12), the net contribution of

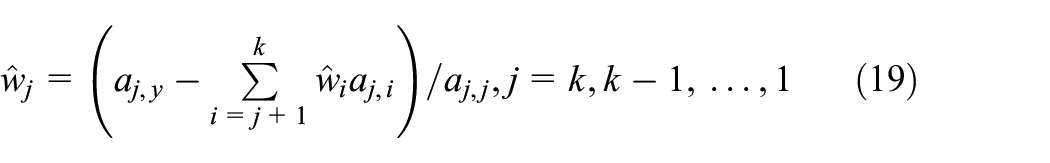
Equation (18) gives the fast algorithm for explicitly computing the net contribution of a selected model term. After selecting the model terms, the model parameter can be computed recursively using
Simulation results and discussion
Experimental setup
A schematic diagram of the experimental setup for thermal monitoring of the LiB is shown in Figure 1. In the work, a commercial cylindrical LiB cell (18650 LiFePO4, 3.2 V,
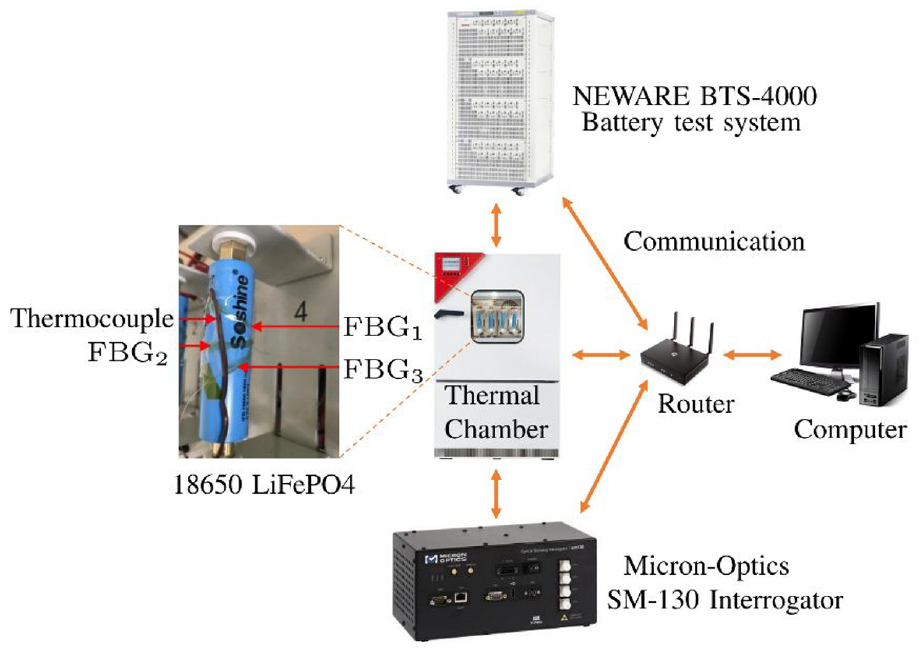
Schematic diagram for thermal monitoring of the lithium-ion battery.
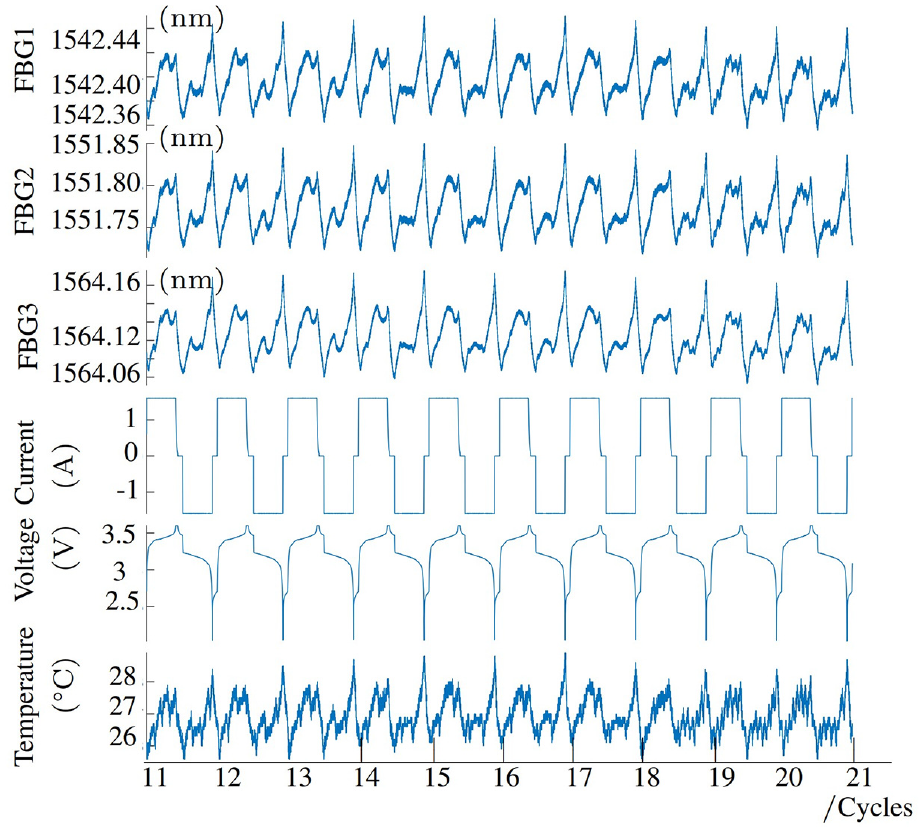
The whole process of the experiment was conducted under an ambient temperature. The tested cell was operated at the cycle of a constant-current constant-voltage (CC-CV) charging process and a constant-current (CC) discharging process. Specifically, the cell was charged under a CC of
Data collection
In the work, cycles of
Training and testing data in the project, cycles 11–20. Training data: cycles 11–15; testing data: cycles 16–20.
Data-driven models
Considering the necessity of higher accuracy and working efficiency for battery temperature estimation, a two-part data-driven method is developed in this paper, as shown in Figure 3. The first part is based on the FRA, which is mainly used to select the proper model terms for the purpose of reducing the computational cost and avoiding the over-fitting problems (Liu et al., 2018); FRA is capable of ranking the significance of the signals from the FBG sensors based on their correlations with the temperature measured by the thermal couple. Another function of FRA is to construct the linear and nonlinear models for battery external temperature estimation. The linear and nonlinear models can build linear and nonlinear relationships between the FBG wavelength shifts and the temperature as well as the choosing battery model working parameters. The detailed procedure to determine the significant terms and corresponding weights of linear/nonlinear models are shown as follows:
Generating the candidate model term pool which contains the aforementioned measurements:
Calculating the net contribution of model terms and choosing the most significant one using equation (18).
The procedure is repeated until no more significant cost function reduction can be achieved.
After selecting the appropriate model terms, calculate the model parameters using equation (19).
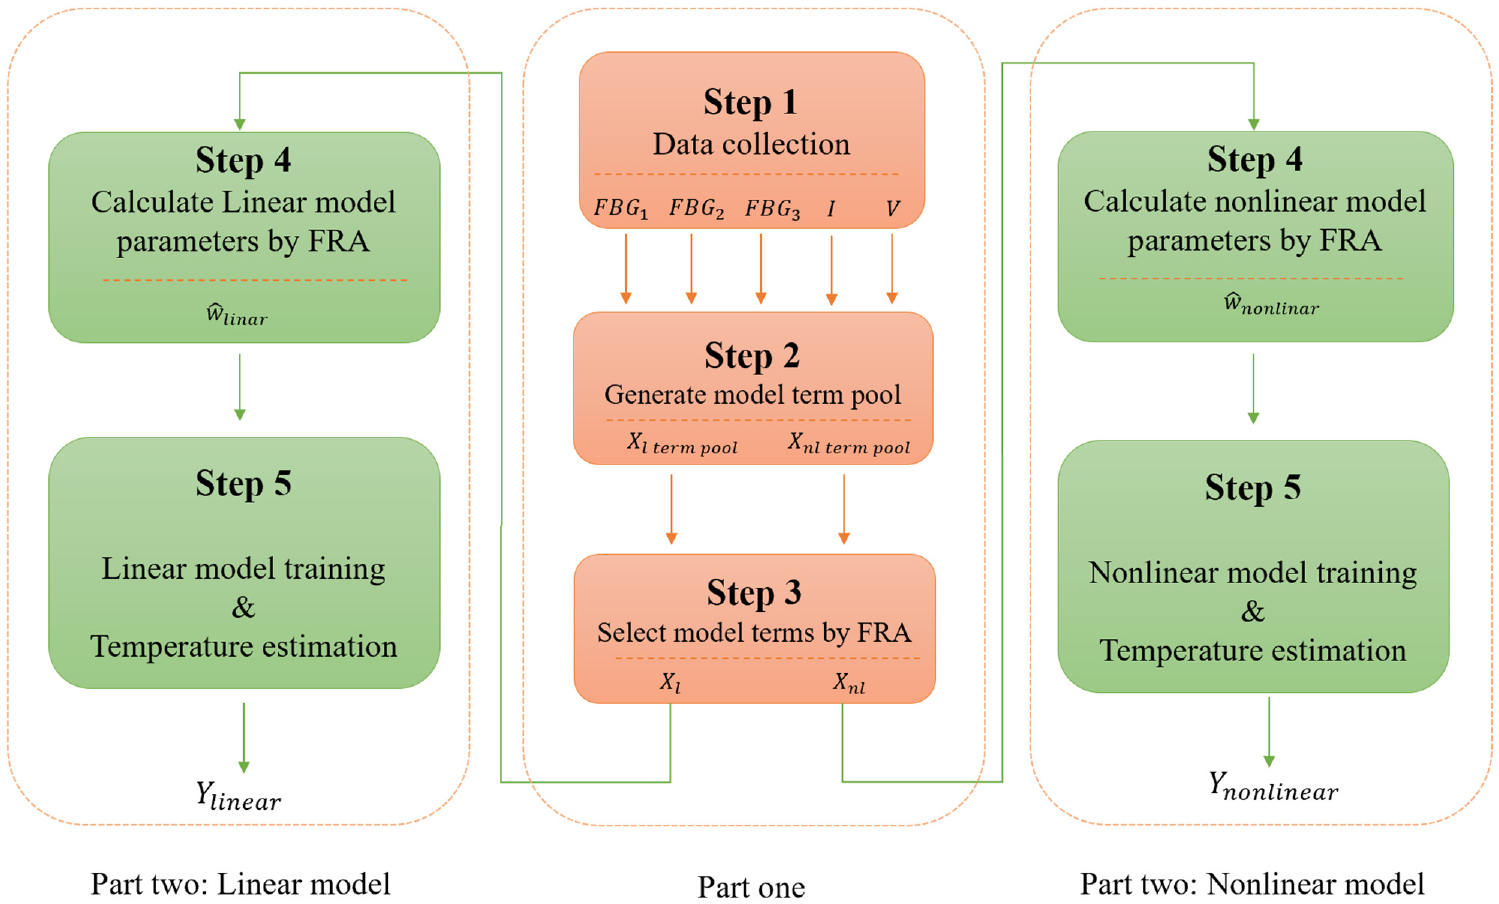
Flowchart of FRA-linear and FRA-nonlinear models.
Based on the first part of calculation results, the linear and nonlinear data-driven methods can be constructed respectively.
In order to evaluate the performance of the two models, two different performance metrics are introduced. The first is the mean squared error (MSE) for the temperature estimation. It is defined as

where
The second metric is the mean absolute error (MAE), which is calculated as the sum of absolute errors between the observed temperature and predicted temperature divided by the total number of samples used for model training or model testing

where
FRA-linear model
In the linear model, the term pool is

While the model terms selected by FRA in the first stage is

It is worth noting that the time spent on training using FRA for the linear model is 0.1094 seconds. Table 1 illustrates the training results and testing error using the FRA-linear model. It is shown that the MSE for both the training and testing is only
The training and testing performance of the FRA-linear model.
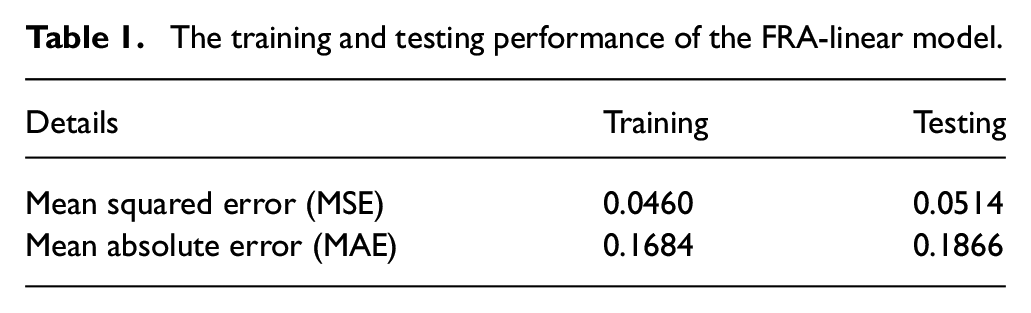
Figure 4 illustrates the temperature estimated by the FRA-linear model. The blue line is the battery surface temperature measured by the thermocouple, and the yellow line is the estimated battery temperature by the linear model. Obviously, the surface temperature prediction evolves smoothly around the actual values. This is essential in some practical applications (e.g. electric vehicles) because the relatively large errors may lead the battery thermal management system to delay taking further actions, thus resulting in a thermal runaway in a brief period. A higher level of compliance between the actual temperature and estimated temperature in Figure 4 leads to small values of MSE and MAE.
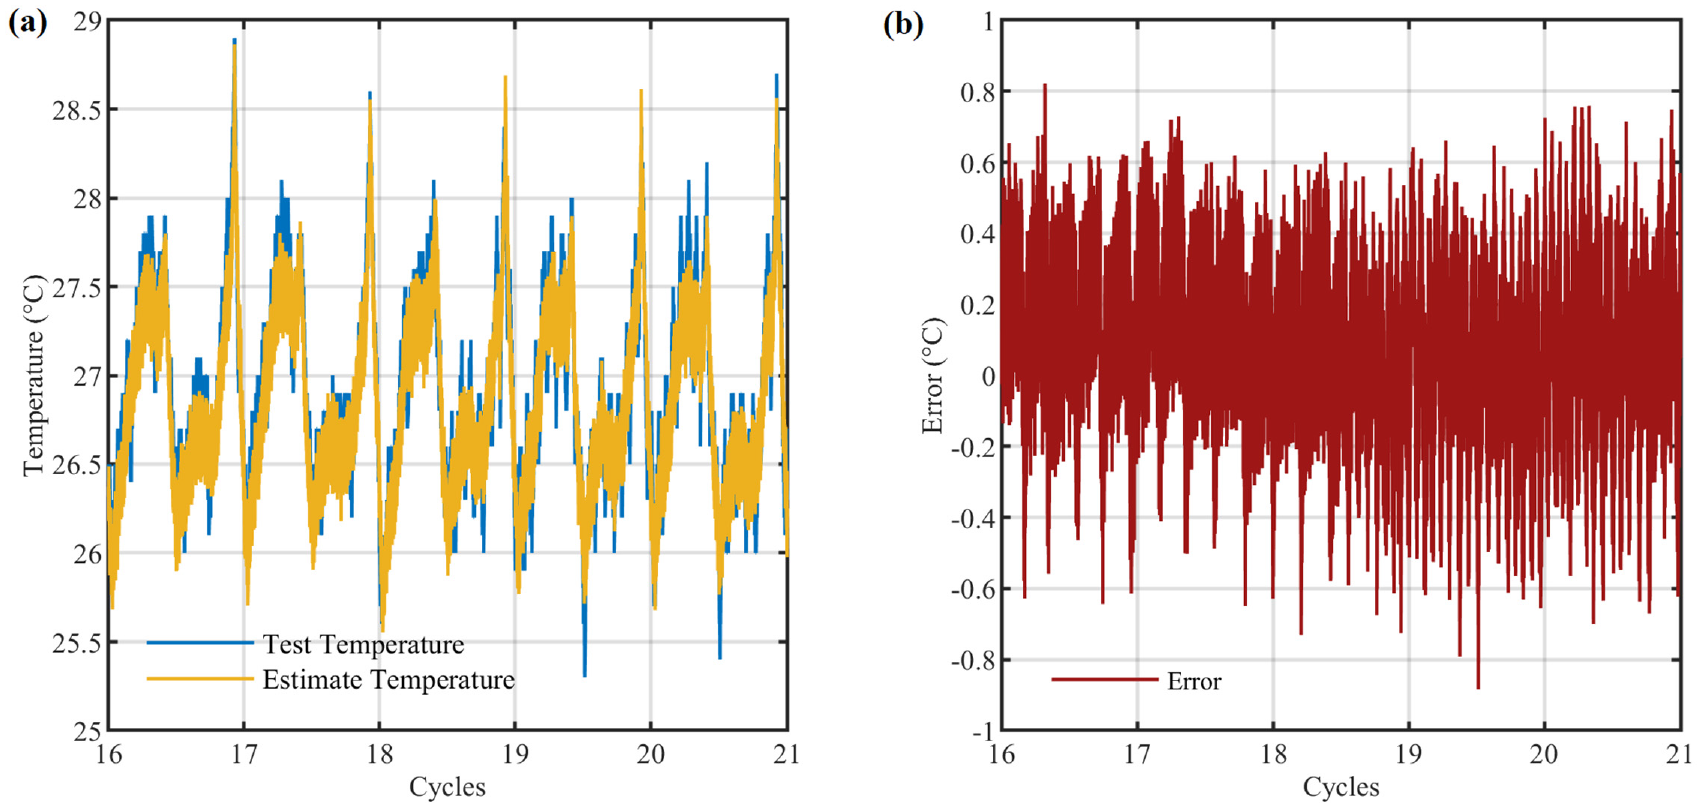
Testing performance using FRA-linear model: (a) testing: test temperature versus estimate temperature; (b) error: test temperature–estimate temperature.
The resultant linear model with the linear terms and its identified relevant parameters is provided as follows
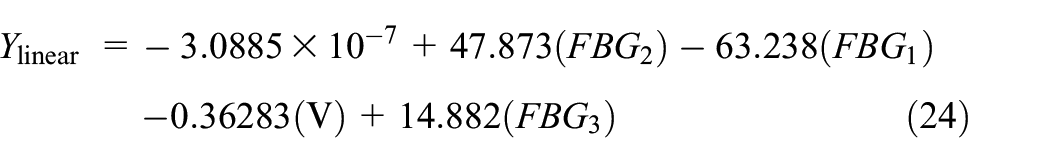
Equation (24) describes the linear relationship between the independent input variables
FRA-nonlinear model
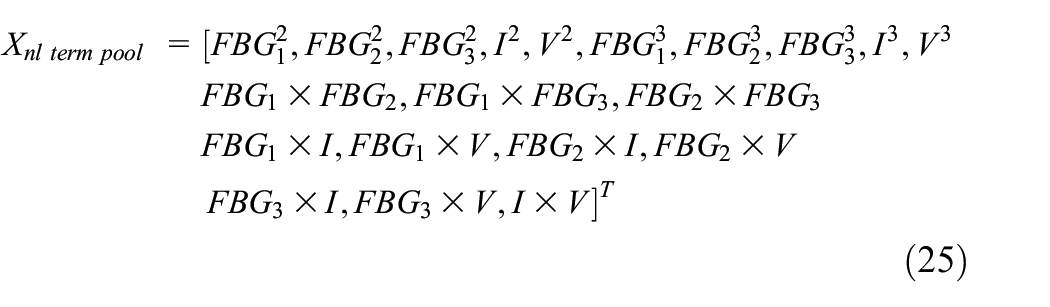
For the nonlinear model, the candidate nonlinear terms are
In the first stage, the terms with the largest contribution for the nonlinear model are selected by FRA, as shown below

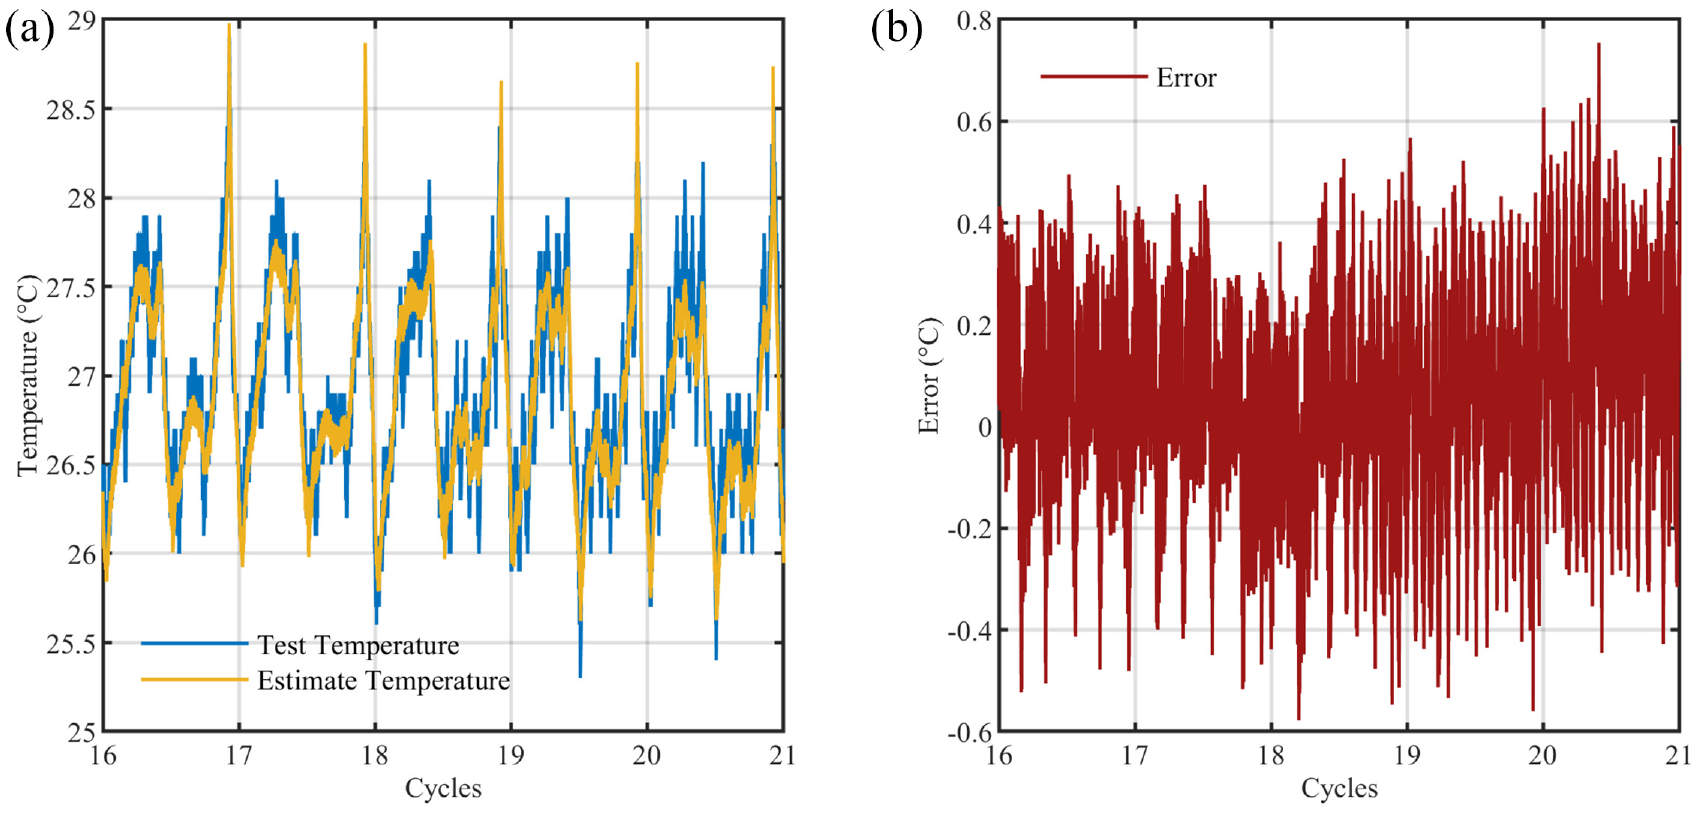
Testing performance using FRA-nonlinear model: (a) testing: test temperature versus estimate temperature; (b) error: test temperature–estimate temperature.
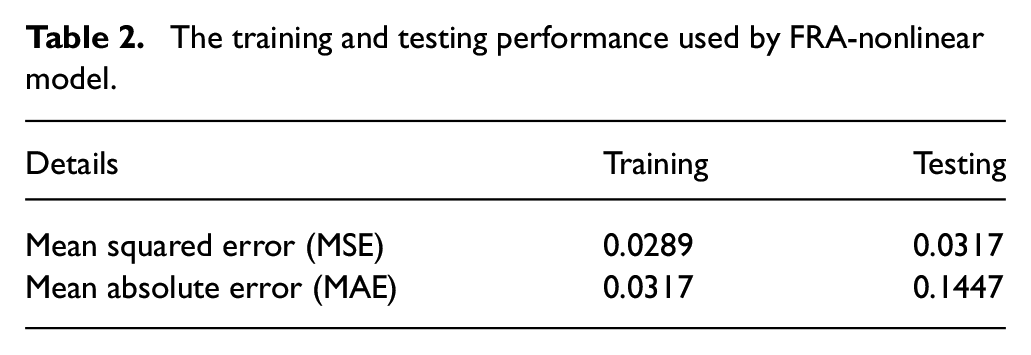
Furthermore, the training time spent on the FRA-nonlinear model is only
The training and testing performance used by FRA-nonlinear model.
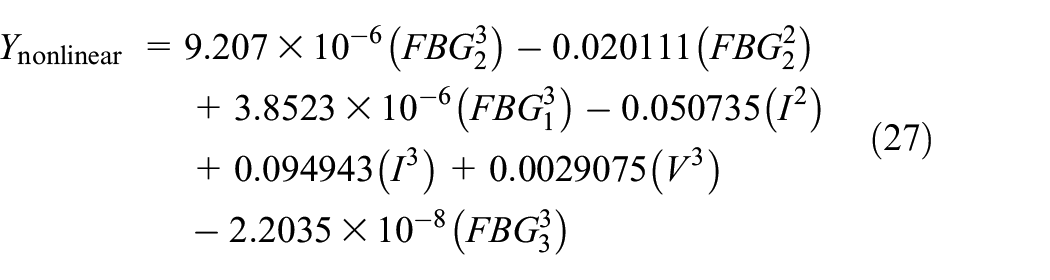
Equation (27) describes the nonlinear relationship between the dependent battery temperature
Discussions
This section provides the battery temperature simulation results based on both the FRA-Linear and FRA-nonlinear models. It is evident that the battery surface temperature can be accurately estimated via FBG-based data-driven methods. It should be pointed out is that the FRA-nonlinear model spent only
From the simulation results, it is clear that the
Conclusion and future work
This paper presents the detailed work of exploring the use of FBG sensors and ML to monitor battery temperature. Specifically, 3 FBG sensor signals, terminal voltage, battery current and surface temperature are obtained from a lab experiment setup. In order to improve the accuracy and efficiency of ML models, a two-stage data-driven method is provided.
In the first stage, the inputs with the largest contributions are selected by FRA. Then two different models (i.e. FRA-linear and FRA-nonlinear) are constructed separately. The model testing results show that the methods of integrating FBG sensor data and ML for battery thermal monitoring can predict the battery shell temperature effectively and accurately. For example, with the input data point of
However, it should be noted that the wavelength shifts of three FBG sensors used in the experiment are the results of the temperature changes, strain variations and other factors. We did not extract temperature-induced signals for model training and testing. The experiments conducted were based on the hypothesis that the temperature measurements on the surface of the battery were average values. In fact, the internal and external temperature distribution of the battery or different spots of the battery surface was nonuniform.
The future work will focus on further improvement of the model accuracy so as to effectively and timely detect the internal changes when the temperature and strain information on the battery surface have minor changes, thus enabling the early fault prevention.
Footnotes
Acknowledgements
S.L. acknowledges the scholarship from the University of Leeds to support his research.
Declaration of conflicting interests
The author(s) declared no potential conflicts of interest with respect to the research, authorship and/or publication of this article.
Funding
The author(s) disclosed receipt of the following financial support for the research, authorship and/or publication of this article: This work is partially supported by the SP Energy Network Funded project ‘A holistic approach for power system monitoring to support DSO transition’.