
Abstract
Age is an integral part of social interaction and identity but has been largely neglected in studies of early Christ groups. An understanding of the demography (the study of population patterns) of first century Roman cultures in the ancient Mediterranean is critical if one is to avoid, as much as possible, anachronistic and ethnocentric understandings of age in early Christ groups. Although average life expectancy at birth was low (mid-20s to early 30s), people did not expect to die young. This paper reviews ancient demographic evidence used to estimate life expectancy in the ancient Mediterranean (census data in papyri, funerary inscriptions, material culture and model life tables) and assesses Richard P. Saller’s simulation of the kin universe (1994). Clarifying the implications of demography is critical for studying the rhetoric and realities of age in early Christ groups in their ancient Mediterranean settings.
In explorations of the cultural and social worlds of the earliest Christ followers, 1 age as a social category has been largely neglected. While some studies grapple with topics related to issues of age within Christ groups (such as elders, parent-child relationships, and children), 2 very few have focussed on the importance of age as a critical element of social identity and interaction. 3 While other aspects of social identity such as gender and social status are often readily apparent and largely fixed, age is not always obvious, and, of course, ages of individuals shift over time. However, age structure, the culturally determined norms given to certain ages and stages of life, is relatively stable and was a pivotal factor in social relationships and negotiations around honour in the ancient Mediterranean world (LaFosse 2023: 10–11, 25–38). In fact, studying age might well be crucial for a holistic understanding of early Christ groups. The importance of age structure and age as a social category has long been recognized by anthropologists, who suggest that ‘in all societies, the biological differentiation of sex and age provide criteria for the ordering of social relations in the family’ (Campbell 1964: 179), that ‘all cultures must resolve the question of how to structure age differences’ (Fry 1980: 6), and that ‘adequate theories of society must take into account age and aging’ (Kertzer and Keith 1984: 21). 4
A pivotal study that considers the social context of age among early Christ followers is John M. G. Barclay’s (2007) study of age (or lack thereof) in Paul’s letters, which includes a nuanced analysis of age categories as culturally conditioned social constructs in the ancient Mediterranean context. Other studies with sensitivity to age include those by Abraham J. Malherbe (2008), R. Alistair Campbell (1996), and Carolyn Osiek and Margaret Y. MacDonald (2016). In more recent work, L. L. Welborn examines conflict related to age in 1 Clement (2017), and Mona Tokarek LaFosse (2023) uses a lens of age structure to suggest a unique reading of 1 Timothy that focuses on roles of older and younger women and men. 5
Several of these studies include helpful summaries of demography (Barclay 2007: 227–28; Welborn 2017: 51–54, 99–101; LaFosse 2023: 4–9, 165–69), which is, simply put, the study of population trends. Demography is a crucial factor in studying age structure, enabling us to see a ‘big picture’ of the population in the ancient Mediterranean. It involves an assessment of which age groups made up the largest portions of the population, the longevity of kin relationships (e.g., how likely was it that a twenty-year-old man had a living father?), and average life expectancies. Demography does not sketch the minutiae of individual lives. However, it can provide valuable data for considering how we might answer age-related questions in a historically and culturally sensitive manner.
In this article, I contend that for studies addressing age, familiarity with the complexities of demography in the ancient Mediterranean, including its limitations, is critical for understanding age structure and for avoiding, as much as possible, anachronistic and ethnocentric understandings of age structure in early Christ groups.
Age Guessing and Demography
Several laudable attempts to consider age, including ‘age guessing’, within early Christ groups demonstrate that a closer consideration of the demographic context of the ancient Mediterranean world would sharpen these ‘guesses’ and mitigate anachronist and ethnocentric concepts of age.
Jerome Murphy-O’Connor equates Paul’s self-identifying term in Philemon 9, πρεσβύτης (old man), with the age of sixty (1996: 4), suggesting that Paul presents himself to Philemon as an elderly man to portray himself as a ‘pathetic figure’ (1996: 4). Murphy-O’Connor’s basis for this ‘guess’ includes the stages of (male) life outlined in Philo (On the Creation 103–5), as well as Leviticus 27.2–7 (in which an old man’s monetary value drops after age sixty), the Damascus Document (in which a man over sixty should no longer be an officer or judge; CD 10.7–10), and a rabbinical list of ages (m. Aboth. 5.21). 6 On the basis of his dating of the letter to Philemon, in his opinion, Paul was born around 6 CE (1–4, 8).
The evidence from Philo, the Damascus Document and the Mishnah reflect expectations of a male life course, highlighting socially designed categories of age. The evidence from Leviticus accounts for the economic value of slaves from a much earlier (and different) cultural setting. As literary ideals of age they are not reliable as evidence of exact age categories and can hardly be used to date specific events, such as Paul’s age or date of birth. The rhetorical use of the term πρεσβύτης in Philemon is not about ‘pathetic’ age, but about honour in a setting in which ‘older’ and ‘younger’ depended heavily on context (Barclay 2007: 227; Hock 1995; LaFosse 2023: 246, 248–49), and honour of one’s elders was of utmost importance (e.g., Plutarch 1936, 100–101, Moralia 10.787D). An understanding of demographic realities could bring further insight to Paul’s use of πρεσβύτης.
A second example of ‘age guessing’ comes from Bart D. Ehrman’s comments on 1 Clement 63.3: ‘those who have lived blamelessly among us from youth to old age (ἀπὸ νεότητος ἀνασταραϕέντας ἕως γήρους ἀμέμπτως ἐν ἡμῖν)’ (Ehrman 2003: 148–9). Ehrman notes that ‘from youth to old age’ is a phrase that ‘must make [the letter-bearers] older than their mid–40s’ (Ehrman 2003: 25). He offers no explanation for proposing this particular age, but his assertion may be made on the basis of an assumption about what constituted ‘old age’ in the ancient world. However, as in Philemon 9, the rhetoric reflects honorific language. If the letter-bearers were indeed ‘old’, this was meant to convey their faithfulness over a lifetime (and likely a contrast with younger men who were challenging their elders; Welborn 2017; see also LaFosse 2023: 218–20). The language in 1 Clement gives us few clues to make a good guess about the letter-bearers’ ages, but an understanding of demography would provide fuller context.
In the introduction to a collection of essays on using social sciences in early Christian studies, Richard L. Rohrbaugh makes a laudable attempt to employ age structure as a way of contrasting ancient culture with his own.
7
His portrayal of ancient life, full of disease, threatening malnutrition, parasites, dental problems, and visual impairment, is likely to be quite fair. However, his interpretation of life expectancy at birth is unfortunately misleading. He states: A poor person born in the city of Rome in the year one had a life expectancy [at birth] of only twenty years…. At 32 or 33 years of age, if indeed he lived that long, Jesus would have been older than perhaps 80 percent of his hearers, who would have been ridden with disease, malnourished, and looking at a decade or less of life expectancy. Since few poor people lived out their thirties, we may also have to revise our picture of Jesus. He was hardly one who died in the prime of life. (1996: 5)
In the ancient Roman world, average life expectancy — or more accurately average life expectancy at birth (see below) — would not have reflected typical time of death in adulthood. Demographers of the ancient Roman world have established that average life expectancy at birth was somewhere between mid-20s and early 30s (see discussion below). However, the extremely high infant and early childhood mortality rate skews the average. A person did not expect to die at 20 or 30. According to ancient demographical patterns if he was 32 or 33, Jesus could have expected to live another 25 years or more. 8 Respectfully, Rohrbaugh’s attempt to consider age in its own cultural context is worthwhile but reveals a need to represent more accurate expectations of aging, including the (admittedly meagre) presence and activity of older people within the age structure of the ancient world. 9
These examples of ‘age guessing’ suggest the need for further examination of demographic realities in early Christ groups, set within the ancient Mediterranean setting, and an understanding of what those demographical realities can—and cannot—tell us. Ancient Mediterranean demography cannot give us specifics for Paul’s year of birth nor can it provide a specific age an ancient author has in mind when he mentions ‘youth’ or ‘old age’. It can, however, give us a sense of the age composition of Christ-following groups, typical experiences of their kin universe, and how their experiences of aging and death may have affected age-related expectations.
Average Life Expectancy in the Roman World
‘Life expectancy’ is a critical component of demography. It measures the average number of years a person can be expected to live beyond a particular fixed point in the life course. Most often, the colloquial use of ‘life expectancy’ refers to ‘life expectancy at birth’ (how many years a person can expect to live on average from birth to death), but one can talk about life expectancy at other points of the life course, such as life expectancy at age 5 or at live expectancy at age 60. Life expectancy is measured using rates of mortality and fertility (number of deaths and births in a given population) as well as migration (number of people entering or leaving the population; Parkin 1992: 72; Scheidel 2012: 101; Hin 2013: 6; Holleran and Pudsey 2016: 1). 10
Though modern census data makes demographic information readily available in many regions today, demographers of the ancient Mediterranean have a much more complex task in amassing data (Scheidel 2001a: 13). As mentioned above, in the Roman world between about 200 BCE and 200 CE the average life expectancy at birth seems to have between the early 20s and early 30s. 11 This range of ages is as accurate as demographers can be, given the type of data available. In the mid–1990s, Richard P. Saller suggested that 20 to 30 years was the ‘standard view’ (1994 : 20; Parkin 1992: 84). Having studied census returns in Egypt (see below), Roger S. Bagnall and Bruce W. Frier were more inclined toward the earlier range of age, namely 22 to 25 years (1994: 109–10), but Walter Scheidel has since maintained that given the diversity of environments in the Roman Empire, one cannot be more specific than a range of 20 to 30 years (2001a: 20–25). In an important revision of the use of model life tables (see below), Robert Woods suggested average life expectancy at birth was ‘upper twenties or low thirties’ (2007: 34).
As alluded to above, the measure of ‘average life expectancy’ may give the wrong impression about life in the ancient Mediterranean because people did not typically die at the ‘average’ age (Weiss 1981: 51). The very high infant and child mortality rate brings the average down significantly (Gowland 2007: 156). Accurate numbers around infant and early childhood deaths have been debated, but it is likely around a fifth of all babies born did not reach their first birthday (200 out of 1000 births) and a third did not reach age five (350 out of 1000 births; Parkin 2011: 185; see also Woods 2007; contrast earlier numbers in Parkin 2003: 48–49, 280; also Harlow and Laurence 2002: 10). Tim G. Parkin suggests that, on average, at age 5 a person could expect to live to the age of 45 (1992: 92; 2003: 280) and at age 20 a person could expect to live to the age of 51 (2003: 280). 12 Thus, surviving the precarious first years of life meant a person would likely live well into mature adulthood. Stated another way, for those who survived to sexual maturity (age 15), 39 out of 100 would live to age 60, on average (Parkin 2003: 292), after which life expectancy declined quite rapidly. Those over 60 probably comprised five to ten percent of the total population of the Roman Empire (2003: 49–50, 224). 13 Woods’s (2007) revision of model life table numbers may shift these numbers slightly, but the general pattern remains.
Did People Expect to Die Young?
An average life expectancy at birth of low 20s to low 30s did not mean people typically died in early adulthood (Saller 1994: 12), though some did. Also, people did not expect to die at this age (Parkin 2003: 36–37, 44–45, 48–51). Nor were they considered ‘old’ in their 30s (Parkin 2003: 25); indeed 30 was considered the beginning of adult responsibility for Roman men (e.g., Varro in Censorinus, The Natal Day, 14.2; for further sources see Laes and Strubbe 2014: 26–27). Aristotle stated that ‘youth has a long future before it and a short past behind it’ (Art of Rhetoric 2.12), and Cicero suggested that ‘a young man expects to live long; an old man cannot expect to do so’ (On Old Age 19). In a study of epitaphs built in memory of children in Pompeii, Ray Laurence argues that even though parents often buried their children, they still expected that their children would outlive them (2007: 103).
It is worth reiterating that average life expectancy cannot provide an accurate picture of specific populations at any given time (Scheidel 2001b: 1; Woods 2007), but it can help us to understand and imagine a general picture of life in the ancient Mediterranean.
Demographers and anthropologists distinguish between ‘life expectancy’ and ‘life span’. For anthropologists, ‘life span’ refers to the maximum potential length of life from birth to death. The biological life span for modern humans (Homo sapiens) has been fairly constant at around 122 years (compare the life span of Australopithecines at 53 years; Ice 2005: 88). It appears that the ancient Romans considered the human life span to be about the same (Parkin 1992: 327–28, n. 43). For example, Pliny records apparently confirmed ages of up to 150 years, but most of his examples of extreme old age are at around 100 years (Natural History 7.49; Parkin 1992: 46). Interestingly, from Hebraic thought, Genesis 6.3 sets the limit of human life to 120 years. Declarations of ages that purport to be over 100 years are often suspicious, 14 but there are numerous examples of people living into their 70s, 80s and beyond in the Roman world. For example, in the second century CE, Lucian wrote his work on (elite) Octogenarians, and Polycarp was reportedly at least 86 when he was martyred in the second century CE. 15
As far as we know, the ancient Romans did not keep records of life expectancy, but a curious text preserved in the Digest (35.2.68) is suggestive of their expectations. Commonly referred to as ‘Ulpian’s formula’, this text was ‘a schedule for calculating the tax value of annuities’ (Scheidel 2001a: 19). The formula was used to calculate the value of a bequeathal in the form of an annual payment, or the value of a property that a legatee was entitled to use for the rest of his (or her) life (but could not himself bequeath because he did not own it). The following table (adapted from Parkin 1992: 141) summarizes the numerical descriptions of the formula (see also Frier 1982: 218).
Ulpian’s formula.
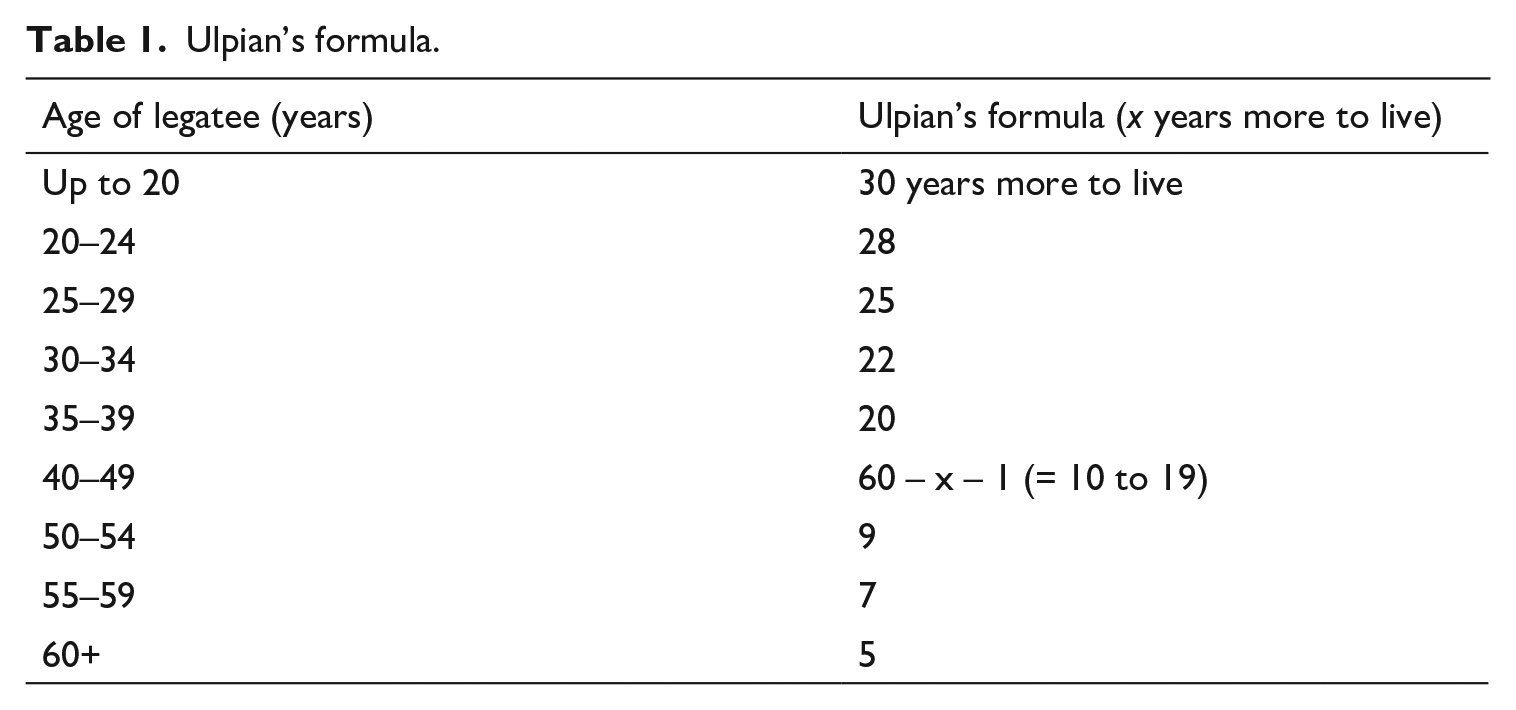
The formula suggests that someone who was 20 years old, for instance, could expect to live (and thus receive his legacy or pay the tax on his property) for 28 years more (theoretically to the age of 48). Although the formula may be suggestive of expectations of life expectancy in ancient Rome, this was not its intention. 16 For true life expectancy, the figures themselves are ‘implausible’ (Parkin 1992: 30–33), and the ages are not meant to reflect true mortality rates. This is obvious in the last age category: a person who was 60 or older would be expected to pay taxes on the basis of having five years more to enjoy his legacy or annuity. This may have been a way of requiring tax payment from those 60 and over, who, in other contexts, were given relief from certain public duties (Parkin 1992: 30–33; see also Frier 1982: 229–30). The figure of five years had nothing to do with how much life expectancy a 60- or 70-year-old was actually expected to have. Mary Harlow and Ray Laurence emphasize the cultural construct behind Ulpian’s formula, namely the separation of three life course stages: childhood (under 20), adulthood (in this case, 20 to 60), and old age (over 60; 2002: 12–13).
Ulpian’s formula has limited value for comparative purposes since it is not statistical, nor is it based on real data or realistic life expectancies (Saller 1994: 3–15; Parkin 1992: 38–41). It does suggest, however, that the ancient Roman law-makers did not expect people to die young.
Sources of Demographic Data for the Ancient Mediterranean
The demography of the ancient Mediterranean tends to be eclectic and comparative (de Ligt and Northwood 2008: 1–14), utilizing various sources, including Roman Egyptian census data found in papyri, epigraphy (inscriptions), archaeological and osteological material, and model life tables (which compare known data with modern models of demographic distribution). It is worth sketching the scope as well as advantages and disadvantages of each source to gain a clearer understanding of how demographers interpret the ancient data.
Census Data from Roman Egypt
Papyrological evidence consists mostly of Roman Egyptian census returns from the first three centuries CE. The head of each household was required to register each of the residents of the household (including slaves and lodgers) every 14 years with their name, age and household status. This census information—about 300 published texts—represents the best demographic data from the ancient world. While the data suggests that average life expectancy at birth was likely to be less than 30 (Saller 1994: 19–20), more exact figures are tenuous. Drawing on their study of this evidence, Bagnall and Frier suggest a more precise range of 22 to 25 years (1994: 109). Scheidel points out, however, that they have to extrapolate infant mortality rates from model life tables (see below), as they believe infant deaths were underreported in the census material. This means that the high infant mortality rates used in their calculation are based purely on assumption and not real evidence (2001b: 12–13). In addition, although they note that ‘the Egyptian population was not entirely stable over the long period covered by the census returns’ (1994: 177), Bagnall and Frier assume a certain amount of stability in order to match their observations of long-term patterns in the consensus data with a model life table (see below; 38, 75–90).
The most important limitation of the census material is that it is fragmentary. While the data provides more concrete evidence about age structure than any other evidence, it does not provide enough data for a complete sample of the population, though a recent study proposes new methods to help account for the fragmentary nature of the sources (Hin, Conde, and Lenart 2016). In addition, at times people misrepresented themselves in census data from Egypt (e.g., people may want to avoid paying taxes). This makes the data even less reliable for numerical calculation (Scheidel 2001b: 14). 17 It is also important to note that the papyrological evidence from Roman Egypt cannot be extrapolated to the whole Roman Empire because of its geographical and cultural uniqueness (2001a: 13). 18 Even so, the census information preserved in the papyrological record is a valuable source of demographic information for certain areas of Egypt and helps to corroborate rough numbers around population distribution and life expectancy elsewhere in the Roman world.
Epigraphy
Another critical source of data is derived from epigraphy, the study of inscriptions, usually carved into stone. Lists of names in villages or cities may be suggestive for population trends (e.g., Duncan-Jones 1977: 259–77), but the most extensively utilized data for demographic purposes comes from epitaphs, or funerary inscriptions.
Epitaphs commemorated household members who had died. They included a variety of family members and ages (sometimes even including slaves). Inscriptions that included the person’s age at death provide primary evidence to suggest mortality patterns. 19 Because not everyone was commemorated, funerary inscriptions do not provide a random selection of the whole Roman population. Ages were not always recorded, and infants and the elderly are underrepresented, perhaps because those who set up inscriptions tended not to record the ages of those who were expected to die. 20 Differences in cultural practices, such as recording or omitting age of death, commemorating males more than females, age-rounding, or exaggerating age make the data statistically unreliable. 21 Further, some groups placed a higher value on inscriptions and thus produced more of them (Parkin 1992: 6–19; Saller 1994: 15–18). Epitaphs were more common among urban people who could afford an inscription, though the range of inscription costs meant that many were dedicated by non-elite persons. Epigraphy is geographically specific, and often temporally specific as well; in other words, patterns found among inscriptions in one location cannot be generalized to the whole Roman world, and one era might differ from another (e.g., Hope 2007: 127–29). It is also important to note the reason for commemoration: a typical funerary inscription was not as much a private expression of sentiment as it was the presentation of ‘a life … seen from the point of view of the community or its public manifestation’, including public offices for men and spousal or motherhood duties for women (Harlow and Laurence 2002: 132). In other words, they were markers of honour in a context where such commemoration was considered honourable, and for a family who could afford to pay for an inscription. ‘Specifying age at death was a further public valuation indicating the greater social importance attributed to that person in death’ (Shaw 1991: 69).
Although funerary inscriptions demonstrate more about ‘the customs of commemoration’ than statistically relevant data for life expectancy (Hopkins 1966: 246) and cannot be used to calculate average life expectancy (Shaw 1991: 67–68), 22 they can suggest answers to particular questions related to age structure. For example, Valerie M. Hope observes that military epitaphs almost always included age (2007: 117). The military kept records of and valued ‘knowledge and accuracy’ with regard to age and number of years in service, perhaps as a way to show their achievements and the dedication of their soldiers (120–21). Perhaps it was a way to demonstrate the family’s honour through the soldier’s service.
Another important example of a specific age-related question is age of marriage. By observing inscriptions made by parents (presumably of unwed young women) versus inscriptions made by husbands, Shaw suggests that women usually married by their late teens and started to have children by 20 years of age (1987: 30–46). 23 Age at marriage largely determines fertility rates and ‘affects a whole range of social institutions of reproduction, above all the “shape” of the family, the relationships between the mother and her children, between husband and wife, and the ways in which property can be redistributed through inheritance’ (Shaw 1987: 30).
Even when funerary inscriptions include ages, they cannot provide enough comprehensive data to calculate life expectancy with any precision. They can, however, provide corroborative evidence as well as suggestions for commemoration patterns and social practices (like age of marriage) within specific regional contexts.
Material Culture
As with other ancient evidence, material remains are fragmentary and limited; however, specific aspects of material culture can address particular demographic questions. Rinse Willet (2012) summarizes (with due caution) the kinds of archaeological data some scholars have used to consider the population and production of agriculture in the Roman city. In the case of Corinth, for instance, data consists of the extent of city walls, food-related artifacts (like oil presses), aqueduct capacity, and cemeteries. For Alessandro Launaro, ‘landscape archaeology’, specifically the use of potsherds (pieces of pottery once used for daily routines) can help determine ‘settlement patterns’ in particular areas (2011: 2). 24 The patterns of potsherds sketch a general picture of the composition of the population (183).
Osteological records (human skeletal remains) can yield data for demographic purposes, though like epitaphs, skeletal remains are not completely representative of a population (Parkin 1992: 41–58). We cannot assume that skeletal remains in cemeteries reflect all individuals in a nearby community, since not all would have had the right to be buried there (depending on age, gender, and social position), and burial is culturally determined (Saller 1994: 18–19; Scheidel 2001b: 11). In addition, early archaeologists in late antique sites did not necessarily preserve skeletal remains, considering them unimportant. Even in newer sites, it can be difficult to ascertain adult ages and gender from fragmentary remains. 25 Nevertheless, osteology has begun to contribute more to the analysis of physical and social aspects of the ancient world, some of which is pertinent to demography (e.g., MacKinnon 2007). 26
Model Life Tables
Since papyri, epigraphy and material remains provide incomplete pieces of the puzzle, by far the most utilized method of ascertaining life expectancy and quantitative perspectives of age structure in the Roman world to date is the use of model life tables. 27 Model life tables provide statistical information for typical patterns of mortality and fertility (Parkin 1992: 72), providing calculations for the probability of dying (or surviving) when one is in a particular age group. Model life tables ‘provide information on populations for which insufficient data are available or where data are of dubious value, in order to test the validity or demographic plausibility of certain assumptions about the population being analyzed’ (79). In other words, in the face of sparse evidence, as is the case with the ancient Roman population, these models can provide a framework within which to consider population patterns and age structure.
The models are derived from known (modern) population patterns. They display probable demographic patterns on the basis of stable populations, meaning populations that are neither expanding nor decreasing (i.e., babies that survive into adulthood replace adults as they die, so that the overall population does not grow or decline over time; see Parkin 1992: 67–90). A series of these tables represent various average life expectancies at birth. The choice of one model (or series of models) is determined by observing average life expectancy ascertained from existing data (census, epigraphy, osteology, literary data regarding age), and serves in turn to illustrate a fuller view of approximate demographic patterns in the Roman world. Parkin, for example, uses the Coale-Demeny (Princeton) Model Life Table Level 3 West, since it represents an average life expectancy at birth of 25 years, halfway between the estimated average life expectancy of 20 to 30 years (1992: 79–90). Richard P. Saller prefers a range of possible life expectancies; like Parkin, he uses the Coale-Demeny Model Life Table Level 3 West as a base line, 28 but he also uses the Coale-Demeny Model Life Table Level 6 West (life expectancy at birth is 32.5 years) as an ‘optimistic estimate’ of life expectancy and ‘upper boundary of the probable range’ of life expectancy (1994: 23). On the basis of their calculations of life expectancy from Roman Egyptian censuses (estimated at 22 to 25 years), Bagnall and Frier move in the opposite direction, using Coale-Demney Model Life Table Level 2 West, for which life expectancy at birth is 22.5 years (1994: 34–35; 109).
The use of model life tables necessarily assumes that they represent stable populations (Scheidel 2001b: 4) and that fluctuations in the Roman population were short-term with a stable population over the long term (Parkin 1992: 73). However, Scheidel argues that these models cannot adequately represent the range of variation in demographic possibilities, and thus realistically can represent neither particular local situations nor the actual age structure as a whole in the ancient Roman world. His critique involves thinking about mortality resulting from malnutrition, epidemics, and infectious diseases (e.g., malaria, tuberculosis) as well as migration. The relative ease of travel in the Roman period (e.g., by roads, by sea) must have made a significant difference for migration patterns and thus population numbers, especially in urban areas, but model life tables cannot account for this. Disease would have caused variations in death rates in different regions, depending on environment, cultural norms, 29 population density, and historical time period (2001b: 5–11, 15–19), 30 but the effects of disease cannot be accounted for in the model life tables (2001a: 17, 24).
Scheidel suggests that average life expectancy might very well have been lower than the models demonstrate in some cities, and significantly higher in particularly favourable locations (2001b: 22, 25), emphasizing that particular time and place (climate, ecology, and disease prevalence) are crucial for ascertaining mortality patterns (26). In fact, Woods (2007) challenges the use of Coale-Demney Model Life Tables, which have a basis in twentieth-century, relatively stable and healthy, mostly Northern European populations (see also Scheidel 2001b: 4). Woods suggests that model life tables from South Europe and East Asia developed by Samuel H. Preston and others (Preston, Keyfitz, and Schoen 1972; Preston and McDaniel 1993) are better suited to demographic studies in the ancient world because they are more realistic about the proportion of infant death and do not underestimate the number of young and middle-aged people who would have died of disease (see also Scheidel 2001a: 34–35). As mentioned above, Woods concludes that average life expectancy at birth was in the ‘upper twenties or low thirties’ (2007: 34)—slightly higher than earlier demographers’ estimates.
While the model life tables cannot be used as direct data and cannot account for migration and regional disease patterns, they do provide a heuristic tool for considering an age structure and demographic reality that is quite unlike modern Western demographic trends. To illustrate, relatively few children die in Canada; 31 most families can expect all of their children to grow to adulthood. In ancient Roman society, by contrast, high infant and child mortality meant that on average a woman might give birth to five babies, but only three would reach the age of 10 (Parkin 2003: 292). While Woods’s Preston model life tables would suggest slightly more babies survived to adulthood and the Roman population was predominantly young, the death of children was still common, including the typical childhood experience of losing siblings and playmates.
In short, although they must be used with caution when applied to the real populations in specific locations of the Roman Empire, the model life tables are the most useful tools for helping us to grasp ancient demography and quantify age structure in the ancient Roman world.
Additional Considerations: Social Status, Geography, Sex, and Mortality in Childhood
Alongside the methodological issues discussed above, several additional considerations warrant mention for how scholars of early Christ groups might use this data. Many factors affected life expectancy, such as immunity, disease, genetics, and nutrition on the one hand, and socio-economic status on the other. However, perhaps surprisingly, wealth, occupation, and social status did not affect demographic trends in the ancient Mediterranean as much as geographical region and the related climate, prevalence of disease (like malaria), and density of population in cities (Scheidel 2001b; see also Sallares 2002). That is, because of the nature of disease in the ancient world, geographical location, especially urban versus rural locations, likely had a greater effect on life expectancy than social position. This means that the urban-rural divide had more effect on demography than the distinctions between elite and non-elite. 32 Especially in crowded cities where most of the elite resided, neither nutrition nor access to ancient medical care provided significantly different resistance to disease (Scheidel 1999). For example, areas in which malaria was rampant would likely bring about lower life expectancy at birth for people in all social positions in cities. On the other hand, Robert Sallares argues that some areas free of malaria may have had an average life expectancy at birth of 40 to 50 years (2002: 283).
It is noteworthy that demographers of the ancient Mediterranean world do not differentiate between the life expectancy of men and women. Bagnall and Frier observe a sex ratio that remains consistent through the life course according to census reports from Roman Egypt, stating, ‘we are permitted to speculate that male and female life expectancy did not differ widely in Roman Egypt’ (1994: 108). Similarly, Parkin does not make a distinction between the life expectancy at birth of men and women, arguing that maternal death resulting from childbirth is more assumed than documented, and probably not demographically significant (1992: 102–5). It is commonly stated by Roman classicists as well as early Christian scholars that many women died of complications related to childbirth (usually stated as death ‘in childbirth’). 33 Interestingly, this claim is not clearly substantiated by the demographic material, but assumedly death as a result of war, accident, and disease for men would balance out maternal mortality, accident, and disease for women.
Finally, in modern Western societies, death is associated primarily with aging and old age, but across time and culture, this has not necessarily always been the case. Kenneth M. Weiss argues that a strong association between aging and death only occurred in the last century or so because for millions of years most people died of disease or accident before they grew old (1981: 56; see also Pollak 1980). Disease, especially infectious epidemics, mostly affected the very young and very old in pre-industrial societies. The most dramatic change in age population in modern societies has been the reduction of infant mortality due to improved nutrition, medicine, and hygiene (Weiss 1981: 49–52; see also Crews 1990: 17–18). In fact, Peter N. Stearns notes that in pre-industrial societies, infants (not the elderly) were primarily associated with death (1982: 8). Similarly, in his classic cross-cultural work on old age, Leo W. Simmons asserts that the dearth of old people in pre-industrial societies meant that death was not primarily associated with old age, and death was not seen as normal or natural. The sudden and unexpected death of youth and vigorous adults was often considered a result of magic and sorcery (1970 [1945]: 217–18; also Counts and Counts 1985: 150). Weiss comments: ‘Modern culture allows the rather complete expression of the aging process, which has removed some its mask, if not its mystery’ (1981: 53). 34 Nevertheless, some anthropologists would suggest that ‘all societies value life and seek to prolong it, even in old age’ (Cowgill and Holmes 1972: 321; see also Counts and Counts 1985: 22). The evidence suggests that in the Roman experience of the life course, the very young and very old were precariously close to death, but no one was far from the possibility of being at the end of life.
Sketches of the Kin Universe
If it is true that ‘age structure is instrumental in framing and shaping expectations and experiences’ of private and public life (Scheidel 2001b: 1), it is helpful to illustrate how demography may have shaped family life, and by extension the communal life of early Christ groups. To this end, I assess Saller’s simulation of the kin universe of men and women (1994: 48–65). 35 On the basis of model life tables, the simulation presents statistical possibilities for the number and ages of living kin for a person at any given age through the life course. For example, young adults were fairly likely to have one or no living parents. According to Saller’s calculations, at age 20, half of all men could expect to have lost their fathers, and half of all men between the ages of 25 and 30 could expect their mothers to have died. By age 40, only about 1 in 10 men still had a living father, and approximately one quarter had mothers who were still alive.
Because of the cautions about using model life tables noted above, the simulation numbers must be taken as approximations only. Saller’s simulation assumes that life expectancy at birth is a set figure, namely 25 years, a reasonable estimate but not representative of the possible range of life expectancy at birth that would have represented various regions and eras in the Roman Empire, as suggested by Scheidel (1999; see also discussion above). More importantly, estimating an age of first marriage for elite men as 25 and for non-elite men as 30 is debatable (Scheidel 2001a, 33–34). In order for the simulation to be useful, the fact that it uses averages must be kept in mind. For example, the simulation shows that a 25-year-old man was likely to have a father (if he was living) who was 56 years old on average. Such a figure really depended on how old the father was when he sired his children. That is, if the father married at 25 and had several children over a 10-year span, his children would be 25 to 35 years his junior, making him 50 to 60 years old if each of his sons married at age 25. Thus, the average age of 56 might represent roughly a 10-year span of 50 and 60 years old. Scheidel points out that children born to younger fathers and those born soon after a father marries are much more likely to have their fathers living when they reach maturity than those with older fathers (2001a: 34). For example, if a child is born to a 30-year-old father, he is 10% more likely to lose his father within 15 years than a child born to a father that is 20 years old. A child born to a 45-year-old father (e.g., a man married at 30, having a child 15 years into his marriage) was one third more likely to lose his father within 15 years than a child born to a 35-year-old father (e.g., a man married at 20, having a child 15 years into his marriage).
Unfortunately, Saller’s simulation has more significant problems when we look at the woman’s life course, rendering it ineffectual for studying a woman’s kin universe. The simulation assumes women will remarry until the age of 50, but women seem to be less likely to have remarried after the age of 35, according to Bagnall and Frier (1994: 111–16, 153; see also Krause 1994: 73). Thus, the proportions of women with a living husband (more than 90% up to age 60!) are much too high to fit the evidence. 36 The simulation also cannot account for the numbers of pregnancies a woman would experience, nor the number of infants and children she would lose before they reached adulthood. The average age of her children does not account for individual ages of multiple children, nor how long she was typically fertile.
Passing over Saller’s simulation for women, we can, with a critical lens, find the simulation for men’s kin universe a useful heuristic tool to suggest ages and numbers of a man’s surviving kin at given ages throughout the life course. It helps to sketch a general picture of how men in the Roman world experienced their familial relationships. Saller himself emphasizes that this simulation is meant to serve as a general picture of the kin universe, not a record of precise ages (1994: 47).
‘Age Guessing’ Revisited
Having sketched the realities of demography and the kin universe in the ancient Mediterranean, we revisit the three instances of ‘age guessing’ outlined above. We find that mention of age in our extant literature probably nearly always has some element of rhetorical expectation, shaped by demographic realities.
Given the rhetoric in the letter from Paul to Philemon (Phlm. 9), the most we can say about Paul’s chronological age is that he was very likely older than Philemon. Given the demographic realities, Philemon probably did not have many men who could use this rhetorical strategy with him. Paul leverages this reality.
Applied to the phrase ‘from youth to old age’ in 1 Clement 63.3, demographic studies highlight that there would have been relatively few adults within the whole population of the community who would fit this description (perhaps 5–10%; Parkin 2003: 49–50, 224). The phrase is likely meant to highlight the letter-bearers’ age, but used alongside faithfulness and self-control (πιστοὺς καὶ σώϕρονας), it was also a rhetorical strategy to highlight the authority of those bearing witness to the advice being given in the letter (see also LaFosse 2023: 209–11).
Luke’s picture of Jesus as ‘about thirty’ as he began his public activities (3.23) may also elicit a rhetorical effect more than a simple statement of Jesus’s actual age. That is, Luke might be fashioning Jesus’s age to fit his story. At this age, Luke’s Jesus did die in the prime of his life. Furthermore, like many younger adults at the time, Jesus is depicted as not have a living father in his adult life. 37 It would have been natural that his father, though mentioned in the birth narratives in Matthew and Luke, does not feature in his adulthood, except for a reference to his vocation (Mt. 13.55; Lk. 4.22). Early audiences of the gospels would not have found it odd to hear about Jesus’s mother and siblings without mention of his father (e.g., Mk 3:31–35; 6:3). His age might also help Luke justify why he did not have a wife; men were typically married but could still be acceptably single at 30.
Whatever his age, Jesus’s hearers would have represented a range of ages, including many children who would not survive to adulthood, but also some who would reach old age; his audience would also have included many adults, some younger than him, some of a similar age, and some older; 38 the presence of older people would not have been unusual, though fewer than what might be found in a modern, Western crowd. Like Jesus, his hearers would have each experienced profound (but normalized) losses of close family members, grandparents certainly, but also siblings, cousins as well as parents, aunts, and uncles. Disease and malnourishment were likely ubiquitous among the non-elite, especially the poor majority, but the rate of disease and malnourishment in a large city like Rome cannot determine the rate of disease or hunger among the adult population in rural Galilee, or even Jerusalem, given the different population densities, geographical regions, and cultural practices of each area. Some of Jesus’s hearers sought healing in part because they did not expect to die in their 20s and 30s, though some did.
Conclusion
According to classicists Claire Holleran and April Pudsay, ‘Demographic dynamics should … be central to any socio-economic analysis of the ancient world’ (2016: 2). Demographic evidence for the ancient Mediterranean is not straightforward. It cannot produce exact numbers for mortality, fertility and migration, or for life expectancy. However, an understanding of demography is critical for avoiding an ethnocentric and anachronistic view considering an accurate picture of age.
With an average life expectancy at birth of mid-20s to early 30s, the death of infants and children was an ever-present reality. However, if a person survived the perils of childhood, she or he had a good chance of reaching an age to marry and have children, with some hope of reaching old age. People did not expect to die as young adults, though of course some did, and most adults lost one or both parents in their 20s or 30s. Old age was not unusual, but elderly people comprised a small portion of the population. Most people experienced a great deal of death in their families at relatively young ages. Mortality rates varied in different geographic regions. Thus, one’s kin universe—the web of closest family members—was normally incomplete due to what we would consider early deaths.
My goal in this paper has not been to provide definitive answers to age-guessing, but rather to provide a clearer picture of what ancient demography has to offer a twenty-first century audience as they encounter the social and cultural world of the early Christ followers in their first century contexts, with the hope of challenging anachronistic and ethnocentric lenses with regard to age. 39