
Abstract
Objectives
National Health Service (NHS) waiting times have long been a political priority in Scotland. In 2002, the Scottish government launched a programme of investment and reform to reduce waiting times. The effect on waiting time inequality is unknown as is the impact of subsequent austerity measures.
Design
An interrupted time series analysis between the most and least socioeconomically deprived population quintiles since the introduction of waiting time initiative 1 July 2002 and austerity measures 1 April 2010.
Setting
All NHS-funded elective primary hip replacement, primary knee replacement and arthroscopy patient data in Scotland from 1 April 1997 to 31 March 2019.
Participants
NHS Scotland funded patients treated in Scotland.
Main outcome measures
Trends and changes in mean waiting time.
Results
There were 135,176, 122,883 and 173,976 NHS funded hip replacement, knee replacement and arthroscopy patients, respectively, in Scotland between 1 April 1997 and 31 March 2019. From 1 July 2002 to 31 March 2010, waiting time inequality between the most and least deprived patients fell and increased thereafter. For hip replacements before 1 July 2002, waiting time inequality increased 1.07 days per quarter; this changed at 1 July 2002 with significant slope change of −2.32 (−3.53, −1.12) days resulting in a decreasing rate of inequality of −1.26 days per quarter. On 1 April 2010 the slope changed significantly by 1.84 (0.90, 2.78) days restoring increasing inequality at 0.58 days per quarter. Knee replacements and arthroscopies had similar results.
Conclusions
The waiting time initiative in Scotland is associated with a reduction in waiting time inequality benefiting the most socioeconomically deprived patients. Austerity measures may be reversing these gains.
Keywords
Introduction
Following the creation of the Scottish Parliament in 1999, long National Health Service (NHS) waiting times and NHS waiting lists persisted. 1 The newly devolved Scottish Executive set up the National Waiting Times Unit in 2002 to drive down waiting times. 2 To assist with this initiative they bought the private Health Care International (HCI) Hospital in Clydebank, on the western outskirts of Glasgow, in June 2002.
The HCI hospital was funded by the Abu Dhabi Investment Company to provide quality healthcare to overseas medical tourists. By 2002, the hospital was being used to provide some 2500 operations to NHS-funded patients; however, it was still only running at less than 10% capacity and running at a loss. 3 It was purchased in 2002 by the Scottish Executive and renamed the NHS Golden Jubilee National Hospital and has a special and unique status as a special health board with a national role specialising in heart surgery but also undertaking knee and cataract operations and plastic surgery. 3
In February 2003, ‘Partnership for Care – Scotland’s Health White Paper’ stated that if a patient is not treated by their local NHS within the National Guarantee, we will give them the right to be treated elsewhere. This may be in the National Golden Jubilee Hospital, elsewhere in the NHS, in the private sector, or in exceptional circumstances elsewhere in Europe.
4
On 31 December 2003 the nationally guaranteed maximum waiting time for inpatient or day-case treatment was set at nine months. 5
The NHS National Waiting Times Centre, which includes the Golden Jubilee National Hospital, is one of eight special health boards in Scotland, which, along with 14 geographical (territorial) health boards, make up NHS Scotland. Health is a devolved matter in Scotland and consequently the NHS in Scotland is the responsibility of the Scottish Government.
Prior research showed that NHS funding of private sector provision under the waiting time initiatives for elective hip replacements in Scotland was associated with a decrease in public provision and potentially contributed to an increase in age and socioeconomic inequalities in treatment rates. Additionally, use of the Golden Jubilee National Hospital may have increased age-related inequality. 6 Concerns have also been raised that waiting time targets in Scotland may distort clinical priorities with evidence that longer waiting patients may have benefitted at the expense of patients with shorter waits. 7 Additionally, internal auditors acting on concerns raised by staff in NHS Lothian uncovered widespread ‘gaming’ with social unavailability codes used to distort and reduce waiting times; there was also evidence of inappropriate use of these codes in NHS Tayside. 5
The election of the Conservative/Liberal Democrat coalition government in May 2010 resulted in Scottish health spending stagnating – with a 0.1% real term increase from £12.410 billion in 2009/10 to £12.427 billion in 2014/15.8,9
This study will analyse the results of the waiting time initiative since 2002 for NHS-funded patients treated in Scotland and the effect of austerity measures imposed since 2010, on socioeconomic inequalities in access to surgery.
Methods
Objectives
For elective primary hip and knee replacements and arthroscopies:
From 1 April 1997 to 31 March 2019 by financial year, trends in rate of operations and mean waiting times. From 1 April 1997 to 31 March 2019 by financial year quarter, an interrupted time series looking at (a) changes in mean waiting time between the least and most socioeconomically deprived patients and (b) mean length of stay, both over three periods: 1 April 1997 to 30 June 2002; 1 July 2002 to 31 March 2010; and 1 April 2010 to 31 March 2019.
Choice of procedures
Hip and knee replacements have been shown to improve quality of life of patients 10 and hip replacements are commonly used to assess healthcare equity. 11 Along with arthroscopy, these three procedures are among the top 30 procedures carried out in Independent Sector Treatment Centres in England (a key component of the English waiting time/patient choice programme). 12 They enable an assessment of whether there are differences between major surgery such as hip and knee replacements and a minimally invasive surgical procedure such as arthroscopy. 13
Dataset
An extract of secondary care admissions’ Scottish Morbidity Record (SMR01) data for NHS-funded elective procedures–primary hip replacements, primary knee replacements and arthroscopies–was requested and purchased at a cost of £4151 from Information Services Division of NHS National Services Scotland (see supplementary details S1a).
For hip replacements and knee replacements, patients under 50 years of age were excluded and age was categorised as 50–59 years, 60–69 years, 70–79 years, 80–84 years and 85 years and over in line with Judge et al. 14 For arthroscopies, age was categorised as 0–29 years, 30–39 years, 40–49 years, 50–59 years, 60–69 years and 70 years and over based on the profile of patients. Bilateral operations were counted as two separate operations.
Small area level inequality was measured at Scottish Datazone level using Scottish Index of Multiple Deprivation (SIMD) population quintiles with SIMD quintile one (SIMD1) representing the 20% of the Scottish population living in the most socioeconomically deprived areas and SIMD quintile 5 (SIMD5) the 20% in the least deprived areas. Deprivation guidance for analysts Version 3.2 produced by NHS National Services Scotland Public Health & Intelligence was used to attach the most appropriate SIMD measure to the patient record depending on the year of treatment.
When analysing waiting times, patients were excluded if they had either a missing waiting time value or where their recorded waiting time was over three years, the assumption being this was a coding error or at least atypical. 15
Analysis
Operation rates per 100,000 population were produced using mid-year populations drawn from Information Services Division Scottish Datazone files and from the National Records of Scotland, as the denominator. The mid-year population for 1997 was used for financial year 1997/98 and so on. Mean annual waiting times for each procedure were plotted against the waiting time guarantees adopted by NHS Scotland over time (see supplementary file S1b).
Inequalities
Data were analysed using simple linear regression and an interrupted time series design with outcome ‘inequality in waiting time’ calculated as the difference between the mean waiting times for patients in SIMD1 and SIMD5. The level and slope change model described by Wagner et al. was used 16 (see supplementary file S1c).
Analysis was conducted over three time periods: period one – prior to the introduction of the waiting time initiative 1 April 1997 to 30 June 2002; period two – during the waiting time initiative 1 July 2002 to 31 March 2010; and period three – with the waiting time initiative continuing, the period of austerity and budget cuts 1 April 2010 to 31 March 2019. 1 July 2002 was chosen as start of the waiting time initiative; similarly, 1 April 2010 was chosen as the start of austerity.
For each of the three procedures, the full model including time, level and slope changes was fitted and compared, using an F test, to the reduced model containing only level change terms. 17
Data were analysed using SAS version 9.4. Autocorrelation and heteroscedasticity were checked at a significance level of p<0.1 and adjusted for where necessary. Seasonality was accounted for as higher order autocorrelation in line with guidance for the SAS Autoreg procedure.
Sensitivity analysis
Mean and median waiting times were plotted against each other to assess the validity of modelling mean waiting times rather than categorising the data around median or percentiles.
A sensitivity analysis using difference in episode-specific length of stay instead of mean waiting time between the most deprived and least deprived quintiles of patients was conducted with the hypothesis that any reductions in length of stay are likely due to medical advances rather than the introduction of waiting time guarantees. 18 It was expected that length of stay would be largely unaffected by the waiting time guarantees.
Results
Over the 22-year period from 1 April 1997 to 31 March 2019, 135,176, 122,883 and 173,976 elective patients received primary hip replacements, primary knee replacements and arthroscopies respectively in hospitals in Scotland funded by NHS Scotland. There were 126,032 and 119,725 hip and knee replacement patients, respectively, aged 50 years and over.
Of these 125,749, 119,487 and 173,538 hip replacement, knee replacement and arthroscopy patients, respectively, had a non-missing datazone. The total number of operations for these patients was 127,219, 121,431 and 193,767 hip replacements, knee replacements and arthroscopies, respectively. Finally, for those with a non-missing waiting time less than three years, the figures were 117,747, 118,736 and 170,863 patients for hip replacements, knee replacements and arthroscopies, respectively.
Treatment rate trends
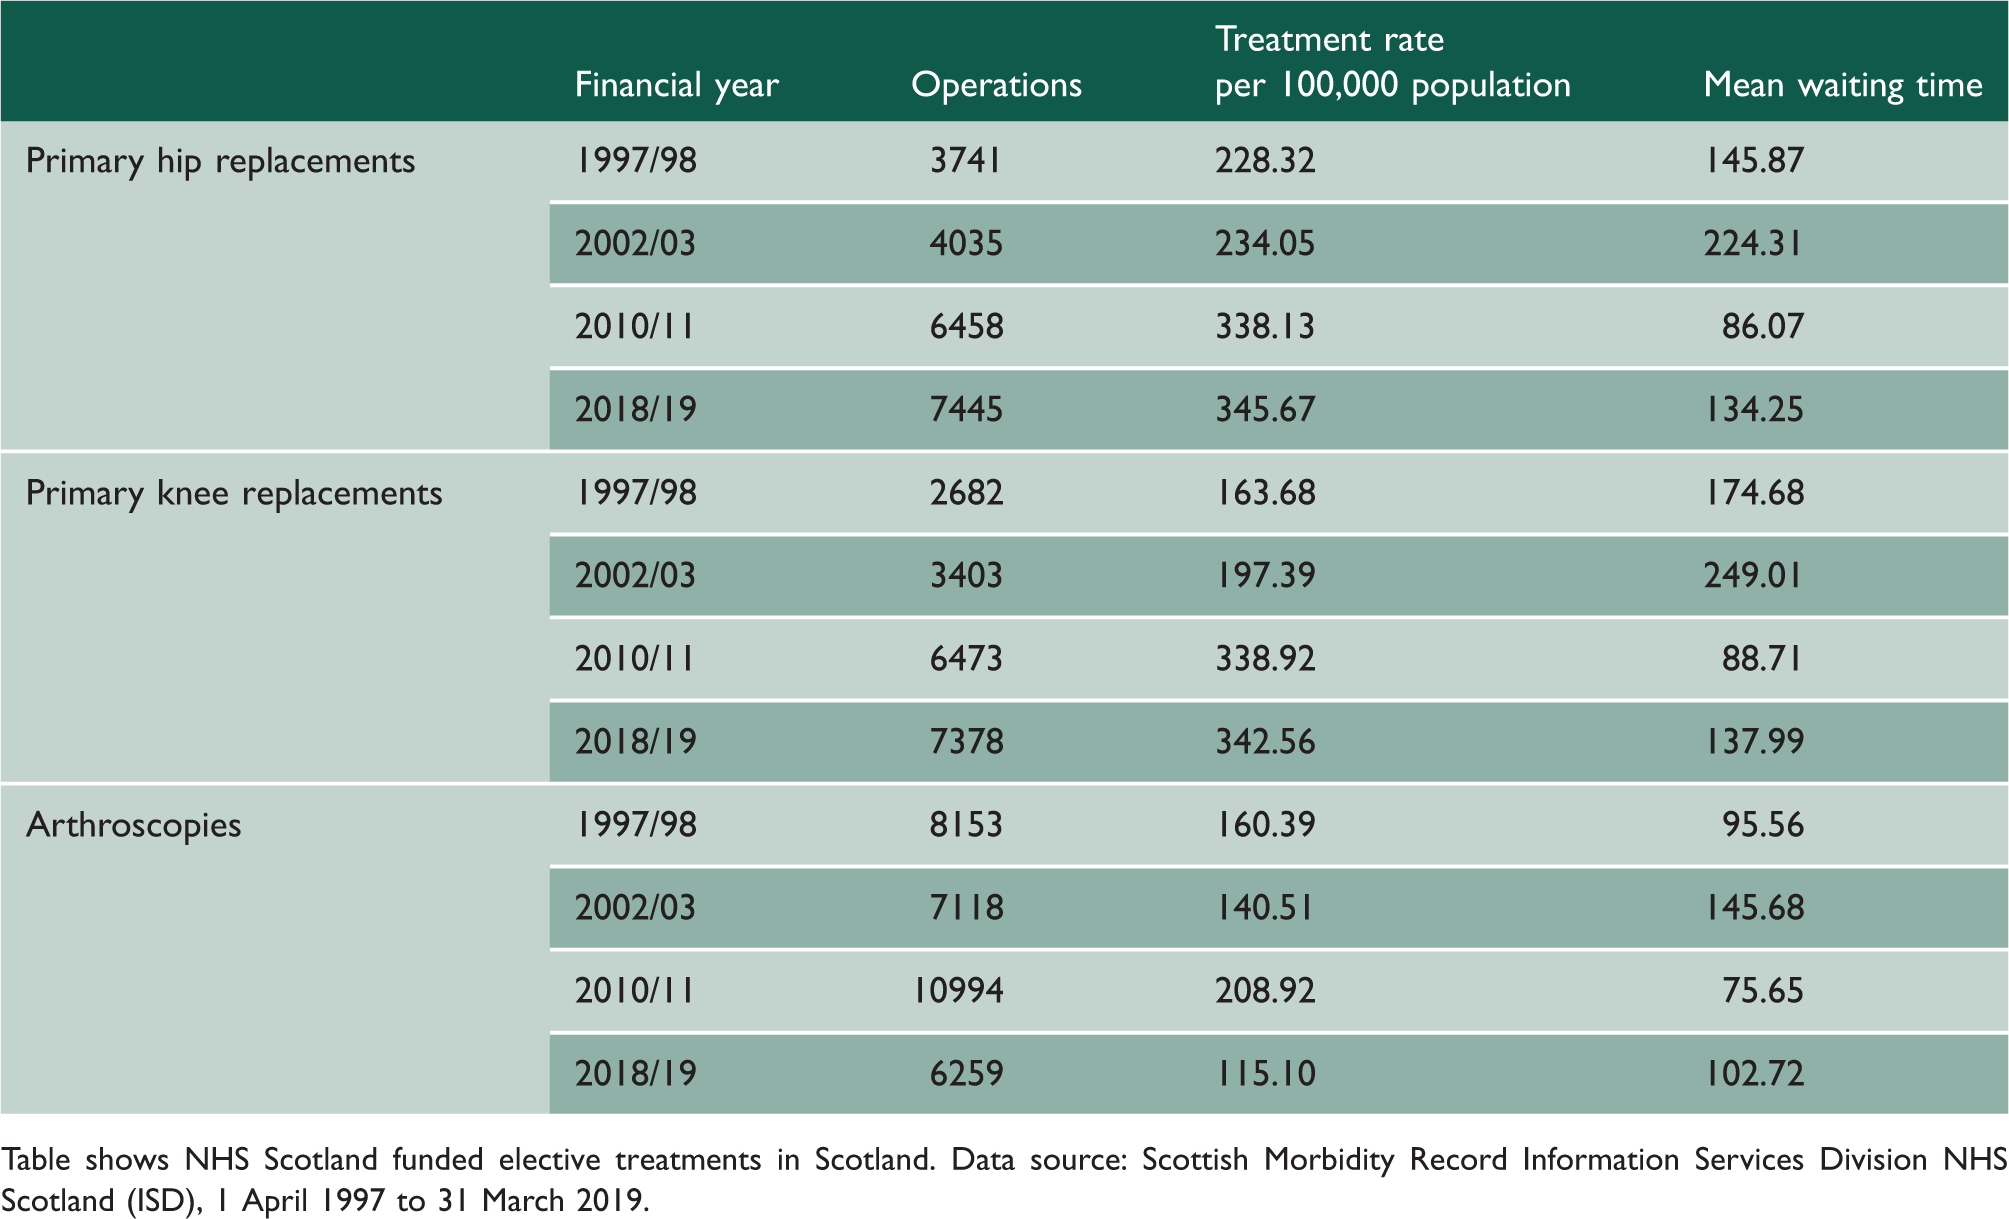
The crude hip replacement rate rose by 51.4% from 228.3 per 100,000 population in 1997/98 to 345.7 per 100,000 in 2018/19 with the peak rate in 2013/14 of 356.6 per 100,000 (an increase of 56.2%). Similarly, the crude knee replacement rate rose by 109.3% from 163.7 operations per 100,000 in 1997/98 to 342.6 per 100,000 in 2018/19 with the peak rate in 2014/15 of 375.0 per 100,000 (an increase of 129.1%). The crude arthroscopy rate fell by 28.2% from 160.4 per 100,000 population in 1997/98 to 115.1 per 100,000 in 2018/19 with the peak rate in 2009/10 of 229.3 per 100,000 (an increase of 43.0%) (see Figure 1 and Table 1; for all results see supplementary tables S5a–5c).
NHS Scotland-funded elective operations in Scotland, 1 April 1997 to 31 March 2019. Operation rates per 100,000 population by financial year of operation. Hip and knee patients aged 50 years and over arthroscopy patients of all ages. Treatment rates and mean waiting times for selected financial years. Table shows NHS Scotland funded elective treatments in Scotland. Data source: Scottish Morbidity Record Information Services Division NHS Scotland (ISD), 1 April 1997 to 31 March 2019.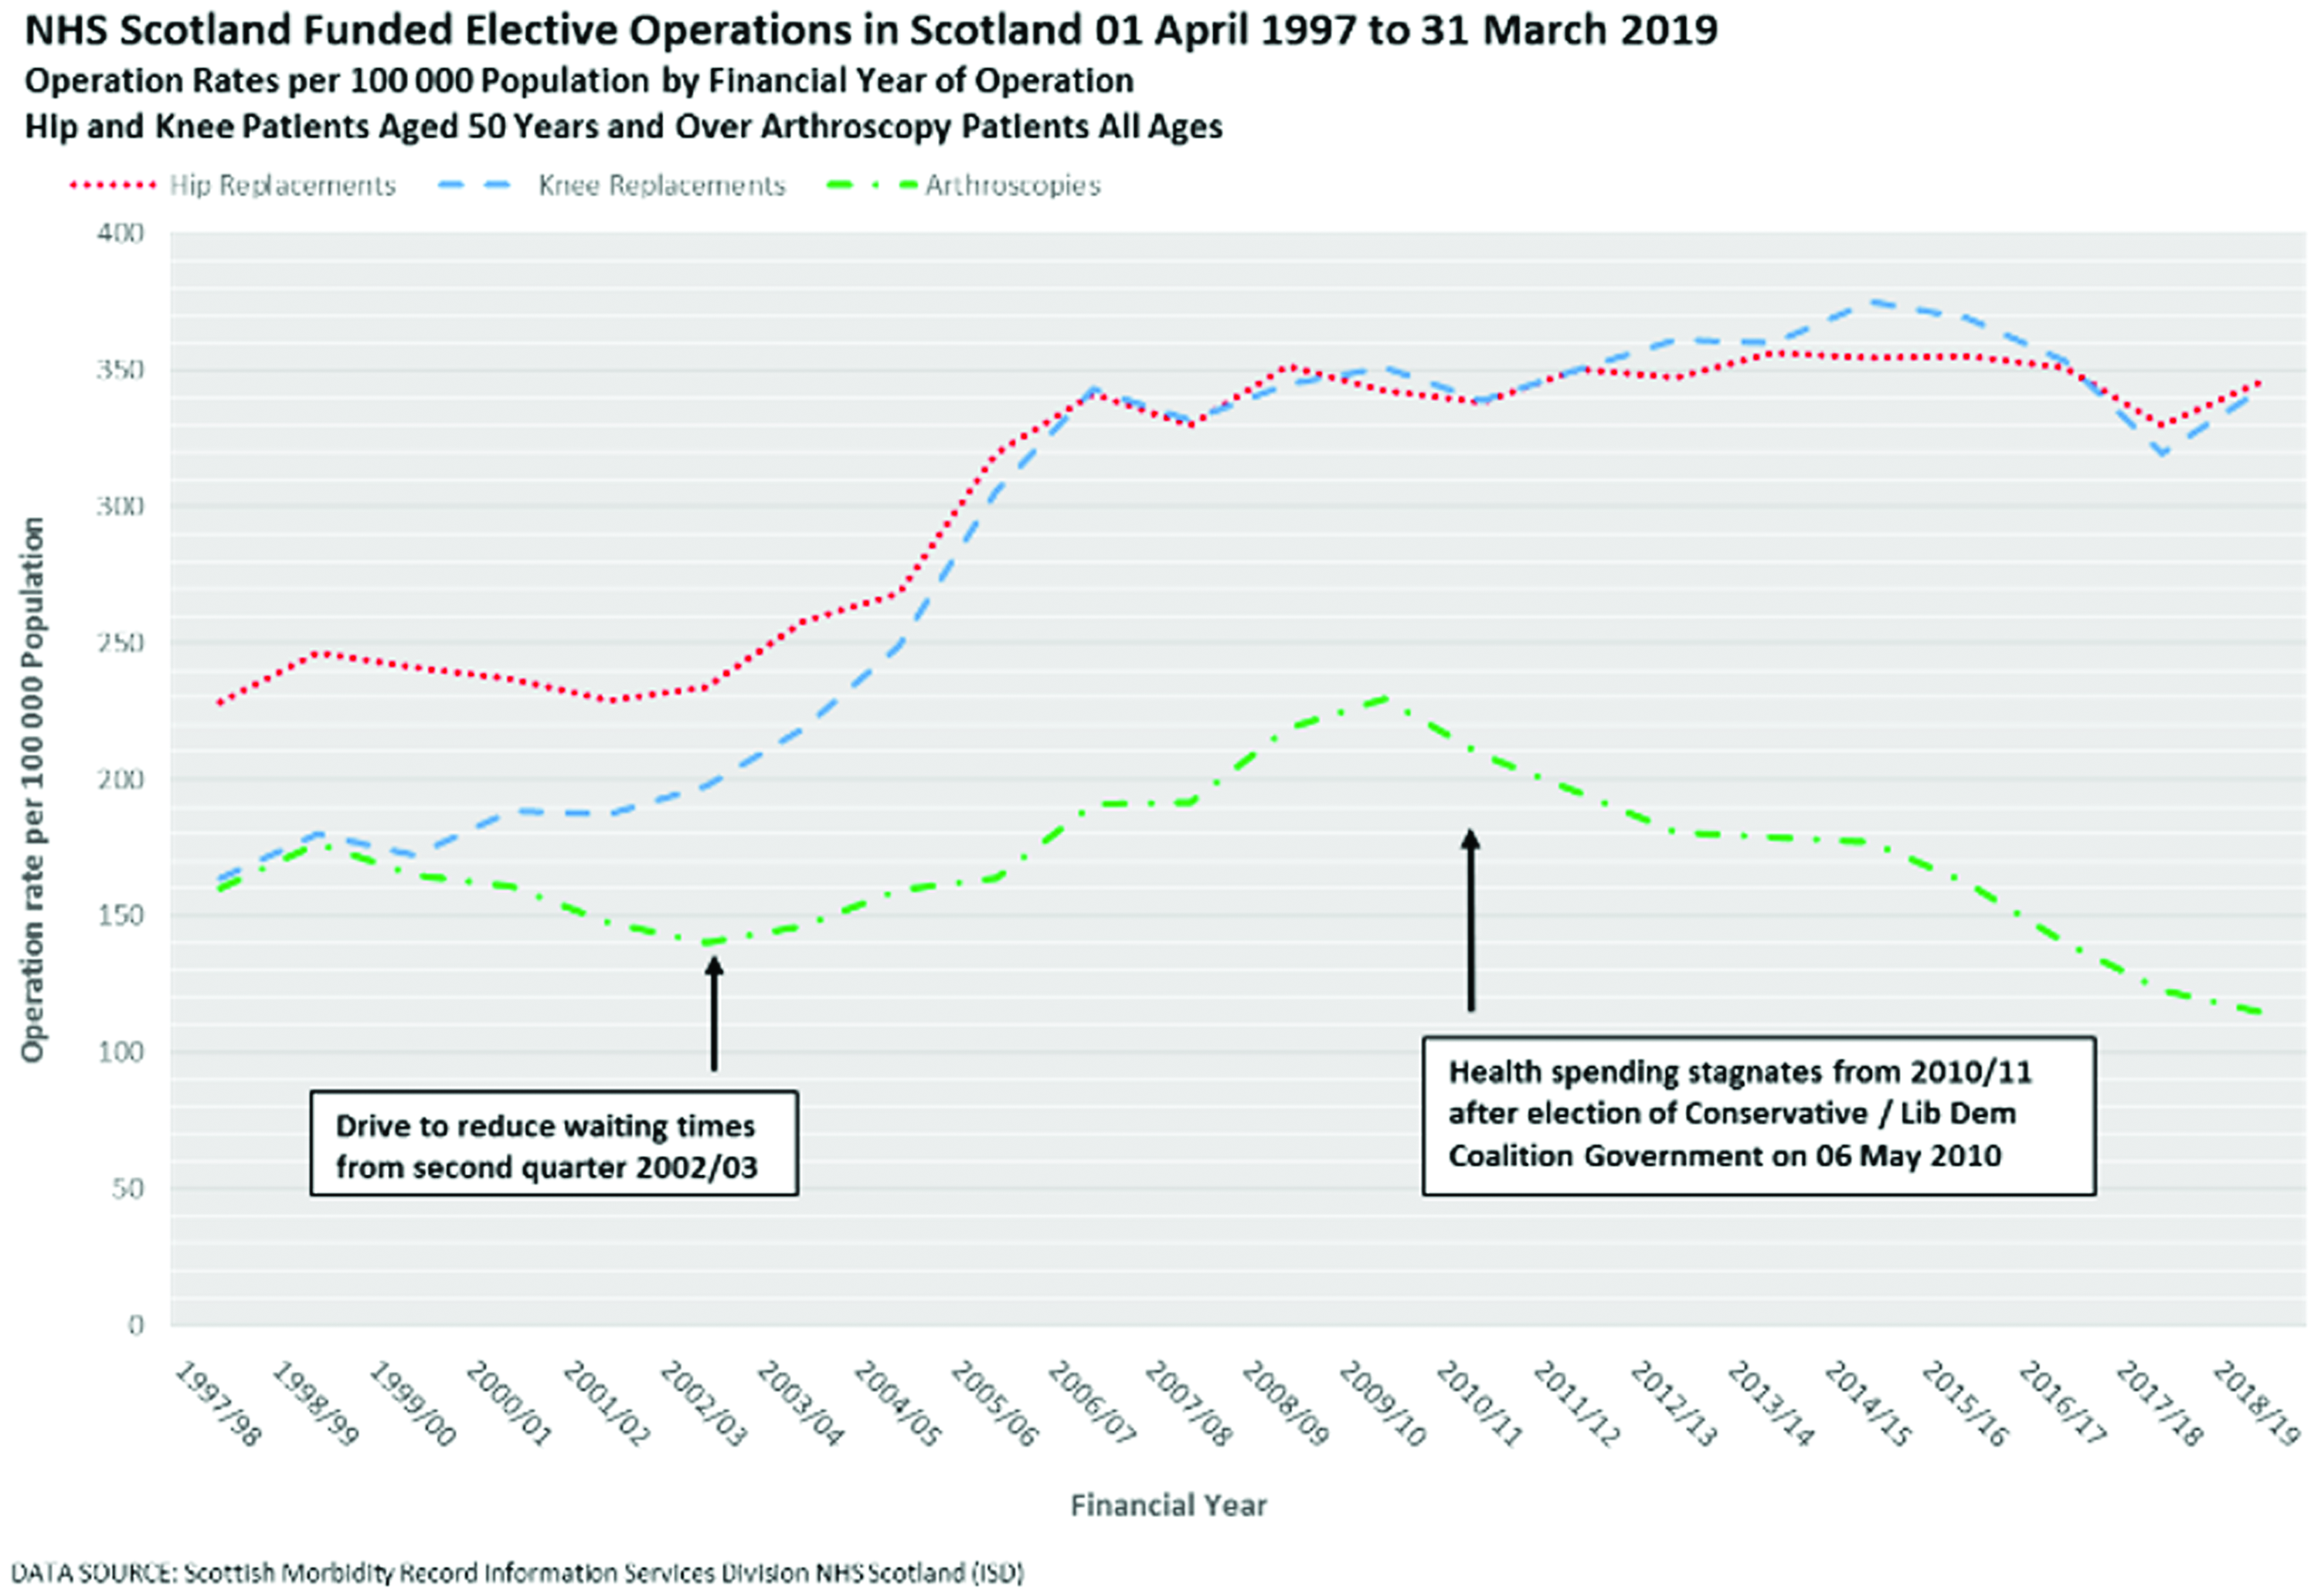
Waiting time trends
The mean waiting time for hip replacement patients fell by 8.0% from 145.9 days in 1997/98 to 134.3 days in 2018/19 – the lowest mean waiting time was in 2012/13 at 76.8 days (a fall of 47.4% from 1997/8). The mean waiting time for knee replacements fell by 21.0% from 174.7 days in 1997/98 to 138.0 days in 2018/19 – the lowest mean waiting time was in 2012/13 at 79.3 days (a fall of 54.6% since 1997/98). The mean waiting time for arthroscopies rose by 7.4% from 95.6 days in 1997/98 to 102.7 days in 2018/19 – the lowest mean waiting time was in 2013/14 at 66.0 days (a fall of 31.0% from 1997/98) (see Figure 2 and Table 1; for all results see supplementary table S5a–5c).
NHS Scotland-funded elective operations in Scotland, 1 April 1997 to 31 March 2019. Mean waiting times by financial year of operations. Hip and knee patients aged 50 years and over arthroscopy patients of all ages.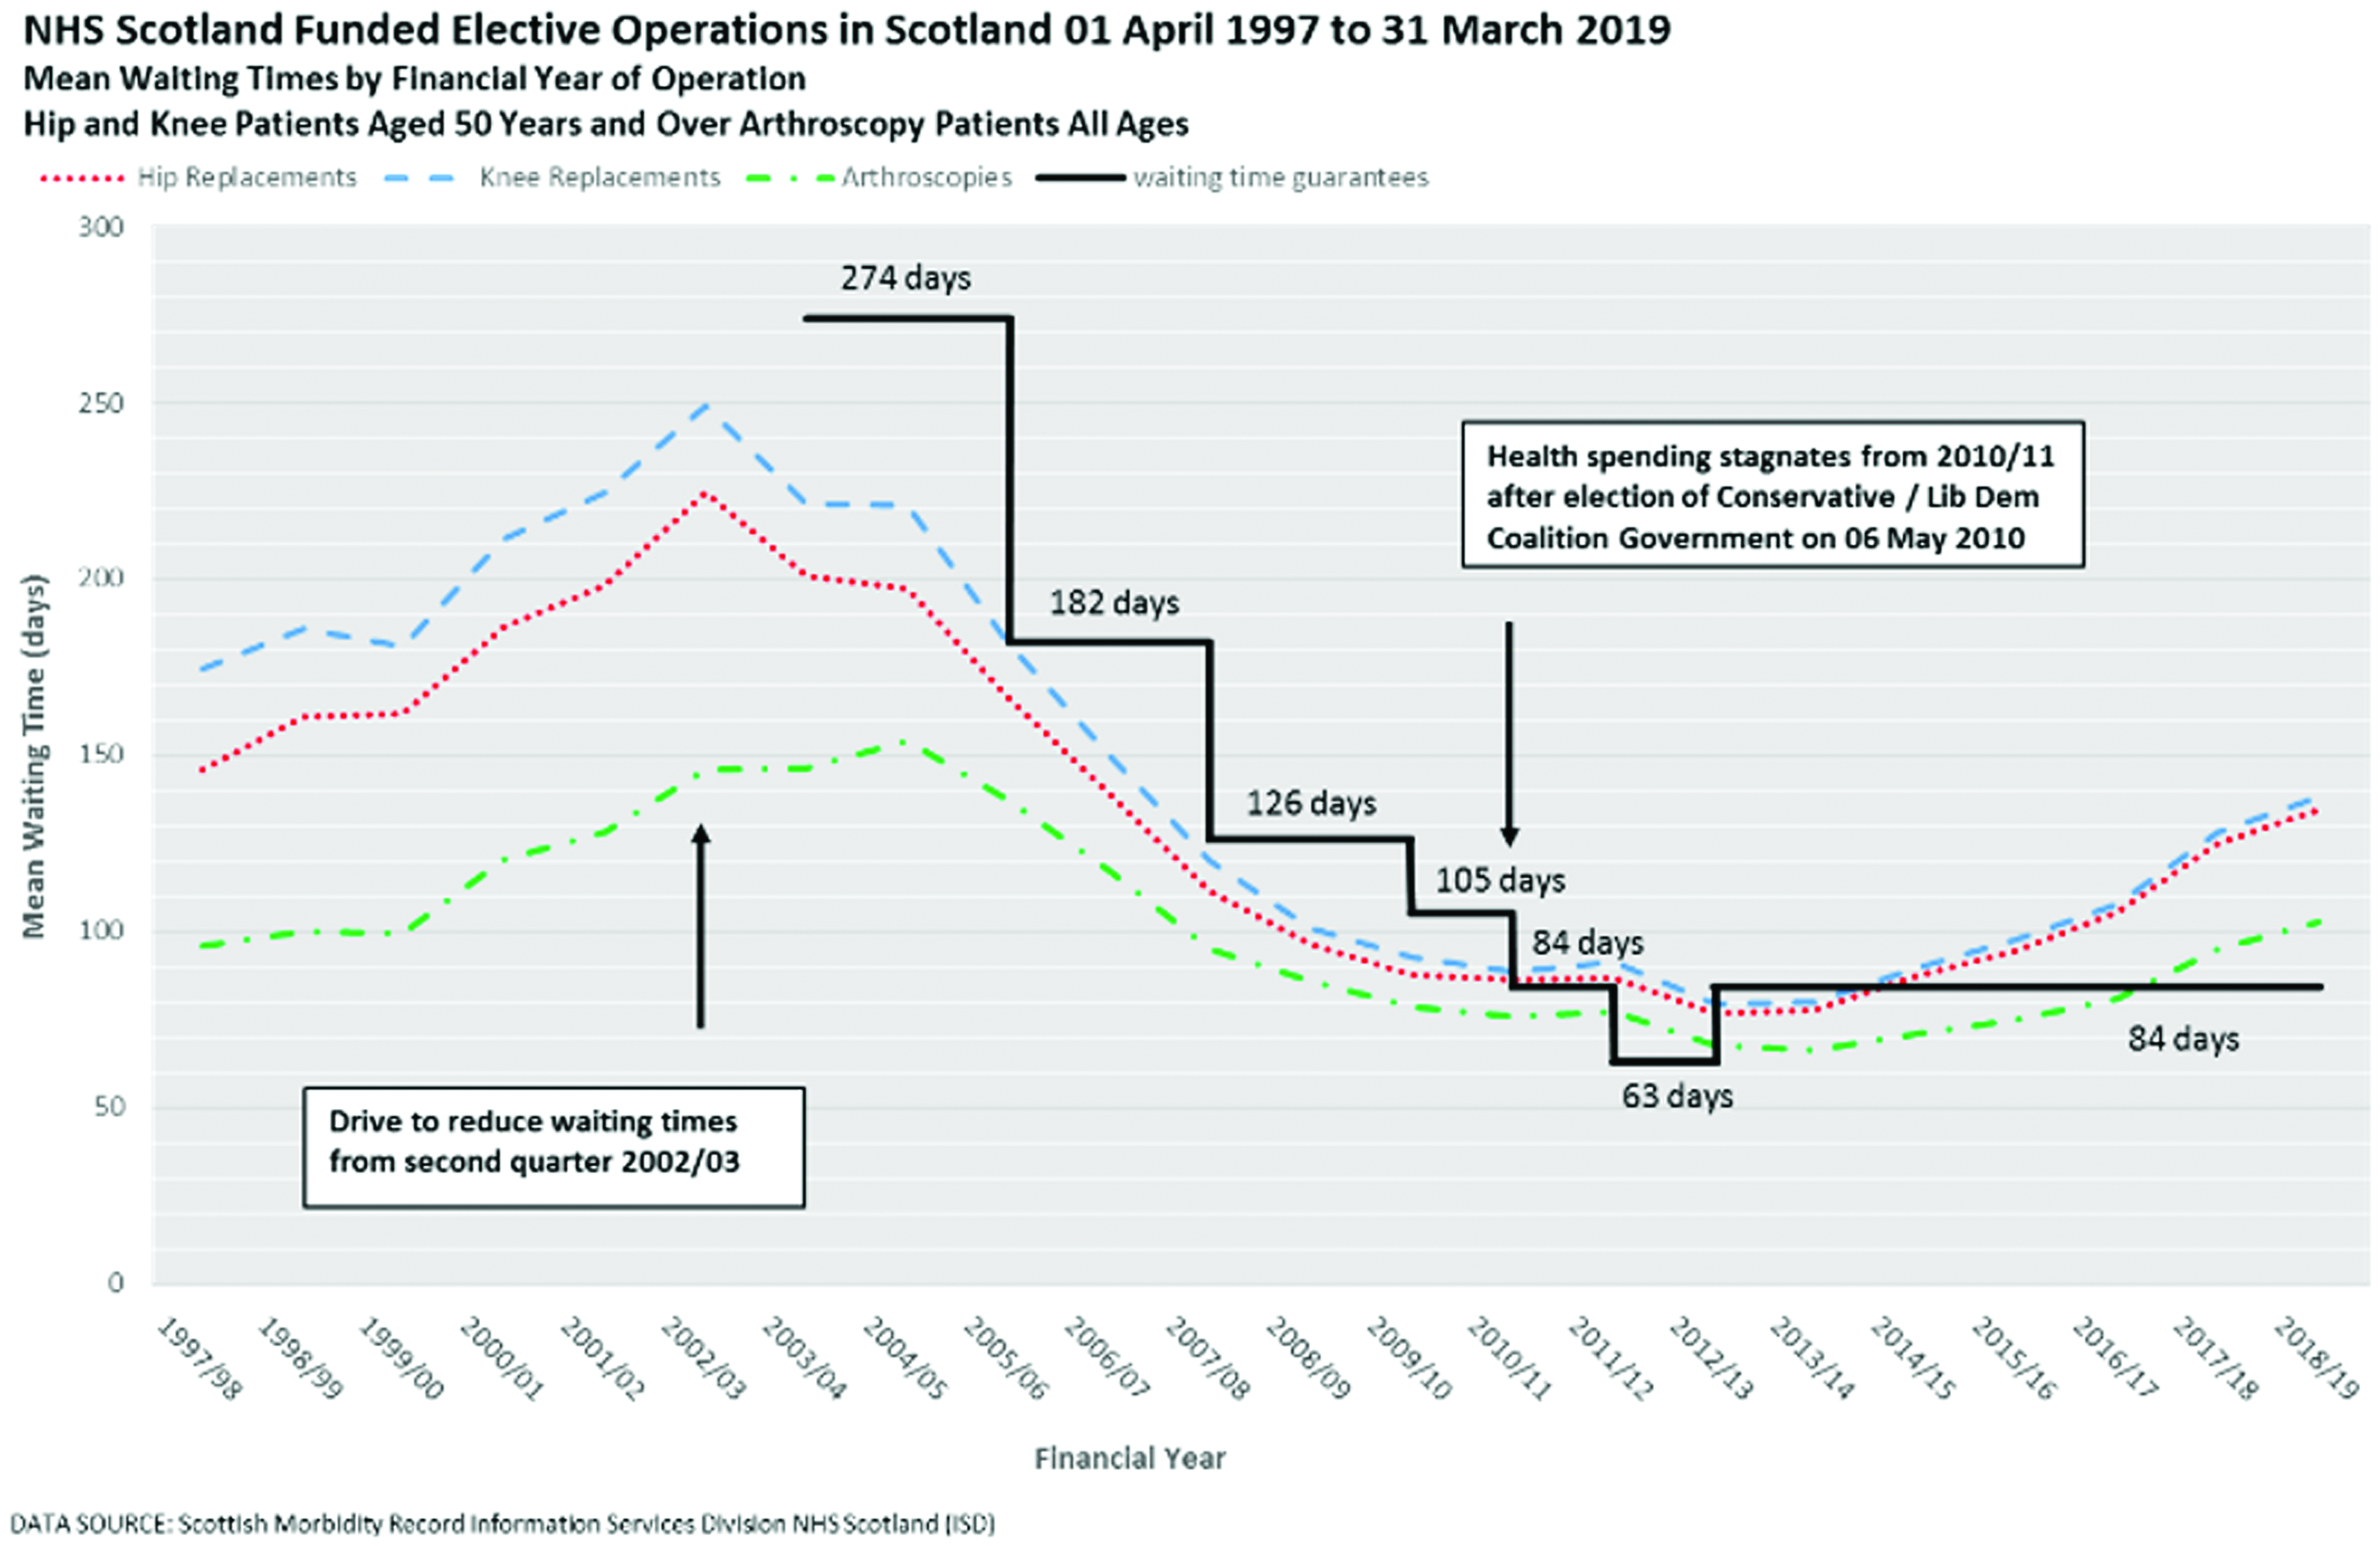
Inequalities
The full model including level and slope change terms fitted the data better than the reduced model with level change terms only for each of the three treatments (F statistics all p < 0.0001, see supplementary table S2). There was statistically significant evidence of positive autocorrelation for hip replacements and arthroscopies but no evidence of autocorrelation for knee replacements (see supplementary table S2). For hip replacements, the data demonstrated evidence of first order autocorrelation and for arthroscopies second and third order autocorrelation. There was evidence of heteroscedasticity in the model for hip replacements but not for knee replacements or arthroscopies (see supplementary table S3).
Inequality in mean waiting time for hip replacements increased by 1.07 days per quarter between 1 April 1997 and 30 June 2002; decreased by 1.26 days per quarter between 1 July 2002 and 31 March 2010; and increased by 0.58 days per quarter between 1 April 2010 and 30 June 2019 (see Figure 3 and Table 2). There was a significant slope change at 1 July 2002, a reduction of 2.32 days per quarter (−3.53, −1.12) and at 1 April 2010 an increase of 1.84 days per quarter (0.90, 2.78). There was a non-significant level change at 1 July 2002, a reduction of 9.48 days per quarter (−31.47, 12.50) and at 1 April 2010 an increase of 2.70 days per quarter (−6.19, 11.59).
NHS Scotland-funded elective primary hip replacements delivered in Scotland, 1 April 1997 to March 2019. Observed and predicted difference in mean waiting times between Scottish Index of Multiple Deprivation Most Deprived and Least Deprived. Quintiles of patients by financial year of operation quarters. Patients aged 50 years and over modelled as interrupted time series adjusted for first order autocorrelation and heteroscedasticity. Slopes and level and slope changes. Table shows mean waiting time difference between most and least deprived quintiles by financial year of operation quarters. Modelled as interrupted time series adjusted for: First order autocorrelation (hip replacements), second and third order autocorrelation (arthroscopies) and heteroscedasticity (hip replacements). NHS Scotland Funded Elective Treatments in Scotland. Data source: Scottish Morbidity Record Information Services Division NHS Scotland (ISD), 1 April 1997 to 31 March 2019.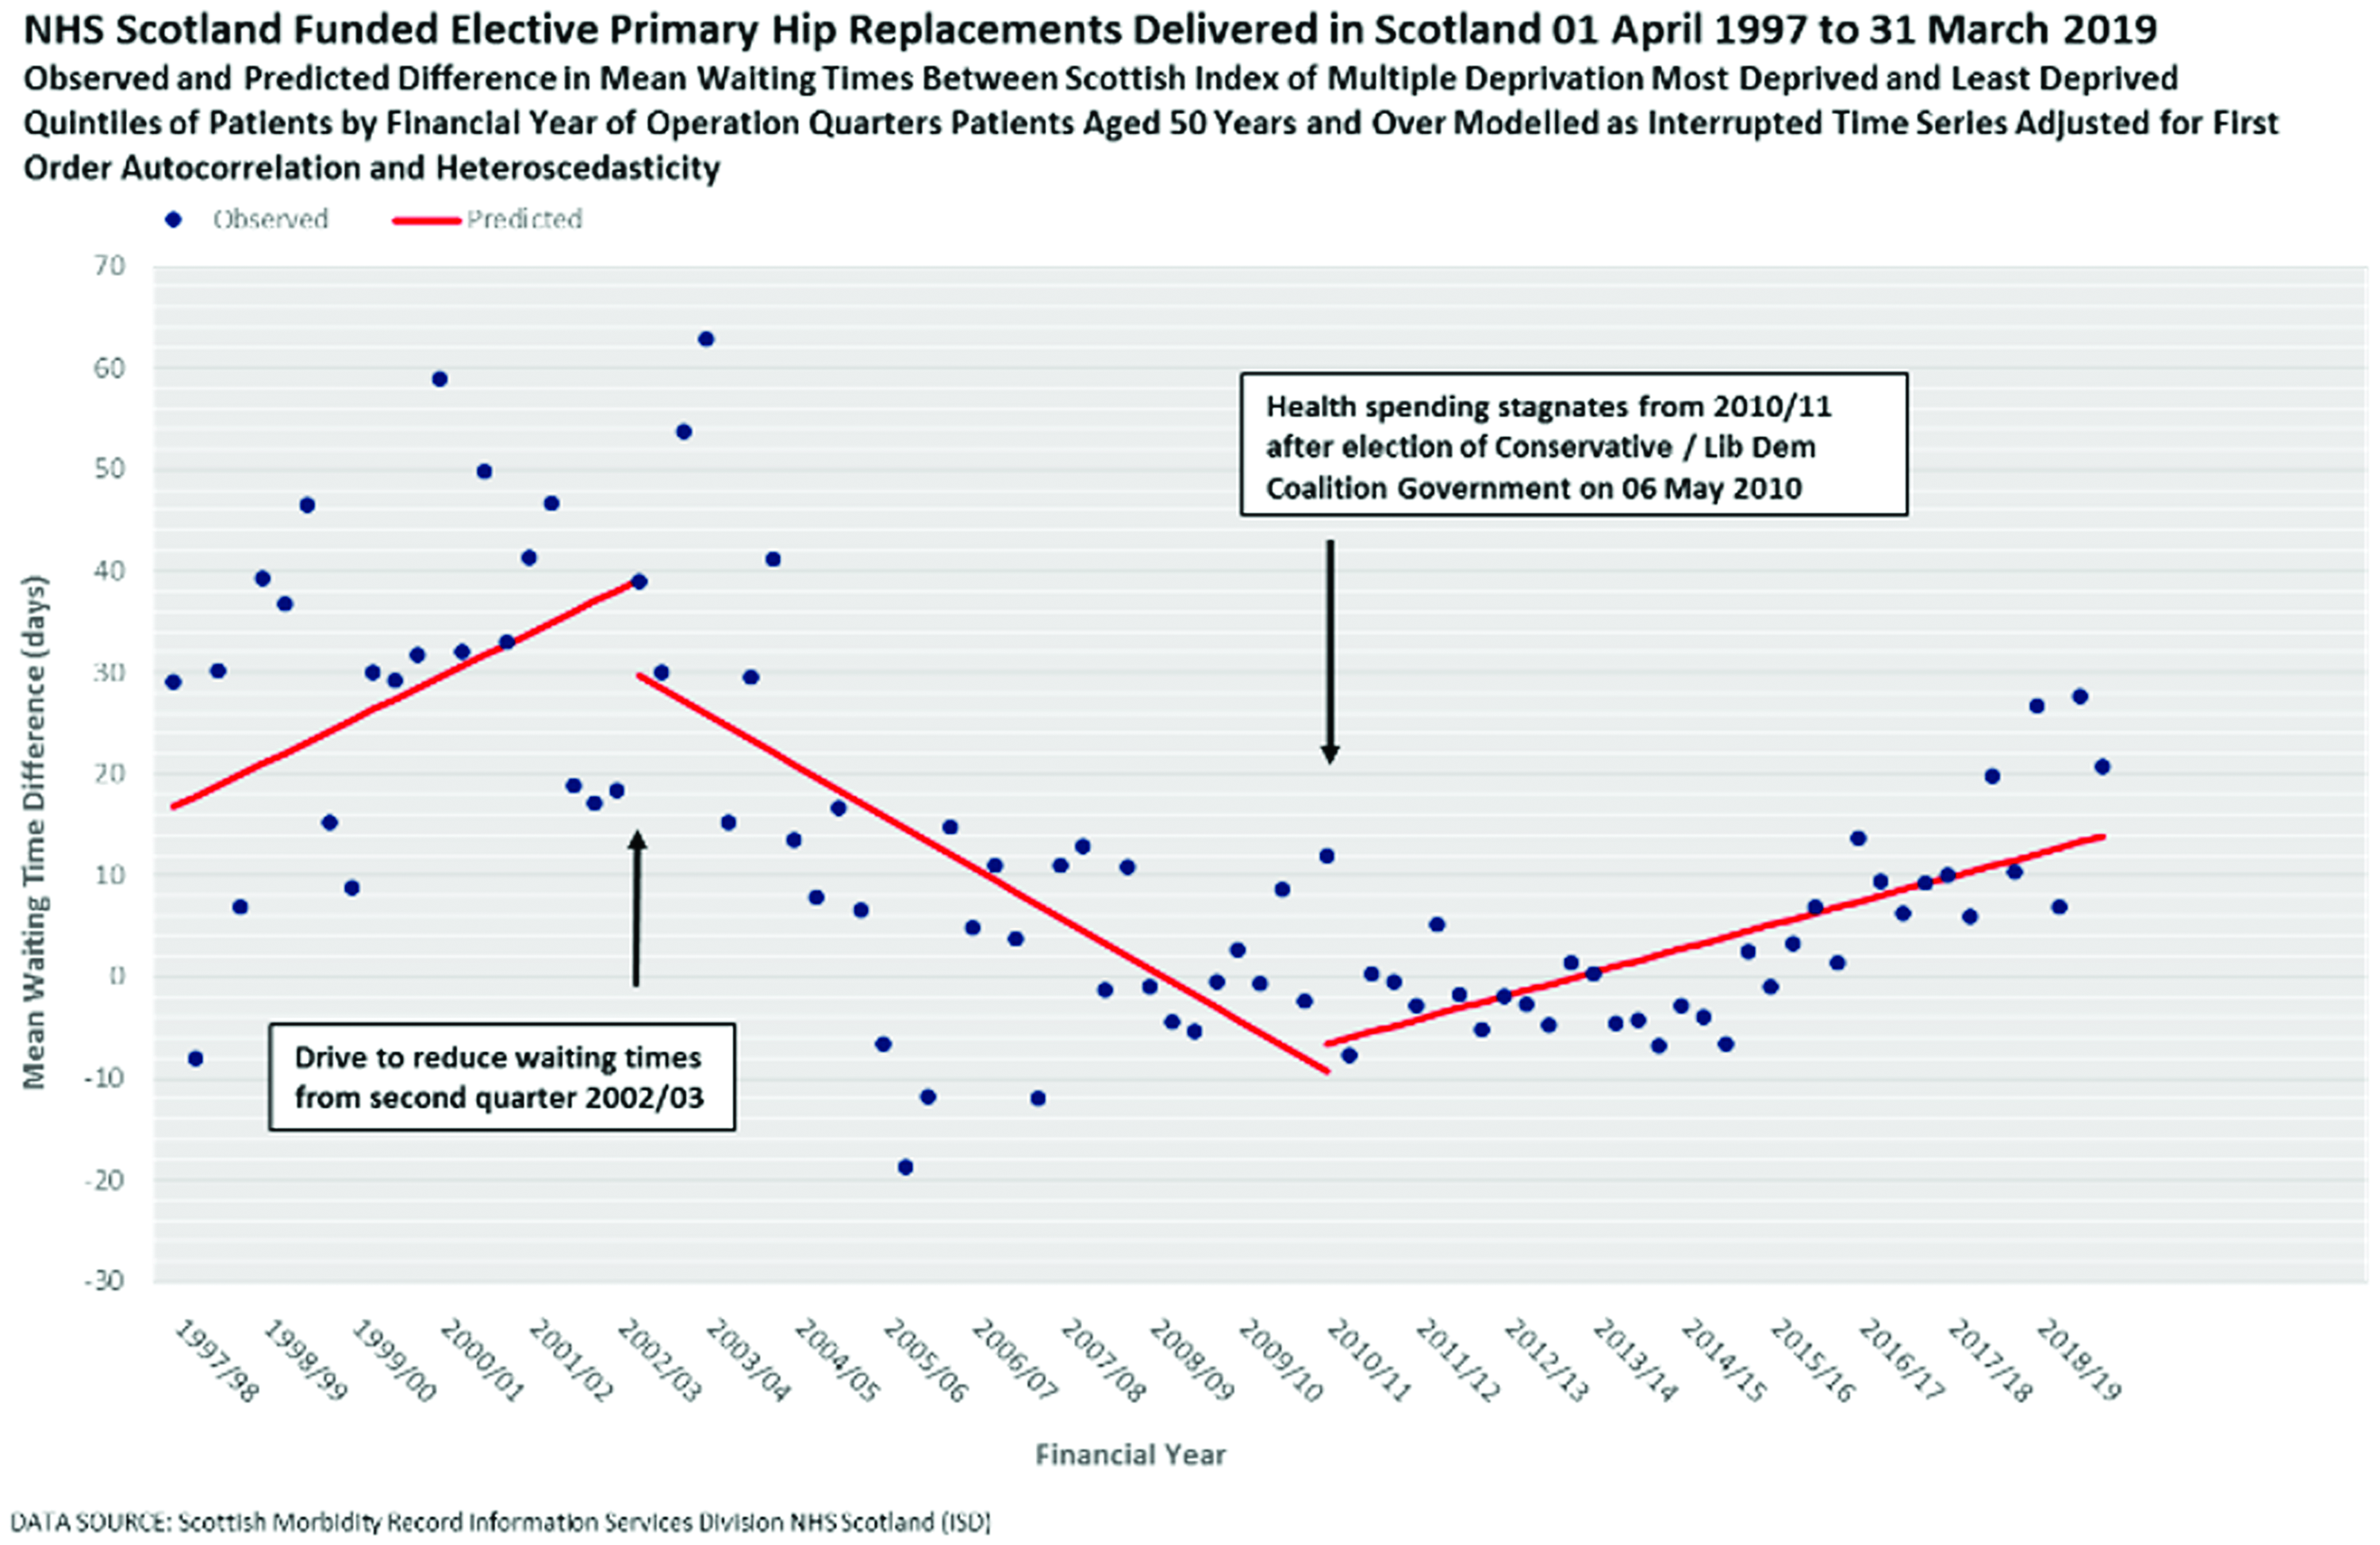
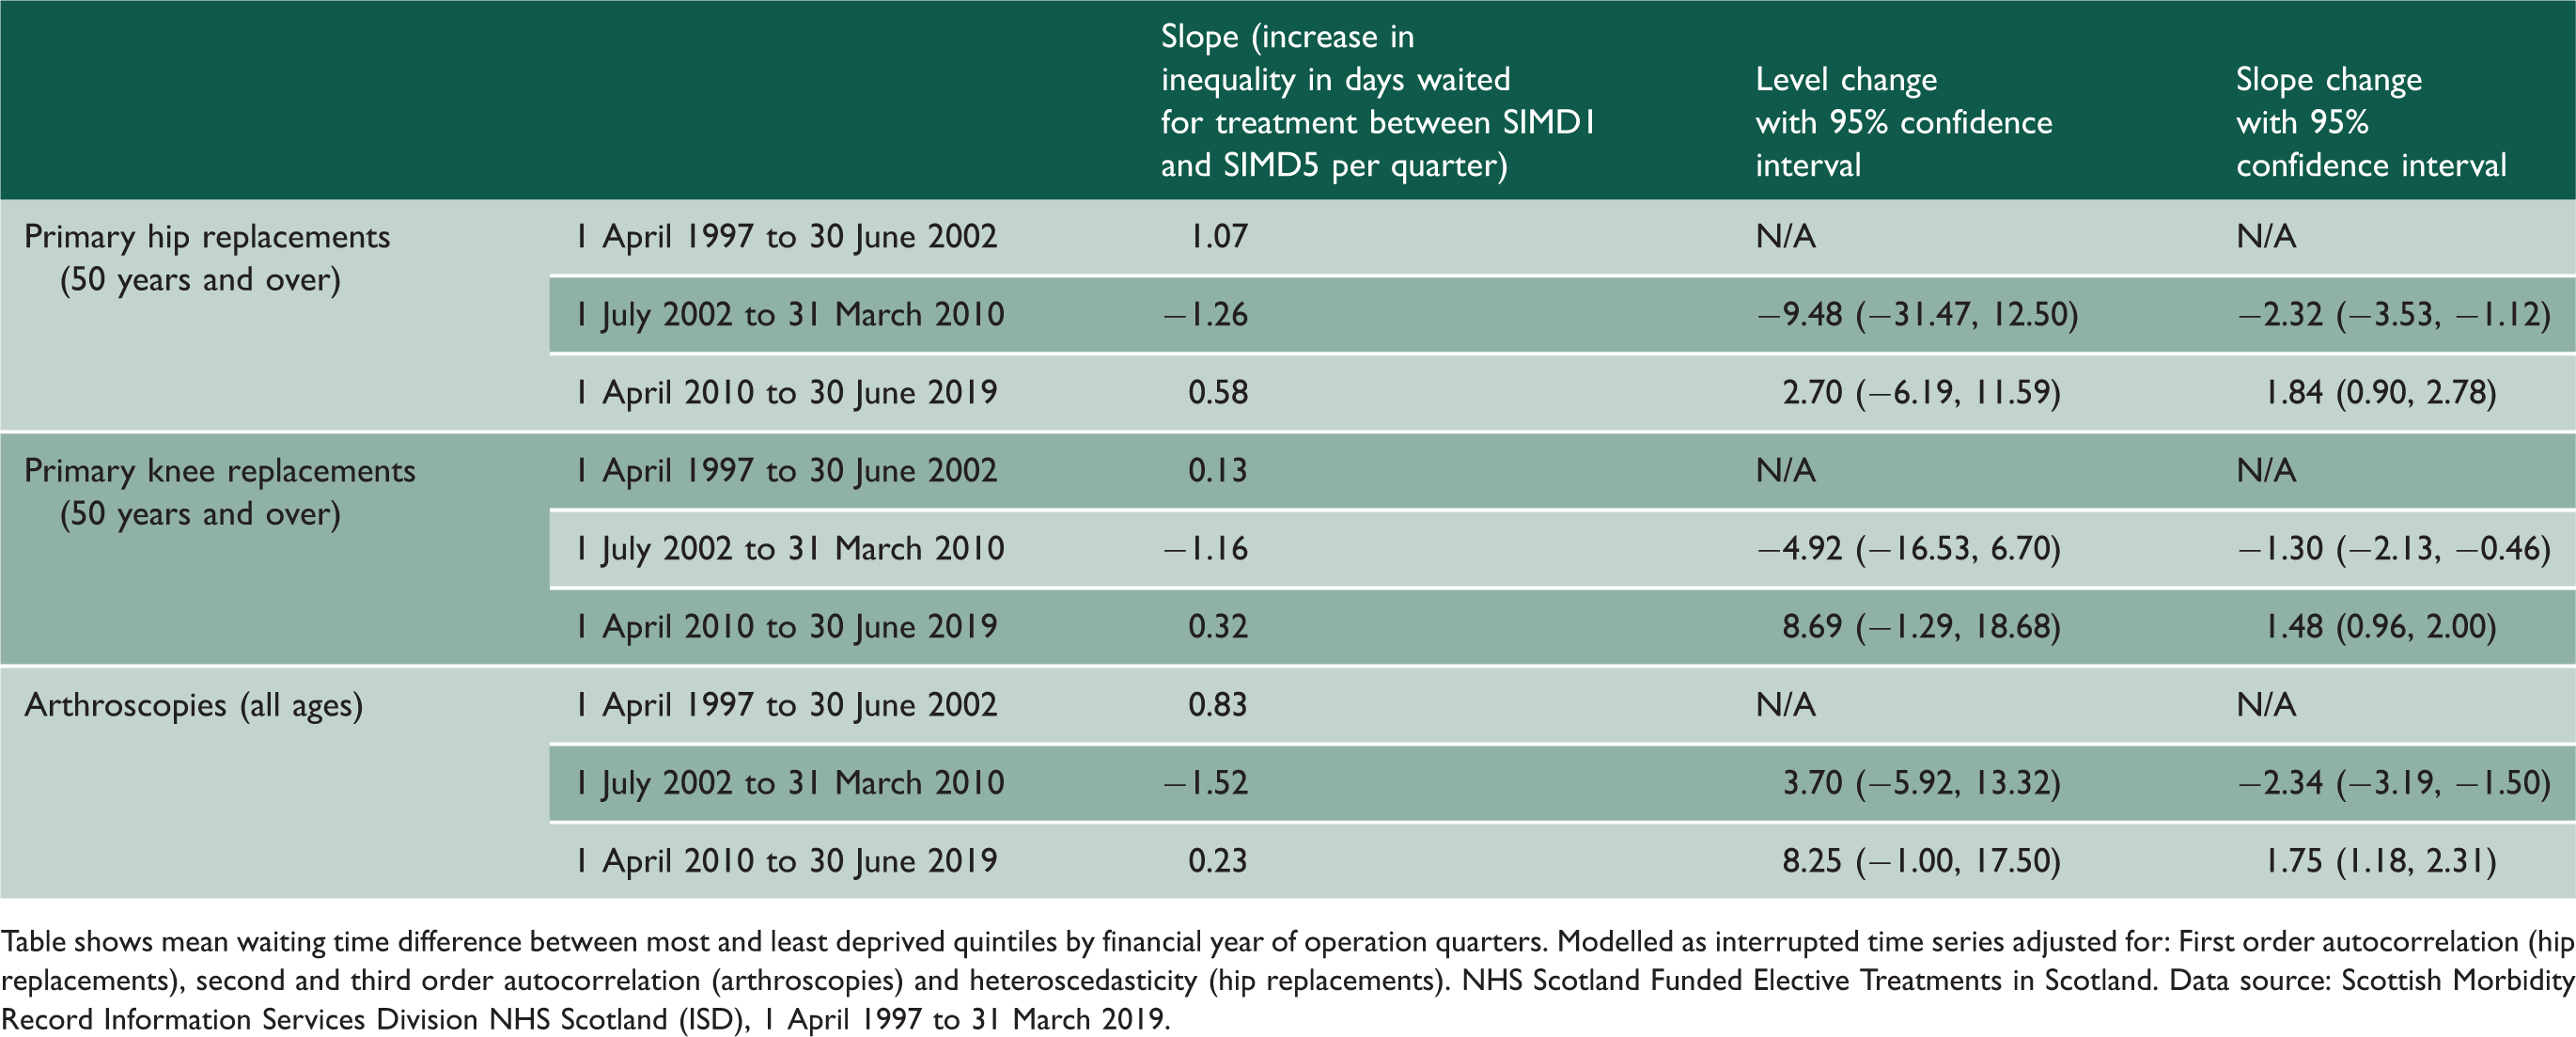
Inequality in mean waiting time for knee replacements increased by 0.13 days per quarter between 1 April 1997 and 30 June 2002; decreased by 1.16 days per quarter between 1 July 2002 and 31 March 2010; and increased by 0.32 days per quarter between 1 April 2010 and 30 June 2019 (see figure S16 and Table 2). There was a significant slope change at 1 July 2002, a reduction of 1.30 days per quarter (−2.13, −0.46) and at 1 April 2010 an increase of 1.48 days per quarter (0.96, 2.00). There was a non-significant level change at 1 July 2002, a reduction of 4.92 days per quarter (−16.53, 6.70) and at 1 April 2010 an increase of 8.69 days per quarter (−1.29, 18.68).
Inequality in mean waiting time for arthroscopies increased by 0.83 days per quarter between 1 April 1997 and 30 June 2002; decreased by 1.52 days per quarter between 1 July 2002 and 31 March 2010; and increased by 0.23 days per quarter between 1 April 2010 and 30 June 2019 (see figure S17 and Table 2). There was a significant slope change at 1 July 2002, a reduction of 2.34 days per quarter (−3.19, −1.50) and at 1 April 2010 an increase of 1.75 days per quarter (1.18, 2.31). There was a non-significant level change at 1 July 2002, an increase of 3.70 days per quarter (−5.92, 13.32) and at 1 April 2010 an increase of 8.25 days per quarter (−1.00, 17.50).
Sensitivity analysis
The mean and median waiting times followed a similar pattern by financial year quarters (see supplementary figures S10, S11 and S12).
Analysis of length of stay showed only marginal and in the main non-significant, level and slope changes either after the introduction of waiting time initiatives or after the introduction of austerity measures (see supplementary table S9 and supplementary figures S13, S14 and S15).
Discussion
The drive to reduce waiting times in Scotland from July 2002 had the effect of reducing inequalities between the most and least socioeconomically deprived patients. This finding held true for each of the three elective procedures analysed: primary hip replacements, primary knee replacements and arthroscopies. Prior to this, for all three treatments, patients in the most deprived areas had longer waits than those in the least deprived areas. The introduction of austerity measures in 2010, with a real-term freeze on health spending, may have reversed the gains with waiting times increasing for all patients and the pre-2002 pattern of inequality returning.
Waiting time targets
The first targets of the waiting time initiative in Scotland in 2002 were heart disease, stroke and cancer patients rather than elective surgery. 2 By November 2002, the Scottish Executive was facing criticism as average waiting times across all specialties continued to rise. 1 The estimates produced here show such a rise in financial year 2002/03 for hip and knee replacements; for arthroscopies, average waiting times do not fall until much later around the end of 2005/06. Given time, however the waiting time initiative appears to have been a success reducing the average waiting times and reducing the inequality between patients living in the most and least deprived areas of Scotland.
In England, New Labour’s ‘war on waiting’ initially set itself the target of reducing the numbers on waiting lists by 100,000 while sticking to the previous Conservative governments Maximum Waiting Guarantee of 18 months. 19 They achieved this by early 2000 when they switched to waiting times instead, with the maximum wait set at six months. Cookson et al. conclude that the Blair/Brown health reforms had little effect on socioeconomic equity for hip or knee replacement in an analysis of data up to 2008/09. 11 Moscelli et al. found a reduction in the inequality in waiting times between the most and least deprived in England for the urgent procedures coronary artery bypass graft and angioplasty, from 35% and 53%, respectively, in 2002/03 falling to 9.5% and 15% in 2010/11, respectively, with most of the reduction taking place by 2005/06. 20 More recent research in England since 2007/08 has shown private provision both increasing and substituting for NHS provision selecting patients from more affluent areas. 21
Future prospects
Austerity measures appear to have started to bite in the Scottish NHS from 2013 or 2014, reversing the gains of the waiting time initiative. A separate analysis has found that increases in life expectancy in Scotland slowed around the same time. 22 In England, gains in infant mortality brought about during the health inequalities strategy between 1999 and 2010 have also been found to be reversing. 23
Across Scotland even prior to COVID19, numbers of patients waiting for treatment were increasing across all specialties, by 2.2% and 6.1% for outpatient and inpatient appointments, respectively, in 2018. 24 It remains to be seen what sort of settlement will be forthcoming from the UK Conservative government elected in December 2019. Budgetary prospects were already gloomy with demand for capital set to outweigh available funds. 24
The Coronavirus epidemic has made the situation worse. In April 2020 there were 3406 planned operations carried out across NHS Scotland compared to 27,204 carried out a year before in April 2019. 25 At the end of September 2021, there were 425,242 patients waiting to be seen, 33% higher than the same date in 2020. 26
Limitations
Following a systematic review finding that in the long run, patients who undergo knee arthroscopy do not receive important benefits in pain or function over those who receive conservative management strategies, 27 an expert panel issued recommendations in May 2017 against the use of arthroscopy in nearly all patients with degenerative knee disease. 28 Our data show that arthroscopy rates started to fall from 2009/10 on so there is likely to have been changes in practice taking place even prior to changing recommendation. This will have had a major effect on the findings for arthroscopy.
The use of social unavailability codes at NHS Lothian and Tayside has now decreased and in 2011 the numbers of patients waiting longer than 12 weeks started to rise. 5 This may account for some of the rise in waiting times seen here after 2011 but would not explain why they continue to rise or why inequality has returned.
Due to the positive skew of the waiting time distribution, some analyses adopt a categorisation process around the median or other percentile and perform logistic regression. The analysis here chose to use a simpler method of analysing the mean which, given the distributions of means and medians as illustrated in supplementary S10, S11 and S12, is justified. In an investigation of models for waiting times data, Sinko et al. concluded that ‘a simple linear OLS specification performs well on the majority of metrics, calling into question the need to employ more advanced and computationally intensive techniques’. 29
Further research
Further research is needed to analyse and compare the impact of the NHS England waiting time guarantees and associated patient choice programme with Scotland. In England, patients are given a free choice of any accredited public or private provider whereas Scotland has a much more limited form of patient choice with no national system to facilitate choice; only in England is choice used to encourage competition between providers. 30
Supplemental Material
sj-pdf-1-jrs-10.1177_01410768221090672 - Supplemental material for Socioeconomic inequality, waiting time initiatives and austerity in Scotland: an interrupted time series analysis of elective hip and knee replacements and arthroscopies
Supplemental material, sj-pdf-1-jrs-10.1177_01410768221090672 for Socioeconomic inequality, waiting time initiatives and austerity in Scotland: an interrupted time series analysis of elective hip and knee replacements and arthroscopies by Graham Kirkwood and Allyson M Pollock in Journal of the Royal Society of Medicine
Footnotes
Declarations
References
Supplementary Material
Please find the following supplemental material available below.
For Open Access articles published under a Creative Commons License, all supplemental material carries the same license as the article it is associated with.
For non-Open Access articles published, all supplemental material carries a non-exclusive license, and permission requests for re-use of supplemental material or any part of supplemental material shall be sent directly to the copyright owner as specified in the copyright notice associated with the article.