
Abstract
Summary
Objectives
To estimate additional spending if NHS England paid the same prices as US Medicare Part D for the 50 single-source brand-name drugs with the highest expenditure in English primary care in 2018.
Design
Retrospective analysis of 2018 drug prescribing and spending in the NHS England prescribing data and the Medicare Part D Drug Spending Dashboard and Data. We examined the 50 costliest drugs in English primary care available as brand-name-only in the US and England. We performed cost projections of NHS England spending with US Medicare Part D prices. We estimated average 2018 US rebates as 1 minus the quotient of net divided by gross Medicare Part D spending.
Setting
England and US
Participants
NHS England and US Medicare systems
Main outcome measures
Total spending, prescriptions and claims in NHS England and Medicare Part D. All spending and cost measures were reported in 2018 British pounds.
Results
NHS England spent £1.39 billion on drugs in the cohort. All drugs were more expensive under US Medicare Part D than NHS England. The US–England price ratios ranged from 1.3 to 9.9 (mean ratio 4.8). Accounting for prescribing volume, if NHS England had paid US Medicare Part D prices after adjusting for estimated US rebates, it would have spent 4.6 times as much in 2018 on drugs in the cohort (£6.42 billion).
Conclusions
Spending by NHS England would be substantially higher if it paid US Medicare Part D prices. This could result in decreased access to medicines and other health services.
Introduction
Prescription drug prices in the US, where brand-name pharmaceutical manufacturers set prices at their own discretion, far exceed prices in other countries, such as the UK, where the NHS controls drug prices based on estimates of clinical value within certain price parameters.1,2 In the US, prices for the most commonly prescribed brand-name drugs increased by 164% between 2008 and 2015, far exceeding the consumer price index. 1 Higher spending on drugs places pressure on payers in the public and private sectors, raises premiums and can increase cost sharing by beneficiaries. Increased out-of-pocket expenses, in turn, can lead to cost-related non-adherence (where patients cannot afford their medication or choose to prioritise other expenses) and worse health outcomes. 3
In the UK, by contrast, medicines are paid for by the NHS, and the state consequently plays a central role in establishing the prices of brand-name drugs. Agreements between the Department of Health and Social Care and the Association of the British Pharmaceutical Industry have been implemented through the Voluntary Scheme for Branded Medicines Pricing and Access. This scheme places limits on NHS spending growth and profits that manufacturers can earn, based on their expenditures on such activities as research and development. 4 The small number of manufacturers that do not participate in the Voluntary Scheme for Branded Medicines Pricing and Access are subject to a statutory scheme that mandates rebate payments based on a fixed percentage of revenue. Furthermore, the National Institute for Health and Care Excellence approves drugs for the NHS formulary based in part on a cost-effectiveness threshold per quality-adjusted life year. 5
Recent political changes may affect how drugs are priced in the UK. In particular, when the UK leaves the European Union, the US and UK governments intend to form a replacement bilateral trade agreement. 6 Pharmaceutical prices are likely to be central in negotiations since the Trump Administration has directed the US Trade Representative to combat global use of drug price controls and other cost-containment measures. 7 The UK government has claimed that the NHS would not be part of a trade deal with the US. 8 However, on the day of Brexit (31 January 2020), news media reported that Kim Darroch – the former British Ambassador to the US – stated that the US is indeed seeking to include the NHS and drug pricing in trade negotiations. 9 In previous trade negotiations with Australia, South Korea and New Zealand, the US has successfully promoted tools that increase spending on and prices of brand-name drugs, such as increased involvement of industry in pricing decisions, elimination of therapeutic reference pricing and removal of restrictions on direct-to-consumer drug advertising.10,11 Based on past precedent, a new bilateral trade agreement with the US could eliminate key components of the Voluntary Scheme for Branded Medicines Pricing and Access and result in brand-name drug prices in the UK closer to those established by manufacturers for US payers.
It is not currently known whether cost-containment measures in the UK will change following a trade deal with the US, and how this will fit into competing priorities on trade and health expenditure. To help inform national discussions, we set out to model how much NHS England would have spent in 2018 if it paid the same prices as the US Medicare drug benefit plan (‘Part D’) for the 50 single-source brand-name drugs with the highest expenditure in English primary care.
Methods
Datasets
For English prescribing, we used monthly data from our OpenPrescribing.net project. As described elsewhere, this dataset imports monthly prescribing data files managed and published by the NHS Business Services Authority, which are linked to other datasets describing practice characteristics. 12 Together, these datasets contain information about cost and volume prescribed for each drug, dose and preparation. The data are sourced from community pharmacy claims data and therefore contain information on all drugs dispensed in English primary care. We extracted aggregated national data between 1 January 2018 and 31 December 2018. We chose 2018 because this was the latest year with publicly available Medicare Part D data and a full year of NHS England data at the time of analysis. Medicare Part D is the best comparison in the US given that it is a federal government programme that provides insurance for outpatient prescription drugs. We used the Medicare Part D Drug Spending Dashboard and Data to collect US data on total spending, prescribing volume and costs for drugs included in our cohort. 13
Inclusion and exclusion criteria for single-source brand-name drugs
To identify the 50 single-source brand-name drugs with the highest expenditure by NHS England in 2018, we first grouped NHS prescribing data by chemical code. Chemical codes are the first nine digits of the British National Formulary code and designate the active drug substance of each item within the datasets. We ranked drugs according to total spending by NHS England in 2018. We analysed brand-name drugs since prices in NHS England are controlled through the Voluntary Scheme for Branded Medicines Pricing and Access, while no such centralized mechanism for cost-containment exists under Medicare Part D. 14 Some of our drug groupings included different drug products. When performing price comparisons and cost projections, we compared drug products separately within each drug grouping. We did this for all insulin diabetes medications, two different denosumab products (Prolia and Xgeva) and two different exenatide products (Bydureon and Byetta).
2018 English prices, price ratios, units and projected excess spending for 50 single-source brand-name drugs with highest expenditure in English primary care, by drug class.
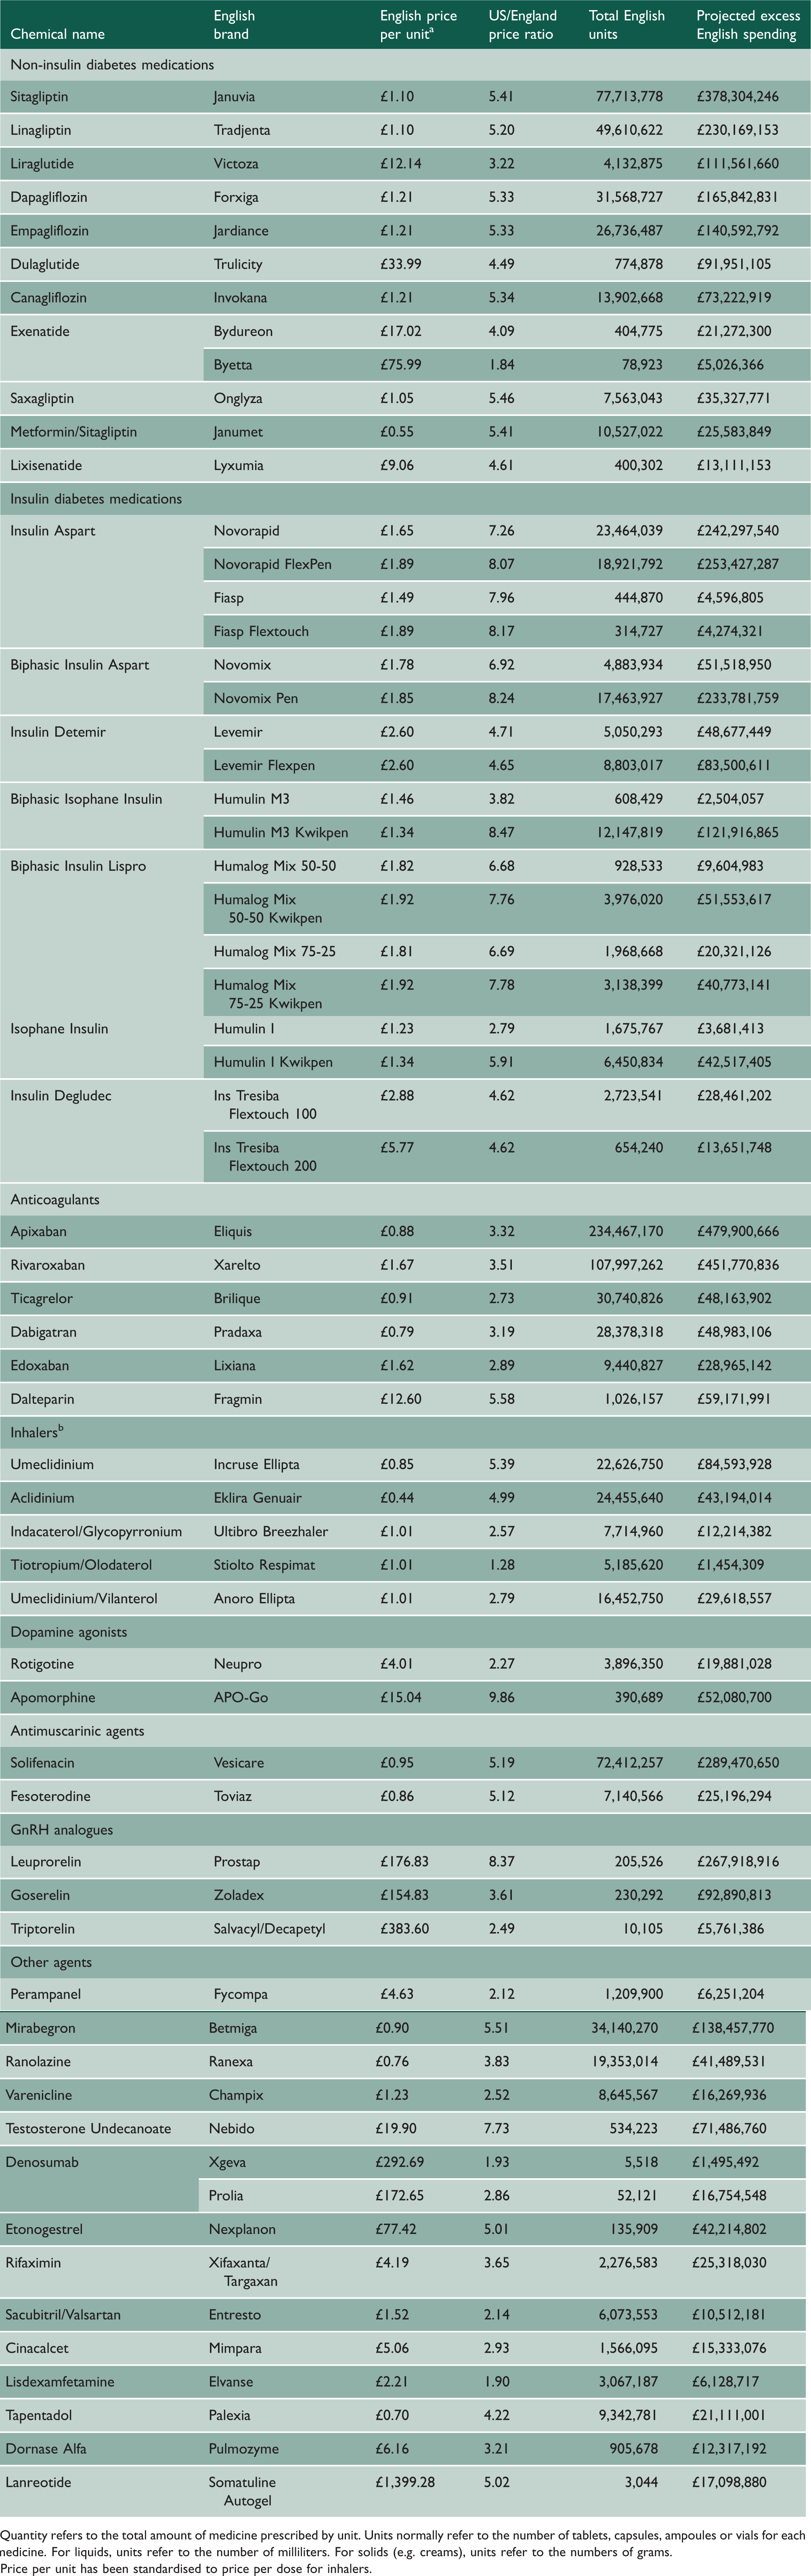
aQuantity refers to the total amount of medicine prescribed by unit. Units normally refer to the number of tablets, capsules, ampoules or vials for each medicine. For liquids, units refer to the number of milliliters. For solids (e.g. creams), units refer to the numbers of grams.
bPrice per unit has been standardised to price per dose for inhalers.
Cost calculations and rebate estimation
For each of the top 50 drugs, we extracted total ‘actual cost’ to the NHS and total quantity prescribed. Actual cost is a standard term in NHS prescribing data management that refers to the estimated net ingredient cost, subtracting the average percentage discounts received by pharmacists and adding in the cost of ‘container allowances’ (provided by the dispensing pharmacy when the quantity of drugs dispensed exceeds the pack size for the product). 20 Quantity refers to the total amount of medicine prescribed by unit, where the relevant unit depends upon the drug prescribed (e.g. milliliters for liquids, tablets for oral medications). English prices per unit for each drug were calculated by dividing total NHS spending by the total quantity prescribed.
US Medicare data for each corresponding drug in the cohort was obtained from the 2018 Medicare Part D Spending Dashboard and Data. All prices were converted from 2018 US dollars to 2018 British pounds with an average exchange rate of $1 = £0.75, obtained from the World Bank. Medicare spending was adjusted for manufacturer rebates and other price concessions using a method developed by Venker et al. 21 We will refer to all price concessions as rebates for the sake of simplicity. Spending figures from the Medicare Part D Spending Dashboard and Data do not account for rebates and thus represent gross spending. Each year, the Medicare Trustee Report provides an actual government spending figure, which accounts for rebates and thus represents net spending. Therefore, average rebates can be estimated as 1 minus the quotient of net Medicare Part D spending (per the Medicare Trustees Report) divided by gross Medicare Part D spending (per the Medicare Part D Drug Spending Dashboard and Data).13,22 This approach gave average rebates of 43.7% in 2018. We assumed conservatively that the NHS received no confidential rebates because there is no information in the public domain that either discloses these rebates or would allow us to estimate them. We adjusted US spending further by subtracting a $2.50 dispensing fee for each Medicare claim given that the English prices in our dataset did not include dispensing fees. Adjusted US price per unit was obtained by dividing adjusted total spending by total dosage units. US spending, dosage units and prices for each drug are listed in Supplementary Table 2. We estimated how much NHS England would have spent in 2018 if Medicare Part D prices applied by multiplying the adjusted US price per unit for each drug by the total quantity prescribed in English primary care.
Sensitivity analysis
We conducted a sensitivity analysis using net prices from SSR Health. 23 The SSR Health database provides US pricing data at a product level for drugs manufactured by publicly traded companies. Net prices reported by SSR Health account for discounts, rebates, co-payment coupon cards and other price concessions provided by manufacturers. However, data are not available for drugs manufactured by non-publicly traded companies.
All net prices from the SSR Health database were averaged over the four quarters of 2018. There were two products (Humulin N and Sensipar) where net prices were greater than gross prices. In these cases, we assumed rebates of 0%. If SSR net prices were not available for a product, we used 2018 prices from the US Federal Supply Schedule. 24 By relying on SSR Health and Federal Supply Schedule prices, our approach to the sensitivity analysis follows that of the Institute for Clinical and Economic Review. 25
Data sharing
Data management was carried out using SQL (in Google BigQuery) and Python. Complete code and data are provided online on Github (https://github.com/ebmdatalab/2018-UK-US-Brand-Analysis).
Patient and public involvement
We run OpenPrescribing.net, an openly accessible data explorer for all NHS England primary care prescribing data, which receives a large volume of user feedback from professionals, patients and the public. This feedback is used to refine and prioritize our informatics tools and research activities. Patients were not formally involved in developing this specific study design and this study analysed only publicly available and de-identified population data from the Medicare and NHS England populations.
Results
The top 50 single-source brand-name drugs studied included drugs from several classes: 11 (22%) non-insulin diabetes medication; 7 (14%) insulin diabetes medications; 6 (12%) anticoagulants; 5 (10%) inhalers; 2 (4%) dopamine agonists; 2 (4%) antimuscarinic agents; 4 (6%) GnRH analogues and 13 (26%) other agents (Table 1).
All drugs in the cohort were more expensive in the US than in England. The three highest US–English price ratios were 9.9, 8.5 and 8.4 for apomorphine (Apokyn/APO-go), biphasic isophane insulin (Humulin 70/30 Kwikpen/Humulin M3 Kwikpen) and leuprorelin acetate (Lupron Depot/Prostap), respectively. The US–English price ratios ranged from 1.3 to 9.9 with a mean ratio of 4.8. The three largest projected spending differences were £505 million, £480 million and £452 million for insulin aspart, apixaban and rivaroxaban, respectively. In 2018, NHS England spent £1.39 billion on drugs in the cohort.
Figure 1 shows actual NHS spending in 2018 on these 50 drugs and projected spending if NHS paid US Medicare Part D prices. Accounting for prescribing volume, if NHS England had paid Medicare Part D prices, the NHS would have spent 4.6 times as much on the 50 drugs in the cohort in 2018. More specifically, NHS England would have paid £6.42 billion, an increase of £5.03 billion from its actual expenditure of £1.39 billion. For context, 2018 total NHS spending on all drugs in English primary care was £8.03 billion. The projected spending increase of £5.03 billion on these 50 drugs therefore represents 62.6% of all 2018 primary care drug spending.
Actual and projected 2018 NHS England spending on 50 single-source brand-name drugs, by projected spending in English primary care.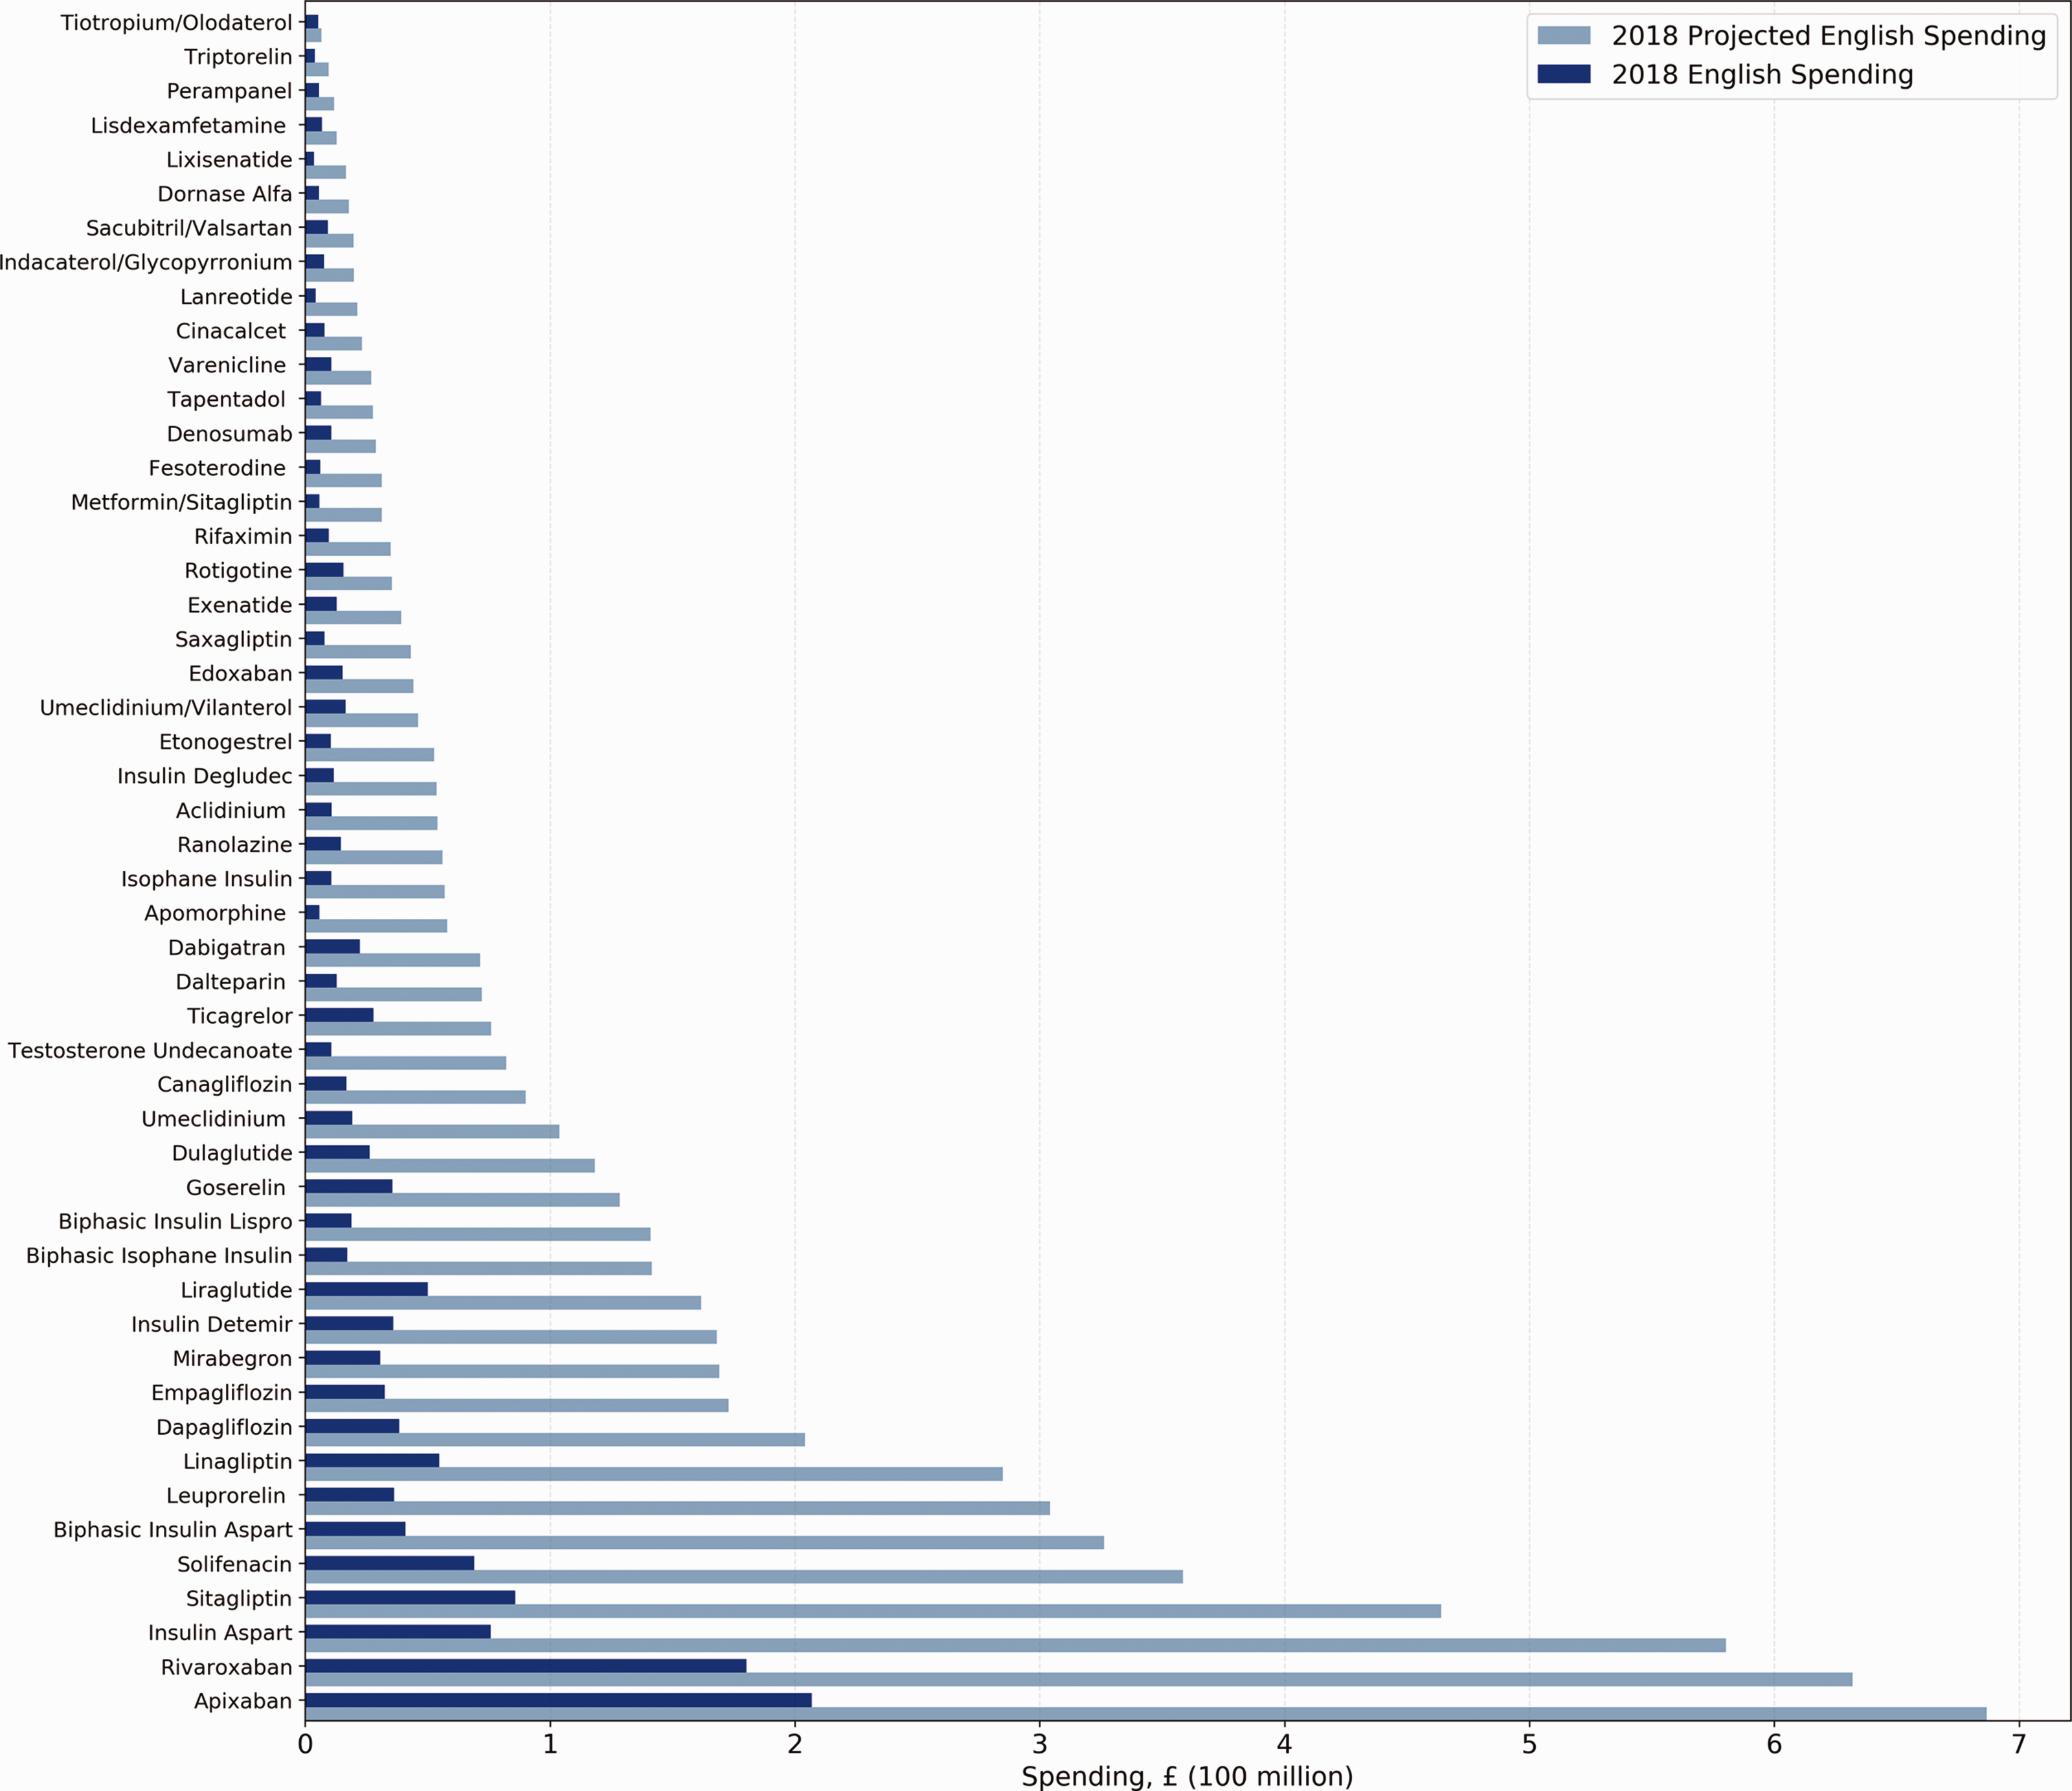
Product-level rebates from our sensitivity analysis ranged from 0% to 93% with an average value of 49%. All drugs except one – goserelin (Zoladex) – remained more expensive under US Medicare Part D than NHS England. If NHS England had paid US Medicare Part D prices after adjusting for rebates from the sensitivity analysis, the NHS would have spent 3.26 times as much on the 50 drugs in the cohort in 2018. More specifically, NHS England would have paid £4.53 billion, an increase of £3.26 billion from its actual expenditure of £1.39 billion.
Discussion
Summary
NHS England would spend substantially higher sums if it paid US Medicare Part D prices for brand-name prescription drugs: in 2018, NHS England would have spent 4.6 times as much for the 50 costliest single-source brand-name drugs used in English primary care, an increase from £1.39 to £6.42 billion. This is important context for discussions around trade negotiations and any possible changes to drug pricing.
Strengths and limitations of the study
We used comprehensive data on all English primary care and US Medicare databases to analyse spending. Our English database covered complete prescribing data for all English practices in 2018. These data are highly likely to be accurate as they are used to determine monthly reimbursement of dispensing pharmacies' medication costs and to assign those costs to individual NHS prescribing organisations. Likewise, the Medicare Drug Spending Dashboard and Data offers a near-complete accounting of Part D drug spending during the study period.
We note some limitations. First, our findings cover the 50 costliest drugs in English primary care: we are likely to have conservatively underestimated cost increases overall by excluding NHS hospital prescribing; however, access to hospital medicines data is restricted by the NHS. Second, the Medicare database does not differentiate between dosages for its spending and pricing data; however, all drugs we studied were brand-name products that are typically priced similarly regardless of dose. Third, we underestimate cost impacts for the UK as we could not easily access and process data for Scotland, Wales and Northern Ireland. Finally, we again conservatively underestimated excess costs to the NHS because of how our analysis handled rebates in the US and England. For US prescribing, we estimated average 2018 Medicare Part D rebates of 43.7% using established methods derived from openly accessible data. For English data, although we know that some clinical commissioning groups in England receive financial rebates from manufacturers via primary care rebate schemes, all information on this activity is deemed commercially sensitive and none is disclosed. The scale therefore cannot be estimated. 26 Altogether, our analysis is likely to have substantially underestimated excess costs to the NHS.
Findings in context
Our results support the existing literature on disparities in international drug pricing.2,27 Specifically, our cost projections are consistent with a recent analysis showing that average US post-rebate ex-factory prices for single-source brand-name drugs were 2.8, 2.5 and 3.3 times higher than UK, Japan and Ontario prices, respectively; however, unlike our work, this analysis did not account for prescribing volume. 2 Our findings are also consistent with results from a report by the US Department of Health and Human Services showing that 19 out of the 27 costliest Medicare Part B drugs were more expensive in the US than in 18 economically comparable countries, including the UK; however, this analysis included only drugs administered by infusion or injection in physician offices or hospital settings. 27
To our knowledge, this is the first systematic and detailed analysis of primary care drug costs and spending in the US and England. A recent report projected that the total NHS drug bill could soar from £18 billion to £45 billion if US prices applied. 28 However, this crude figure was estimated using analysis from the Organization for Economic Co-Operation and Development, which reported that pharmaceutical expenditure per capita was 2.5 times higher in the US than in the UK in 2016.
Policy implications
It is currently unclear whether prescription drug prices will be included in any trade deal between the US and UK following Brexit. The UK government has stated that the NHS would not be part of a trade deal with the US. 8 However, the US Trade Representative has been instructed to combat drug price controls globally, and the former British Ambassador to the US has stated that the US is seeking to include drug pricing in negotiations.8,9 Previous US trade negotiations with other states have involved changes to drug pricing and many include investor-state dispute settlements that allow drug manufacturers to sue nations for alleged discriminatory practices. 29 A recent summary of negotiating objectives revealed that the US Trade Representative is pursuing ‘full market access’ for US pharmaceuticals in the UK. 6
If drug prices are included in a US–UK trade deal, full access to the UK market could compromise current cost-containment mechanisms and result in drug prices more similar to those of the US. Any increase in NHS spending would be absorbed by English taxpayers and would divert resources away from other essential health services and governmental priorities. Alternatively, drug price increases could be offset by higher patient co-payments (when patients make a contribution to the cost of their own care), with resulting problems in affordability and consequent medication non-adherence. Most working-age adults in the English NHS currently pay a £9.00 prescription charge for each prescribed item, which is a longstanding arrangement functionally equivalent to a co-payment. 30
Our figures show the possible cost impact of a scenario in which UK prices change to match those of the US. We hope that this is useful in understanding the parameters of any possible change. Patients, taxpayers, clinicians, managers and policymakers should closely regard potential consequences of relinquishing established mechanisms to control prescription drug prices within the NHS and consider these in the context of other economic benefits and disadvantages from associated changes to trade.
Conclusions
NHS England would have spent £5.03 billion more on 50 widely used primary care brand-name prescription drugs if it had paid US Medicare Part D prices in 2018. Trade negotiations post-Brexit should be informed by detailed modelling of the cost implications to the NHS of immediate or gradual changes in the price of commonly used drugs.
Supplemental Material
sj-pdf-1-jrs-10.1177_0141076820918238 - Supplemental material for Projected spending for brand-name drugs in English primary care given US prices: a cross-sectional study
Supplemental material, sj-pdf-1-jrs-10.1177_0141076820918238 for Projected spending for brand-name drugs in English primary care given US prices: a cross-sectional study by Michael Liu, Brian MacKenna, William B Feldman, Alex J Walker, Jerry Avorn, Aaron S Kesselheim and Ben Goldacre in Journal of the Royal Society of Medicine
Footnotes
Declarations
Acknowledgments
We thank the Medicare and NHS England populations whose data populated the databases and made this paper possible. We also acknowledge Helen Curtis, Caroline Morton and Richard Croker for providing code assistance and reviewing earlier versions of this article.
Provenance
Not commissioned; peer-reviewed by Martin McKee and Julie Morris.
Supplemental Material
Supplemental material for this article is available online.
References
Supplementary Material
Please find the following supplemental material available below.
For Open Access articles published under a Creative Commons License, all supplemental material carries the same license as the article it is associated with.
For non-Open Access articles published, all supplemental material carries a non-exclusive license, and permission requests for re-use of supplemental material or any part of supplemental material shall be sent directly to the copyright owner as specified in the copyright notice associated with the article.