
Abstract
Objectives
To report on long-term trends in hospital admission rates for anorexia nervosa using two English datasets.
Design
We used data on hospital day-case and inpatient care across five decades in the Oxford Record Linkage Study (ORLS), and similar data for all England from 1990. We analysed rates of admission for anorexia nervosa in people aged 10–44 years, using hospital episodes (counting every admission) and first-recorded admissions (counting only the first record for each person).
Setting
Former Oxford NHS Region; and England.
Participants
None; anonymous statistical records were used.
Results
In the longstanding ORLS, the age-standardised first-recorded admission rate for women was 2.7 (95% confidence interval 1.6–3.8) per 100,000 female population aged 10–44 years in 1968–1971; 2.7 (2.1–3.3) in 1992–1996; and 6.3 (5.5–7.2) in 2007–2011. Male rates were zero in the 1960s; 0.07 (0.0–0.1) per 100,000 men in 1992–1996; and 0.4 (0.2–0.6) in 2007–2011. In England, female rates increased from 4.2 (4.0–4.4) in 1998–2001 to 6.9 (6.7–7.1) in 2007–2011; and the corresponding male rates were 0.2 (0.1–0.3) and 0.5 (0.4–0.6). Episode-based admission rates rose more than person-based rates. The highest rates by far were in girls and women aged 15–19 years.
Conclusions
In recent years, anorexia nervosa has become a greater burden on secondary care: not only have admission rates increased but so too have multiple admissions per person with anorexia nervosa. The increase in admission rates might reflect an increase in prevalence rates of anorexia nervosa in the general population, but other explanations, including lower clinical thresholds for admission, are possible and are discussed.
Anorexia nervosa (AN) is an eating disorder characterised by a distorted body image with a pathological fear of becoming fat, leading to extreme weight loss and low body mass index (<17.5 kg/m2). It is more common in women than men: in a review of 29 cross-sectional surveys, it was stated that ‘its incidence is about ten times higher in females than males’. 1 A survey in the USA found a smaller female-to-male difference: the authors reported a total estimated lifetime prevalence of 0.6%, with 0.9% for women and 0.3% for men. 2 These authors suggested that sex differences may not be as pronounced as previously thought because of greater reluctance of men than women to seek help. 2 anorexia nervosa has a very variable course and prognosis: less than half of all patients fully recover, one-third improve with only residual symptoms and 20% follow a chronic course. 3 The all-cause age-standardised mortality ratio (SMR) in young people with anorexia nervosa has been estimated at 10 (relative to SMR = 1 in the general population of equivalent age), which is about three times higher than that of other psychiatric disorders.4,5
Several publications have suggested that rates of anorexia nervosa may have increased in recent decades.6–8 However, others argue that observed changes may be due to differences in definition and diagnostic criteria, differences in methodologies, and improved availability and use of local mental health services.8,9 Lucas et al. published 50-year trends, from 1935 to 1984, in the incidence of anorexia nervosa in Rochester, Minnesota. 11 They reported an increase in incidence in women aged 15–24 years, but reported that there was no increase in older women or in men. They raised a number of possible caveats about whether the observed rise in young women represented a true increase in anorexia nervosa, including possibilities that the rise may have been a consequence of differential migration into, and changes in the structure of, the general population studied. 11 Hoek and van Hoeken combined data from epidemiological studies across Europe to estimate the incidence of anorexia nervosa in mental healthcare up to 1996. 12 They found that until the 1970s, there was an increase in registered cases of anorexia nervosa; after this, the incidence stabilised. In their more recent review of the incidence, prevalence and mortality of eating disorders, the authors reiterate these findings. 13 Fombonne reported on 29 surveys from the 1930s to the 1990s, undertaken using different methods in many different populations, and wrote that studies showing no upward trend were as numerous as those that showed an increase. 1
Data on very long-term time trends from a single method of data collection are sparse. Accordingly, this study presents unique English long-term data on anorexia nervosa from a single method of data collection – hospital day cases and inpatient admissions – in an area of southern England from 1968 to 2011, and in a similar all-England hospital dataset from 1990 to 2011.
Population and methods
Annual rates of hospital admission for anorexia nervosa in people aged 10–44 years were analysed using data from the longstanding Oxford Record Linkage Study (ORLS), available from 1968 to 2011. Successive records of care had been linked throughout this period and therefore counts could be made of individual people hospitalised with anorexia nervosa as well as counts of episodes of care. Equivalent English national hospital statistics were available, and analysed, from 1990 to 2011, except that the data were not linkable prior to 1998.
The ORLS data include all day cases (a day case is the term given, in England, to an episode of care when the patient is admitted to hospital but does not stay overnight) and all inpatient admissions (admissions with overnight stays) in hospitals in the former Oxford Regional Health Authority area. From 1968, this covered Oxfordshire and West Berkshire (850,000 people), increasing to cover the whole region from 1991 (2.5 million people). The all-England dataset is Hospital Episode Statistics, the national, routinely collected statistical dataset on all NHS hospital day-case and inpatient care, which commenced in 1990 as its first full calendar year. It was supplied as a file of raw data by the Health and Social Care Information Centre (which was unable to supply data for more recent years as a result of its embargo in 2013 on provision of Hospital Episode Statistics data to independent researchers). The ORLS data were collected directly from individual health authorities from 1968 to 1999; and were derived as the ORLS subset of the English national dataset from 1999. Both datasets were searched for episodes of care for anorexia nervosa, identified as codes 306.5 in the International Classification of Diseases 8th edition, 307.1 in the 9th edition and F50.0 in the 10th edition. All of these codes specify a diagnosis of anorexia nervosa (excluding patients in the category of ‘atypical anorexia nervosa’ which is a separate entry, F50.1, in ICD10).
The basic records of hospitalisations for anorexia nervosa were analysed as episodes of care, i.e. counting every day case or inpatient admission regardless of how many each person had. Using record linkage, the records of each individual person’s episodes were brought together as a time-sequenced record for the person. In this way, counts of individual people were distinguished from counts of episodes. Record matching and linkage were done on the basis of a personal number, unique for each person in the ORLS but meaningless outside it, and on the basis of encrypted values of the patient’s HESID (a unique number for each hospitalised person), NHS number (a unique number for each person registered with the NHS), postcode and date of birth in the all-England dataset. We show episode-based rates, in which each episode is counted; annual person-based rates in which individuals are counted once in the year, regardless of how many admissions they have had; and person-based first-recorded admission rates in which people are counted once only, regardless of how many admissions they have, and allocated to the year of first known admission. We give the measures of episode-based rates because these are the commonest available measure in hospital admission statistics in many industrialised countries, where data could be compared with ours; and we give record-linked, annual, person-based data because these, too, could also be analysed in some countries. Our measure of ‘first-recorded’ admission rates is given, and in principle is the most satisfactory measure, because, though imperfect as a measure of incidence, it is the closest to ‘hospitalised incidence’ that can be obtained. These ‘first-recorded’ admission rates are artificially high in the early years of the trend analyses: this is because, in the first years of analysis, there will be people who actually have had previous admissions for anorexia nervosa but prior to the commencement of the datasets.
Population-based mortality rates for anorexia nervosa were calculated using all certified causes of death, not just the underlying cause, in Oxford and England (all-cause data available from, respectively, 1979 and 1995).
The analyses were restricted to people with anorexia nervosa aged 10–44 years. Age-specific rates were analysed in five-year groups; and age-standardised rates, within the overall 10–44-year age group, were standardised using the quinquennial age-specific rates, the direct method of standardisation, and the European standard population. The average annual rate of change in mortality was calculated by fitting a regression model to the logarithms of the rates.
Results
Average annual age-standardised hospital admission rates for anorexia nervosa per 100,000 people aged 10–44 years: rates for episodes, and for first recorded admission, for anorexia nervosa in the Oxford Record Linkage Study area.
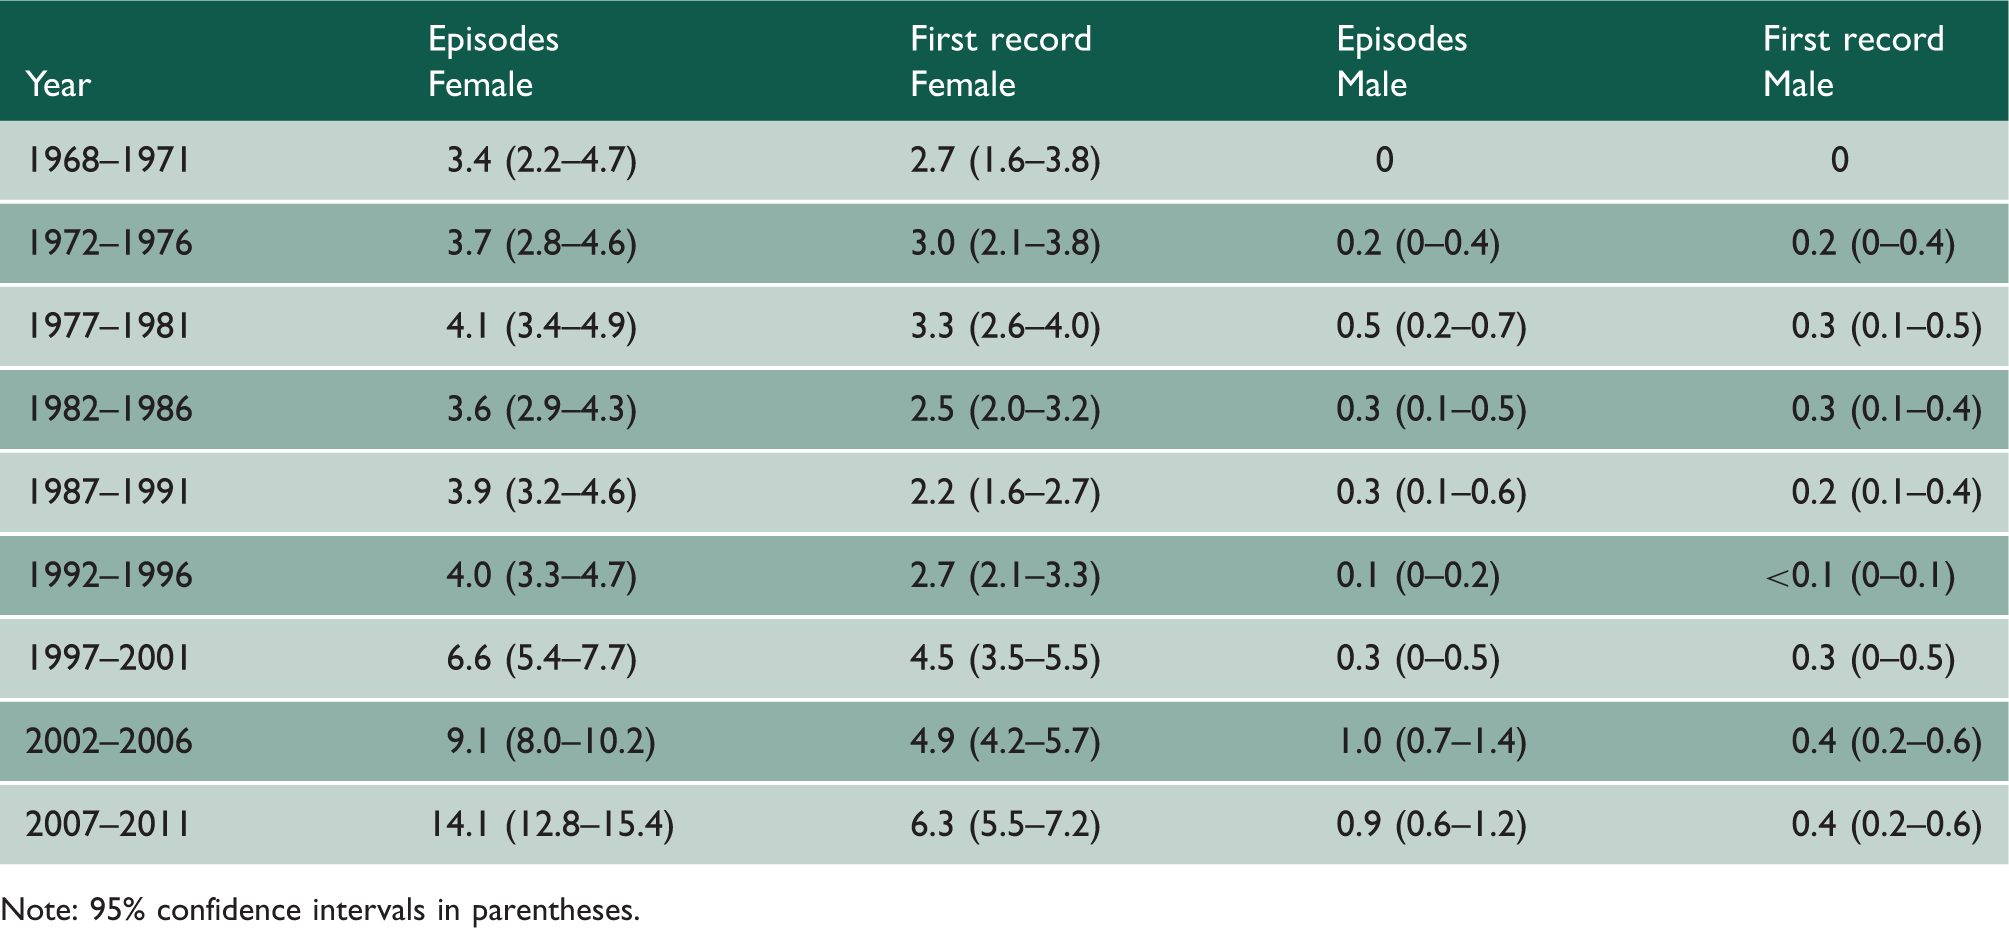
Note: 95% confidence intervals in parentheses.
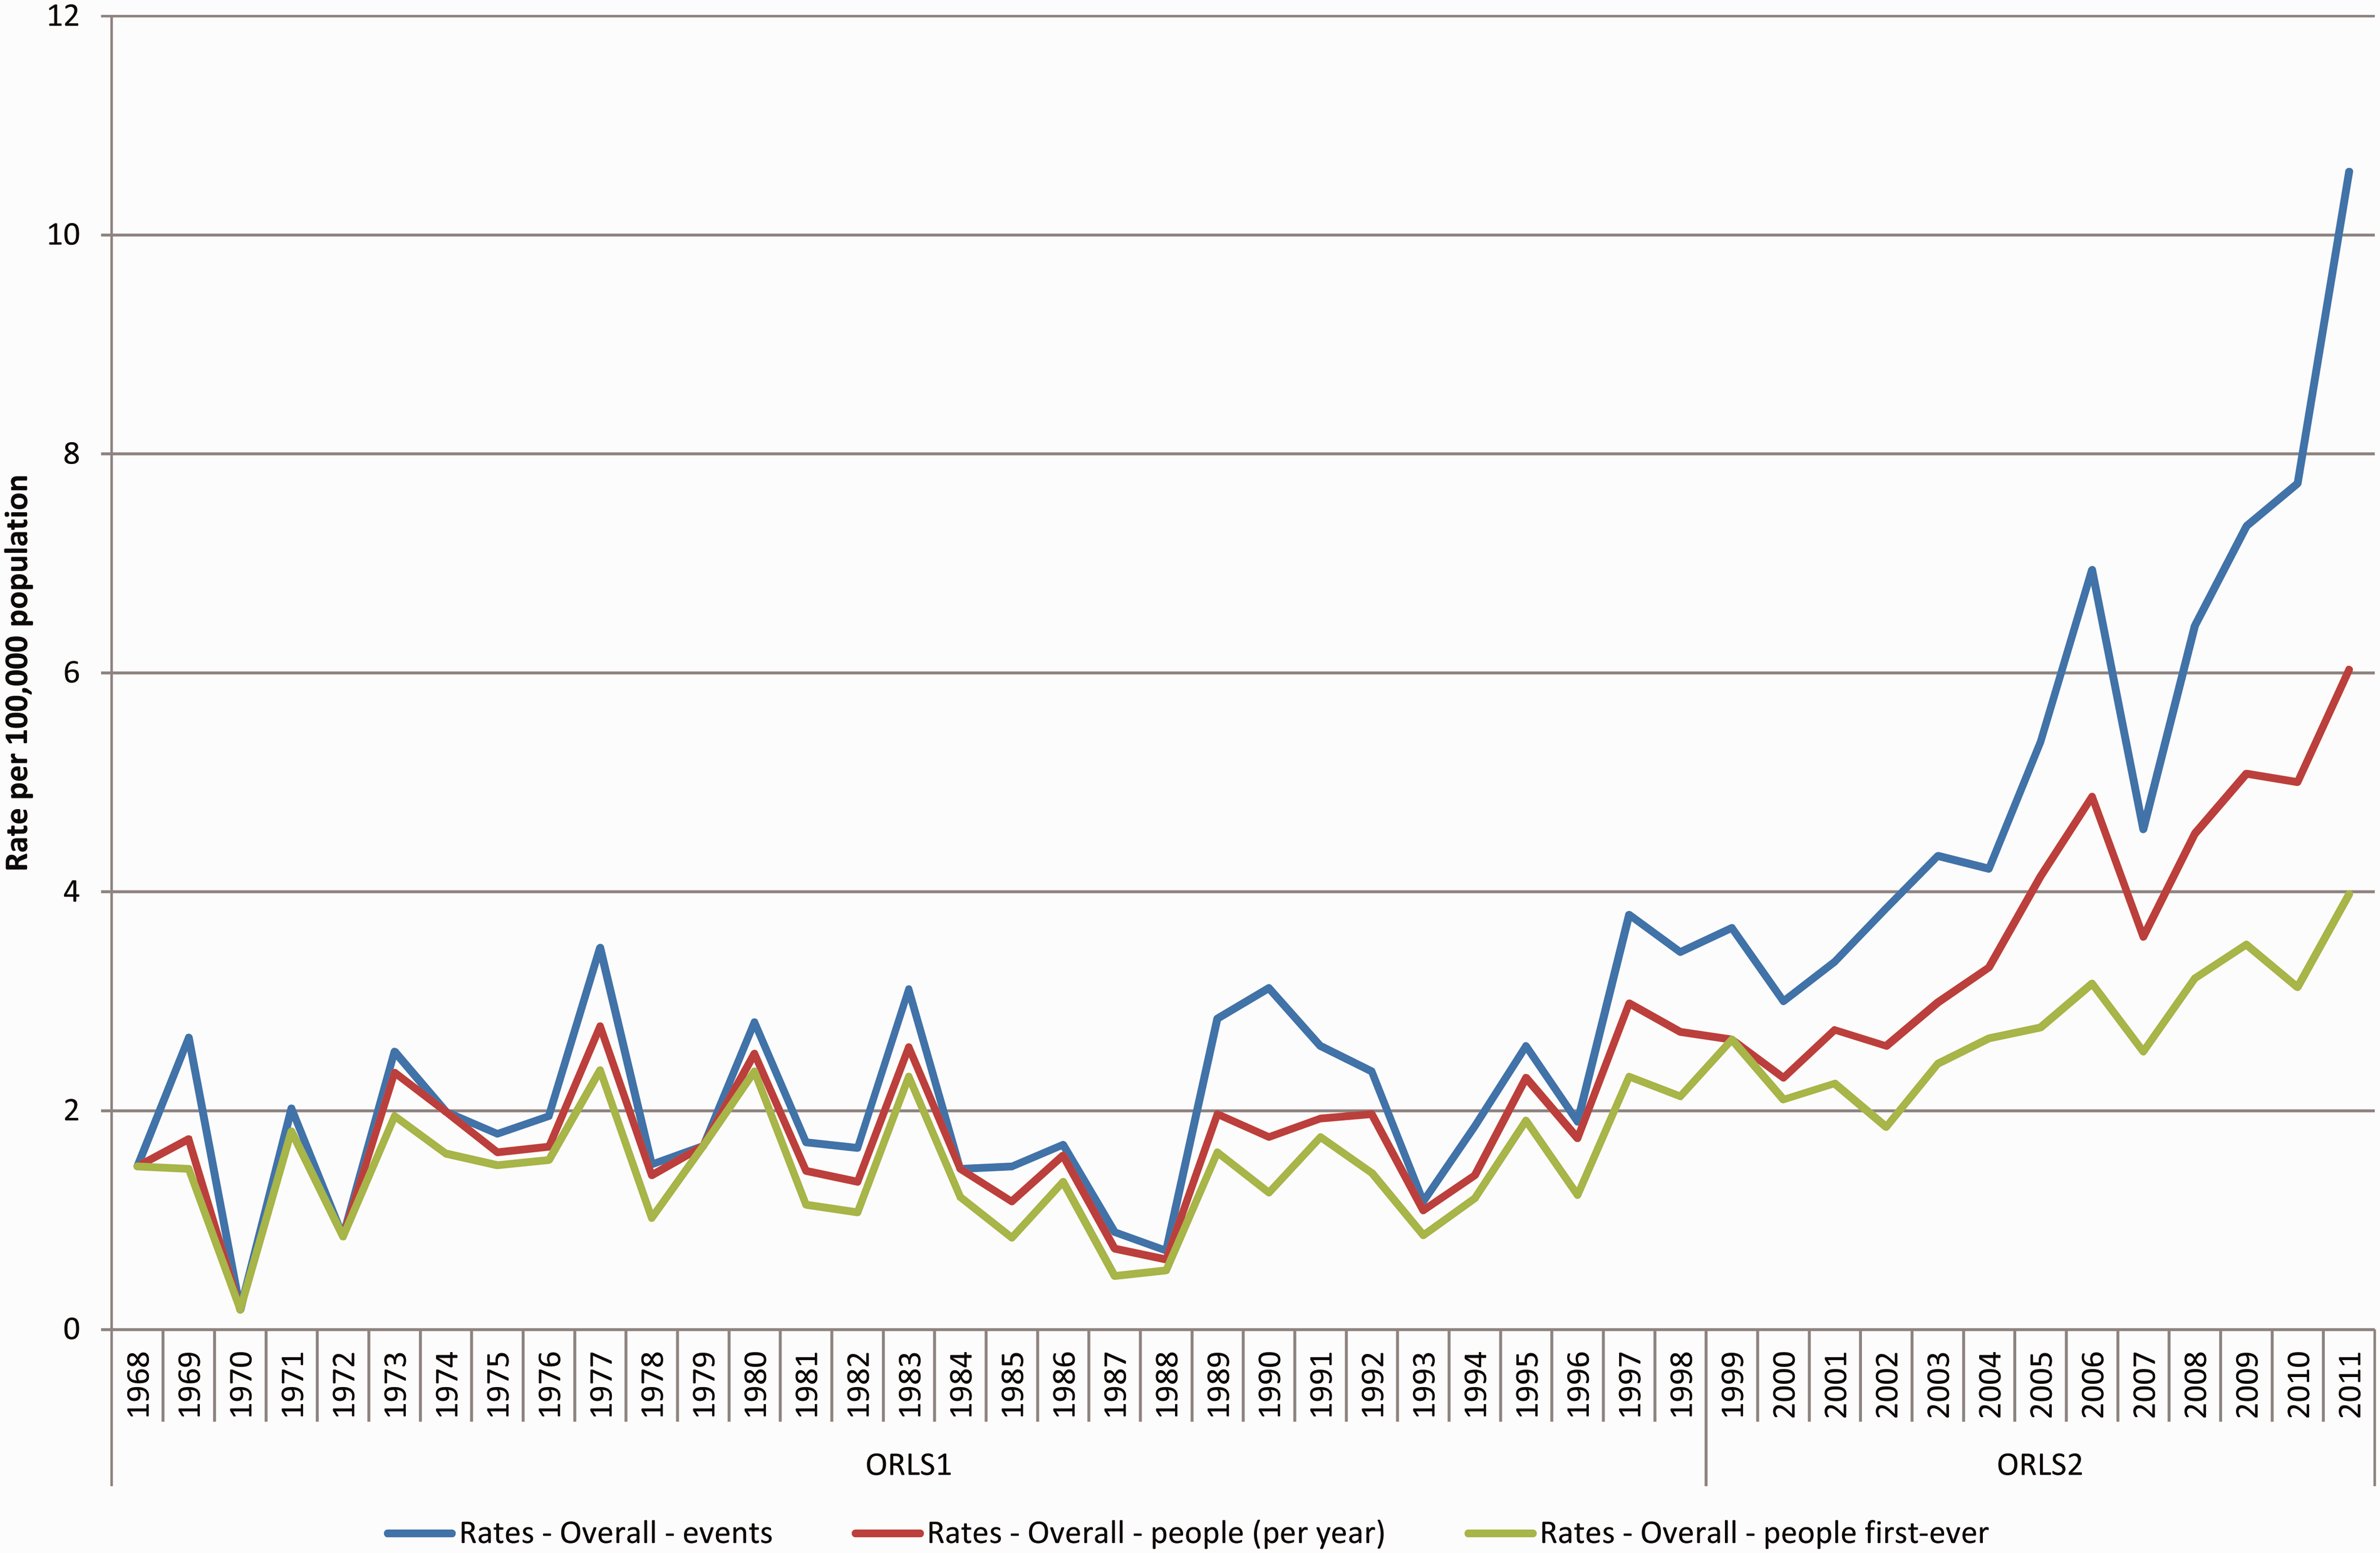
Age-standardised hospital admission rates for anorexia nervosa in the Oxford Record Linkage Study area, per 100,000 population aged 10–44 years, showing episode-based rates (upper line), people admitted per year (middle line), and peoples’ first record of admission (lower line).
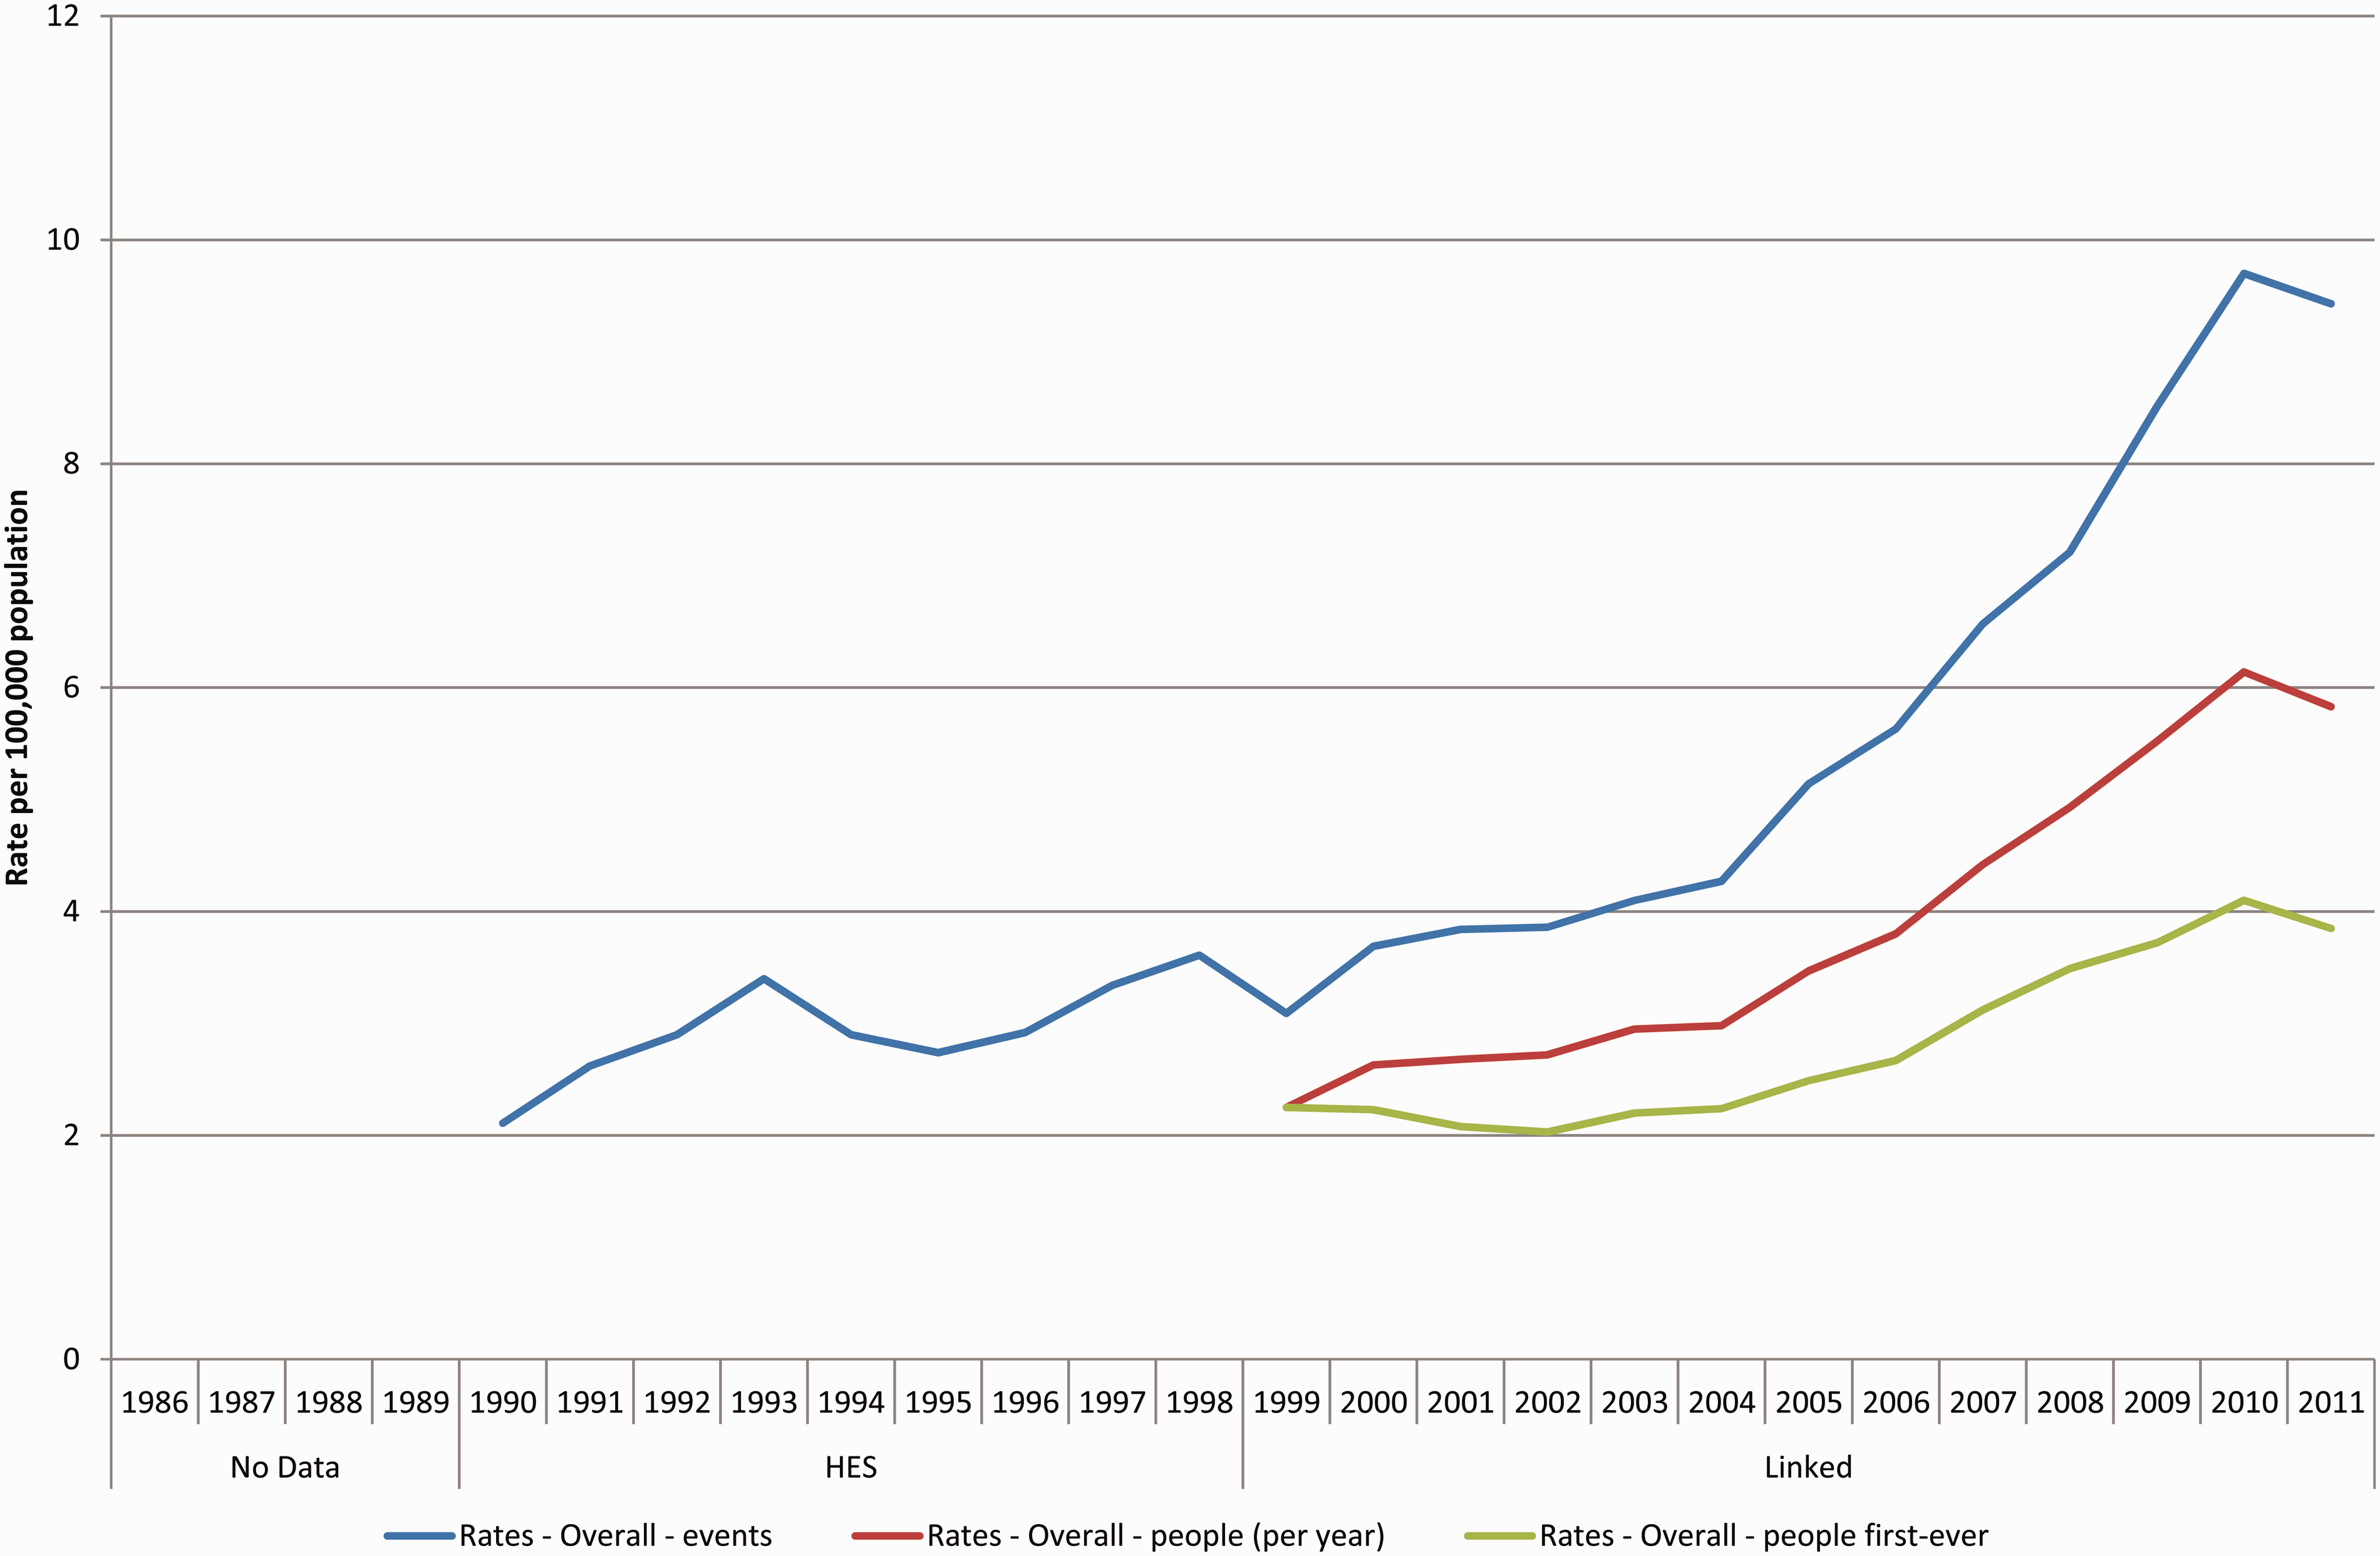
Age-standardised hospital admission rates for anorexia nervosa in England, per 100,000 population aged 10–44 years, showing episode-based rates (upper line), people admitted per year (middle line), and peoples’ first record of admission (lower line).
Average annual age-standardised hospital admission rates for anorexia nervosa per 100,000 people aged 10–44 years: rates for episodes, and for first recorded admission, for anorexia nervosa in England.
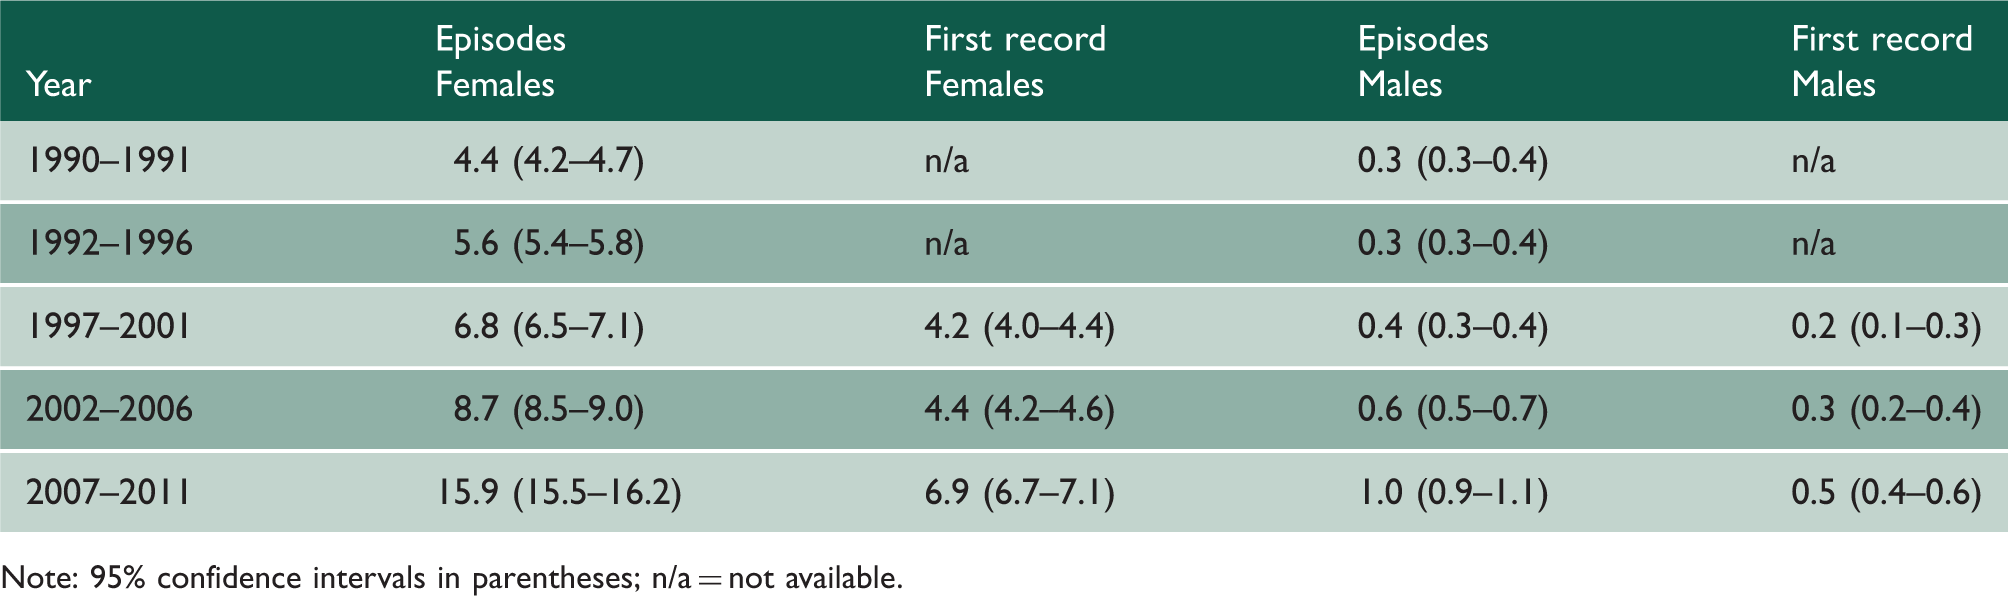
Note: 95% confidence intervals in parentheses; n/a = not available.
A similar trend to that in the later years of the ORLS was seen within the shorter run of all-England data (Table 2, Figure 2), with age-standardised rates of first-recorded admissions in women rising from 4.2 (4.0 to 4.4) per 100,00 girls and women aged 10–44 years in 1998–2001 to 6.9 (6.7–7.1) in 2007–2011. The corresponding rates for men were 0.2 (0.1–0.3) in 1998–2001 and 0.5 (0.4–0.6) in 2007–2011.
The data show a divergence between the three rates (Figures 1 and 2), indicating that rates of multiple admissions per person with anorexia nervosa have increased at a greater rate than the increase in first-recorded episodes.
Figure 3 shows trends in age-specific female rates in the ORLS area (male rates, much lower, and in a relatively small population, are not shown). Supplementary Figures 4 and 5 show age-specific female and male rates in the much larger all-England population from 1999. Rates of admission have risen in all age groups in recent years (Figure 3, supplementary Figures 4 and 5), with the highest rates and the greatest increases in age groups 10–14 years, 15–19 years and 20–24 years. Age-specific rates were, by far, highest in the 15- to 19-year-old age group in girls and women (Figure 3, Supplementary Figure 4). The peak rate in people aged 15–19 years was more striking in girls than boys; in boys, rates in people aged 10–14 years were not much lower than those in the 15–19-year age group (Supplementary Figure 5).
First-recorded admission rates for anorexia nervosa in girls and women in the Oxford Record Linkage Study area by time period from 1968 to 1971 and in 5-year age groups.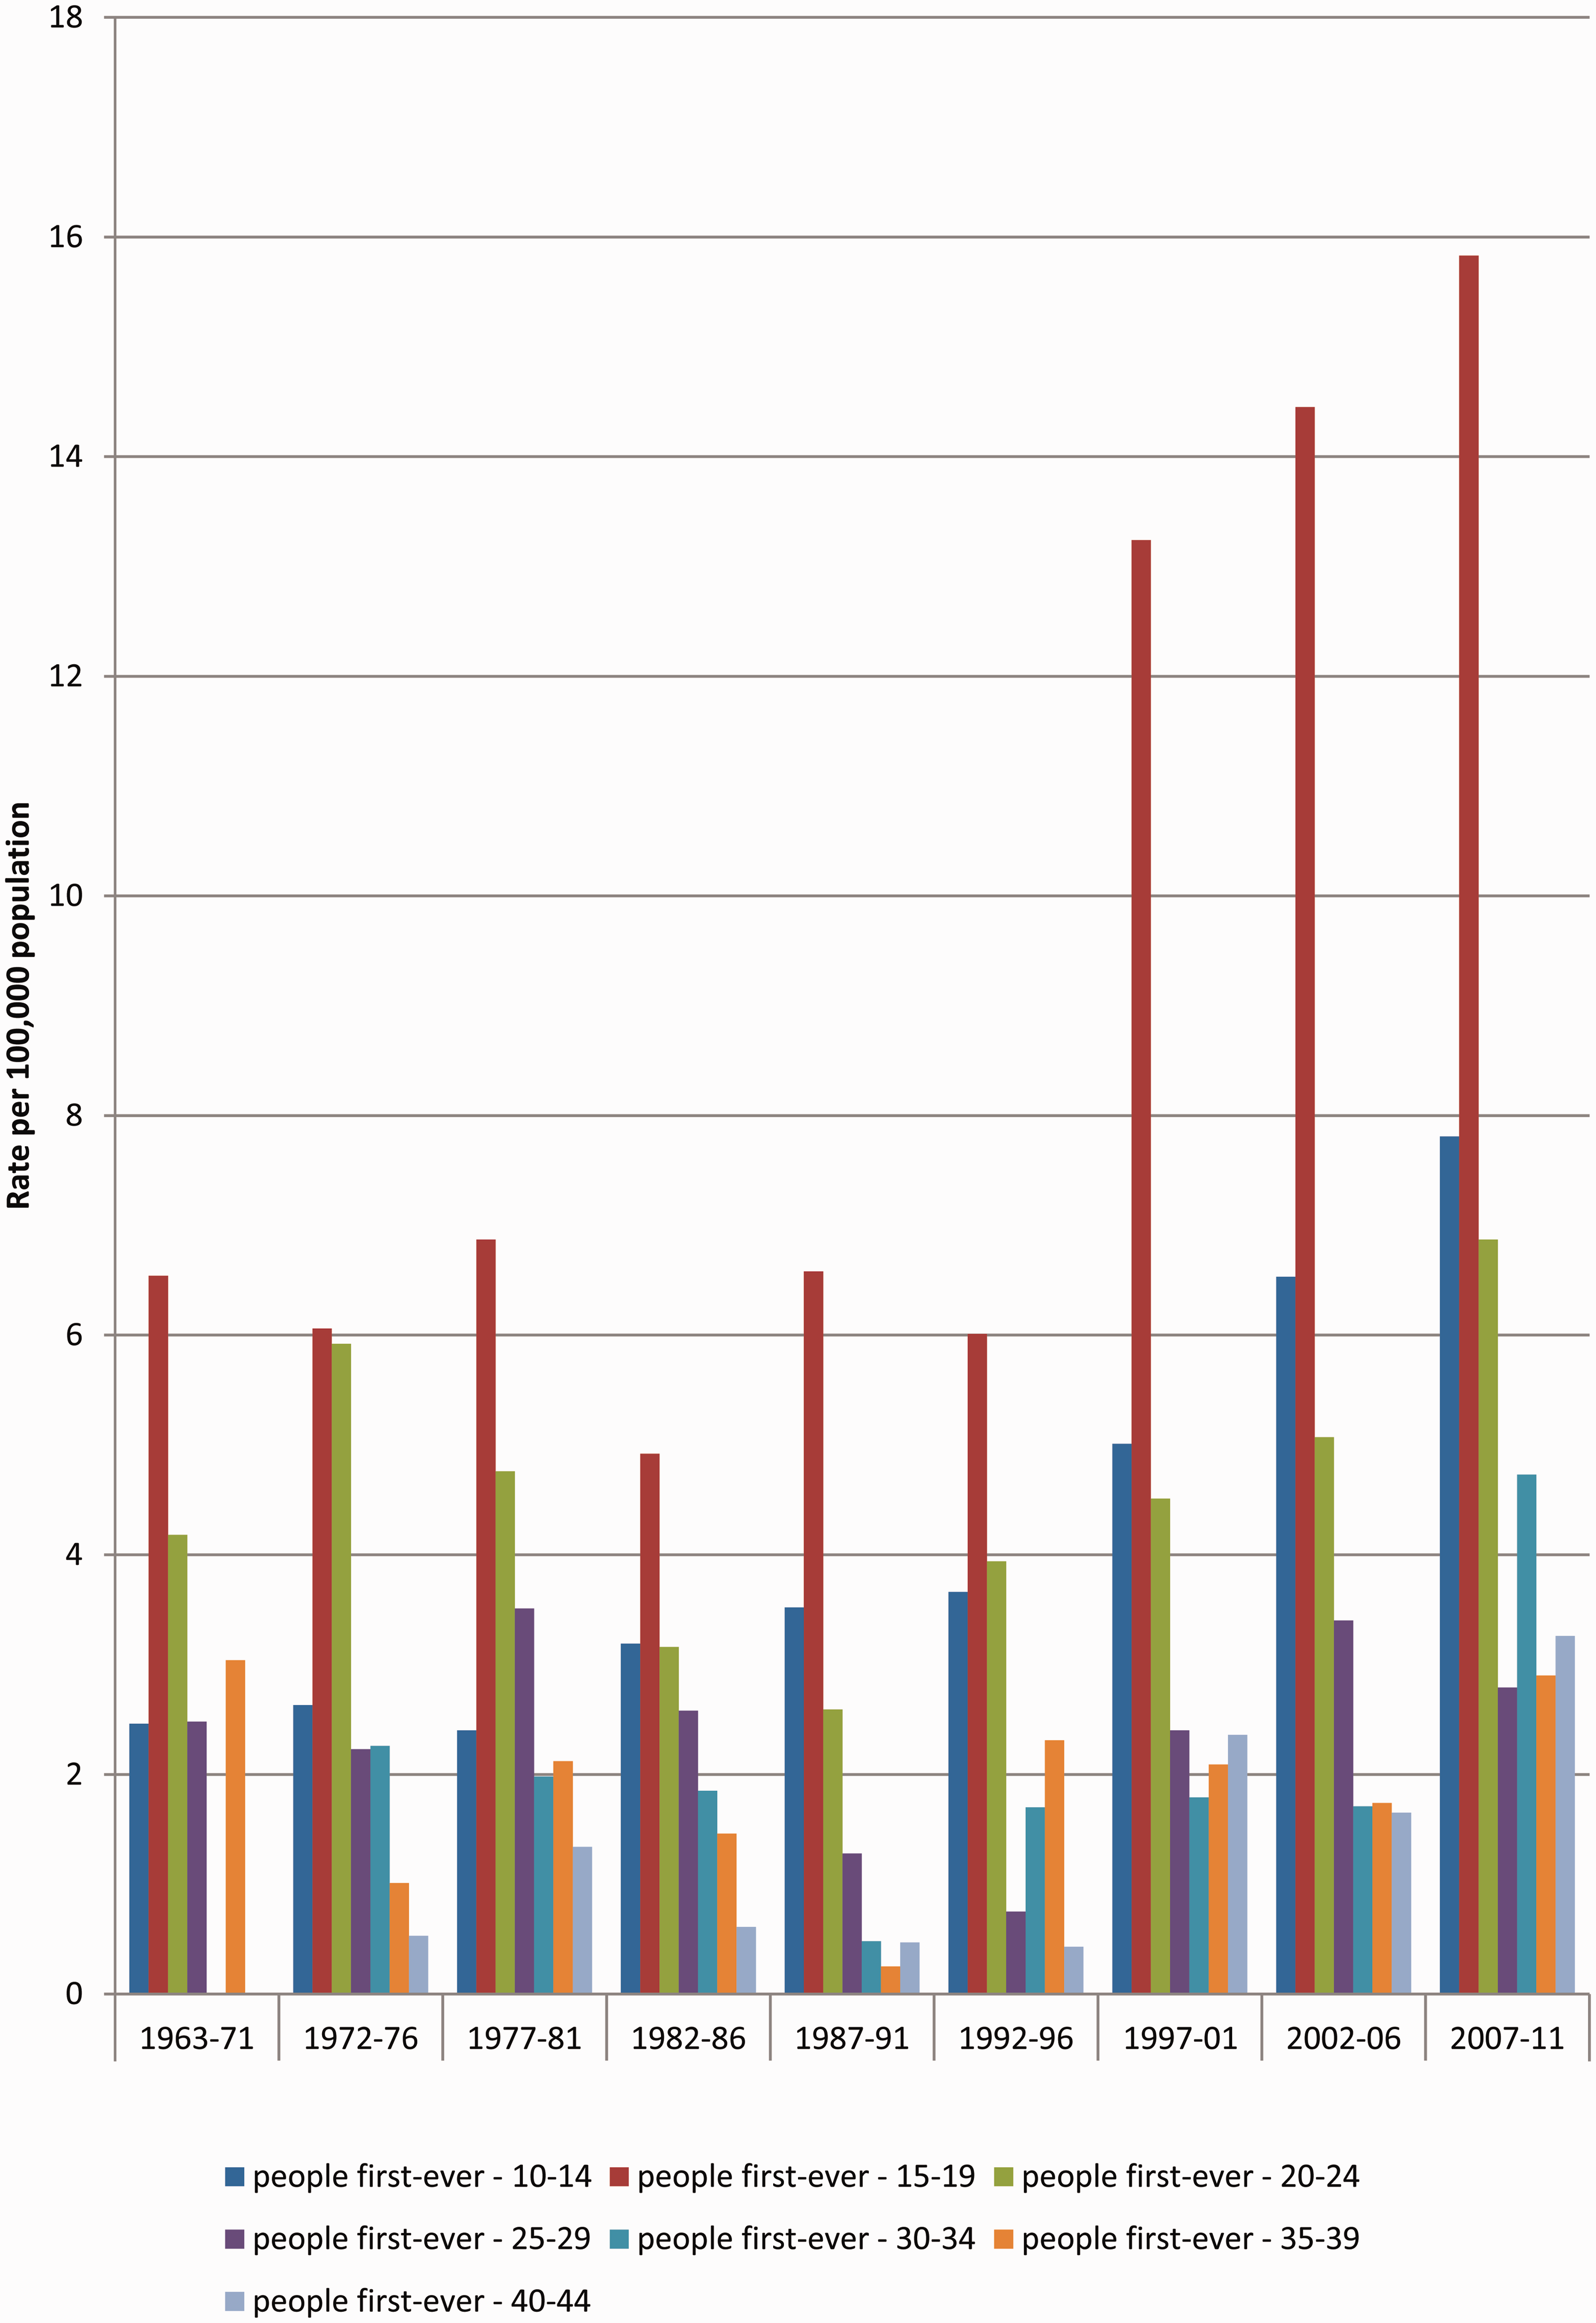
Supplementary Figure 6 shows mortality rates for anorexia nervosa in England with the diagnosis in any position on the death certificate (‘mentions’) and with anorexia nervosa as the underlying cause. Changes over time were small and non-significant (average annual change −1.31%, 95% confidence interval −3.70 to 1.14 in women; numbers too small for meaningful calculation in men). In the longer but much smaller dataset for Oxford, there were no deaths for anorexia nervosa in 1979–1997 and nine (evenly spread across the years) in 1998–2011.
Discussion
Principal findings
The principal findings from the ORLS dataset, in which data on individuals are available from 1968, are that rates of admission for anorexia nervosa fluctuated a little, but remained stable overall, at around 2 per 100,000 population in the 1960s to 1990s. Then they increased. The largest increase was in girls aged 15–19 years, with striking increases also seen in girls aged 10–14 years and women aged 20–24 years. Admission rates nationally have increased, too, in recent years, although there is not a long run of person-based data against which to compare the recent national rates. The data show a divergence of rates of episodes, people admitted per year, and first recorded admissions. This means that the number of multiple admissions with anorexia nervosa, per person admitted with anorexia nervosa, has been increasing.
Interpretation
Admission rates are a product of the occurrence of disease and clinical thresholds for admission. The likely explanation for the lack of increase in admission rates for anorexia nervosa between the 1960s and late 1990s is that there were no appreciable increases in the incidence and prevalence of anorexia nervosa. The alternative explanation is that there were changes in incidence but that they were, rather precisely, counter-balanced by changes in admission thresholds in opposite directions. Though not impossible, we suggest that this latter explanation is unlikely.
A number of factors may have contributed to the rise in admission rates for anorexia nervosa in recent years; and in a study of this design, we cannot distinguish between them. The rise may reflect a true increase in the incidence and prevalence of anorexia nervosa, but other explanations are possible. These include changes in the severity of anorexia nervosa, increasing the role of secondary care in its management; increasing rates of prolonged or relapsing anorexia nervosa; better provision of services for mental health, stimulating greater use of them; less stigma in presenting with mental health problems, stimulating greater use of services; and increasing recognition of relevant symptoms and signs as being anorexia nervosa. Other possibilities are lower clinical thresholds for referral of cases of anorexia nervosa to secondary care, and lower clinical thresholds for admission to hospital for people with anorexia nervosa. Indeed, there is evidence in respect of other conditions that admission rates in England in recent years have increased as a result of a trend of lowering clinical thresholds for admitting people to hospital. 14 Although our data cannot definitively show whether anorexia nervosa incidence and prevalence rates are rising within the population, it can be concluded that, because admission and re-admission rates for anorexia nervosa are increasing, anorexia nervosa is now generating greater use of hospital resources than at any previous time in the past few decades.
As with admission rates, a number of explanations are possible for rising re-admission rates. These include the possibilities (which we cannot test) of increasing severity of anorexia nervosa; phased secondary care with an increase in planned admission, discharge and re-admission; lower clinical thresholds for re-admission; perhaps greater reluctance by general practitioners to manage people with anorexia nervosa without spells of secondary care; and perhaps an increase in numbers of individuals who are inadequately managed within the community and thus require repeat admissions.
It was possible that a decline in mortality from anorexia nervosa, over the years of the study, might have left a larger prevalence pool of people with anorexia nervosa ‘at risk’ of admission in the later years. However, the data show that there was no evidence of a decline in mortality.
Comparison with other studies
There is no doubt that figures estimating the incidence and prevalence of anorexia nervosa vary depending on definitions and methods of data collection. This is readily seen in the difference in rate estimates between household, general practitioner and hospital samples.13,15 Our study supports the work of Fombonne 1 and of Hoek and van Hoeken: 11 there is no evidence of an increase in rates of anorexia nervosa before the 1990s or early 2000s. However, our analysis of more recent data shows an upward trend in admission rates, and it would be useful to have similar, recent data from other countries.
Strengths and limitations
A key strength of this investigation is the long duration of person-based data collection within the ORLS. This allowed us to study trends in anorexia nervosa in an English population over a long period. These data are unique, in that there is no other continuous dataset in England on anorexia nervosa in a large, geographically defined population over such a long time period. Regional hospital datasets, collected by the former NHS Regional Health Authorities (RHAs), as Hospital Activity Analysis from the 1960s to late 1980s, were destroyed in the NHS reorganisation of the mid-1990s. It is very unlikely that trend data back to the 1960s, will ever be reconstructed in England, nationally; and, for the period before the 1990s, the ORLS data will remain unique. However, with electronic databases for hospital admissions in England now available and linkable, it should be possible to monitor hospital trends for anorexia nervosa nationally in future.
The study has limitations. The data only cover day cases and inpatient care. They cannot be extrapolated to anorexia nervosa in primary care or the population as a whole without caution. By analysing records based on diagnostic coding, we are able to quantify the volume of hospital care for anorexia nervosa but not the reasons for receiving care.
Further work and conclusions
These findings show not only that the rates of people admitted to hospital with anorexia nervosa increasing, but also that there has been an increase in repeat admissions of people with anorexia nervosa. Whether these data represent a rise in the prevalence of anorexia nervosa within the general population is uncertain, but they clearly show an increasing burden of anorexia nervosa on the use of secondary care. There is a need for long-term data, such as these, but enhanced with national primary care data, to help identify trends. The advent and routine use of electronic patient records should make this possible in the future.
Footnotes
Declarations
References
Supplementary Material
Please find the following supplemental material available below.
For Open Access articles published under a Creative Commons License, all supplemental material carries the same license as the article it is associated with.
For non-Open Access articles published, all supplemental material carries a non-exclusive license, and permission requests for re-use of supplemental material or any part of supplemental material shall be sent directly to the copyright owner as specified in the copyright notice associated with the article.