
Abstract
To submit a letter in response to a JRSM article, please visit http://jrsm.sagepub.com to find the article concerned, then click on the ‘Submit a comment’ link found in the Reader Responses section. Comments will automatically be submitted for consideration to be published in print.
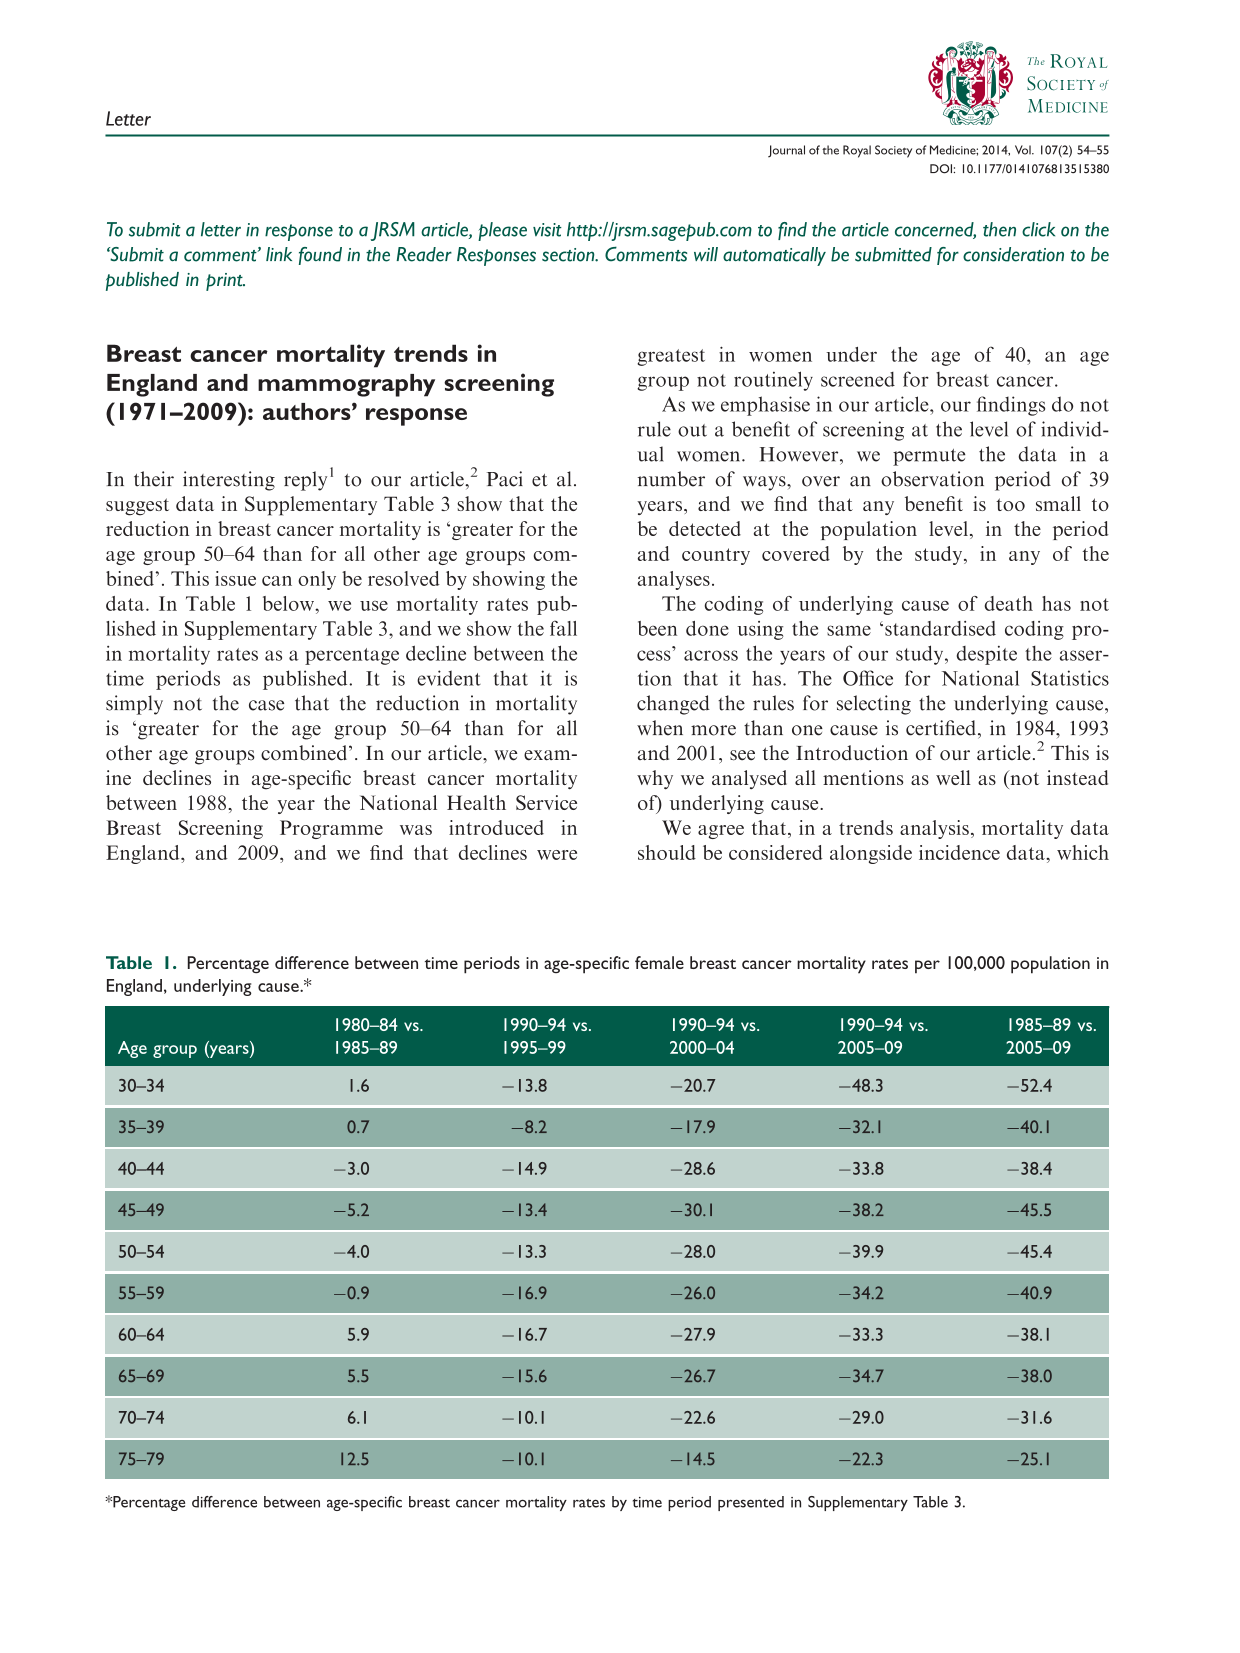
Percentage difference between time periods in age-specific female breast cancer mortality rates per 100,000 population in England, underlying cause.*
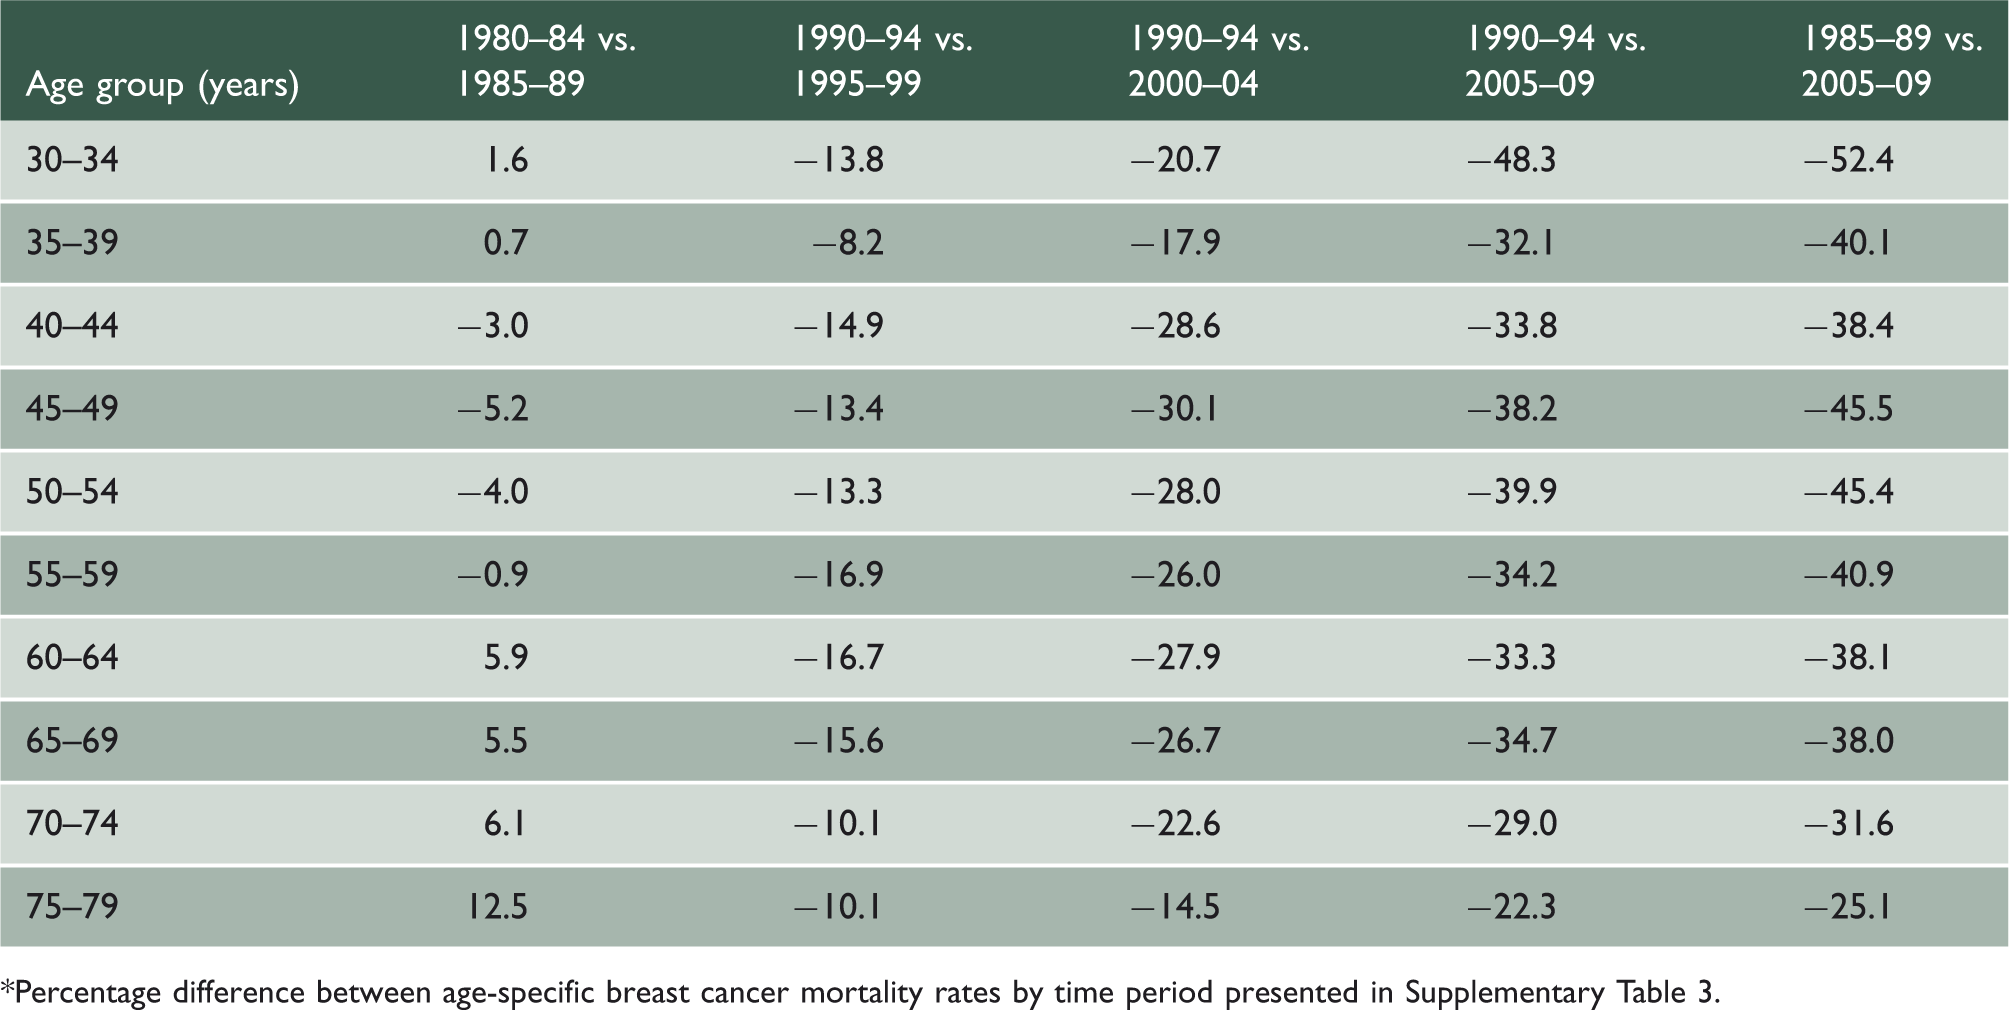
*Percentage difference between age-specific breast cancer mortality rates by time period presented in Supplementary Table 3.
As we emphasise in our article, our findings do not rule out a benefit of screening at the level of individual women. However, we permute the data in a number of ways, over an observation period of 39 years, and we find that any benefit is too small to be detected at the population level, in the period and country covered by the study, in any of the analyses.
The coding of underlying cause of death has not been done using the same ‘standardised coding process’ across the years of our study, despite the assertion that it has. The Office for National Statistics changed the rules for selecting the underlying cause, when more than one cause is certified, in 1984, 1993 and 2001, see the Introduction of our article. 2 This is why we analysed all mentions as well as (not instead of) underlying cause.
We agree that, in a trends analysis, mortality data should be considered alongside incidence data, which is why we did precisely this when comparing incidence and mortality for England in Supplementary Figure 3.