
Abstract
Objective
We aimed to quantify the relationship between national income and infant and under-five mortality in developing countries.
Design
We conducted a systematic literature search of studies that examined the relationship between income and child mortality (infant and/or under-five mortality) and meta-analysed their results.
Setting
Developing countries.
Main outcome measures
Child mortality (infant and /or under-five mortality).
Results
The systematic literature search identified 24 studies, which produced 38 estimates that examined the impact of income on the mortality rates. Using meta-analysis, we produced pooled estimates of the relationship between income and mortality. The pooled estimate of the relationship between income and infant mortality before adjusting for covariates is −0.95 (95% CI −1.34 to −0.57) and that for under-five mortality is −0.45 (95% CI −0.79 to −0.11). After adjusting for covariates, pooled estimate of the relationship between income and infant mortality is −0.33 (−0.39 to −0.26) while the estimate for under-five mortality is −0.28 (−0.37 to −0.19). If a country has an infant mortality of 50 per 1000 live births and the gross domestic product per capita purchasing power parity increases by 10%, the infant mortality will decrease to 45 per 1000 live births.
Conclusion
Income is an important determinant of child survival and this work provides a pooled estimate for the relationship.
Introduction
Rationale
Child mortality is regarded as one of the best measures of the health status of a country. 1 There have been gains over the last few years; in 2010, under-five mortality (U5M) was estimated at 7.6 million, which was a decline from 9.6 million in 2000. 2 However, it has been noted that over the last 20 years the burden of these child deaths is increasingly being concentrated in the resource poor countries of sub-Saharan Africa (SSA) and South Asia. 3 Since the seminal works of Preston in 1975 4 and Pritchett and Summers in 1996, 5 it has become established that wealthier people are healthier people as indicated by life expectancy and child mortality within countries and that higher income at country level correlates closely with better health outcomes for that country’s population. 6 However, the degree of this impact in different regions and the degree of the influence of other socioeconomic factors, including the distribution of wealth, has been the subject of an ongoing discourse in the literature. Many authors have studied the relationship between income and child mortality using econometric methods but thus far, the exact nature of the relationship is not settled.
Objectives
Our objective was to produce a pooled estimate for this relationship by systematically reviewing the literature and meta-analyzing published estimates. The importance of having a single pooled estimate, produced after systematic review and meta-analysis, is that macroeconomic indicators can be related to the impact they have on child mortality and therefore on the health status of a country. A pooled estimate will be of use to policy makers who make decisions that will influence the economy of their countries and to those who advocate for fairer global economic governance.
Methods
Search strategy and selection criteria
We conducted a structured query in Pubmed and Google Scholar for all available full-text English language studies that examined the relationship between income and infant or U5M in developing countries. We included studies that examined the mortality among children aged less than one year and less than five years. The intervention was national level income and other social determinants of health. We included studies that compared the relationship between countries or regions.
Definitions of measures of income.
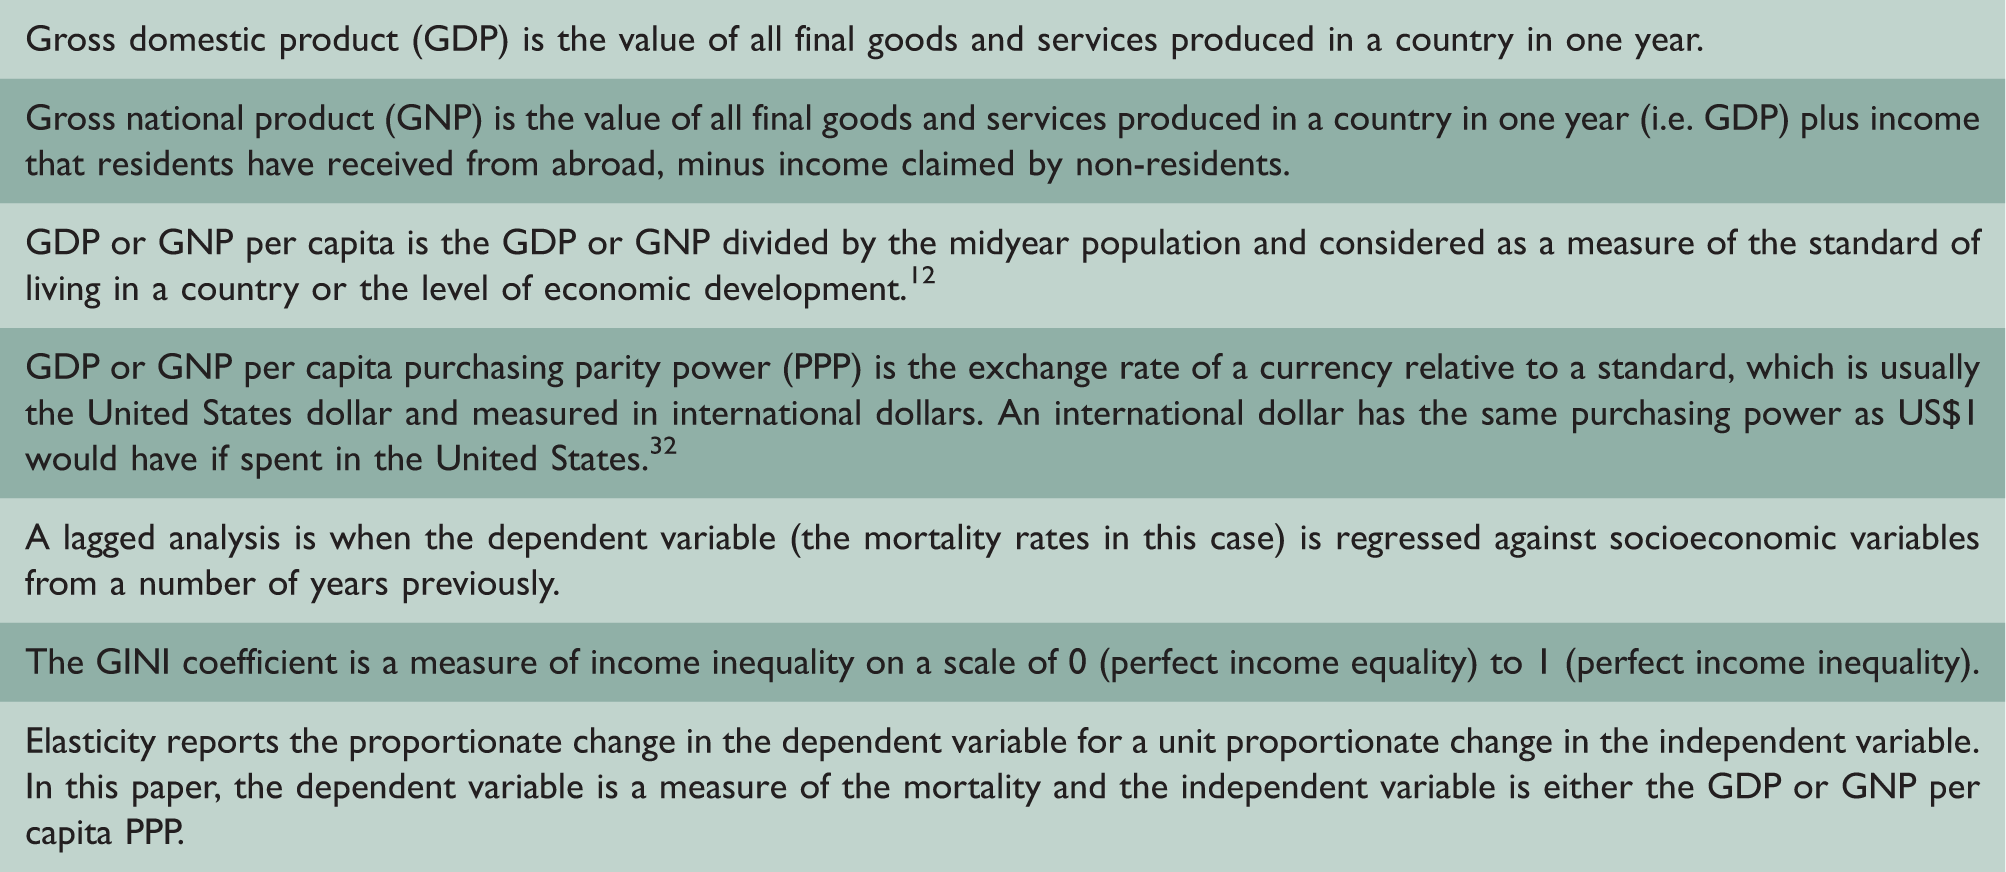
The first two authors independently read all titles and available abstracts, and excluded studies unlikely to meet the selection criteria. Articles selected by either author were kept for full article review. Both authors read the full articles and excluded those not meeting selection criteria. For all included articles, the authors recorded the primary aim of the study, the income level of the countries included in the study, the region or regions included, the years covered and the measure or measures of mortality used. The covariates adjusted for the elasticity (Box 1) and the measure of precision of this estimate were recorded. The method for controlling for reverse causation and the study design (cross cross-sectional or longitudinal) was recorded.
Meta-analysis
Summary of meta-analysis on unadjusted and adjusted elasticity.
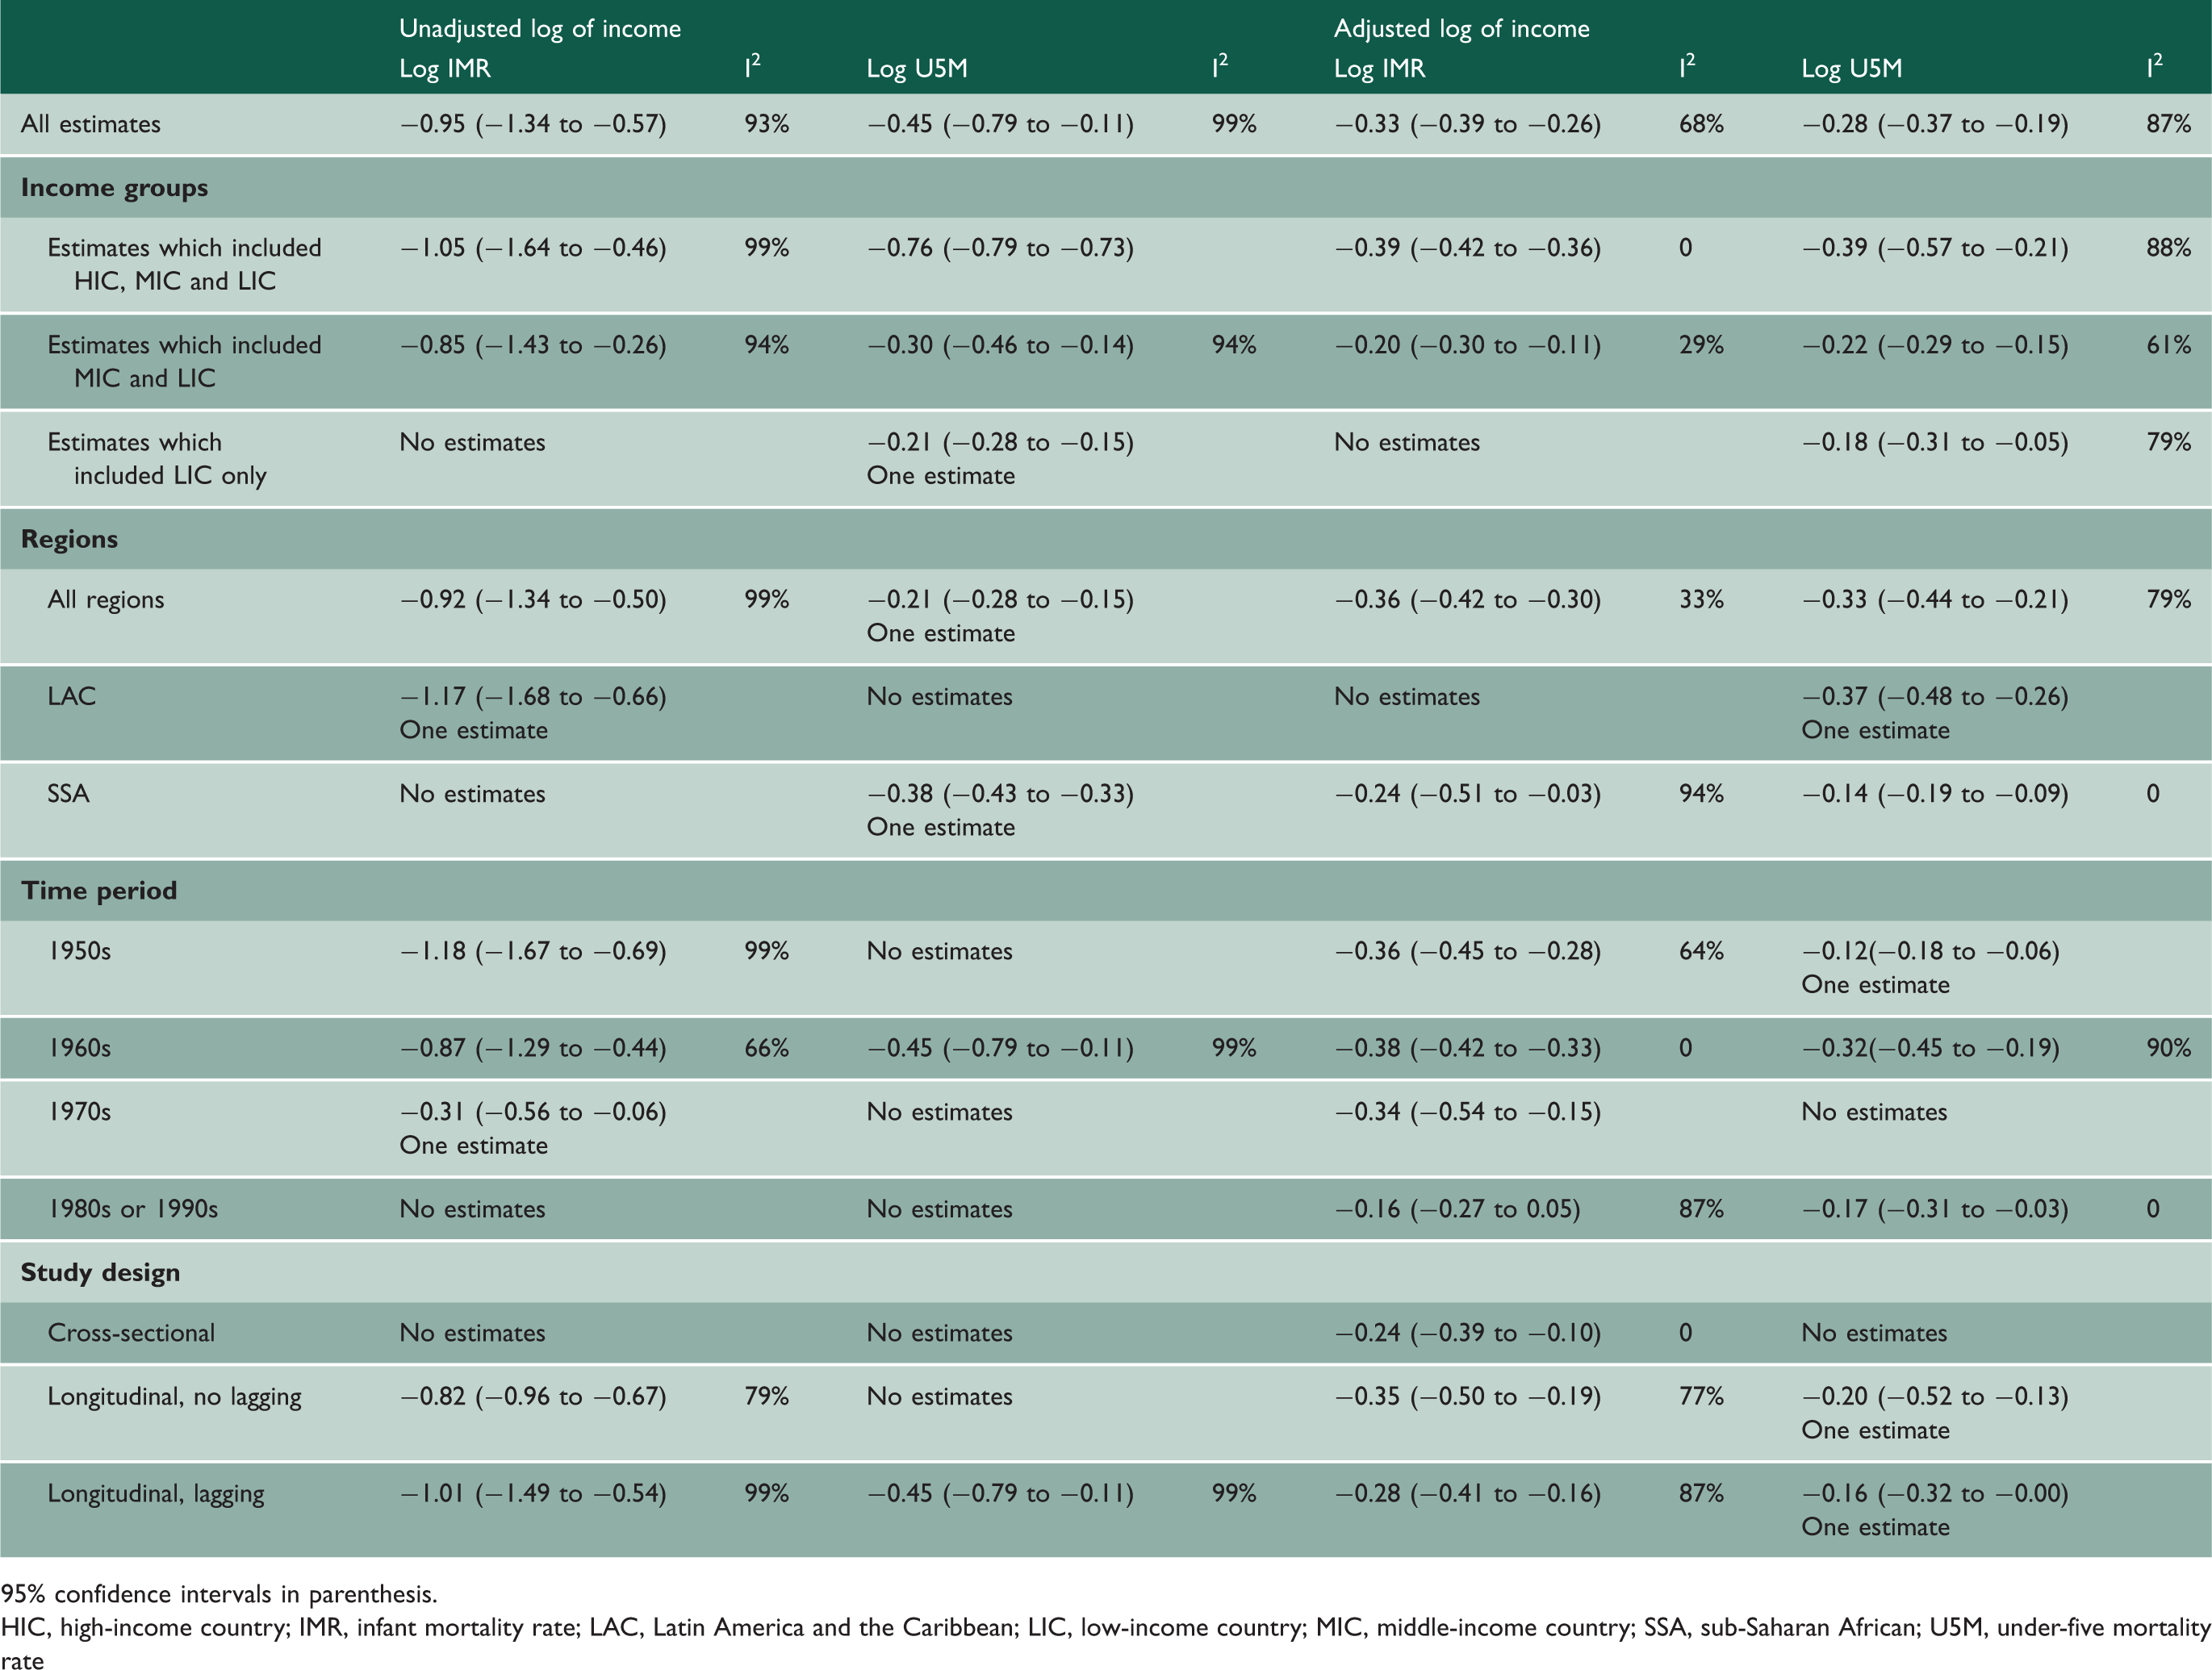
95% confidence intervals in parenthesis.
HIC, high-income country; IMR, infant mortality rate; LAC, Latin America and the Caribbean; LIC, low-income country; MIC, middle-income country; SSA, sub-Saharan African; U5M, under-five mortality rate
Results
Pubmed and Google Scholar yielded 1014 and 17,900 citations, respectively. On review of titles and abstracts, we selected 89 articles (46 Pubmed and 43 Google Scholar) for full-text review. Secondary search of these yielded a further 53 studies. After removal of duplicates, the total number of studies was 81. Of these, full-text access was freely available for 54 studies, of which 24 fulfilled the selection criteria, this process is summarized in Figure 3 (included in the online Supplemental material). A summary of the results of studies and the estimates produced by each study is in Table 6 in the online Supplemental material. A summary of the covariates adjusted for is in Table 7 (included in the online Supplemental material).
The 24 eligible studies produced 38 estimates on the relationship between income and a measure of mortality (Table 6 [included in the online Supplemental material]). Eleven estimates combined data from high-, middle- and low-income countries (HIC, MIC and LIC, respectively), 20 estimates combined data from MIC and LIC, five estimates included LIC data only, one used only MIC data and one used HIC data only. There were nine estimates of the relationship between unadjusted log transformed income and log of mortality and 23 estimates of the relationship between adjusted log transformed income and the log of mortality which could be meta-analyzed. Some studies provided both adjusted and unadjusted estimates. Most studies used log-transformed scale for both income and mortality but there were seven log linear estimates. We did not meta-analyze the log linear estimates. The income elasticity of infant and U5M was negative in all studies (see Tables 1 and 6 [included in the online Supplemental material]). The pooled elasticity of the unadjusted and adjusted estimates for the two measures of mortality, infant mortality and U5M is summarized in Table 1.
Meta-analysis on unadjusted elasticity and adjusted elasticity
There were six estimates for unadjusted income elasticity of infant mortality and the pooled estimate is −0.95 (95% CI −1.34 to −0.57) (Tables 1 and 2 [included in the online Supplemental material]). For the unadjusted income elasticity, there were five estimates for U5M and the pooled estimate is −0.45 (95% CI −0.79 to −0.11) (Tables 1 and 3 [included in the online Supplemental material]). There were 11 estimates for the adjusted income elasticity of infant mortality and the pooled elasticities for adjusted infant mortality is −0.33 (95% CI −0.39 to −0.26) (Tables 1 and 4 [included in the online Supplemental material]). Twelve estimates of income elasticity for adjusted U5M were identified and the pooled estimate is −0.28 (95% CI −0.37 to −0.19) (Tables 1 and 5 [included in the online Supplemental material]). The findings show that the pooled income elasticity estimates that are not adjusted for covariates are higher than those adjusted for covariates.
Subgroup analysis
The income elasticity estimates were analyzed by subgroups. The pooled unadjusted income elasticity estimates of infant mortality rate for HIC, MIC and LIC is −1.05 (−1.64 to −0.46) and those which include MIC and LIC is −0.85 (−1.43 to −0.26). The less negative values when HIC are excluded are reflected in all pooled estimates, both unadjusted and adjusted. Unadjusted pooled income elasticity of U5M that included all regions is lower −0.21 (−0.28 to −0.15) than those which just included estimates from SSA −0.38 (−0.43 to −0.33), but this trend is reversed in adjusted estimates. The pooled unadjusted income elasticity estimates from earlier decades is higher than later decades. Pooled estimates for adjusted elasticity remains constant in earlier decades but falls in later decades. The pooled elasticity from unadjusted estimates from studies, which used longitudinal and lagged unadjusted estimates were higher than the pooled elasticity from studies that did not use lagged data, but the adjusted estimates remain fairly constant regardless of the study design. The I2 statistic is generally high in all unadjusted estimates but zero in several of the adjusted estimates.
Discussion
Statement of principal findings
All studies reported a negative relationship between income and mortality. The pooled income elasticity from unadjusted estimates is higher than the pooled elasticities from estimates that are adjusted for covariates. The pooled elasticity for unadjusted estimates of income on infant mortality is −0.95 (95% CI −1.34 to −0.57). Therefore, if the GDP per capita PPP increases by 10% in a country where the infant mortality is 50/1000 live births, the infant mortality would be expected to decrease by 10% to 45/1000 live births.
Adjusted elasticity may be appropriate if the covariates controlled for act as confounders. However, many covariates, along the social determinants of health pathway may actually mediate the effect of upstream variables. When covariates that contribute to the same pathway are entered into the same multivariate model, the influence of the upstream covariates will be reduced relative to the downstream covariates – a phenomenon known as ‘over-adjustment’. 9 Biggs et al. did not control for midstream determinants of health, arguing correctly in our opinion, that these are mediators of the effect of national income and the elasticity from this paper is therefore higher than the other papers. 10 Bhalotra et al. found that the unadjusted elasticity between income and child mortality in India was −0.7, but controlling for government health expenditure resulted in the elasticity falling to −0.5. 11
For example, female literacy (midstream) is heavily influenced by income (upstream) and is also independent of income, associated with reduced child mortality, but female literacy also mediates the effect of income on child mortality
10
(Figure 1). If both income and female literacy are included in the same multivariate model, the relative influence of income will be reduced and this is described as over-adjustment. The influence may even be reversed, in which case it is called the Yule Simpson paradox.
Directed acyclic graph for income, female literacy and child mortality.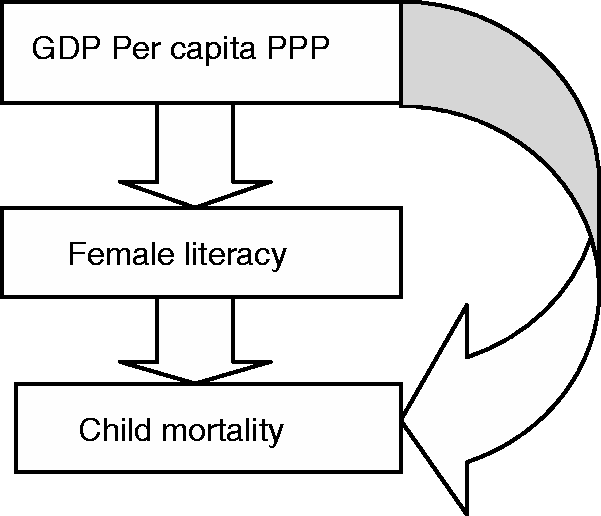
Given these considerations, we have concluded that the pooled elasticities from estimates that are unadjusted are the most accurate. The pooled elasticity of income on infant mortality is −0.95 (95% CI −1.34 to −0.57).
Subgroup analysis
The pooled adjusted and unadjusted elasticities are less negative when just MIC and LIC are included. However, the unadjusted pooled elasticities are generally more negative for poorer regions (Latin America and the Caribbean [LAC] and SSA that include MIC and LIC) while the adjusted elasticities are less negative in these regions. As discussed, adjusting for covariates that contribute to the same pathway will dilute the effect of income and dampen the differences between the subgroups and in our opinion are less valid. The observation that pooled unadjusted elasticities are less negative for estimates which include just MIC and LIC but more negative for regions which include MIC and LIC could suggest a hypothesis that the income mortality relationship is weaker at very low income levels, stronger at middle-income levels and disassociates at high-income levels. The I2 statistic is generally high in all unadjusted estimates, which indicates that the variation across these estimates is due to heterogeneity. There is less heterogeneity among the adjusted estimates.
In 1975, Preston suggested that the relationship between income and life expectancy may be weaker at very low levels of income but had insufficient data points to confirm this, and his famous curve does not suggest such a relationship;
12
there are now ample data on LIC. It is also known that when countries have reached a high level of development, further increases in terms of income has little impact on child mortality
9
or that mortality becomes increasingly disassociated from income per capita.
12
Larger increases in income may be required to reduce child mortality in LIC. In preference to the Preston curve,
4
we propose conceptualizing the relationship between income and child mortality as a sigmoid curve with LIC on the flat part of the curve, MIC on the steep part and HIC on the plateau (Figure 2). For low-income countries, the contribution of income to reduced infant mortality is because of low investments in supporting services (midstream variables). In order to appreciate this, consider a country with very limited road infrastructure or low literacy levels, where a larger increase in GDP per capita will be required to impact the child mortality than will be required in a country with some road infrastructure or some level of literacy.
A possible framework for the relationship between income and child mortality.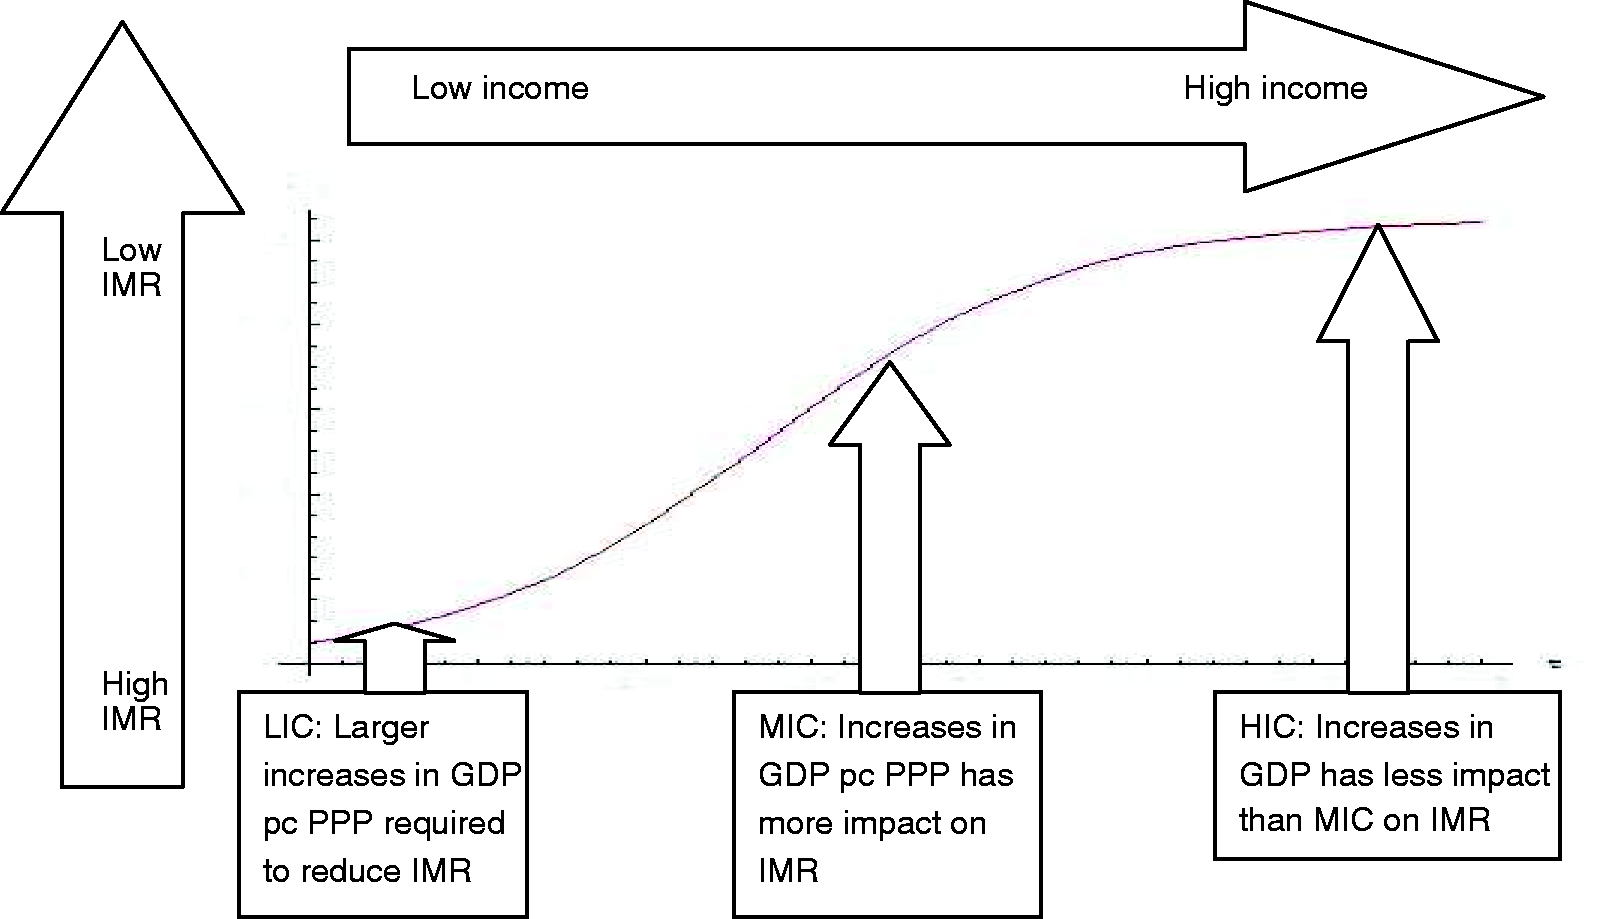
Strengths and weakness of the study
Studies used different data sources, different measures of income and adjusted for disparate covariates or similar covariates but measured differently (Table 7 [included in the online Supplemental material]). The use of meta-analysis in the face of such marked heterogeneity is challenging, even when using a random effects model. However, for our main finding, we used unadjusted elasticities and the use of a wide variety of covariates will not influence this result.
The differences between the pooled estimates of unadjusted and adjusted estimates highlights the importance of carefully considering the causal pathways under investigation when studying the impact of income on child mortality. Our subgroup analysis raises questions about the sources of heterogeneity between regions and income groups and the influence of income at LIC, MIC and HIC level.
To the best of our knowledge, this is the first time that the econometric literature on the relationship between income and child mortality has been systematically reviewed and meta-analyzed.
Implications for policymakers and future research
There is an inverse and significant relationship between income and child mortality. The pooled elasticity for those estimates, which are unadjusted for downstream covariates, or mediators, is −0.95 for infant mortality. If the IMR is 50/1000 and the GDP increases by 10%, we can expect the IMR to decrease to 45/1000.
Health policymakers often emphasize downstream interventions without considering the upstream determinants of health. We would appeal that socioeconomic determinants of health are considered alongside improving the coverage and availability of those downstream interventions, which have proven effectiveness. In order to reduce child mortality, upstream as well as downstream interventions will be required.
This work confirms the importance of income for child health and provides a pooled estimate for the relationship. Further analyses at regional and country level, with adequate consideration of confounding factors, uniformity of methods and thorough consideration of causality are important. It may be that there is differential impact of income on different causes of death, for example, diseases which are sensitive to nutrition may be more influenced by income. 13 This review provides an estimate of the pooled elasticity of income for all-cause mortality only; however, as cause of death data becomes more widely available, more detailed studies may become possible.
Footnotes
Declarations
References
Supplementary Material
Please find the following supplemental material available below.
For Open Access articles published under a Creative Commons License, all supplemental material carries the same license as the article it is associated with.
For non-Open Access articles published, all supplemental material carries a non-exclusive license, and permission requests for re-use of supplemental material or any part of supplemental material shall be sent directly to the copyright owner as specified in the copyright notice associated with the article.