
Abstract
Objective
To estimate the average cost per quality adjusted life year (QALY) gained from hip surgery, and to examine the variation in that between hospitals.
Design
The transformation of patient-reported outcome measures (EQ-5D data) into QALYs, covering 25,463 NHS patient episodes between April 2009 and August 2010 from hospitals in England, using a model of future health change arising from a hip operation compared to a counterfactual of no operation. Hospital-level costs for hip procedures from the National Reference Costs data-set was used to calculate the hospitals' cost per QALY.
Setting
English hospitals treating NHS-funded patients undergoing hip replacement.
Participants
NHS-funded patients undergoing primary hip replacement.
Main outcome measure
Cost per QALY.
Results
Assuming some degradation in patients’ health over the lifetime of the hip prosthesis, average health gain arising from a hip operation was 2.77 QALYs. For procedures paid for by the NHS but carried out in the independent sector the average gain was 2.97 QALYs. Average NHS hospital hip procedure costs were estimated to be £5844. The unweighted average cost per QALY for NHS hospitals was £2128. There were significant variations in cost per QALY between hospitals; most of this variation appears to be driven by variations in cost, not QALYs.
Conclusions
Using the new patient-assessed health-related quality of life data combined with routine hospital-level cost data it is possible to estimate a procedure-based measure of efficiency for hospitals. The fact that variations in cost per QALY are strongly driven by variations in cost suggests that further work is needed to investigate the causes of cost variations per se – especially the quality of routine NHS cost data.
Keywords
Introduction
From April 2009, the English NHS started routine collection of pre- and postoperative data of patients’ own assessments of their health-related quality of life for four surgical procedures: hip and knee replacements, hernia and varicose vein repair. 1 Known as patient-reported outcome measures (PROMs) and using established survey instruments, these efforts are unique internationally and have enormous potential for the management of patient care and the facilitation of informed patient choice, through to more effective management and monitoring of resource use in the NHS. 2
In combination with data on the costs of provision, PROMs information can be used to provide estimates of hospitals’ comparative cost-effectiveness of the provision of surgery. In particular, given the instruments used to collect patient-reported outcomes, it is possible to estimate individual hospital-level cost per quality-adjusted life year (QALY) ratios. The aim of this paper is to demonstrate this with respect to one of the surgical procedures for which PROMs data are available: hip replacement.
Using both the pre- and postoperative PROMs data covering the period April 2009 to August 2010, 3 this paper describes a simple model used to generate estimates of the average cost per QALY gained from hip replacement surgery, by hospital. We first describe the model and detail the cost and effect data before reporting results.
Methods
Data
The instruments used to collect PROMs for hip surgery for NHS patients in England include the generic health-related quality of life measure – the EQ-5D 4 – which patients undergoing elective treatment are invited to complete before and six months after their hip operation. Over the first full year in which the data were reported, April 2009–April 2010, there were 68,676 eligible hip replacement patient episodes for which 45,978 preoperative PROMs questionnaires were returned. Of the 25,559 postoperative questionnaires sent out, 18,962 were returned and of these, 16,843 had a valid completion for the EQ-5D measure such that a pre- and postsurgery EQ-5D index could be calculated. Of these, 14,252 were included in the pre- and postoperative data-set published by the Department of Health for April 2009–April 2010. 3
Our analysis uses data for this period plus an additional four months, up to August 2010. This provides a data-set of 26,378 patients with full pre- and postoperative data. The data release on this measure reports raw averages across patients for hospitals together with a casemix-adjusted postoperative figure. The casemix-adjusted change in the index reported in the official PROMs data-set is the difference between each hospital’s casemix-adjusted postoperative score and the preoperative national average score (for hip surgery, this is 0.349). We use this change in score to model the change in average QALYs for hospitals because it is important to adjust for the different casemix treated by each hospital. Results based on unadjusted scores are not reported here. The casemix adjustment methodology is described in great detail in a Department of Health publication. 5 For our purposes we rely on this methodology to reasonably adjust the EQ-5D data for patient characteristics to enable inter-hospital comparisons to be made.
In terms of the coverage of the EQ-5D data used, there were a total of 162 hospitals (24 non-NHS) and 25,463 individual patient records (2566 from non-NHS hospitals). A total of 55 hospitals and 915 patients were excluded from the analysis due to the reporting policy of the Department of Health whereby data are suppressed for confidentiality reasons where there are fewer than five returns per hospital, and hospitals with fewer than 30 returns are excluded from the casemix adjustment for statistical reasons.
Data on each (NHS) hospital’s costs for hip replacement surgery were extracted from an appendix to the 2009/2010 National Reference Cost (NRC) data-set. 6 NHS hospitals submit data for the NRC on their average costs based on the healthcare resource group (HRG) classification. The group of HRGs making up the hip replacement procedures covered by the PROMs collection (which is based on the Office of Population Censuses and Surveys (OPCS) operation codes) is listed in Appendix 1. We derived a single weighted average cost for these HRGs for each hospital based on the volumes of activity and cost for each individual HRG. Unit costs ranged from £1650 to £13,350, with a mean of £5844 and a standard deviation of £1430 for the hospitals reporting PROMs data in the casemix-adjusted set. Over 90% of providers reported unit costs between £4000 and £8000. One hospital was excluded from the analysis due to unfeasibly low costs, a probable indication of data quality issues with this hospital’s data returns.
Because there are no cost data reported publicly by non-NHS hospitals, we used a figure of £5528 calculated as the weighted average of the 2010/2011 NHS tariff prices for the HRGs covered by the PROMs initiative7,8 (see Appendix 2 for details). From an NHS point of view it is this ‘cost’, or rather price, which NHS commissioners pay independent hospitals for carrying out hip replacement operations on NHS patients. As such, the cost/price per QALY we obtain for non-NHS hospitals needs to be interpreted somewhat differently from the cost per QALY for NHS hospitals; the latter represents a measure of provider productivity, whereas the former can be viewed as the commissioner value of its purchase from the (non-NHS) provider.
Modelling QALY change
In order to produce estimates of the average per patient change in QALYs for each hospital we assumed a 15-year life for hip replacements on the basis of current knowledge for revision times (cf.9,10) and two alternative future health paths; one in which health remained constant at the postoperative level, and one in which it degraded evenly over 15 years back to the preoperative level (as recorded by the EQ-5D index). The counterfactual health state assumed no operation and, very conservatively, no degradation in health.
Figure 1 shows a stylized representation of the course of future average EQ-5D index scores for a hospital under assumptions of no degradation and degradation in health. The area Q1 represents the average change in QALYs compared with no operation and assuming patients’ health degrades over time after their operation. The areas Q1 + Q2 represent the average QALY change compared with no operation and assuming no degradation in health. Area Q2 is the difference in QALY change (with an operation) between degradation and no degradation in health.
Modelling QALYs from EQ-5D index data. Note: In this model we discount the EQ-5D index values rather than the resultant QALYs. However, discounting QALYs would produce the same results.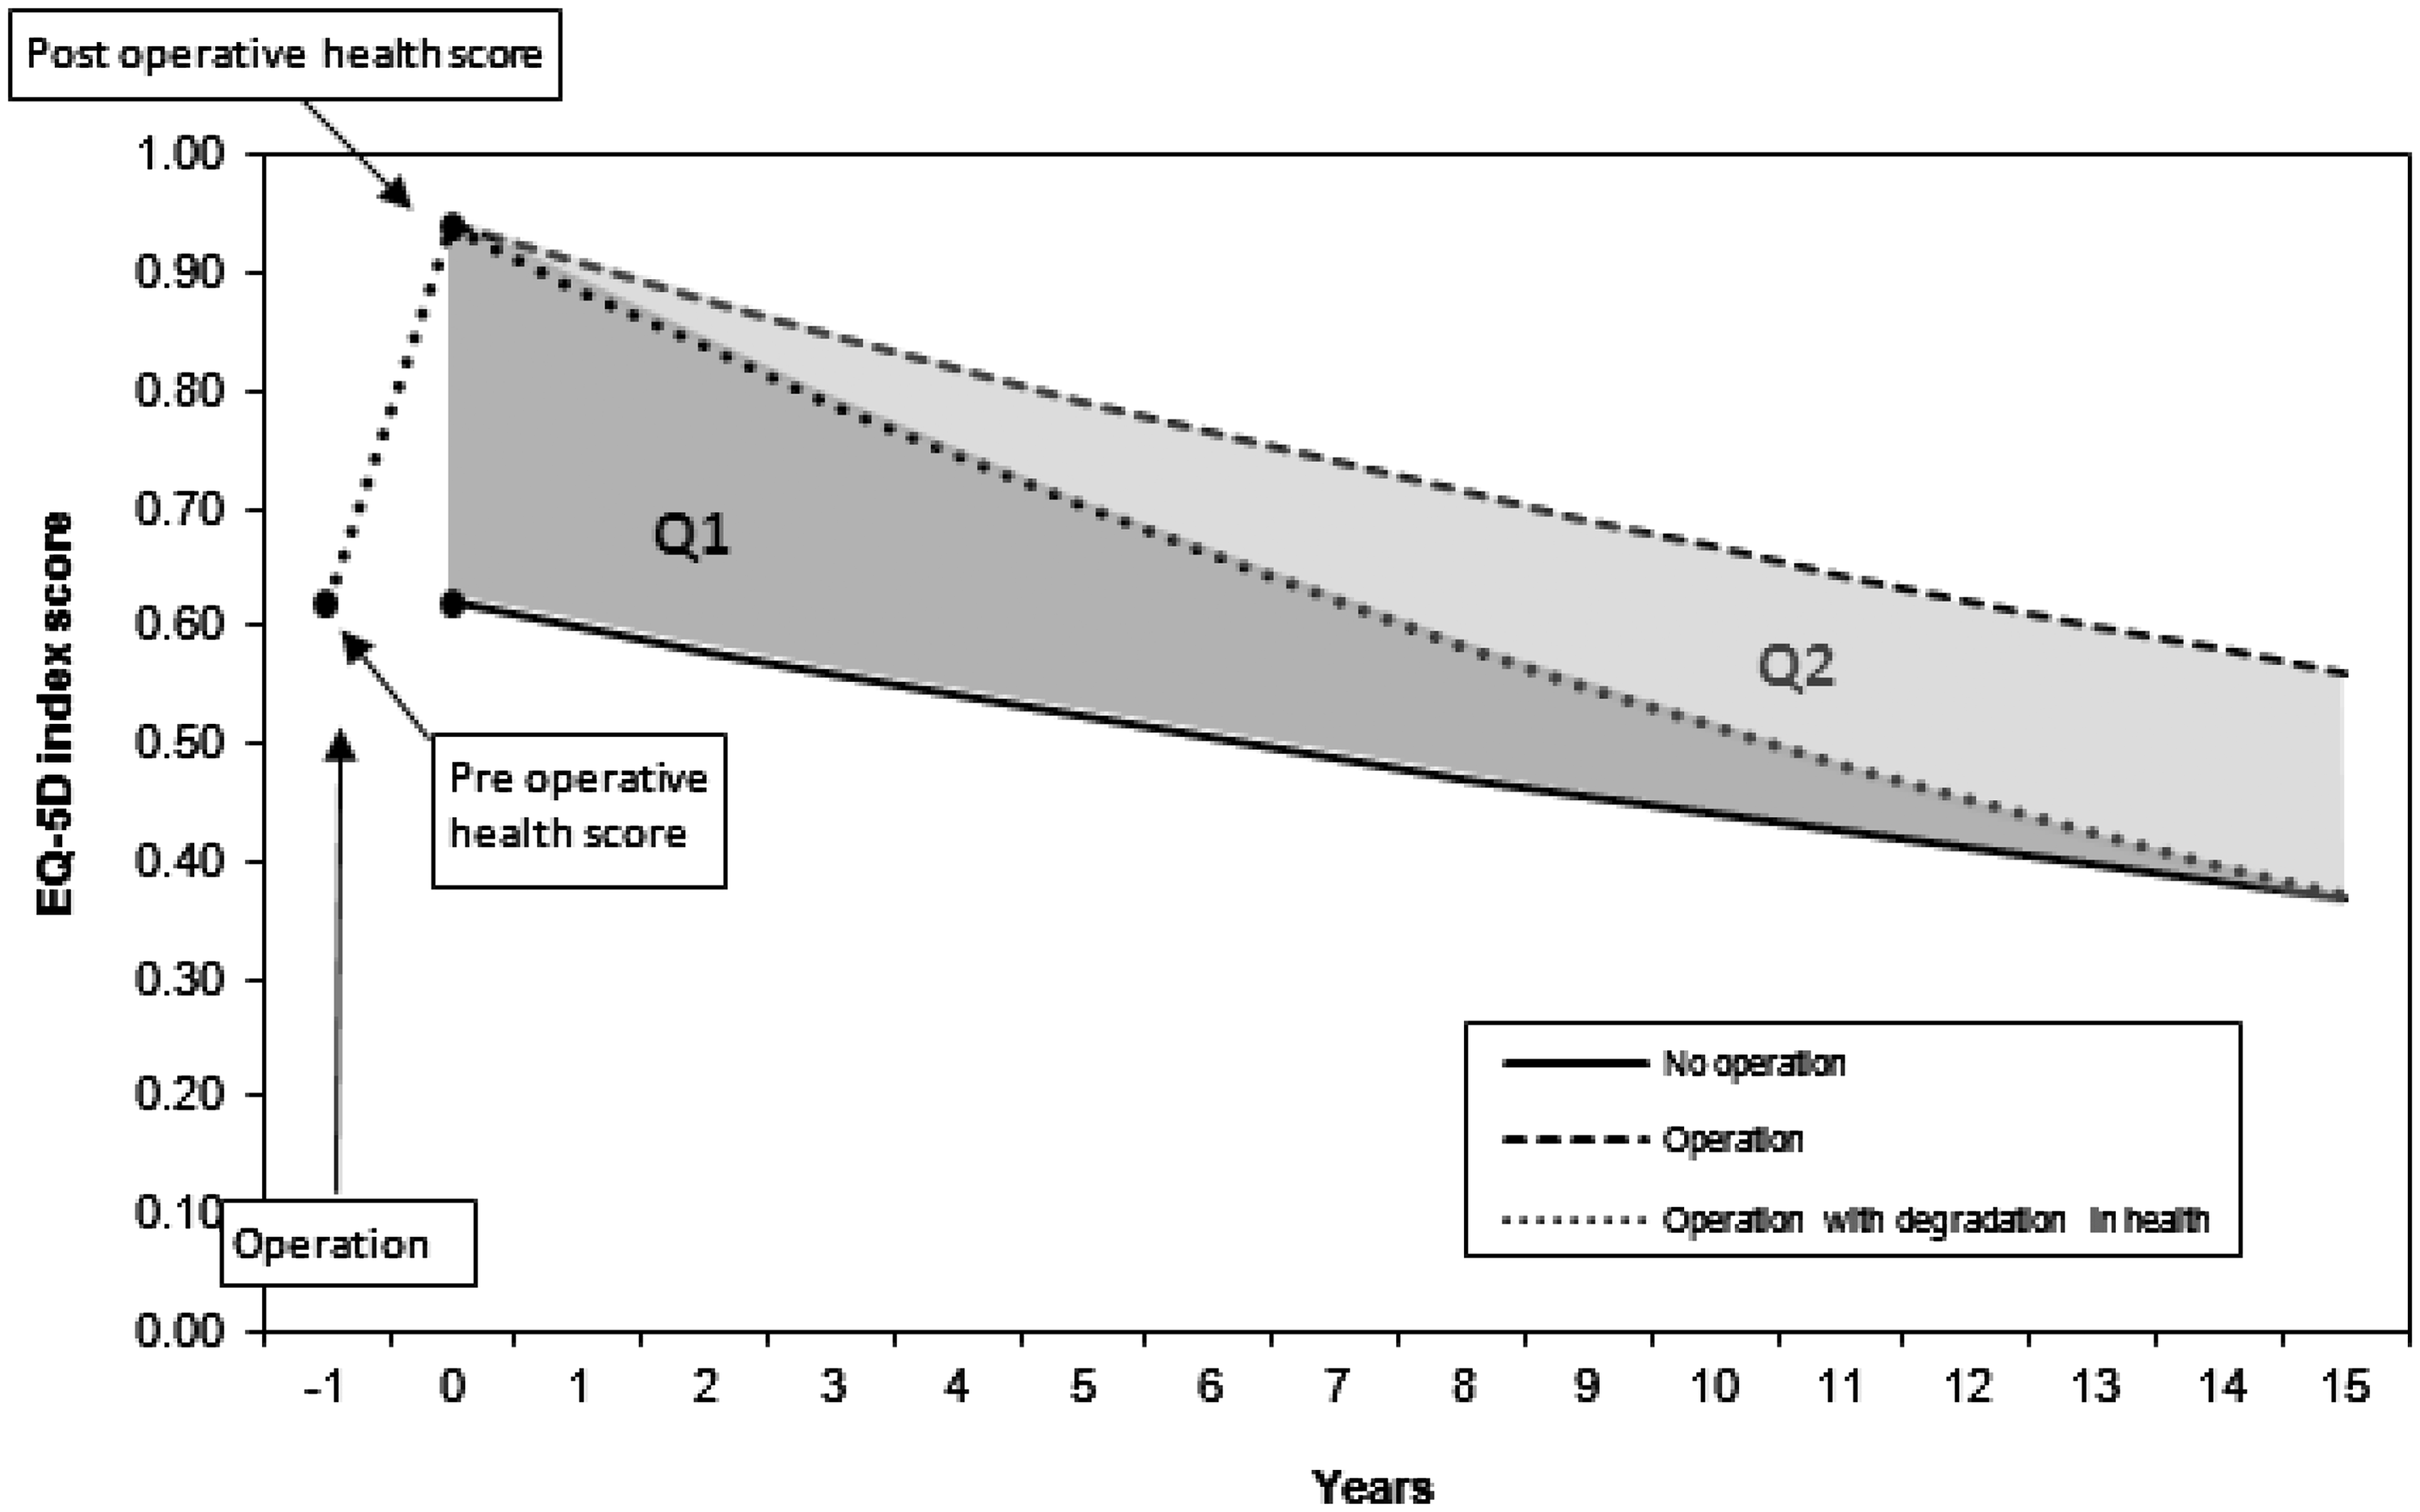
The value of future benefits (health states) in all cases is assumed to decline at a rate of 3.5% per annum – a figure recommended by HM Treasury in its guidance on economic evaluation 11 on the assumption that future benefits are valued by society at a decreasing rate over time.
Using the casemix-adjusted postoperative EQ-5D index score, the casemix-adjusted change in the index and a derived preoperative score we can calculate change in QALYs for each hospital under the assumptions of our QALY model. Given the casemix adjustment method, the derived preoperative score is the same for all hospitals. It is the casemix-adjusted postoperative EQ-5D index minus the casemix-adjusted change in the index. In effect, our simple QALY model generates a constant (=12.52) with which to multiply the changes in the EQ-5D index score in order to convert index scores into QALYs. The figure is constant because each patient is assumed to receive the same lifetime QALY gain for a given postoperative health score change.
The cost per QALY for each hospital is then simply a division of each hospital’s weighted unit costs (derived from the NRC data-set) by the change in QALYs for that hospital.
Results
Change in QALYs
Mean change in QALYs following a hip replacement.
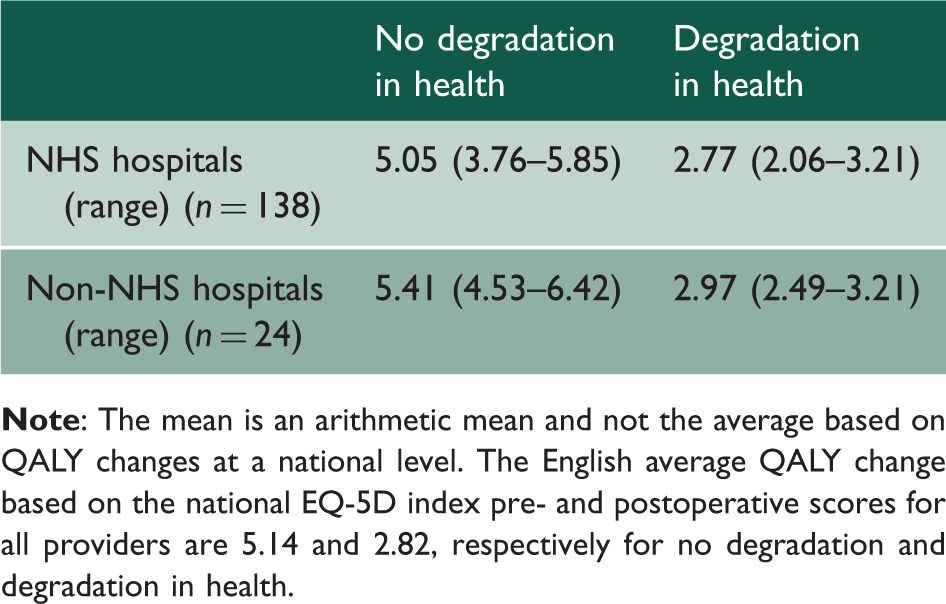
There is a statistically insignificant difference in average QALY gains between NHS trusts and non-NHS hospitals in favour of the latter.
Figure 2 shows that there were gains in QALYs (on average, across patients) for all hospitals (NHS and independent) in the casemix-adjusted set (and under our assumption of degrading health). While the vast majority of hospitals have QALY gains which lie within ±2 standard deviations of the national mean, two (both independent sector organizations) were between +2 and +3 standard deviations, and just one (an NHS trust) between −2 and −3 standard deviations. This compares with analysis carried out as part of a consultation on PROMs outlier policy by the Department of Health (and using an additional five months data – from August 2010 to December 2010) of three organizations greater than +3 standard deviations and eight more than −3 standard deviations from the national mean on values of health gain (changes in the EQ-5D index) from hip operations.
12
Hip replacement: Funnel plot: Change in QALYs. Note: Data casemix adjusted. Assumes degradation in health.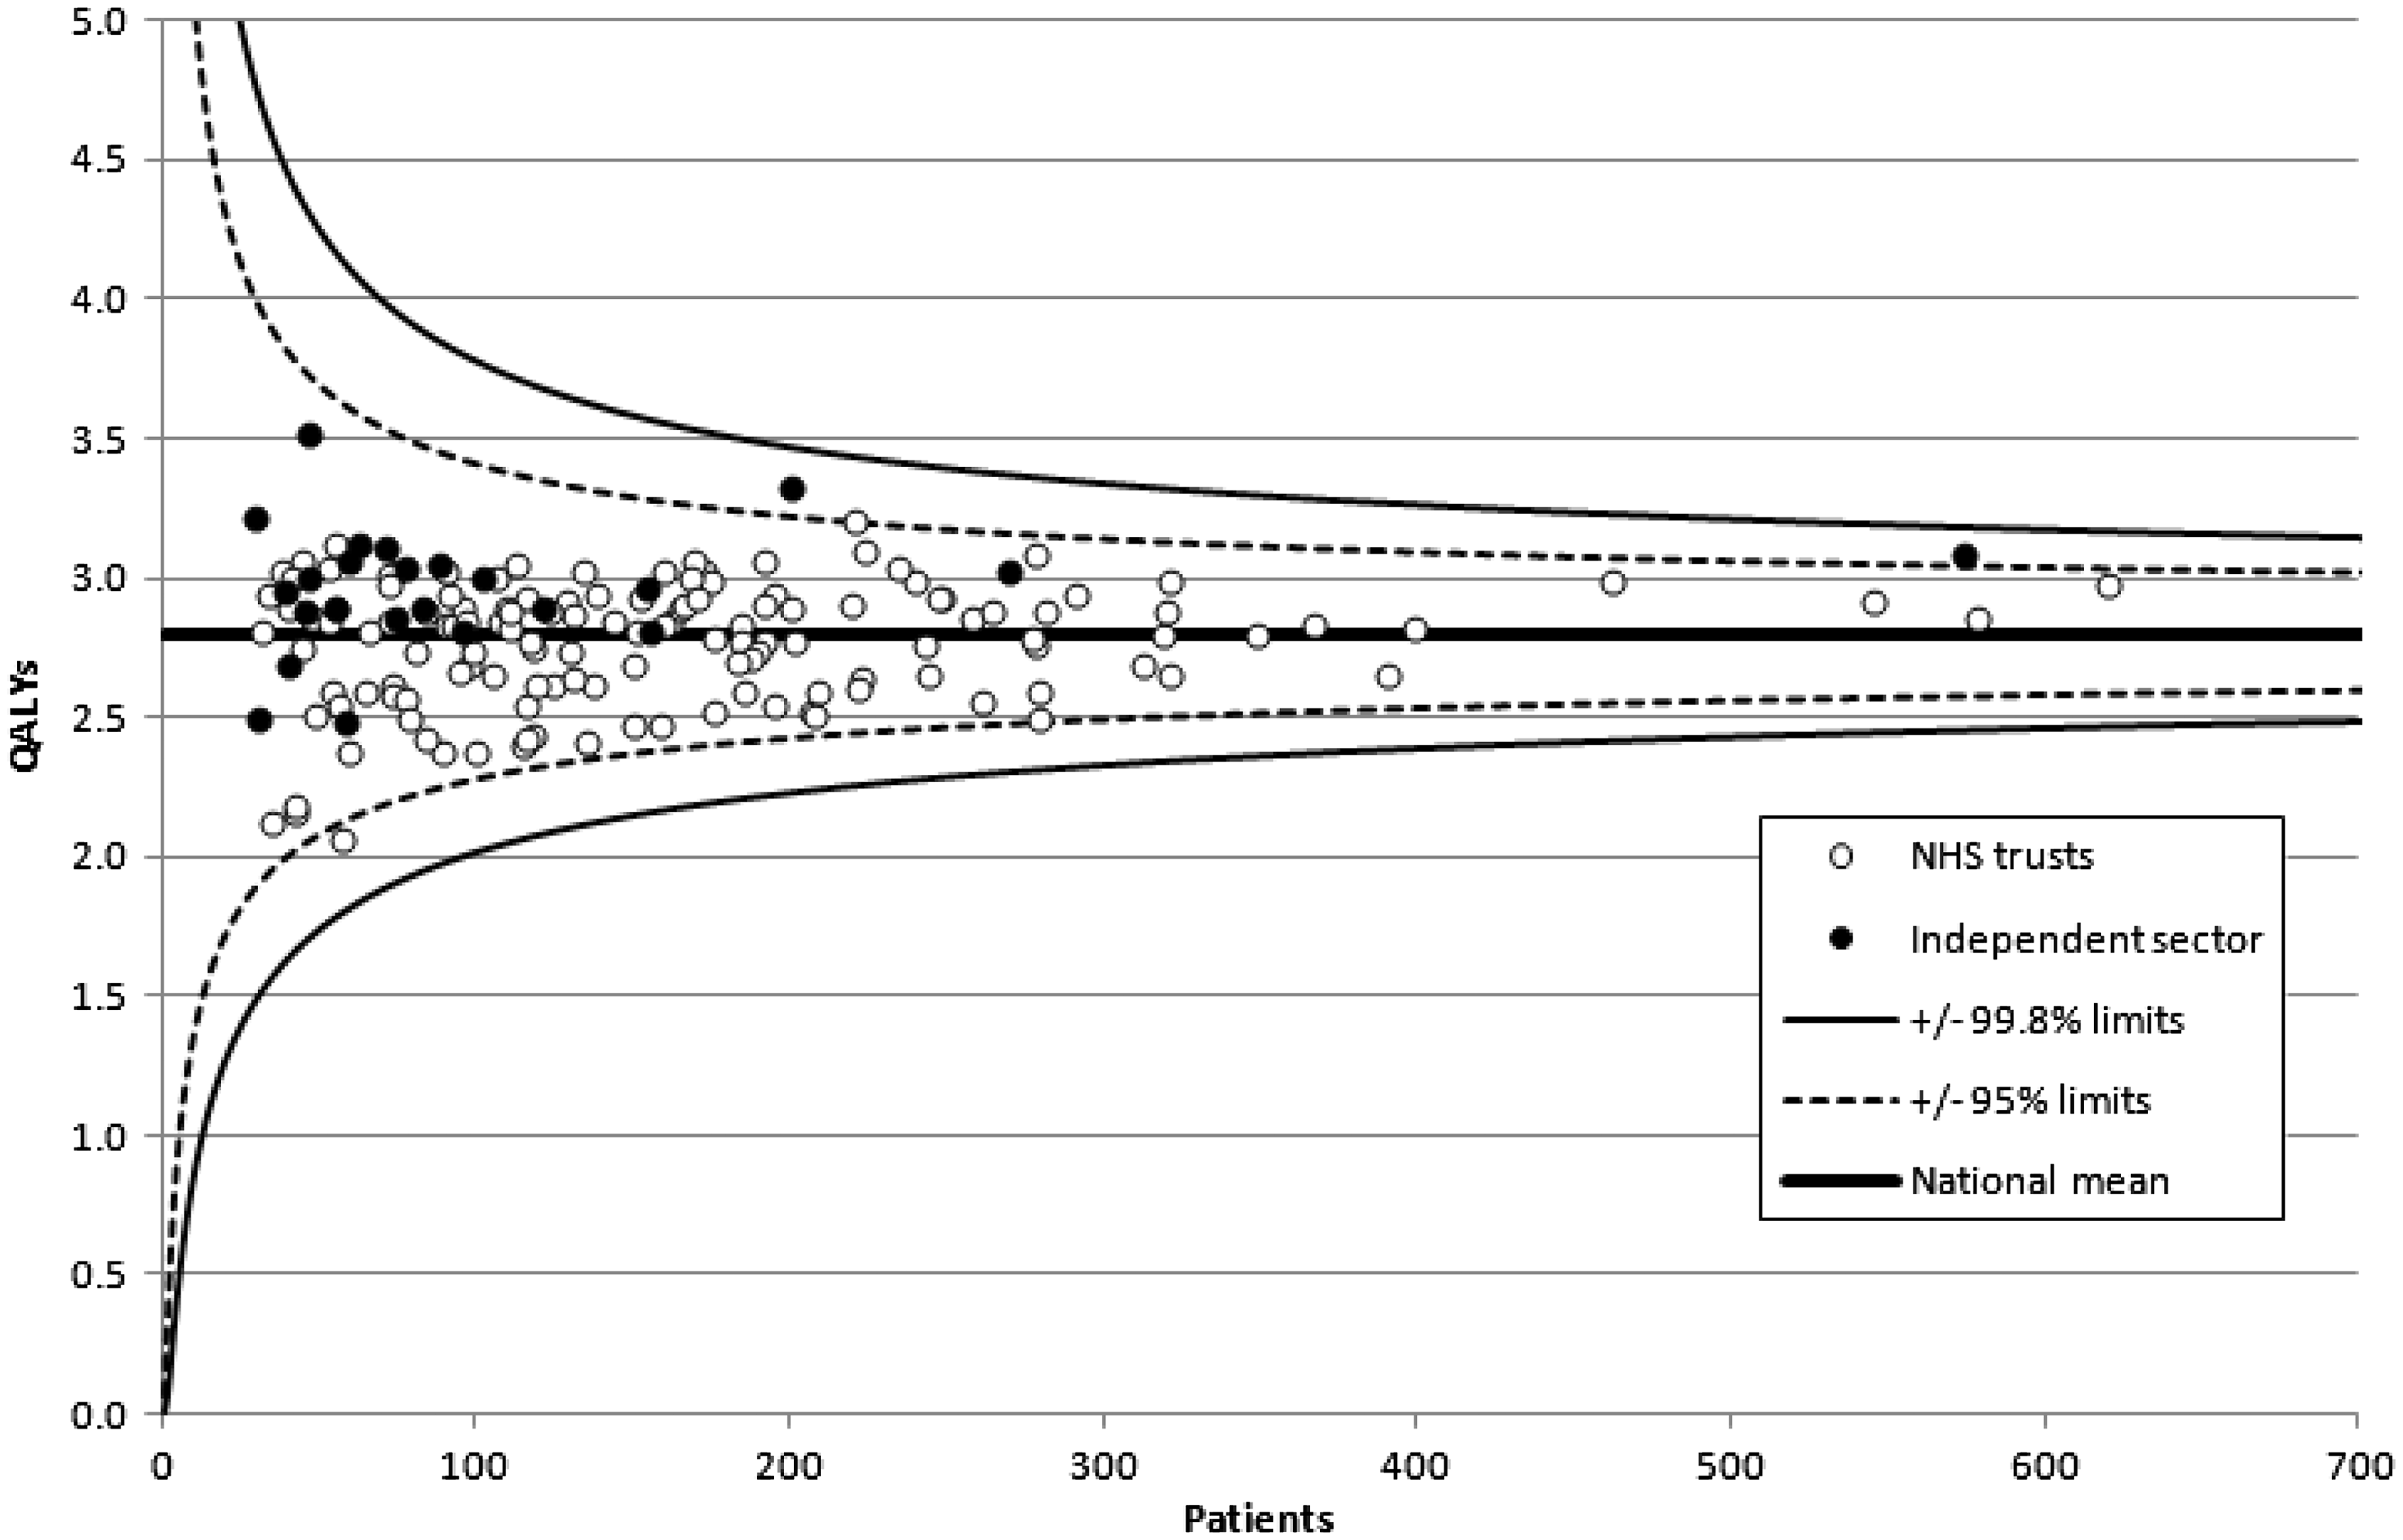
Cost per QALY
Cost per QALY following a hip replacement.
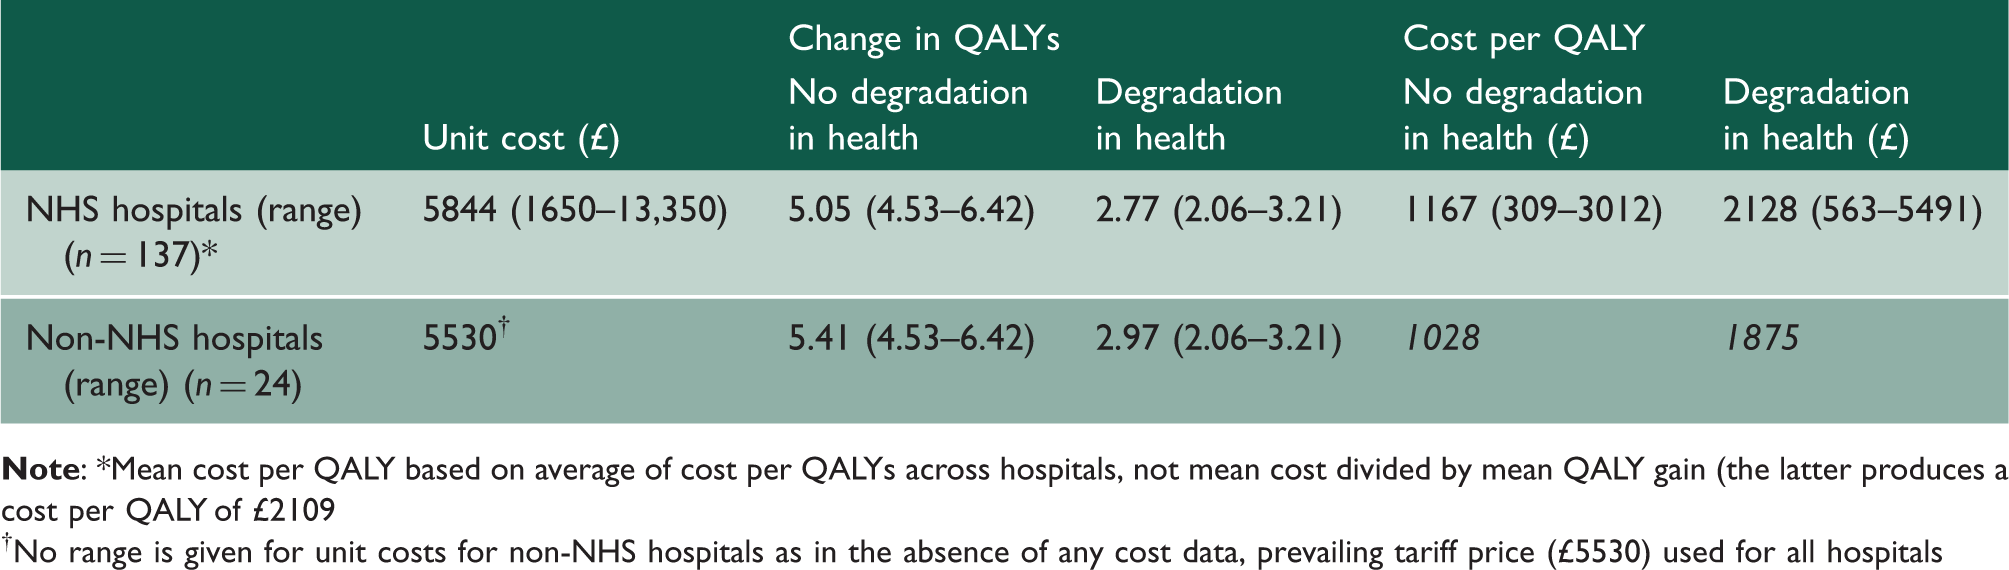
No range is given for unit costs for non-NHS hospitals as in the absence of any cost data, prevailing tariff price (£5530) used for all hospitals
Average costs per QALY for NHS hospitals range from around £1200 to £2100 depending on assumptions about future degradation in patients’ health. At the extremes there is a wide variation in cost per QALY; around nine- to ten-fold. This variation can be seen in Figure 3 which also shows the cost-effectiveness plane for the casemix-adjusted data, with and without assumptions about degradation in patients’ health. Rays from the origin show various levels of cost per QALY, with the National Institute for Health and Clinical Excellence (NICE) cost-effectiveness threshold values lying between £20,000 and £30,000 per QALY.
13
Hip replacements: Cost-effectiveness plane. Note: Data casemix adjusted.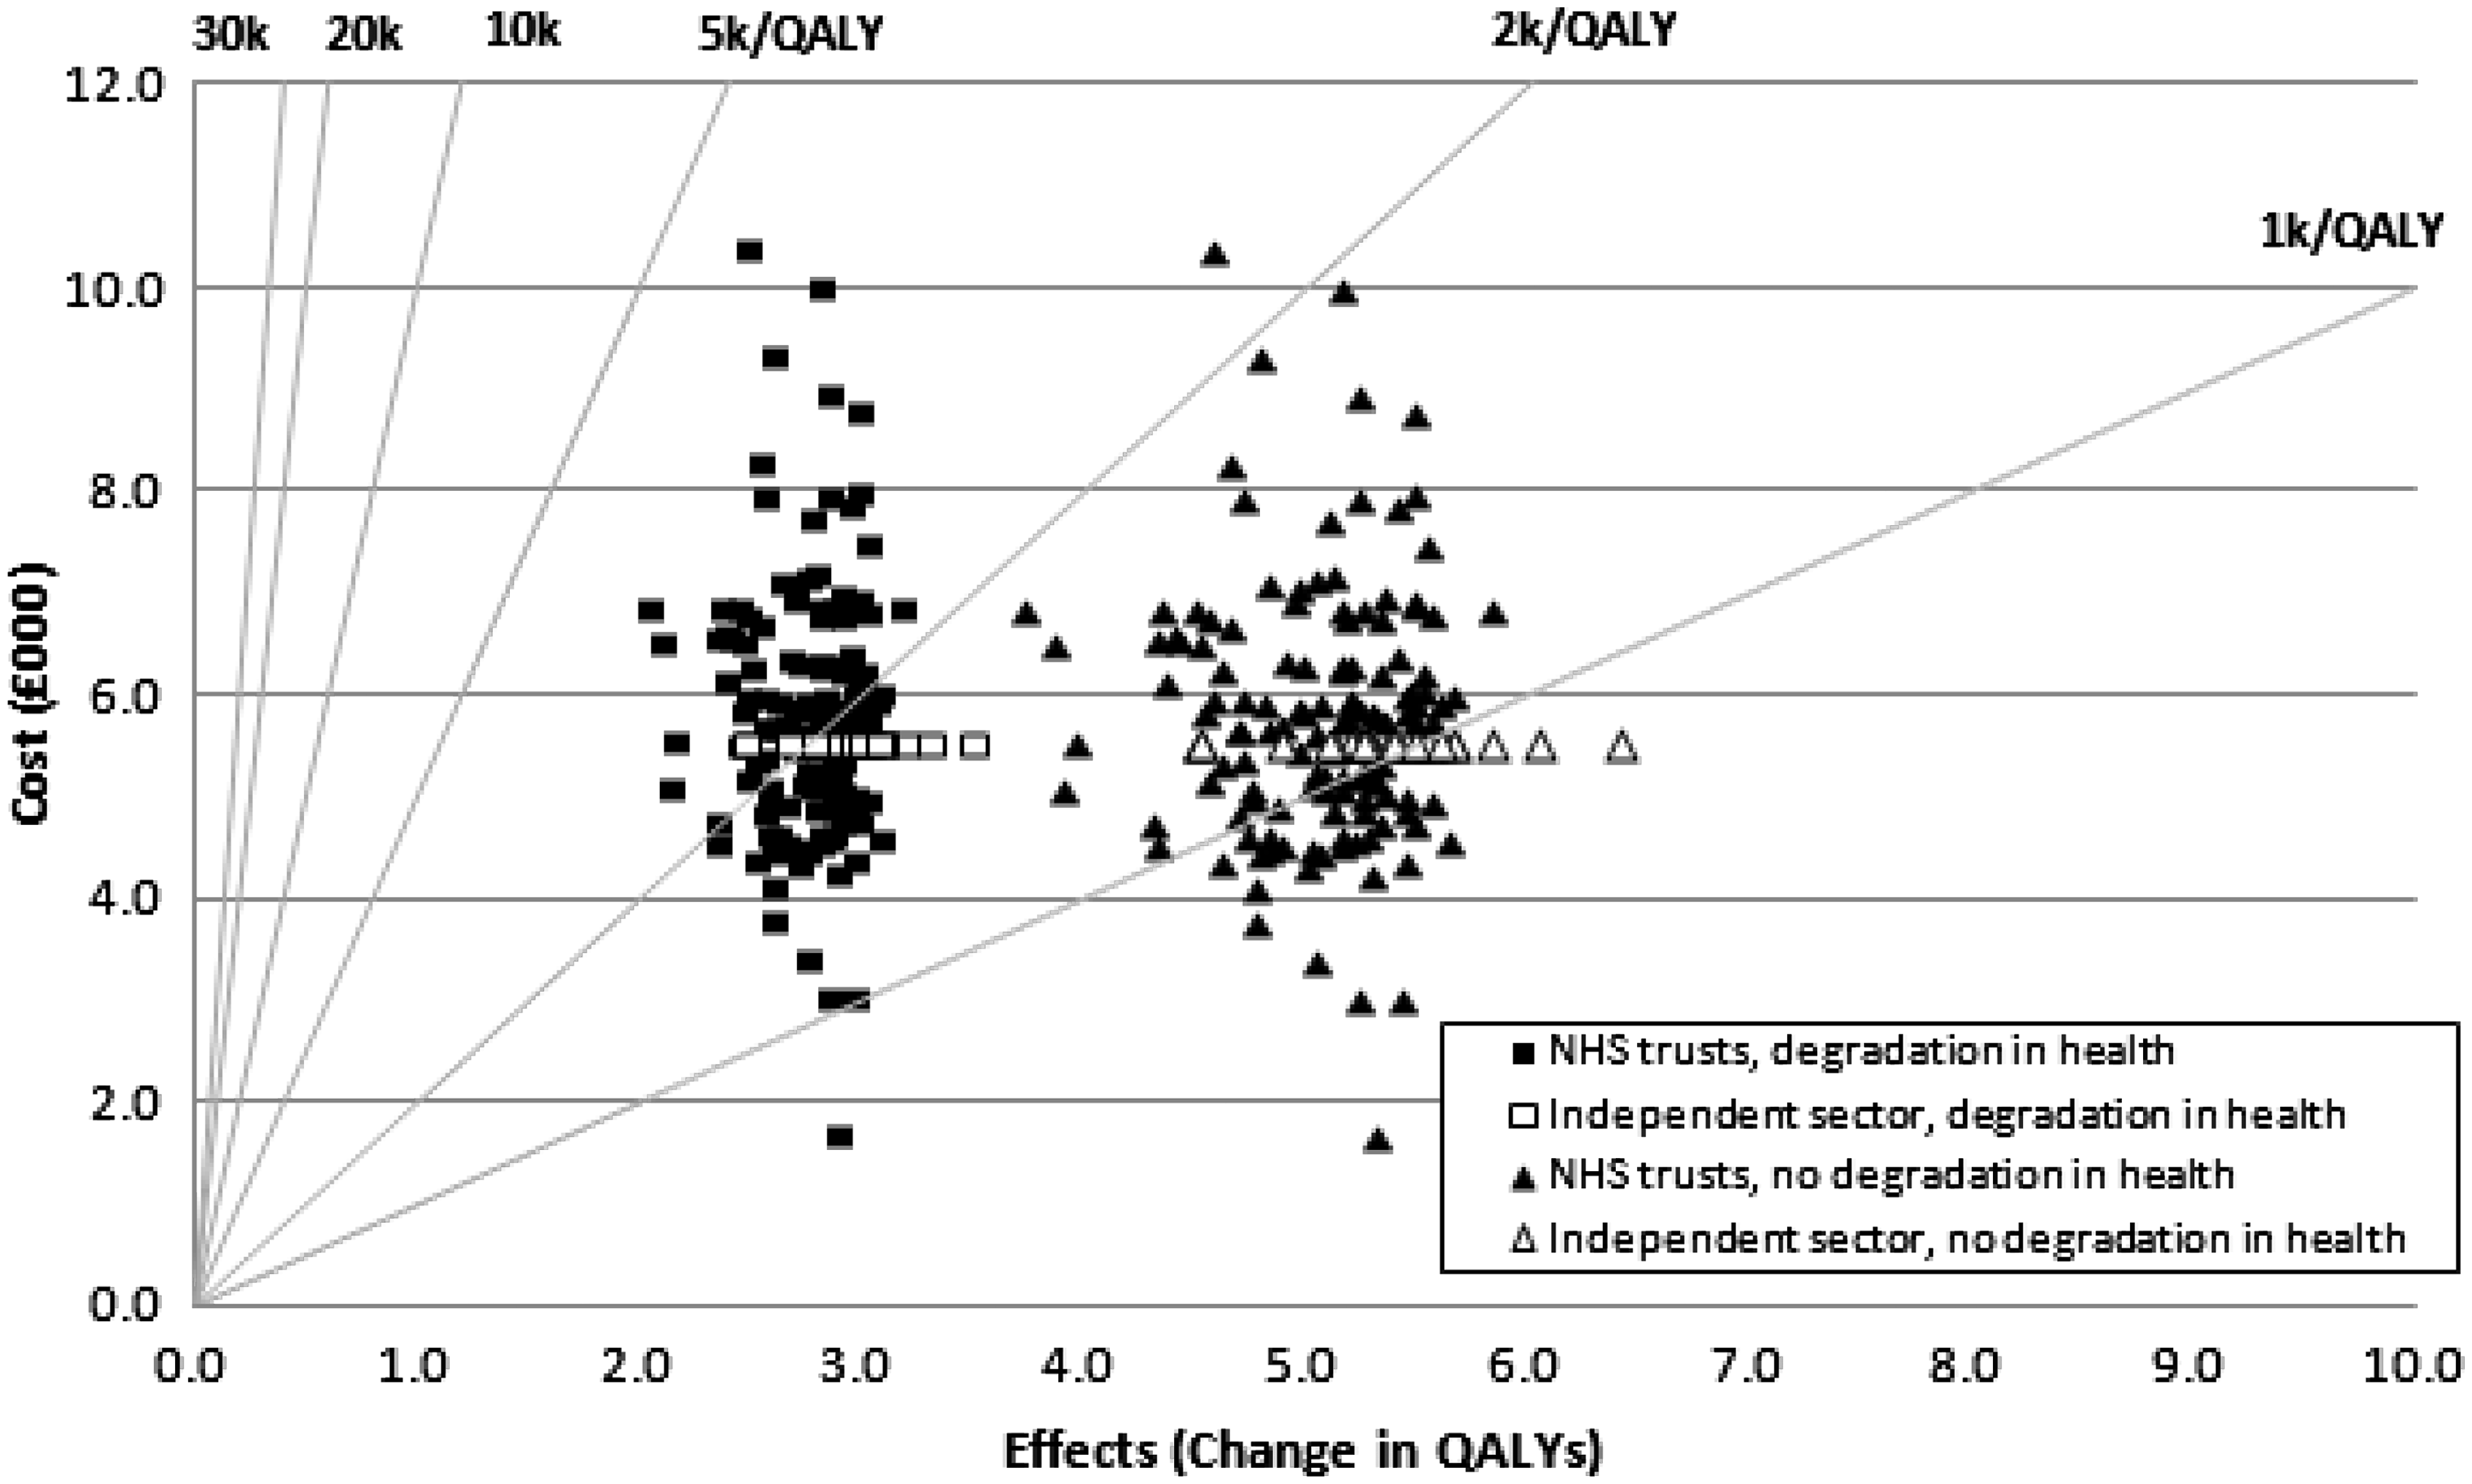
There is no statistically significant relationship between costs and QALYs under either assumption about future health.
Although there is variation between hospitals in terms of the estimated change in QALYs and in the average cost of hip replacements, the variation in NHS hospitals’ cost per QALY is closely associated to variations in unit costs (correlation coefficient, r = 0.94); a smaller proportion of the variation in cost per QALY is explained by variations in QALYs (r = 0.41).
Discussion
The collection of patients’ own assessments of their health-related quality of life pre- and post-hip replacement surgery for the first time provides an opportunity to not only investigate the comparative outcomes of surgery but also, as we demonstrate, to derive estimates of comparative cost-effectiveness. While cost-effectiveness is typically used to examine whether specific healthcare services are an efficient use of NHS resources, PROMs data additionally enable us to examine the technical efficiency of different providers in delivering those services.
On the basis of our QALY model and depending on associated assumptions, the hospital level estimates of the change in health outcome following a hip replacement suggest improvements of between 2.8 and 5.1 QALYs, with average cost per QALY values for NHS hospitals ranging from about £1170 to £2130. These estimates may be on the higher side given our conservative assumptions about no degradation in health for the counterfactual health state (i.e. with no operation); assuming similar future degradation in health for the counterfactual would double the estimated QALY gain and hence halve the cost per QALY. It is interesting to compare these estimates of cost-effectiveness for hip replacement operations to NICE’s cost-effectiveness threshold range of between £20,000 and £30,000 per QALY. 13 On this comparison, and on average, hip replacement would appear to be of good value for patients in terms of health gain and for the NHS in terms of value for money. However, differences in cost per QALY across hospitals were about nine- to ten-fold. The bulk of this variation appears to be driven by variations in cost rather than by differences in average QALY change.
The cost per QALY estimates obtained using routine PROMs data suggest a lower value than results from specific trials. For example, Fordham et al. 14 estimate a cost per QALY of primary hip operation versus no operation of between £7058 and £7220. Other estimates range from €5000 1 5 to €7936. 16 Direct comparisons are difficult, however, given differences in comparisons undertaken, differences in discount rates, underlying models, et cetera.
It is also interesting that we found no statistically significant relationship between costs and QALYs. An alternative analysis of the hip replacement cost/EQ-5D index relationship by Gutacker et al. 17 found evidence of a U-shaped association.
There are a number of limits to our analysis. First, the EQ-5D data cover around 20% of all eligible patients undergoing hip replacement operations. This is partly reflected in the size of the confidence intervals around the (casemix adjusted) EQ-5D index scores for individual hospitals published by the Department of Health 3 – and by implication, in our calculations of QALY gain and cost per QALY. Nevertheless, this comparatively small sample may include some bias. Although recent studies suggest some biases in the characteristics of patients in terms of non- and late responders to requests for PROM data,18,19 it remains uncertain as to the scale of the impact of these on mean outcomes reported by hospitals.
In terms of the cost data, the sample of NHS hospitals investigated here appears representative, with a mean cost per hip operation (£5840) which is just 5.6% higher than the average tariff price (£5528) which is based on national reference cost data from all NHS hospitals and (most) patients undergoing this procedure. There is, however, a large variation in unit costs across hospitals which might suggest problems with data quality. However, two audits of the reference cost data suggest that, for the data we used to estimate cost per QALY (admitted patient care costs) the data are reasonably reliable.20,21 Taken at face value, the results therefore suggest considerable variation in the cost-effectiveness of service delivery across providers, and considerable scope for efficiency improvements without harming patient health. Nevertheless, as we note below, cost data quality should be an area for further investigation.
Second, while we made no adjustment to hospitals’ costs using the market forces factor (MFF) – which accounts for unavoidable differences in hospitals’ costs 22 – adjusting costs using the MFF made little difference either to the eventual cost per QALY estimates (75% of hospitals had MFF-adjusted cost per QALY values between ± 2% of unadjusted estimates, with extremes of −8.1% and +5.7%) or to the rank ordering of hospitals on their cost per QALY.
Third, the model used to estimate QALYs from the EQ-5D data is relatively unsophisticated and applied uniformly across all hospitals. Alternative assumptions about, for example, the average expected lifetime of a hip replacement or the rate at which patients’ health status reduces over time are of course possible. But alternative assumptions applied to all hospitals uniformly would not change their relative QALY changes or cost per QALY values. However, given that the EQ-5D data used here are averages across all patients and all types of hip procedure within a hospital, procedure-specific models could be developed based on possible variations in health change arising from different hip procedures and using PROMs data linked to procedure data from hospital episode statistics. Different models might then better reflect variations in hospitals procedure casemix – for example, between major and minor hip operations (see Table A1).
Fourth, while there is an adjustment for hospital casemix, this may not completely account for variations in hospitals’ cost per QALY arising from variations in patient characteristics or the balance between different types of hip procedures undertaken by hospitals.
Notwithstanding those limitations, we think the following conclusions are suggested by this work. It is possible to calculate a productivity metric based on PROMs data. There appears to be considerable variation in the cost-effectiveness of providers, and it is striking that it appears to be cost and not effects (QALYs) driving that variation. Such results have the potential to provide hospitals with useful information in examining and better understanding their own performance. A focus for further work would, therefore, seem to be more detailed analysis of cost variation per se (including investigation of the accuracy of the cost data) and more generally to explore reasons for differences between hospital efficiency revealed by this analysis. Finally, the availability of PROMs data facilitates a better understanding of the way NHS resources yield QALY improvements and adds to the body of evidence on cost-effectiveness of NHS services generally, with potential relevance to NICE’s continued ‘search’ for the cost-effectiveness threshold to use in health technology appraisal. 23