
Abstract
Background
Satisfaction of psychology students has implications for students’ engagement, learning, and persisting with education. Understanding of influences on satisfaction remains incomplete.
Objective
To investigate contributors to psychology students’ satisfaction, we assessed multivariate associations of satisfaction with institutional, teaching, and student factors.
Method
In two cross-sectional studies at the same university, first year psychology undergraduates (N = 138 in 2019; N = 142 in 2023) completed online measures of student satisfaction, institutional factors (i.e., reputation, image, and learning environment), teaching factors (i.e., teaching quality, program structure, and assessment and feedback), student factors (i.e., self-efficacy, self-regulation, and motivation), and demographics.
Results
All proposed factors correlated with satisfaction. In hierarchical regression, student (self-efficacy) and institutional factors (academic reputation) explained more variance in satisfaction than did teaching factors. A second institutional factor, learning environment, associated independently with satisfaction in 2023 but not 2019 data.
Conclusion
Student self-efficacy and institutional reputation were the strongest predictors of psychology student satisfaction within this project. Replication at other institutions is needed, and longitudinal and experimental designs would also benefit future research.
Teaching Implications
Supporting psychology students to enhance self-efficacy and understand their institution's contributions to psychology might assist students’ satisfaction and thereby potentially aid learning and engagement.
Student satisfaction is an important yet complex consideration in higher education. In the present study, student satisfaction was defined as an attitude that involved students evaluating their educational experiences as aligning with or surpassing the student's expectations (Elliott, 2002). Constructs such as engagement in studies (Schreiner & Nelson, 2013), identification with a discipline (Foo & Green, 2023), and aspirations for further study (Shahsavar & Sudzina, 2017) associated with students’ satisfaction. However, satisfaction with teaching is demonstrably biased by factors that are extraneous to quality of learning, including students’ perceptions of the teacher's race, gender, age, language background, and grading leniency (Carpenter et al., 2020). Given that students’ satisfaction relates to engagement in learning, and that incorporating feedback from students may be required by regulatory bodies for quality assurance and accreditation (e.g., Department of Education Skills and Employment Canberra, 2021, p. 13), it is valuable to understand sources of student satisfaction and dissatisfaction across and within disciplines.
Student satisfaction can be challenging to foster within undergraduate psychology, in part due to large numbers of undergraduate students who study psychology, contrasted with a smaller proportion of graduates who become practising psychologists (Green et al., 2015). Green et al. noted that there has been limited research specifically addressing satisfaction of psychology students. From previous research, Green et al. grouped together institutional, teaching, and student factors that have been associated with psychology student satisfaction. Further information about these factors is presented below.
Institutional factors, including academic reputation, institutional image, and learning environment, relate to quality of educational organisations and their perceived reputations. Academic reputation was defined in the present study as the individual's perception of the public's collective assessment of how well the institution produces valued academic outcomes (Al Hassani & Wilkins, 2022). Stronger academic reputation may attract excellent students and potentially more students (Berndt & Hollebeek, 2019). Better institutional academic reputation has been associated with higher student satisfaction (Ali et al., 2016). Interestingly, psychology graduate satisfaction related to how selective their institution was (an aspect linked with academic reputation), whereas graduates’ salary was not associated with satisfaction (Espinoza et al., 2022). In the present study, institutional image was defined as the individual's perception of the public's overall assessment of the higher education institution (Ali et al., 2016). Successful institutions aim to build a strong image by providing quality service to generate student loyalty (Ismanova, 2019). Students respond to institutional image in conjunction with their own subjective, affective states (Naidoo & Hollebeek, 2016). Learning environment was conceptualised in the present study as locations, environments, and resources that help students develop within higher education institutions (Santini et al., 2017). Santini et al.'s meta-analysis showed that aspects of the learning environment such as campus facilities (classroom environment) and availability of resources (library services, technology) relate to university student satisfaction.
Satisfaction is also associated with teaching, such as teaching quality, program structure, and assessment. Teaching quality was defined in the present study as students’ perceptions of their experiences and appreciations of the lessons and educational experiences provided to them by teaching staff in the psychology program (Spooren et al., 2007). Among 237 Canadian psychology graduates, perceived teaching quality explained unique variance in student satisfaction (Sears et al., 2017). Santini et al.'s meta-analysis (2017) confirmed that higher education student satisfaction is associated with teaching quality. A multidisciplinary sample (including psychology students) rated teaching skill as the most important satisfaction factor within teaching variables, ahead of organisation, enthusiasm, and other variables (Sander et al., 2000). Improving teacher quality may be valued more than improving course content, and satisfaction is higher when teachers engage with students (Ismail et al., 2018). Program structure, including curriculum configuration, course sequences, and specification of required and elective courses (Halonen & Dunn, 2021), is another teaching factor that has been related to satisfaction. Aspects of program structure, such as course flexibility, associated moderately with student satisfaction in meta-analysis (Santini et al., 2017). Assessment facilitates understanding and relates to student satisfaction (Thien & Jamil, 2020). Additionally, positively framed critical feedback is important to student satisfaction (Evans, 2013) and receiving it improves student success, retention, and completion (Kizilcec et al., 2017).
Individual student factors previously associated with satisfaction include self-efficacy, self-regulation, and motivation. Self-efficacy refers to an individual's self-perception pertaining to their ability to achieve a goal (Bandura, 1977). Karoly (1993) defined self-regulation as an internal process guiding goal directed behaviours across time and context. Research has indicated higher satisfaction amongst students with higher academic self-efficacy (Alqurashi, 2019). Data from Dutch first year university students, predominantly in social sciences, showed similar magnitude of associations between satisfaction with their degree and either academic self-efficacy or self-regulated study behaviour (Van Rooij et al., 2018). Motivation, in the present study, used Ryan and Deci's (2000) definition of intrinsic motivation as being behaviour guided by personal interest and inclination towards mastery. Semmar (2006) reported that high motivation helps students enjoy learning and facilitates deeper learning. Intrinsic motivation is anchored to future personal aspirations and underpinned by the degree an individual enrols in to achieve their academic goals (Allen et al., 2018). However, when selecting an institution and program, students can also be extrinsically motivated by matters such as career and monetary desires (Metcalf, 2003). Hunter and Meshkati (2022) further suggested greater levels of student satisfaction occurred when graduating psychology majors were motivated because their learning goals and personality traits matched content of the discipline.
Past research has shown a lack of integrative studies that evaluate independent associations between constructs from all three domains (institutional, teaching, and student factors) and student satisfaction (Green et al., 2015). Some data have suggested that teaching factors might be the strongest set of predictors among these three groups (Green et al., 2015), but this has not been directly tested. Second, studies assessing these factors have often not included psychology cohorts (Green et al., 2015). Additionally, many studies have evaluated students’ satisfaction regarding a single course or unit of study (e.g., Lyke & Frank, 2012). However, the decision to continue or discontinue study logically relates to a program rather than to individual courses. Therefore, the present study addressed students’ satisfaction with their psychology degree program. The extent to which teaching, institutional, and student factors associated with student satisfaction in first year psychology students was assessed. It was hypothesised that institutional, teaching, and student factors would correlate with student satisfaction (Hypothesis 1); teaching factors would explain the most variance in student satisfaction, followed by student and then institutional factors (Hypothesis 2); and, based upon findings from Santini et al. (2017), assessment and feedback would contribute unique variance predicting student satisfaction, after controlling other teaching factors (Hypothesis 3). The same methods were used with separate participant samples in 2019 (Study One) and 2023 (Study Two).
Study One
Method
Participants
Students (N = 138) enrolled in first year of a psychology degree at one Australian public university participated for course credit. The sample size represented 17.5% of students who commenced relevant psychology degrees at the university in 2019. A priori power calculation using G*Power 3.1 revealed that 114 participants would provide 80% power to detect a medium size effect for a single predictor in multiple regression with nine predictors and alpha set at .05 (Faul et al., 2007, 2009). Medium effect sizes were estimated since this was consistent with meta-analysis findings regarding associations of institutional and teaching variables with student satisfaction (Santini et al., 2017). Mean age was 20.82 years (SD = 5.63). Participants were predominantly English speakers at home (n = 129, 93.5%), Australian-born (n = 120, 87.0%), and female (n = 106, 76.8%). Students born in New Zealand (n = 5, 3.6%) or a country other than Australia or New Zealand (n = 13, 9.4%) also participated. Most were completing a single psychology degree (n = 96, 69.6%), 42 (30.4%) students were in a double degree (e.g., psychology and business), and 122 (88.4%) students had completed four or fewer psychology courses. Further, 89 (64.5%) were employed (M work hours per week = 17.37, SD = 9.71), most were unmarried (n = 105, 75.4%), and with no children (n = 129, 93.5%).
Setting
The study was conducted at an accredited public university in Queensland, Australia. Among 789 students commencing one of the relevant psychology degrees at the university when data were collected in 2019, mean age was approximately 22 years. Like the study sample, commencing psychology students predominantly spoke English at home (n = 663, 84.0%), were Australian-born (n = 647, 82.0%), and were female (n = 532, 67.4%). The top 10 non-Australian birth countries of commencing psychology students at the university in 2019, in descending order of frequency, were New Zealand, United Kingdom, Indonesia, Philippines, South Africa, Brazil, India, Japan, China, and Papua New Guinea. Fifty-three percent of these commencing students (n = 418) were the first in their family to attend university.
Measurement and Procedure
This study was approved by Griffith University Human Research Ethics Committee (reference 2019/298). After online informed consent, respondents completed a 20-min anonymous online questionnaire via LimeSurvey. Students completed the online measures at a time and location of their choosing. Student satisfaction was completed first and demographic items last; the order of other measures was randomised for each participant. Multiple-item scales each used a 1 to 5 or 1 to 7 response scale (refer to Table 1 for descriptive data and reliability statistics). Institution-specific terminology for the qualification that the participant was studying “program” and individual unit of study “course” was used to substitute terms such as “unit” or “class” when needed for contextual clarity. Piloting of the full questionnaire including local terminology, by 8 psychology fourth-year students, demonstrated face validity prior to main study data collection. Data were collected from May to August 2019. Scoring used original author procedures including reverse scoring where needed, except that each scale was computed as the mean of scale items to facilitate comparisons between measures.
Descriptive Statistics and Correlations for Criterion and Predictor Variables in Study One (N = 138).
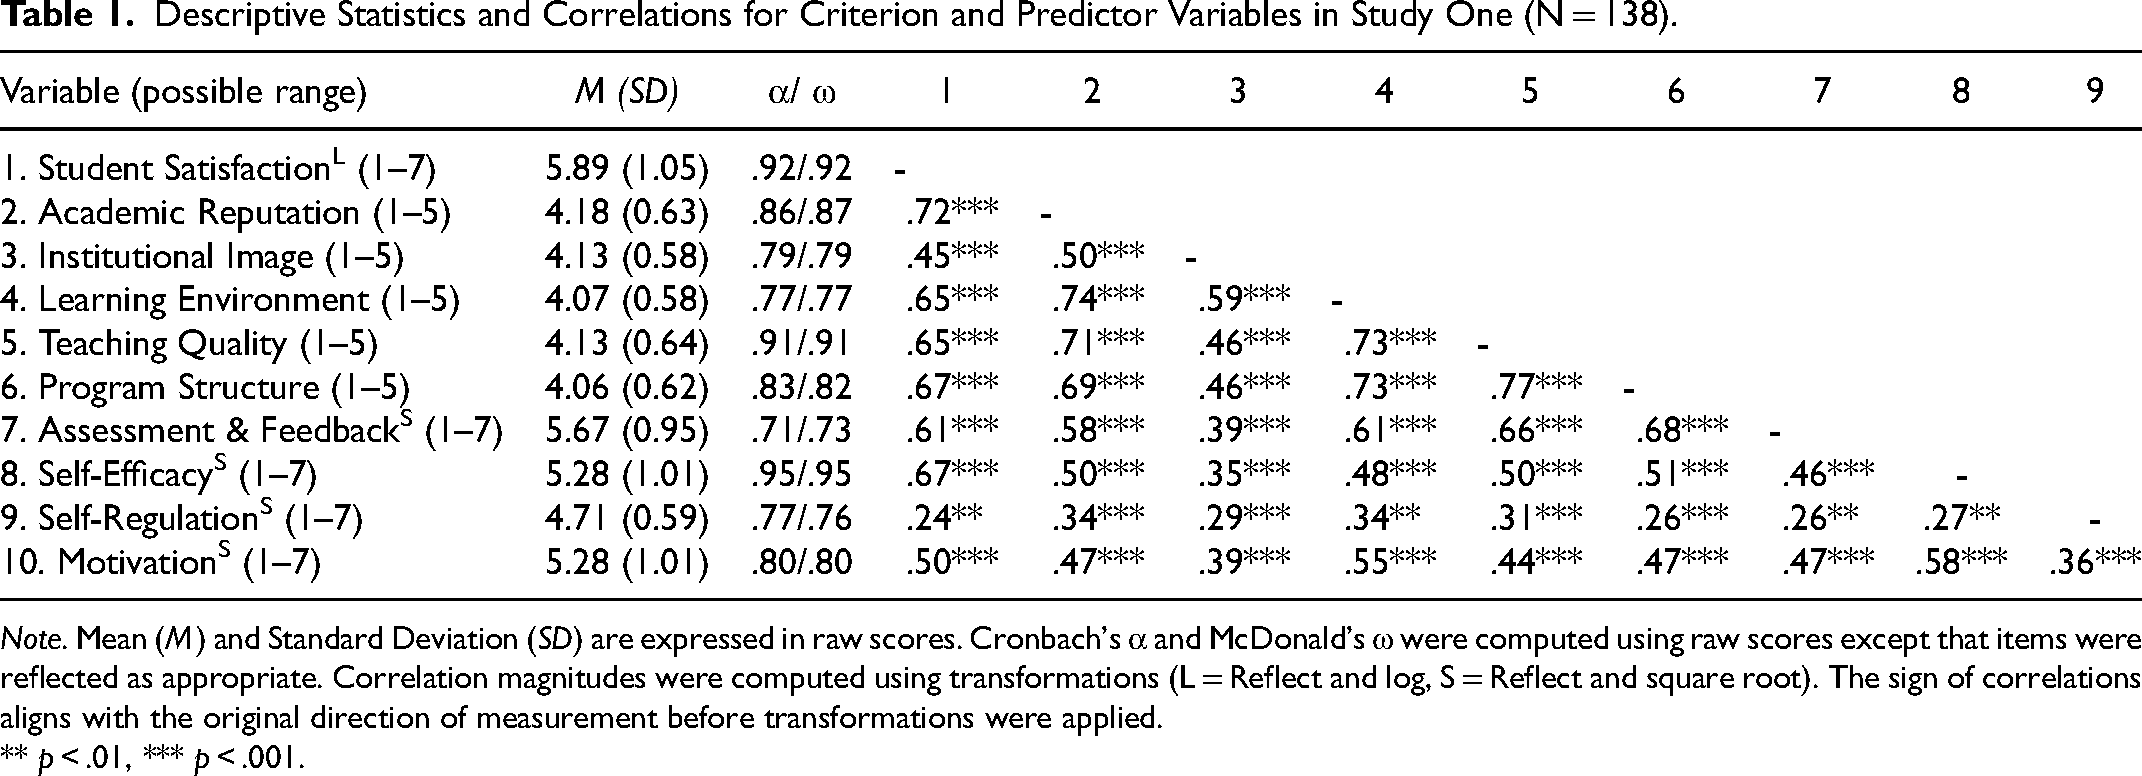
Note. Mean (M) and Standard Deviation (SD) are expressed in raw scores. Cronbach's α and McDonald's ω were computed using raw scores except that items were reflected as appropriate. Correlation magnitudes were computed using transformations (L = Reflect and log, S = Reflect and square root). The sign of correlations aligns with the original direction of measurement before transformations were applied.
** p < .01, *** p < .001.
Satisfaction was measured by adapting a 5-item measure of higher education student satisfaction that has demonstrated construct, convergent, and divergent validity (Wilkins et al., 2016; Wilkins & Stephens Balakrishnan, 2013). Adaptation involved replacing the double-barrelled item “I am very satisfied with my university and would definitely choose it again” (Wilkins & Stephens Balakrishnan, 2013, p. 154) with two items worded by the current study authors (i.e., “I am very satisfied with my university” and “I would definitely choose my program again”). Participants responded to the 6 items from 1 (strongly disagree) to 7 (strongly agree).
Among institutional factors, academic reputation was investigated with the 5-item Quality of Academic Performance subscale from the University Reputation Scale (Alessandri et al., 2006), with responses from 1 (strongly disagree) to 5 (strongly agree). A sample item is “The university offers high quality education” (Alessandri et al., 2006, p. 266). Institutional image was assessed by the 3-item Quality of External Performance subscale from University Reputation Scale (Alessandri et al., 2006). Participants responded to items (e.g., “The media reports of the university are in general positive”; Alessandri et al., 2006, p. 266) from 1 (strongly disagree) to 5 (strongly agree). Construct validity of the reputation and image measures has been demonstrated from university student data (Alessandri et al.). Learning environment was measured using four items from an original 5-item Learning Facilities subscale with demonstrated construct and divergent validity (Hussain & Bhamani, 2012), omitting one item regarding “IT labs” since not all students would have experienced these laboratories at this stage of studies. Items included “I find my university's learning environment conducive” (Hussain & Bhamani, 2012, p. 334). Participants responded from 1 (strongly disagree) to 5 (strongly agree).
For teaching factors, participants rated teaching quality on the Student University Satisfaction Scale 6-item Teaching and Learning subscale that has demonstrated construct and divergent validity (Hussain & Bhamani, 2012). A sample item is “I find my teachers providing equal opportunities of learning” (responses: 1 = strongly disagree to 5 = strongly agree; Hussain & Bhamani, 2012, p. 335). Program structure was measured with the 5-item Course Organisation Subscale from the validated Course Experience Questionnaire (McInnis et al., 2001). Items included “The [program is] well organised” (McInnis et al., 2001, p. 48; “program is” substituted for “course was” in the present study). Responses were 1 (strongly disagree) to 5 (strongly agree). Wilkins and Balakrishnan's (2013) 3-item Assessment and Feedback subscale was used for participants to rate assessment and feedback experiences. Participants responded to items from 1 (strongly disagree) to 7 (strongly agree). A sample item is “[Courses] are assessed using a variety of methods” (Wilkins & Stephens Balakrishnan, 2013, p. 154; “Courses” substituted for “Modules/units” in the present study).
The student factor of academic self-efficacy was measured using the 8-item Self-efficacy for Learning and Performance subscale from Motivated Strategies for Learning Questionnaire (MSLQ; Pintrich et al., 1991). On items (e.g., “I expect to do well in this [program]”; Pintrich et al., 1991, p. 13; “program” substituted for “class” in the present study), participants responded 1 (Very untrue of me) to 7 (Very true of me). To evaluate self-regulation regarding psychology studies, MSLQ's 8-item Resource Management Time and Study Environment subscale (Pintrich et al., 1991) was completed. For items (e.g., “I attend class regularly”; Pintrich et al., 1991, p. 25), responses were 1 (Very untrue of me) to 7 (Very true of me). Motivation was tested by the 4-item Intrinsic Goal Orientation subscale (Pintrich et al., 1991). A sample item is “In a program like this, I prefer course material that really challenges me so I can learn new things” (Pintrich et al., 1991, p. 9; “program” substituted for “class” in the present study). Responses were 1 (Very untrue of me) to 7 (Very true of me).
Results
Of the original 139 participants, one case was a multivariate outlier that was unduly influential on the regression slope (Mahalanobis distance exceeding cutoff for .001 probability; Sullivan et al., 2021), changing the nature of the prediction, so was dropped from analyses such that main analyses were based on 138 cases. The outlying case had very low satisfaction despite scoring at the mean or higher on all predictor variables. Missing data on individual items (n = 9 responses, 7% of participants) were replaced with the participant's scale mean (Dodeen, 2003). Negative skewness in satisfaction was corrected with reflect and log transformation, and negative skewness in assessment and feedback, self-efficacy, self-regulation, and motivation was corrected via reflect and square root transformations (Fink, 2009). 1 Statistical checks prior to the primary analysis demonstrated that assumptions of multicollinearity, homoscedasticity, and normality of residual values were met.
Hypothesis One: Correlations with Student Satisfaction
Descriptive statistics and correlations are shown in Table 1. Adequate reliability of each scale is demonstrated in Table 1 using both Cronbach's α and McDonald's ω (Hayes & Coutts, 2020). All variables were significantly positively correlated.
Hypothesis Two: Teaching Factors Would Explain the Most Variance in Student Satisfaction
Hierarchical multiple regression of satisfaction (Table 2) showed that at Step One, with institutional factors only, the regression model was significant, F(3, 134) = 54.71, p < .001, R2adj = 54.0%. Reputation, image, and learning environment explained a combined 54.0% of variance in student satisfaction. Both reputation (12.67%) and learning environment (1.85%) explained statistically significant unique variance within satisfaction (Table 2).
Hierarchical Regression Analysis for Associations with Student SatisfactionL in Study One (N = 138).
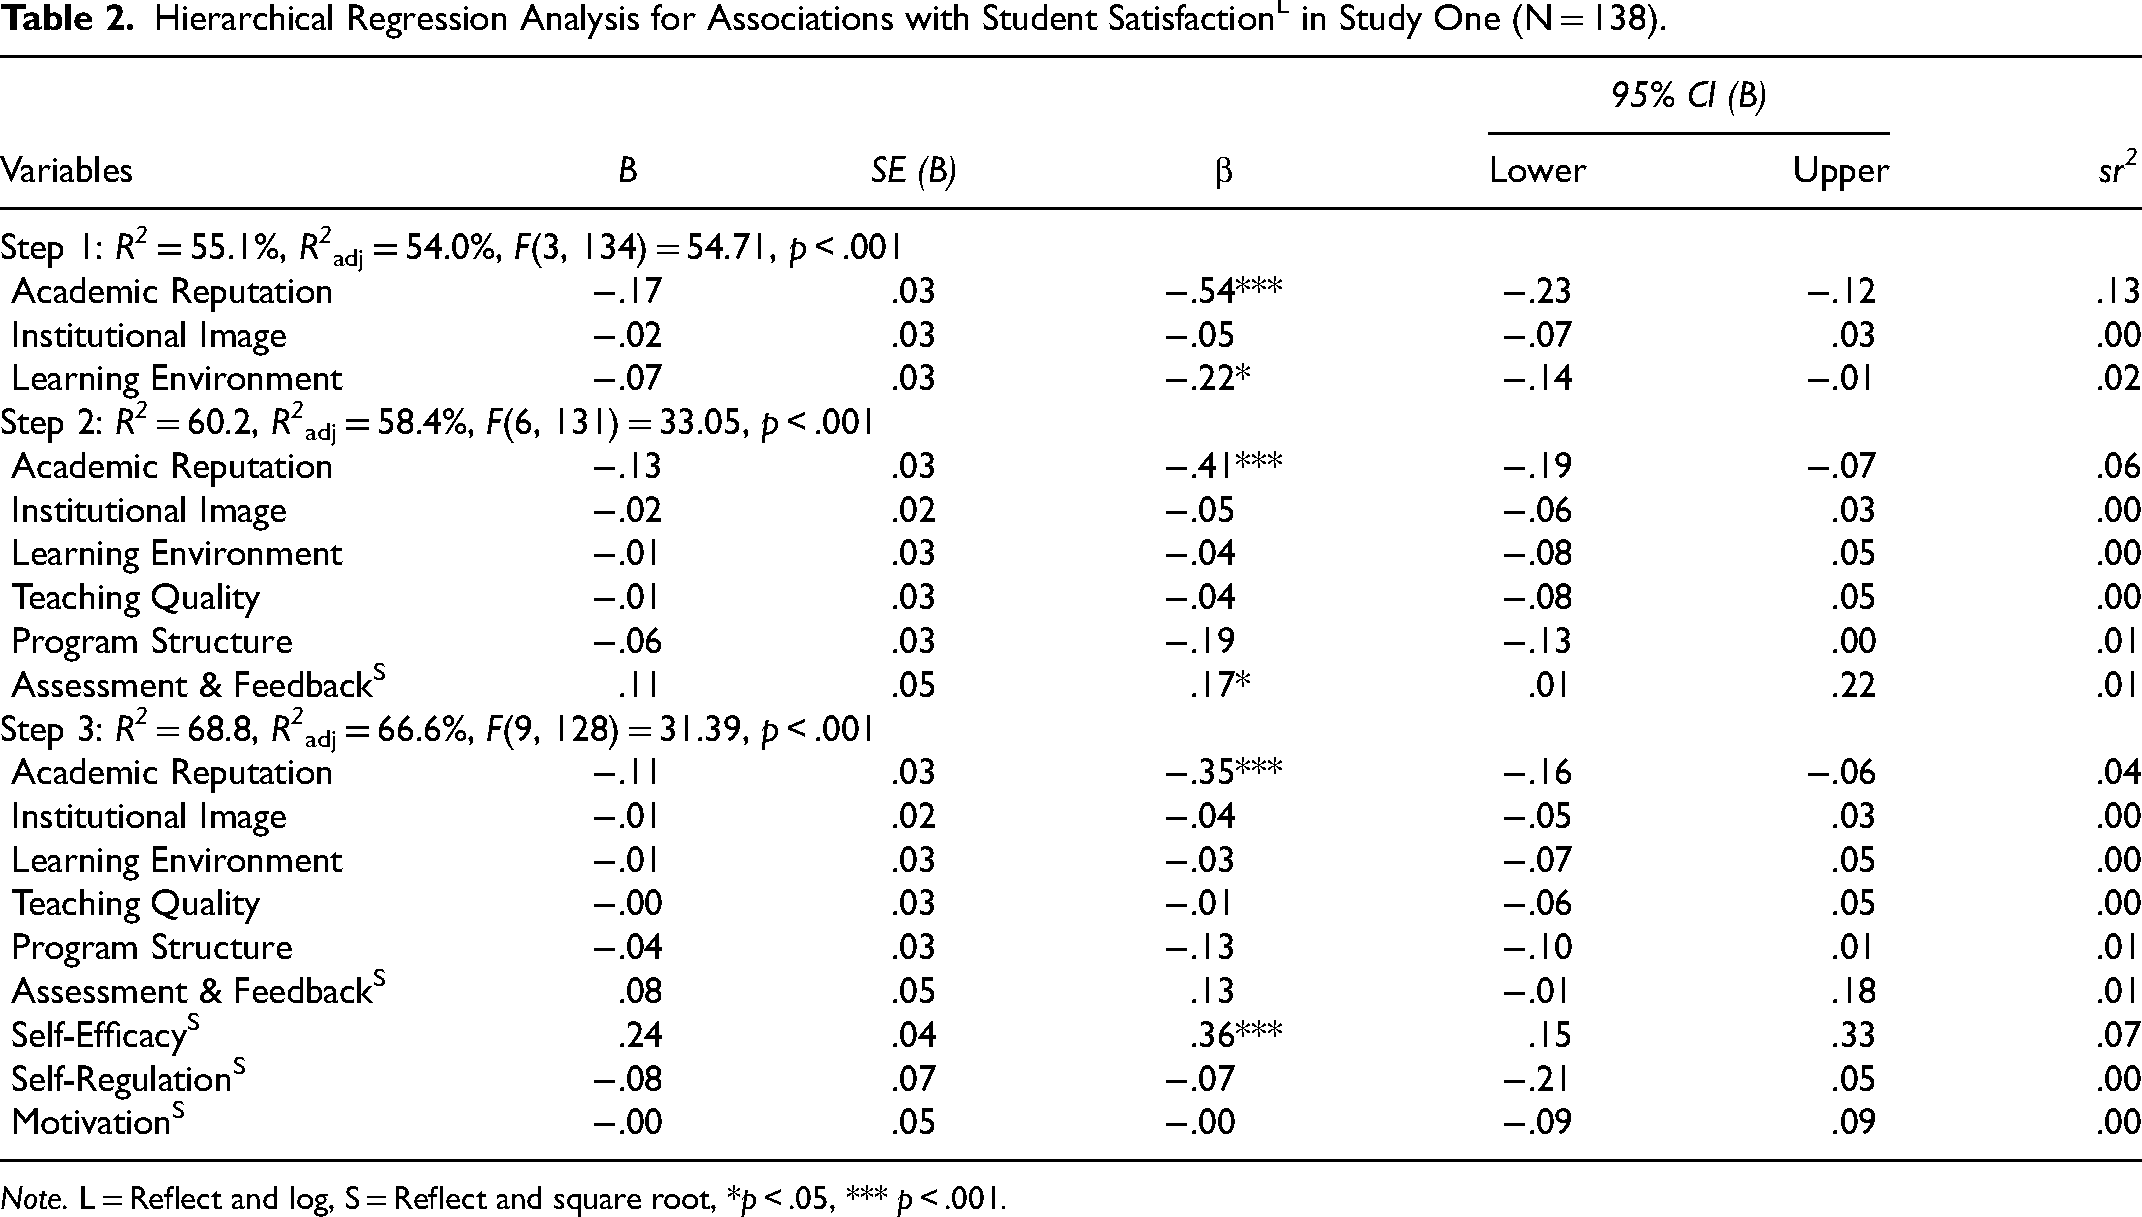
Note. L = Reflect and log, S = Reflect and square root, *p < .05, *** p < .001.
The addition of teaching variables (teaching quality, program structure, and assessment and feedback) at Step Two explained a further 5.2% of satisfaction variance, Fchg(3, 131) = 5.67, p = .001, R2adj = 58.4%. Of the three teaching variables, only assessment and feedback (1.40%) contributed significant unique variance at this step. The reputation predictor remained statistically significant (sr2 = 6.20%) but learning environment did not. This suggests overlap in shared variance between some institutional and teaching factors.
In Step Three, self-efficacy, self-regulation, and motivation were entered, explaining an additional 8.6% of variance in satisfaction, Fchg(3,128) = 11.78, p < .001, R2adj = 66.6%. Overall, the hierarchical regression analysis model (Table 2) including institutional, teaching, and student factors accounted for 66.6% of variance in student satisfaction.
Hypothesis Three: Assessment and Feedback Would Contribute Unique Variance Predicting Student Satisfaction
With all factors in the regression, self-efficacy (7.12%) and reputation (4.49%) each contributed unique variance in satisfaction and other factors did not (see Table 2). The variable named “assessment and feedback” was a significant independent predictor at Step Two but not at Step Three.
Discussion
This study aimed to assess the extent to which institutional, teaching, and student factors predicted student satisfaction in first year psychology students. Three hypotheses were tested. Although individual variables each correlated with satisfaction (Hypothesis 1), the expected patterns for multivariate associations between domains and criterion (Hypothesis 2), and for specific teaching variables (Hypothesis 3) were not fully supported.
Hypothesis 1 proposed that better scores for institutional, teaching, and student factors would correlate with higher student satisfaction. All predictors showed significant correlations, with similar effect sizes to previous studies for institutional (Sears et al., 2017), teaching (Santini et al., 2017), and student factors (Van Rooij et al., 2018).
Hypothesis 2 proposed that teaching factors would explain the most variance in student satisfaction, followed by student and then institutional factors. This hypothesis was not supported. All three domains collectively contributed to variance in satisfaction, and teaching factors added 5.2% variance in satisfaction after institutional factors were accounted for. However, in the present data, teaching factors did not outweigh student and institutional factors. When measures of all three domains were included, self-efficacy (student) and academic reputation (institutional) were the only variables associated with unique variance in satisfaction.
Based upon findings from Santini et al. (2017), Hypothesis 3 predicted that assessment and feedback would contribute unique variance in student satisfaction after controlling other teaching factors. This hypothesis was partially supported. When institutional and teaching factors were included (Step 2), assessment and feedback was a significant individual predictor, explaining 1.40% of variance in satisfaction. However, when student factors were added (Step 3), assessment and feedback was no longer a unique predictor. Also, if raw data were used instead of transformed data, at Step 2 assessment and feedback did not contribute unique variance but the teaching variable of program structure did contribute unique variance. This Step 2 finding was the only difference between raw and transformed outcomes; Step 3 findings were consistent across raw and transformed data. Given that unique association with assessment and feedback was small and was not consistent across variations in analysis, caution is needed in positing a unique role of assessment and feedback in comparison to other factors associated with psychology student satisfaction.
Conducting this study only in a single year level in a single institution was a notable limitation of this study. Furthermore, data were collected in 2019, prior to the COVID-19 pandemic. COVID-19 changed the teaching landscape and led to reduced face-to-face instruction thereafter in this institution. Therefore, teaching factor associations after COVID-19 might differ with increased online or hybrid teaching and reduced face-to-face teaching.
To check robustness and replicability of findings, a replication study was conducted in September 2023, using the same methods as the original study conducted from May to August 2019. Students can commence the first year of studies at this institution in March, July, or November; data collection timings ensured that students had experienced at least one month of studies.
Study Two
Method
Participants
Students (N = 142) enrolled in first year of a psychology degree at one Australian public university participated for course credit. Mean age was 21.11 years (SD = 6.83). Participants were predominantly English speakers at home (n = 121, 85.2%), Australian-born (n = 105, 73.9%), and female (n = 115, 81.0%). Students born in New Zealand (n = 6, 4.2%) or a country other than Australia or New Zealand (n = 30, 21.1%) also participated. Most were completing a single psychology degree (n = 86, 60.6%), 56 (39.4%) students were in a double degree (e.g., psychology and business) and n = 136 (95.8%) had completed four or fewer psychology courses. Further, n = 110 (77.5%) were employed (M work hours per week = 19.13, SD = 9.75), and most were unmarried (n = 108, 76.1%), with no children (n = 131, 92.3%).
Measurement and Procedure
The same measures and procedures were used as for the 2019 study. Approval for the 2023 replication study was provided by Griffith University Human Research Ethics Committee (reference 2019/298).
Results
Of the original 145 participants, three cases were multivariate outliers that were unduly influential on the regression slope (Mahalanobis distance exceeding cutoff for .001 probability; Sullivan et al., 2021), changing the nature of the prediction, so were dropped from analyses such that main analyses were based on 142 cases. One outlying case had above average self-efficacy and self-regulation but very low scores on all other variables; one case had very low scores for teaching quality and self-efficacy but average to above average scores on other variables; and one outlying case had low satisfaction combined with very low to above average scores on predictor variables. There were no missing data on scale items. Negative skewness in satisfaction was corrected with reflect and log transformation and negative skewness in program structure was corrected via reflect and square root transformation (Fink, 2009). There was no difference in statistical outcomes associated with omission or retention of one case that was a univariate outlier for image, thus, this outlying case was retained. Statistical checks prior to the primary analysis demonstrated that assumptions of multicollinearity, homoscedasticity, and normality of residual values were met.
Descriptive statistics and correlations are shown in Table 3, with all variables significantly positively correlated. Adequate reliability of each scale is demonstrated in Table 3 using both Cronbach's α and McDonald's ω (Hayes & Coutts, 2020). Hierarchical multiple regression of satisfaction (Table 4) showed that at Step One, with institutional factors only, the regression model was significant, F(3, 138) = 58.50, p < .001, R2adj = 55.0%. Reputation, image, and learning environment explained a combined 55.0% of variance in student satisfaction. Both reputation (15.52%) and learning environment (5.48%) explained statistically significant unique variance within satisfaction (Table 4).
Descriptive Statistics and Correlations for Criterion and Predictor Variables in Study Two (N = 142).
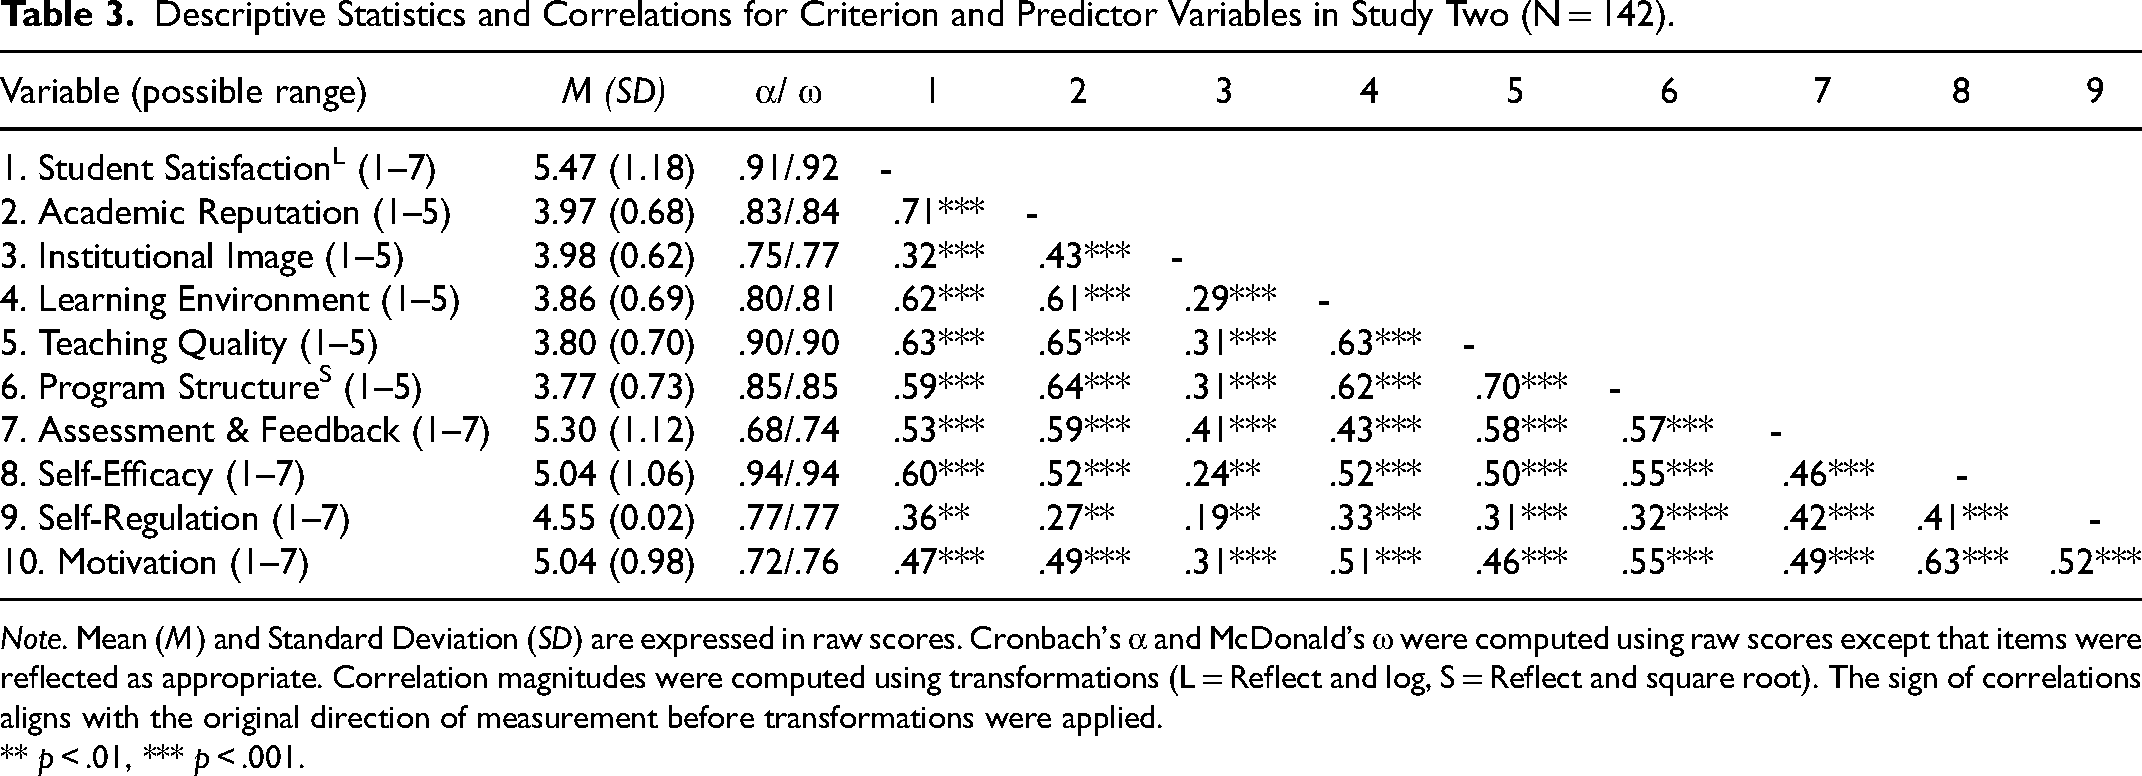
Note. Mean (M) and Standard Deviation (SD) are expressed in raw scores. Cronbach's α and McDonald's ω were computed using raw scores except that items were reflected as appropriate. Correlation magnitudes were computed using transformations (L = Reflect and log, S = Reflect and square root). The sign of correlations aligns with the original direction of measurement before transformations were applied.
** p < .01, *** p < .001.
Hierarchical Regression for Associations with Student SatisfactionL in Study Two (N = 142).
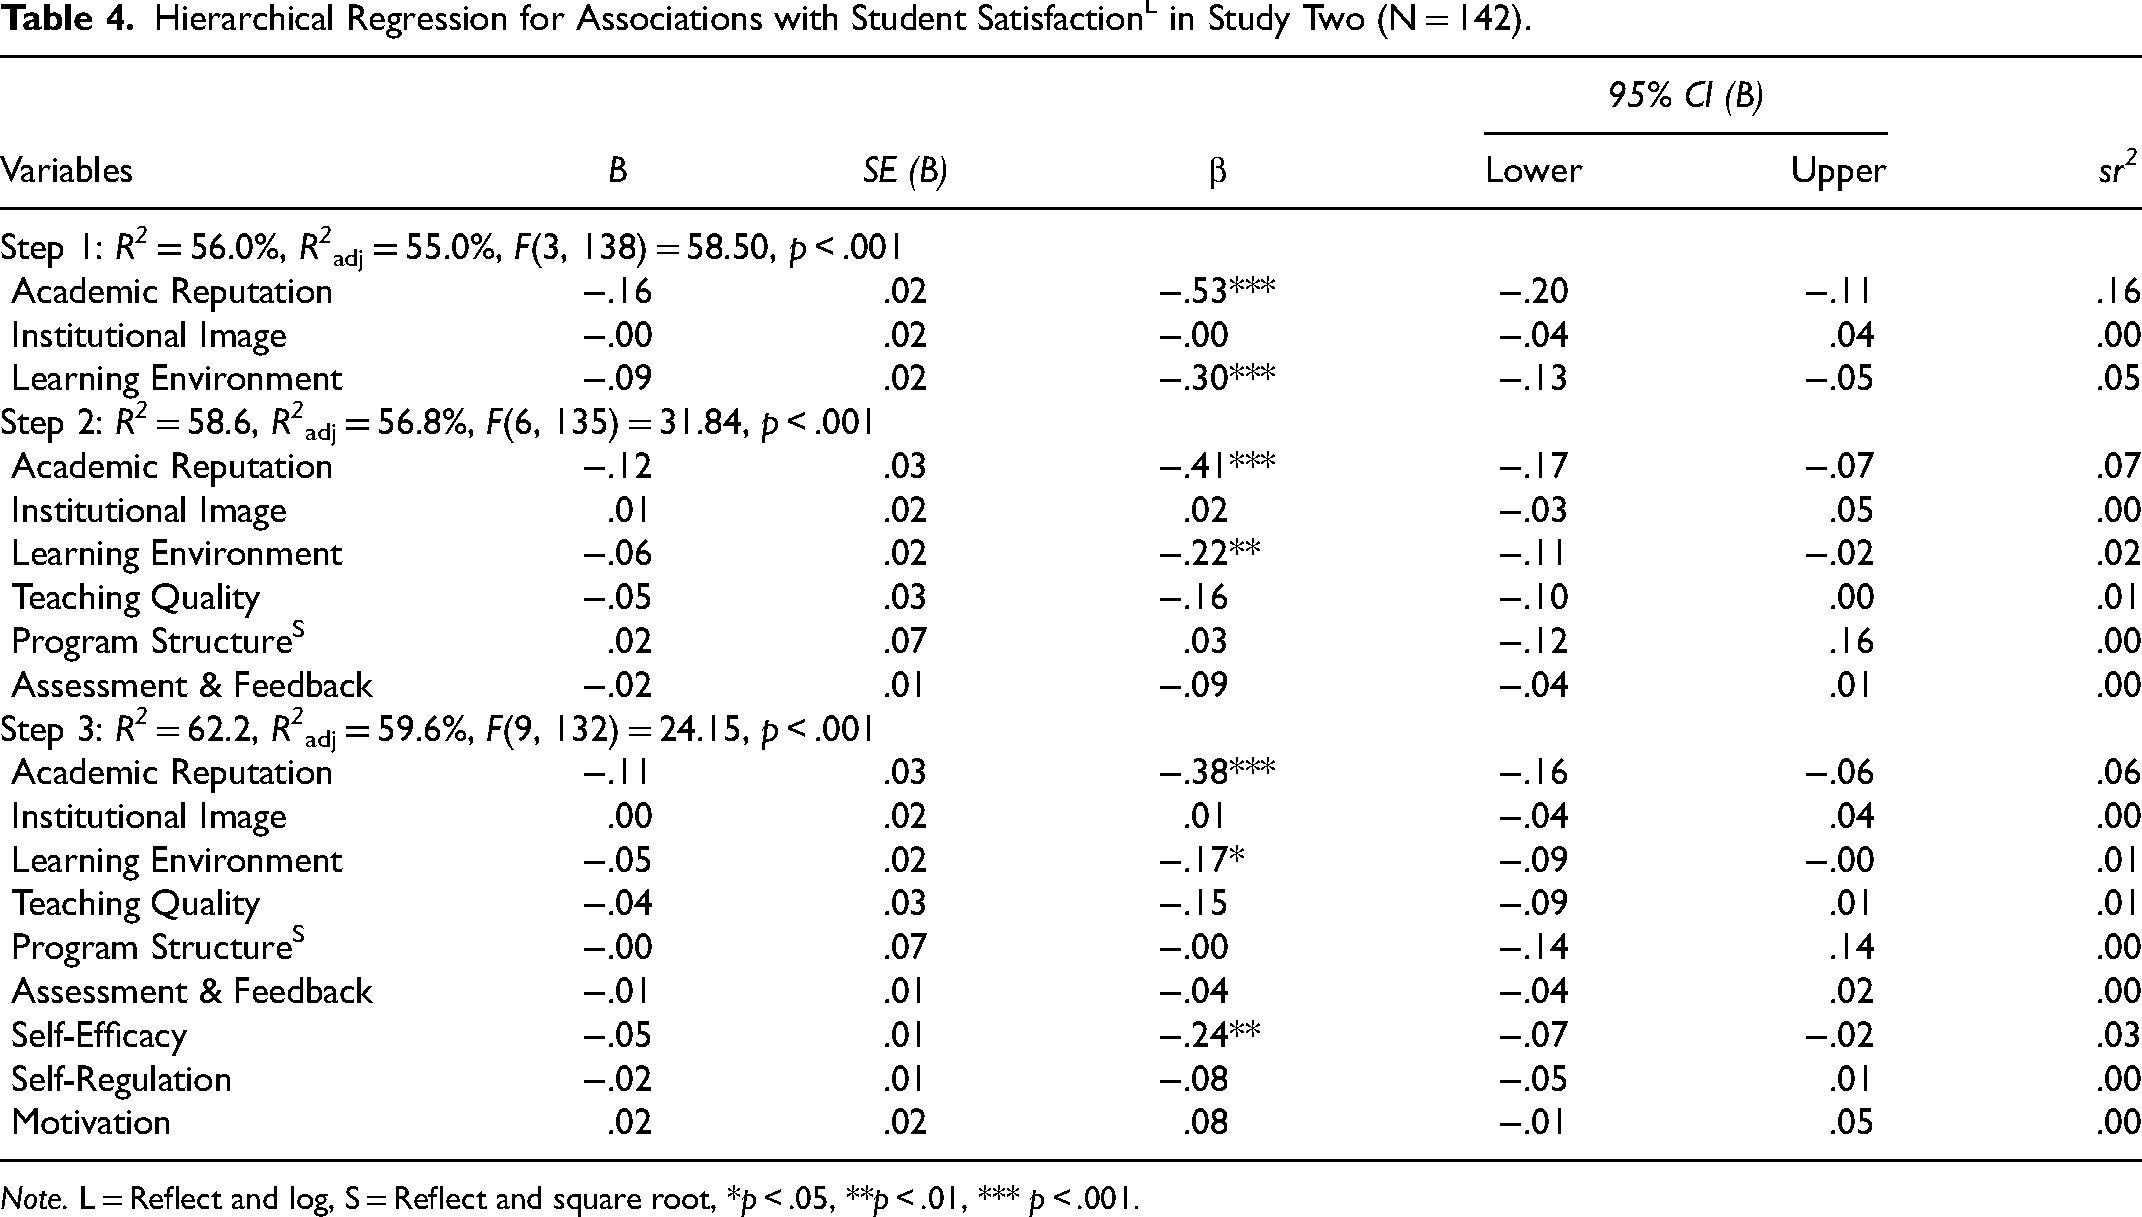
Note. L = Reflect and log, S = Reflect and square root, *p < .05, **p < .01, *** p < .001.
The addition of teaching variables (teaching quality, program structure, and assessment and feedback) at Step Two explained a further 2.6% of satisfaction variance, Fchg(3, 135) = 2.84, p = .040, R2adj = 56.8%. Of the three teaching variables, none contributed significant unique variance at this step, suggesting overlap in associations of the teaching variables with satisfaction. Both reputation (sr2 = 6.91%) and learning environment (sr2 = 2.34%) remained as statistically significant unique predictors of satisfaction at Step 2, when teaching variables were in the regression equation.
In Step Three, self-efficacy, self-regulation, and motivation were entered, explaining an additional 3.6% of variance in satisfaction, Fchg(3,132) = 4.22, p = .007, R2adj = 59.6%. Overall, the hierarchical regression analysis model (Table 4) including institutional, teaching, and student factors accounted for 59.6% of variance in student satisfaction. With all factors in the regression, reputation (5.95%), self-efficacy (2.82%), and learning environment (1.28%) were each associated with unique variance in satisfaction and other potential predictors were not.
Discussion
Study Two was conducted using the same methods as in Study One, with a separate sample. The main findings from the 2023 sample mirrored Study One, with two variations. Like in Study One, Study Two data showed that institutional, teaching, and student variables each contributed significant variance to student satisfaction. Also replicated from Study One was the finding that the institution's academic reputation and student self-efficacy were each independently associated with student satisfaction in the final regression model. Two differences from Study One were that learning environment remained an additional significant predictor at Steps 2 and 3 instead of only being a predictor at Step 1, and that the assessment and feedback variable was not a significant unique predictor at any step in Study Two.
Learning environment was measured in the present study with four items: one on the institution's “learning environment” in general, one relating to classroom experiences including educational resources in the classroom, and two items that explicitly referred to “library” resources. A previous meta-analysis reported small- to moderate- effect sizes regarding the associations between “resources provided to the student” and student satisfaction (e.g., effect size of association with student satisfaction was .34 for “access to technology” and .32 for “library services”; Santini et al., 2017). The learning environment factor is conceptually more linked to the student's lived experience of the institution, whereas the academic reputation factor is something that the student may have developed attitudes about prior to personally experiencing the institution. It is possible that learning environment was a stronger independent factor for student experience in 2023 in part due to changes to the relevant courses, where teaching made more use of online asynchronous learning and had fewer live lectures in the relevant degree programs in comparison to 2019. However, the correlation of learning environment with satisfaction had similar magnitude in both samples (.65 in 2019, .62 in 2023), indicating similar associations of this construct with satisfaction in both studies when considered separately to other potential predictors. The multivariate findings for both learning environment and assessment and feedback were associated with relatively small differences in associations between Studies One and Two, with the main pattern of results demonstrating replication.
General Discussion
Across two studies in the same institution, all expected predictor variables from institutional, teaching, and student domains correlated with psychology student satisfaction. However, findings varied from the predictions that teaching variables would account for more variance in satisfaction than institutional and student variables. Study One found two variables that were independent predictors of student satisfaction, namely self-efficacy and institutional reputation. Study Two replicated the finding regarding these two variables as independent predictors and additionally found the institutional variable of learning environment to be independently associated with variance in satisfaction.
Past studies have examined aspects of institutional, teaching, and student factors without investigating all three domains simultaneously. A review by Green et al. (2015) found that teaching variables are frequently associated with student satisfaction; institutional factors have also been shown to relate (Santini et al., 2017). In the current study, no teaching factor contributed unique variance in satisfaction when both institutional and student factors were incorporated. Choices of measures, constructs, sampling, order of entry of variables, and the cross-sectional design are all aspects that might contribute to discrepancies between present findings and previous studies.
Although Study One found that assessment and feedback independently associated with student satisfaction at Step Two of hierarchical multiple regression, this was a weak effect, was found only in transformed data and not in raw data, and was no longer present at Step Three of the regression when student variables were incorporated. Study Two did not demonstrate an independent association of any of the teaching variables with student satisfaction. Therefore, there was inconsistent evidence regarding whether assessment and feedback contributed more than other teaching variables to student satisfaction. It should be noted that the “assessment and feedback” variable contained only three items, with two items referring to assessment (variety of assessment methods in program and use of ongoing assessment in program, respectively) and one item on feedback, namely “I receive detailed and helpful feedback on my work”. Whilst this measure has shown evidence of reliability and validity previously and had adequate reliability in the present studies, it could be argued that the measure combined two related but separate constructs and might not be the ideal measure to test the relevant hypothesis.
Findings regarding institutional reputation aligned with Ali et al. (2016) who reported reputation influences satisfaction. Similarly, Parahoo et al. (2013) reported that reputation was the only significant predictor of satisfaction among various institutional, student, and social variables. Al Hassani and Wilkins (2022) found that reputation, organisational identification, and perceived teaching quality were associated with an earlier version of the student satisfaction measure used in the present study. To measure reputation in the present study, instructions requested “your perceptions pertaining to the academic reputation of your university” and items referred to perceived quality of education, students, academic staff, leadership, and prospects for future growth (Alessandri et al., 2006).
The finding of self-efficacy as a key individual factor associated with unique variance in satisfaction suggests a potential positive aspect of past findings that students who expect higher grades report more satisfaction. Whilst association between students’ grade expectations and satisfaction has been linked to perceptions of lenient grading (Carpenter et al., 2020), measures of grade expectations might also in part reflect self-efficacy with its beneficial associations with learning and motivation during psychology studies (Green, 2011). Self-efficacy items in the present study assessed expectations for skill development and understanding as well as expectations of grades (Pintrich et al., 1991).
As noted in the Discussion for Study Two, the learning environment variable combined several aspects of resources available to students that have previously been associated with student satisfaction in meta-analysis (Santini et al., 2017). However, the amount of variance independently associated with learning environment was relatively small. Replication in other institutions and year levels would assist in understanding the most impactful factors to target to enhance student satisfaction.
Educational Implications
Given that this is the first study we have located that has assessed institutional, teaching, and student factors concurrently in relation to satisfaction in first year psychology students, the study helps with understanding relative importance of factors associated with psychology undergraduate satisfaction. Whilst the identification of student self-efficacy as a key unique predictor of satisfaction was correlational, there is potential that interventions targeting self-efficacy in psychology students might translate to improved satisfaction. Supporting students to experience performance success, preferably via tasks graded to individual learners to provide an optimal level of challenge, was one of a range of suggestions by Talsma et al. (2018) for improving student self-efficacy.
The present findings demonstrate that satisfaction, at least in part, relates to how students perceive the reputation of the institution. Thus, investing in generating positive perceptions pertaining to an institution's reputation, and specifically its reputation in psychology research and teaching (Green et al., 2015), might result in higher levels of satisfaction with psychology degree programs. Like suggestions noted in Green et al. (2015), psychology departments and psychology teaching staff might highlight their research involvement to students, including through class examples and exercises and communications via social media. This may pay dividends through improved word of mouth circulated from satisfied students. Research suggests that student satisfaction is related to improved academic performance and the decision to take additional classes (Booker & Rebman, 2005). Understanding what contributes to student satisfaction has fiscal implications as student enrolment and attrition rates affect higher education institutions (Al Hassani & Wilkins, 2022; Gale & Parker, 2017).
These findings provided some evidence refuting teaching factors being the strongest set of predictors as speculated by Green et al. (2015). Relative importance of institutional, teaching, and student factors remains to be firmly established. This may help guide future research questions and hypotheses about prospective and current student motivation regarding learning in psychology. Further theoretical integration regarding influences of multiple key factors in student satisfaction is also required, to better understand mechanisms and guide educational interventions.
Limitations
Limitations are noted. Data were obtained by convenience sampling from a single institution. Data on country of birth and language spoken at home omitted details such as students’ domestic/international status and race that might help to understand representativeness of the sample and generalisability of findings. Another limitation to generalisability was that the sample was predominantly female (77% in Study One and 83% in Study Two). Whilst this university does have more female than male students in undergraduate psychology (e.g., 67% female in the year that Study One was conducted), findings can be more confidently generalised to female students and less is known about applicability of these findings to satisfaction of students of other genders. It is also noted that the sample size met a priori power requirements to detect medium effects similar in magnitude to previous studies and that it was not powered to detect smaller effects that might nevertheless be of pedagogical significance.
It is possible that satisfied students might have been more willing to complete the questionnaire than unsatisfied students. This might have generated a response bias capable of skewing the aggregated results. Students were able to choose which research to participate in for course credit (or to substitute alternate tasks for credits) and responses from 138 students represent 17.5% of students who commenced relevant psychology degrees at the university in 2019. However, if there was any self-selection bias for students with higher satisfaction, this was not unique to this research context, given that among course surveys completed by 17 to 20% of students in the courses conferring eligibility for this survey, mean scores for satisfaction with course (equivalent to 5.92/7) closely mirrored mean satisfaction with program/university in the present research (5.89/7). Students needed to be in one of three specific first year psychology courses to receive the invitation to participate; it is possible that the shared course context might have reduced the potential to detect associations with variables that are contextual to courses (such as assessment). Whilst it is noted that some participants reported completing more than four university courses already, all participants were completing a required first year psychology course to have the participation link available. For all variables, it was student's perceptions being measured and varied perceptions associated with satisfaction; nevertheless, generalisability to students at different year levels and institution types remains to be established.
To minimise survey completion time a measure of social desirability was not included, but it is possible that social desirability was an unmeasured confound. Furthermore, data were collected via self-report and only from first year psychology students: stronger evidence would come from a longitudinal study that examined associations with student satisfaction over time. For example, teaching factors might have greater impact in second- and third-year coursework as complexity increases and pressure to attain high grades for progression into further studies (such as Honours or postgraduate study) becomes more prominent. Additionally, more complex models are needed to assess associations between specific variables and satisfaction. Having identified self-efficacy as a prominent predictor, it may be prudent to examine interactions among self-efficacy, on the one hand, and teaching/institutional variables, on the other.
Conclusion
To date, research comparing institutional, teaching, and student predictors of psychology student satisfaction has been lacking. This study has improved comparative understanding of how these factors relate to satisfaction. To foster both satisfaction and learning in psychology, psychology educators and higher education institutions need to be informed by evidence as to how to best achieve these goals.
Footnotes
Acknowledgements
An earlier version of this manuscript was submitted in partial fulfilment of the requirements of the degree of Bachelor of Psychological Science (Honours) at Griffith University.
Declaration of Conflicting Interests
The authors declared no potential conflicts of interest with respect to the research, authorship, and/or publication of this article.
Funding
The authors received no financial support for the research, authorship, and/or publication of this article.
Transparency and Open Science Statement
The raw data, analysis code, and materials used in this study are not openly available but are available upon request to the corresponding author