
Abstract
Background
Statistics courses are a necessary component of undergraduate education, but psychology majors often have negative associations with statistics. One way to promote learning within classrooms is to promote classroom connectedness, but few studies have examined classroom connectedness using a social network paradigm.
Objective
The purpose of this study was to examine the degree of connectivity within the lab component of a statistics course, and test if the networks were associated with psychological constructs related to academic success, specifically, grit and resilience.
Method
Using descriptive network analysis and exponential random graph models (ERGMs), we examined the level of connectedness in statistics labs and whether or not students were likely to connect with each other based on sharing similar levels of grit and resilience.
Results
Results suggested an overall low degree of connectivity within each lab. However, in the most well-connected lab, students were more likely to connect with other students who had a dissimilar level of grit, but a similar level of resilience.
Conclusion
There is high variability between different student networks, although all networks were sparse. Future research could further examine the connection between student connectedness, grit and/or resilience, and how these could connect to student outcomes.
Teaching implications
fostering classroom connectedness could improve student learning outcomes.
Training in statistical methodology is a core component of undergraduate and graduate psychology programs (Aiken et al., 1990, 2008; Appelbaum et al., 2018; Counsell et al., 2016; Dahlman & Geisinger, 2015; Golinski & Cribbie, 2009; Ord et al., 2016; Stoloff et al., 2010). Indeed, the American Psychological Association (APA) Guidelines for the Undergraduate Psychology Major 2.0 list interpretation and communication of research as one of the guidelines, underscoring the importance of this training (American Psychological Association, 2016). Despite this necessity, many psychology majors have negative attitudes towards statistics courses and may also find them anxiety-inducing (Baloğlu, 2003; Conners et al., 1998; Dunn, 2000; Harlow, 2013; Onwuegbuzie, 1999, 2004; Onwuegbuzie & Wilson, 2003; Sizemore & Lewandowski, 2009; Smith, 2014). Research suggests that attitudes are almost as important as ability when predicting success in statistics courses, which is problematic, as a psychology student who has a negative attitude toward statistics may be at-risk for poorer course performance (Gunderson et al., 2011; Harlow et al., 2002, 2006; McCutchen et al., 2016; Ramirez et al., 2012; Ruggeri, 2011; Schutz et al., 1998; Sizemore & Lewandowski, 2009; Smith, 2014).
As statistics courses are required in many undergraduate psychology programs, yet are often viewed negatively, a growing body of research has explored ways to promote learning in the statistics classroom (Hulsizer & Woolf, 2009). Research shows attitudes toward statistics influence participation rates in the classroom and how well students understand the topics covered in the course (Baloğlu, 2003; Gunderson et al., 2011; Ruggeri, 2011; Schutz et al., 1998). Other research has explored reasons students have negative attitudes toward statistics courses, which include perceived difficulty (Garfield & Ahlgren, 1988) and previous negative experiences with statistics (Baloğlu, 2003; Gunderson et al., 2011). Thus, because negative attitudes influence participation and understanding in statistics courses, it is essential to research ways to promote a positive association between students and statistical learning (Ramirez et al., 2012).
Two psychological constructs that may be ideal to study in the context of statistics learning are grit and resilience. Grit, defined as passion and perseverance for long-term goals (Duckworth et al., 2007), and resilience, defined as adapting to adverse situations (Smith et al., 2008), are associated with academic achievement based on previous research (Bowman et al., 2015; Brook & Willoughby, 2015; Johnson et al., 2015; Wintre et al., 2011). Considering that statistics courses are viewed with a negative attitude (Baloğlu, 2003; Conners et al., 1998; Dunn, 2000; Harlow, 2013; Onwuegbuzie, 1999, 2004; Onwuegbuzie & Wilson, 2003; Sizemore & Lewandowski, 2009; Smith, 2014) by psychology students, students with negative statistics attitudes may have to either persevere through, or adapt to, their feelings when taking required statistics courses.
Previous research suggests grit and resilience are associated with math achievement (Al-Mutawah & Fateel, 2018; Johnston-Wilder & Lee, 2010; Kooken et al., 2013), but no known studies have examined grit and resilience specifically in terms of statistics achievement, which may be worthwhile to explore. In particular, the math-centric nature of statistics may lead to overlap in student attitudes between the two subjects. Moreover, grit and resilience are associated with social support from other students within the classroom (Clark et al., 2020; Frisby et al., 2020). As such, it may well be that students rely on their social support networks within statistics classrooms as a mechanism to be gritty and/or resilient as they make their way through statistics courses. Resilience may be especially related to social support networks, as there are multiple studies documenting the link between resilience and social support in both academic (Clauss-Ehlers & Wibrowski, 2007; Wilks & Spivey, 2010) and non-academic settings (Herbert et al., 2018; Ruisoto et al., 2020).
When considering ways to teach that promote positive relationships, researchers may wish to focus on the classroom environment and developing rapport from instructor to student and peer-to-peer. Within the college classroom, instructors and students often spend weeks of time together, developing relationships centered around common goals which can help or hinder learning (Hirschy & Wilson, 2002; McKinney et al., 2006). This concept of developing relationships within the classroom is related to better student outcomes and is known as classroom connectedness, defined as a supportive and cooperative environment (Dwyer et al., 2004). Research suggests that greater familiarity with peers in the classroom results in increased feelings of connection, increased knowledge related to classroom tasks (Sollitto et al., 2013), and greater participation rates (Frisby & Martin, 2010). Even classroom chatter, which can often be viewed as disruptive, was related to a greater sense of belongingness and higher levels of class enjoyment (Sandstrom & Rawn, 2015).
Research also suggests that student connectedness can positively influence students’ learning, based on student self-report (MacLeod et al., 2019). Student connectedness can mediate the relationship between instructor misbehaviors (e.g., apathy and lack of patience) and the likelihood of speaking up and participating more in class (Sidelinger et al., 2011). Therefore, even when there may be a lack of connection between the instructor and students, connections between peers can result in a more engaged classroom environment. Thus, it may well be that fostering an environment of high classroom connectedness within the statistics classroom could lead to more favorable attitudes toward statistics and better course outcomes. Low participation and negative attitudes are highlighted as key issues in teaching statistics courses (Baloğlu, 2003; Gunderson et al., 2011; Ruggeri, 2011; Schutz et al., 1998), so encouraging classroom connectedness may be an effective way to address these issues.
One way to study classroom connectedness is using social network analysis to explore the networks of students that exist in the classroom (Grunspan et al., 2014). Using social network data can provide an informative addition to traditional quantitative data (e.g., surveys, interviews, physiological measurements, and demographic questions), with which researchers are familiar. It also allows an extra layer to traditional quantitative research designs by quantifying relationships between research participants to create a structural network that can then be analyzed with statistical models (Sechzer & Rabinowitz, 2008; Wasserman & Faust, 1994). Networks can be described using graphs, which are composed of nodes/vertices, representing the individuals in a network, and edges/links, which represent relational ties between nodes (Kolaczyk & Csárdi, 2014; Wasserman & Faust, 1994). One family of network models commonly used in social network research are exponential random graph models (ERGMs). They are somewhat similar to regression models (i.e., generalized linear models), which form the basis of many quantitative analyses in psychology (Harlow et al., 2013).
We analyzed these data using ERGMs. Exponential random graph models utilize Markov Chain Monte Carlo (MCMC) maximum likelihood estimation to estimate the log-odds of the model effects on ties existing between people in an observed network. To determine the statistical significance of the parameters, the model estimates whether the observed network effects are more or less common than what would be expected from a random graph, where all ties have the same probability of occurring (Kolaczyk & Csárdi, 2014).
Terms included in the models were edges, reciprocity, and the effect of having a different level of an attribute on each of the scale scores, namely grit and resilience. The edges term is similar to an intercept term in traditional regression models: it is a measure of network density and indicates the log-odds of a tie existing in the network (Hunter et al., 2008). Reciprocity is the tendency for a tie to be reciprocated; that is, if someone says they are friends with me I will also say that I am friends with them (Wasserman & Faust, 1994). The difference term included for each scale score indicates a student’s tendency to have a tie with another student who has a different level of a certain attribute than they do (Hunter et al., 2008). For example, if there is a significant, positive difference effect for students on the grit scale, this means that students who have higher scores (indicating higher grit) are more likely to have ties with students who have lower scores on the grit scale (indicating less grit) than they are to have a tie with another student who also has a high level of grit. See the supplementary material on OSF (https://osf.io/n3cbv/) for a further discussion of social network analysis and ERGMs.
The purpose of this study was to explore levels of peer-to-peer classroom connectedness in undergraduate psychology statistics courses, specifically in the lab component of the courses where students met weekly to apply statistical methods covered in the classroom. This was done by examining the overall level of connectedness, and whether or not students were connected with other students in their lab based on experiencing similar (or dissimilar) levels of grit and resilience. Grit and resilience were chosen as covariate attribute variables because they are positively associated with academic achievement (Bowman et al., 2015; Brook & Willoughby, 2015; Johnson et al., 2015; Wintre et al., 2011). The primary aim of this study was to explore what the levels of connectedness were in the classroom, followed by the secondary aim of determining if connectedness was related to grit and resilience. It was hypothesized that both grit and resilience would be related to levels of connectedness within the classroom, with students being more likely to connect with other students if they have similar levels of grit and/or resilience. No intervention was performed in this study; instead, we explored the “baseline” connectedness rates which developed naturally over the course of the semester, with a goal of using these results to inform possible future intervention development.
Method
Participants
Students attended a mid-sized public university in the northeastern United States and were enrolled in the introductory statistics class for psychology majors in the spring semester in 2017. All students were taught by the same instructor in two class sections (section 1: N = 89, section 2: N = 64). Of the 153 eligible students, 110 chose to participate for an overall participation rate of 72%. The sample was predominantly White or of European descent (n = 67, 61%), with 9 (8%) participants identifying as Black or African American, 10 (9%) as Hispanic or Latino(a), 6 (5%) as Multiracial, 5 (5%) as Asian or Pacific Islander, 1 (1%) as Native American or Alaskan Native, and 12 (11%) choosing not to respond. The average age was 20.83 (SD = 2.87) and women made up the majority of the sample (n = 81, 74%), with 16 (15%) men, 1 (<1%) genderqueer student, and 12 (11%) choosing not to respond. Most students were either sophomores (n = 40, 36%) or juniors (n = 37, 34%), with three freshmen (3%), 18 seniors or higher (16%), and 12 (11%) choosing not to respond.
Materials
Social network survey
The social network portions of the surveys were specific to each lab. The first part of each survey asked how well they knew each one of the other students in the lab (excluding those who had opted out of being included in the survey), where 0 = “I do not know this person” to 5 = “I interact and spend time with this person frequently, we are very close,” and the type of relationship they had with the student. For example, did not know the person, the person was an acquaintance, they disliked the person, they lived in the same dorm, they played on a team/were in a club or organization together, they were in a study group together, they were friends on social media, they were friends in real life, they were significant others, or an “other” open-text option.
The networks in this study are directed because each participant indicated who they knew and interacted with in their labs, meaning that one student may have indicated having a relationship with another student while the student they nominated may have said they do not know them, resulting in a connection that was not reciprocated. Due to model constraints (i.e., models may not converge if model terms are too complex, resulting in no estimates), connections between students were treated as present or absent, rather than weighted edges. There are four possible connection types: both students do not know each other (no edge, i.e., there is no connection between the two); both students know each other (a mutual edge); student a knows student b, but student b does not know student a (a directed edge); and vice versa. Survey lengths varied by lab as these two questions (how well do you know this person and how do you know them, if at all) were asked for every other student within their respective lab. The number of students participating in each lab is provided in the Procedure section.
Grit scale
The Short Grit Scale (GRIT-S) was developed by Duckworth and Quinn (2009) to measure a person’s grit, which they define as passion and persistence toward achievement. The scale has eight items answered on a Likert-type 5-point response scale with answers ranging from 1 = not like me at all to 5 = very much like me. A higher score indicates having more grit. Previous research has provided evidence for convergent validity with measures of conscientiousness and discriminant validity with measures of extraversion of the GRIT-S (Duckworth & Quinn, 2009). Evidence for internal consistency was found for the GRIT-S in this study, with coefficient ϖ values of .82 or higher for each lab.
The Brief Resilience Scale
The Brief Resilience Scale (BRS) was developed by Smith and colleagues (2008) to measure how resilient a person is, meaning how well they “bounce back” from stress. The scale contains six items with a Likert-type 5-point response scale ranging from 1 = strongly disagree to 5 = strongly agree. A higher score indicates greater resilience. Evidence for convergent validity has been found for the BRS with measures of optimism and purpose in life (Smith et al., 2008). Evidence for internal consistency for the BRS was found in this study, with coefficient ϖ values of .88 or higher for each lab.
Procedure
Students had to attend a weekly lab session, which met during 10 out of 13 weeks of the semester, which was a component of the course. There were five lab sessions across the two class sections that were taught by five graduate teaching assistants (TAs), with the assistance of 10 undergraduate TAs, and each lab included at most 32 students. Labs met for 50 minutes on either Mondays, Wednesdays, or Fridays starting between 10:00 a.m. and 1:00 p.m. Students could choose the lab session that best accommodated their schedule, but were instructed to attend the same lab throughout the semester. Students were allowed to opt-out of having their name included on the social network portion of the survey. Ten students (32%) from Lab 1, eight students (25%) from Lab 2, six students (19%) from Lab 3, nine students (29%) from Lab 4, and 13 students (43%) from Lab five chose not to have their names included in the social network portion of the survey. However, the students who opted out of their name being included in the survey could still participate in the study, if they chose to do so. This led to participation rates of 23 out of 31 (74%) in Lab 1, 26 out of 32 (81%) in Lab 2, 25 out of 31 (81%) in Lab 3, 20 out of 31 (65%) in Lab 4, and 16 out of 30 (53%) in Lab 5. The lab with the lowest participation rate, Lab 5, was the only lab that met on Fridays.
Students were given the option to complete the survey online through Google Forms and were awarded one point of extra credit added to their overall grade if they did so. They were also offered alternative options to earn extra credit if they did not want to participate in the survey, to avoid coercion. Students were given a link to complete the survey and completed it on their own time. The survey was available for 3 weeks, including the last 2 weeks of the semester and the first week of final exams. Students were asked to provide their student ID number so we could ensure the networks were made correctly. The entire survey took between 20 to 30 minutes for students to complete. This study had institutional review board approval.
Analysis Plan
All analyses were conducted using R version 3.6.2 (R Core Team, 2019). The RColorBrewer (Neuwirth, 2014), psych (Revelle, 2017), igraph (Csárdi & Nepusz, 2006), network (Butts, 2008), and ergm (Hunter et al., 2008) R packages were used. We measured network descriptive statistics, specifically, transitivity, density, average betweenness, average degree, and degree assortativity for each network, with these terms described below. These descriptive statistics are used to characterize the networks—we can use them to determine how connected the students are within each lab. We then used ERGMs to determine if students were more likely to be connected to other students who share similar (or dissimilar) levels of grit and/or resilience.
Transitivity, also known as the global clustering coefficient, is a ratio of the total number of closed triplets (i.e., person
Density is a measure of how connected a network is; it is the proportion of actual connections over the total number of possible connections. Density ranges from 0 to 1, with 0 representing a network with no connections between nodes in the network and 1 representing a network with every node connected to every other node in the network (Wasserman & Faust, 1994). For example, if there is a friend group where everyone is friends with everyone else then the network density is 1 (all possible connections exist in the network). On the other hand, in a situation where people are randomly chosen for a focus group discussion where no one knows anyone else in the group, the network density is 0 (they are all strangers).
Betweenness is a count of the number of shortest paths going through a node; when a node has a high betweenness this indicates that the node is an important node in the network because the shortest paths between other nodes go through this node. It can be thought of as a sort of “bridge” between other nodes (Csárdi & Nepusz, 2006; Wasserman & Faust, 1994). When a node has low betweenness, that means that the node is likely at the end of a network and few, if any, paths between other nodes go through this node. Networks with low average betweenness tend to be sparse and spread out, possibly having clusters of people who are not connected to anyone else. This can be illustrated by a classroom where most students do not know one another and there are only a few pairs or trios of students who interact with one another. Networks with high average betweenness tend to be well-connected with many people representing the shortest path through a network. This can be illustrated by a sports team where all of the players are teammates and know each other and interact with each other. When new players join the team, they may get to know and interact with a few other teammates at first and those teammates can act as a bridge to introduce the new players to the rest of the team.
Degree is how many connections a person has in a network. In a directed network, this includes both connections going out (I say I am friends with someone else) and connections coming in (someone else says they are friends with me). Degree can range from 0 (a person has no connections in the network, also called an isolate) to
Assortativity is the tendency for nodes to connect (or not connect) with other nodes in the network that are similar. In this case, degree assortativity is the tendency for nodes with a high degree to connect to other nodes with a high degree and nodes with a low degree to connect with other nodes with a low degree. Similar to a correlation coefficient, this value can range from −1 to 1, with negative values indicating that people are more likely to be connected to dissimilar people, positive values indicating that people are more likely to be connected to similar people, and a value of 0 representing no association (Newman, 2003). Celebrities are an example of people whose friendship networks likely have high degree assortativity—if they tend to be friends with other famous people. Celebrities would be considered “high degree” nodes because many people know who they are and follow them on social media platforms, creating an unreciprocated connection from social media followers to the celebrities.
Results
Network Descriptive Statistics
Network descriptive statistics were calculated for each lab to determine levels of connectedness. The primary goal of this study was to examine how connected students are in their psychology statistics labs. Lab 1 had the highest level of transitivity (0.51), while Lab 4 had the lowest transitivity (0.00). This reveals that about half of the triangles in Lab 1 were closed, indicating that the network is fairly clustered or cohesive, whereas there were no closed triangles at all in Lab 4. Lab 2 was the densest (.10) and Lab 4 was the least dense (.04) of the five labs, although a density of .10 indicates a fairly sparse network, meaning all five of the labs were sparse (i.e., there were not a lot of connections among students in the labs). Lab 2 had the most connections, with 70 connections total, whereas Lab 4 had the fewest connections, with a total of 15. Average betweenness, which can range from 0 (i.e., a network of isolates with no shortest paths) to
Average degree, which can range from 0 to
Descriptive Network Statistics.
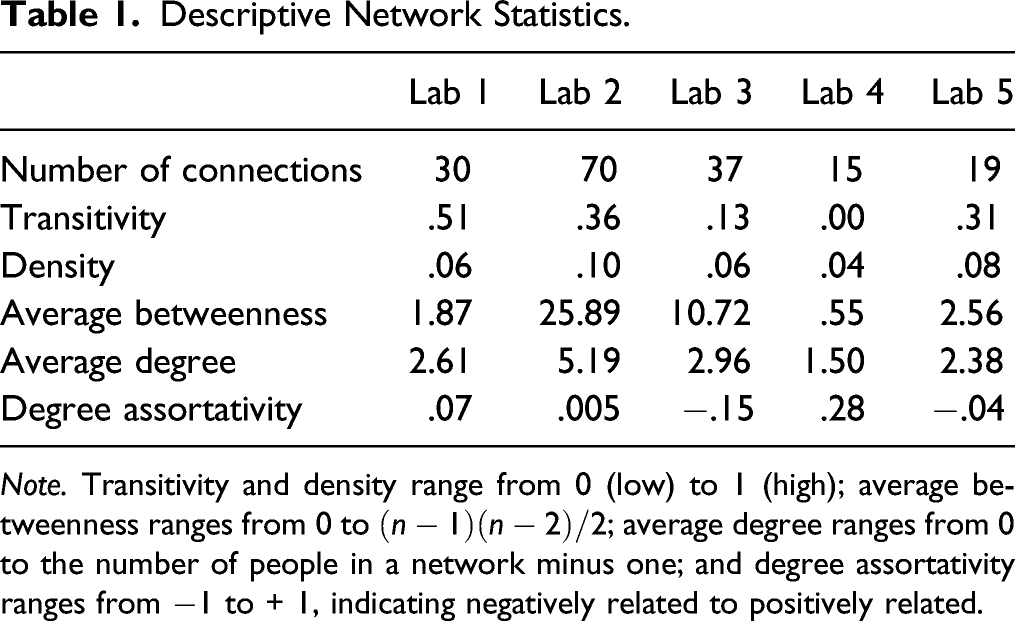
Note. Transitivity and density range from 0 (low) to 1 (high); average betweenness ranges from 0 to
Exponential Random Graph Models
EGRM Results by Lab.
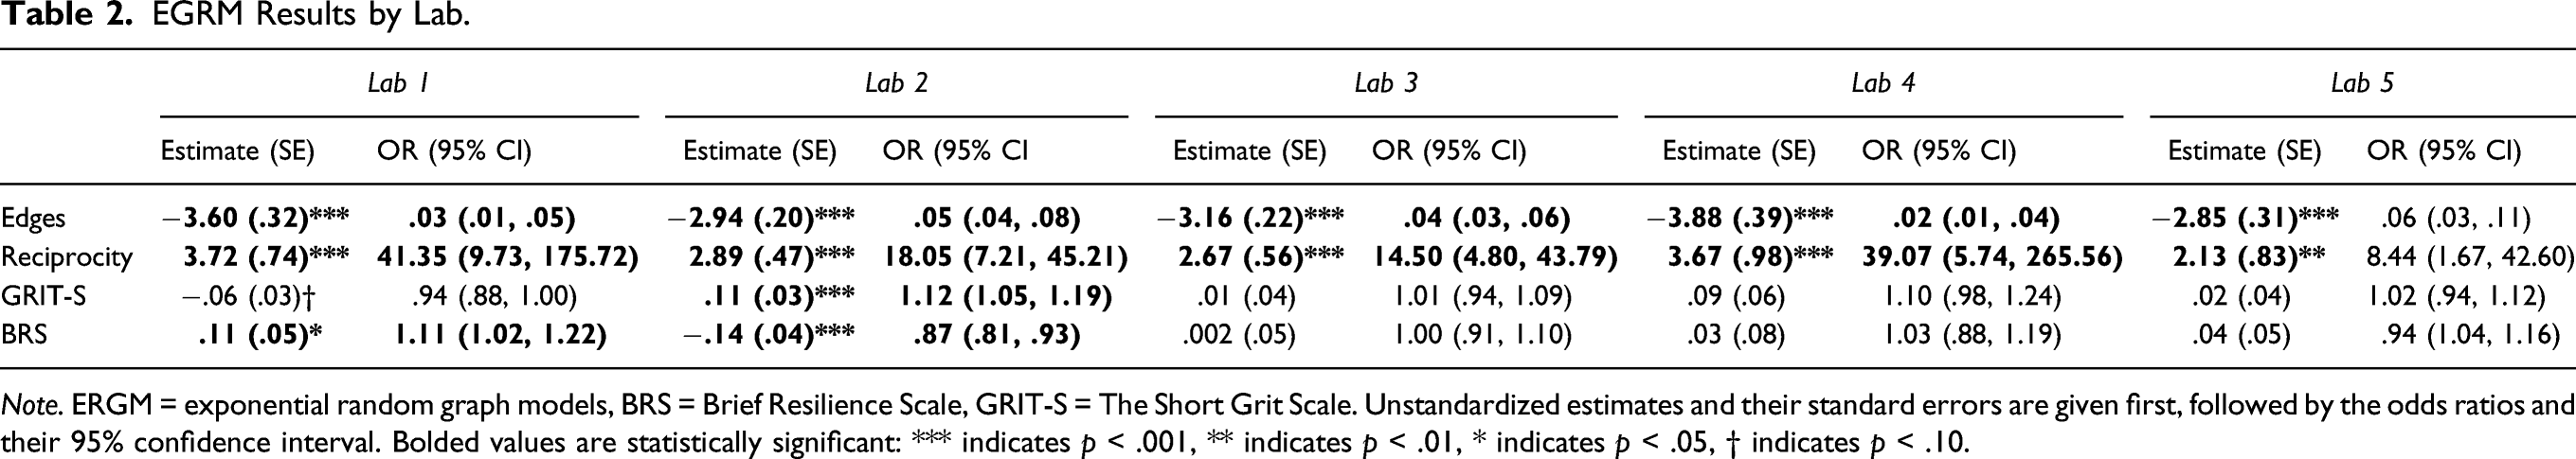
Note. ERGM = exponential random graph models, BRS = Brief Resilience Scale, GRIT-S = The Short Grit Scale. Unstandardized estimates and their standard errors are given first, followed by the odds ratios and their 95% confidence interval. Bolded values are statistically significant: *** indicates p < .001, ** indicates p < .01, * indicates p < .05, † indicates p < .10.
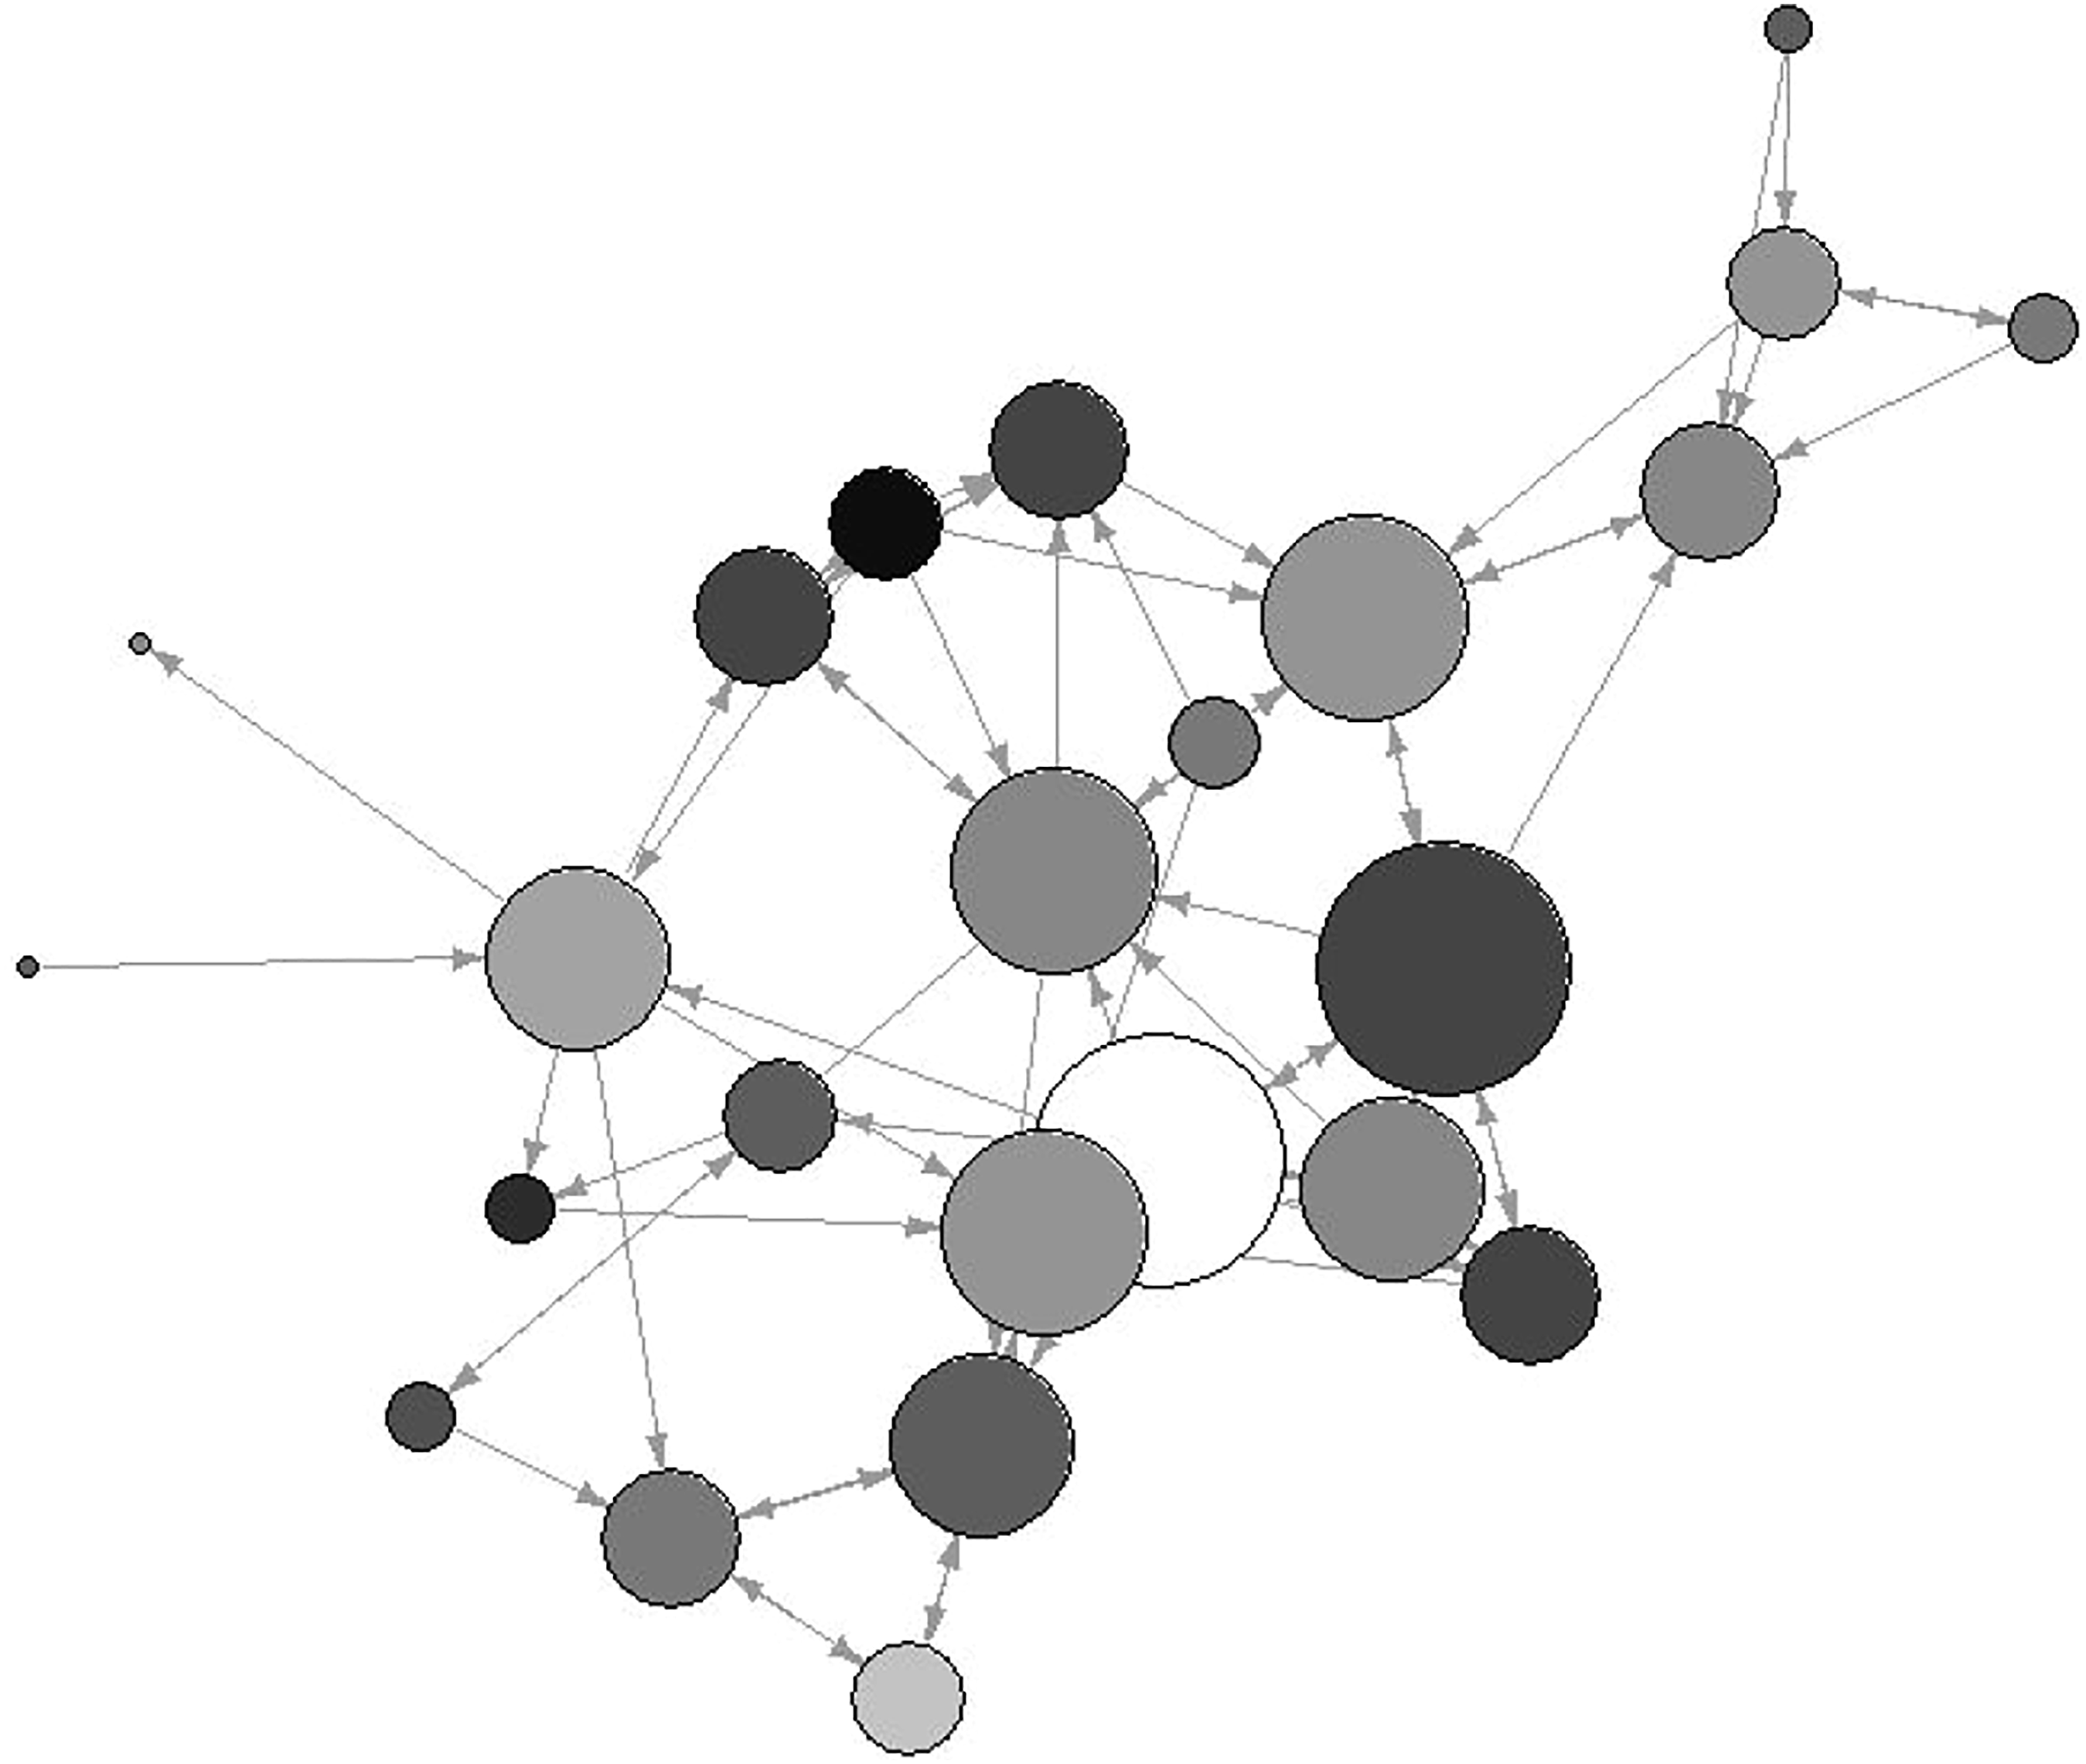
In Lab 2, the most well-connected lab, both the GRIT-S and BRS difference terms were statistically significant (see Table 2). Students had 1.12 times the odds of having a tie with another student if that student had a different score on the GRIT-S, indicating a tendency against homophily for grit. Thus, students with high GRIT-S tended to reciprocate a tie with those who were not very high in GRIT-S. This pattern is illustrated in Figure 1, with nodes not grouped together based on color, indicating different levels of grit, but instead nodes with different colors (black, white, and shades of gray) are connected to one another. A few with very high grit scores (indicated by black or dark gray) are connected to nodes with low grit scores (indicated by white or light gray). In contrast, students were less likely to have a tie with another student if that student had a different score on the BRS, indicating a tendency toward homophily for resilience (i.e., reciprocating a tie with others who had similar levels of resilience). This pattern is illustrated in Figure 2, as the nodes tend to be clustered around similar nodes, with fewer connections between nodes of different colors (indicating different levels of resilience). More nodes have a medium gray color, indicating a resiliency score in the middle of the scale and nodes are mostly connected to other nodes with a similar shade of gray. Lab 2 Plot. Note. Colors indicate score on the GRIT-S: white is a low score (less than or equal to a score of 24, meaning the person chose “not much like me” and “somewhat like me” for their answers, indicating not being very high on the grit scale), black is a high score (score at or above 32, meaning the person chose “mostly like me” and “very much like me” for their answers, indicating being very high on the grit scale, and gray is a score in the middle (between 25 and 31). Node size is based on degree (how many connections a student has in the lab). Three isolates (students with no connections to any other students in the lab) are not pictured. Lab 2 Plot. Note. Colors indicate score on the Brief Resilience Scale: white is a low score (less than 18, meaning the person was neutral or disagreed with most statements, indicating a low level of resilience), black is a high score (25 or greater, meaning the person agreed or strongly agreed with most statements, indicating a high level of resilience), and gray is a score in the middle (between 18 and 24). Node size is based on degree (how many connections a student has in the lab). Three isolates (students with no connections to any other students in the lab) are not pictured.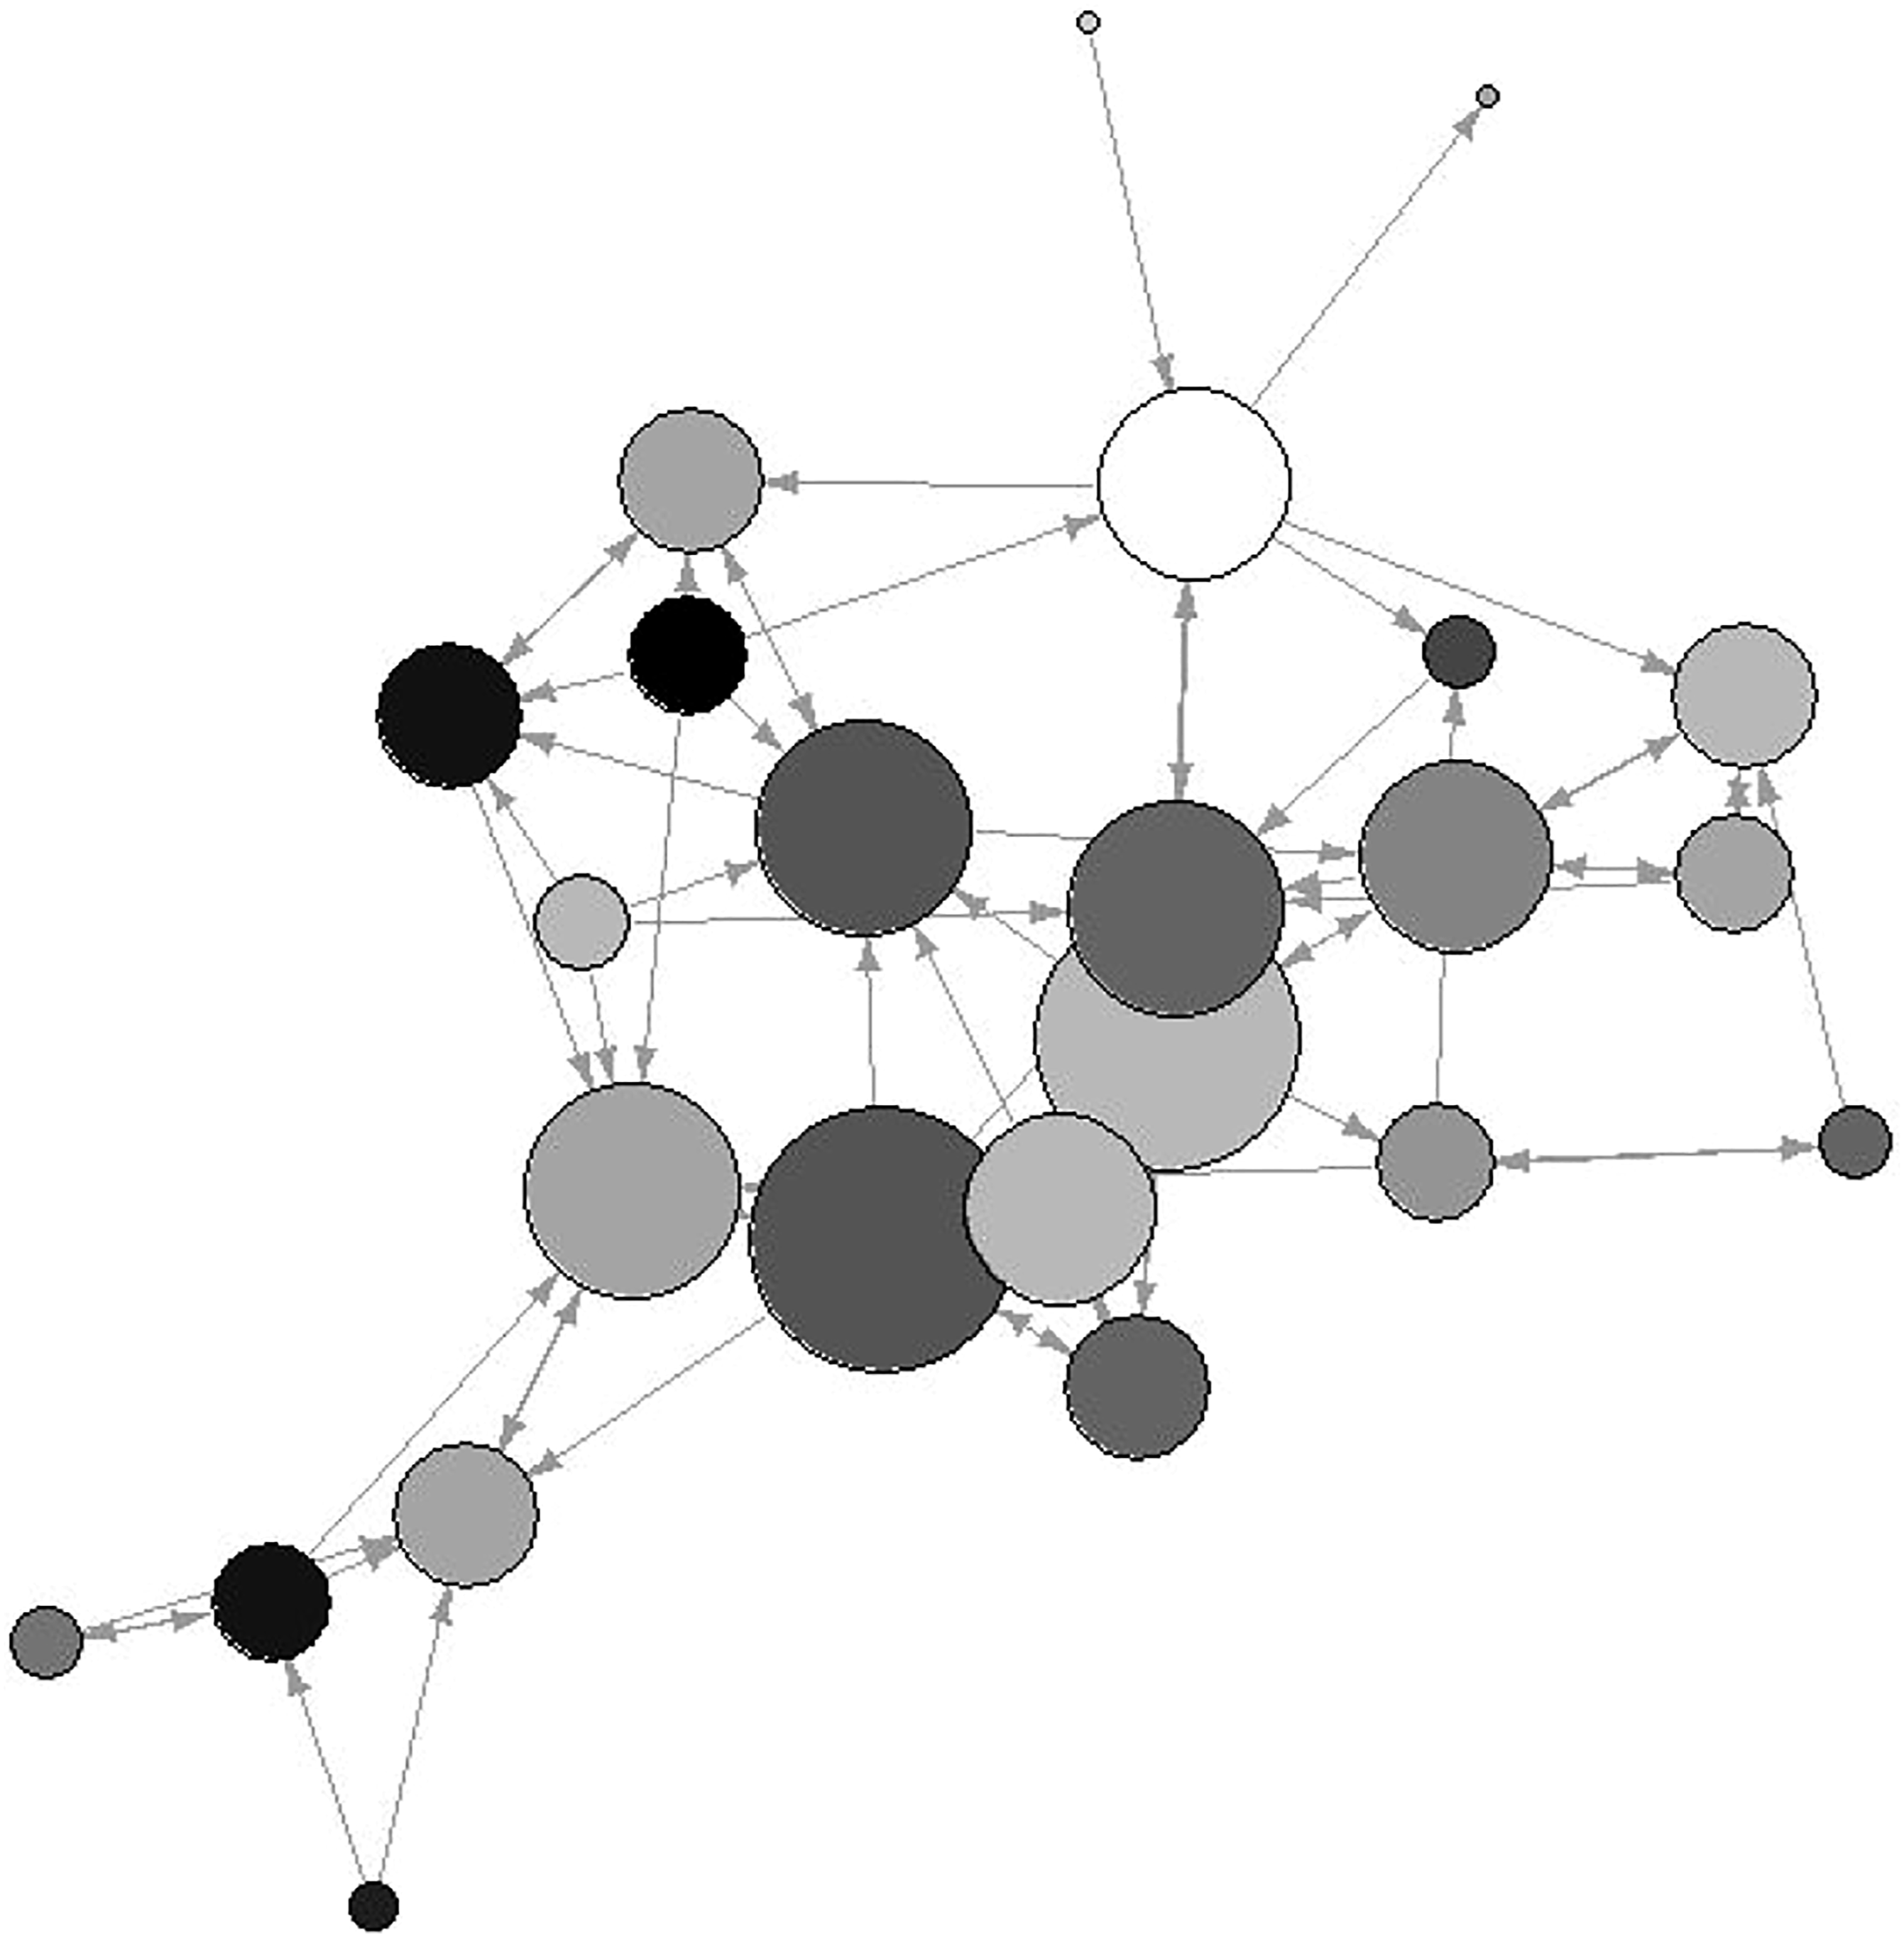
In Lab 1, results show that students were more likely to have a tie with another student if that student had a different score on the BRS, with 1.11 times the odds of having a tie with another student if that student had a different score on the BRS, indicating a tendency against homophily for resilience in that lab. Labs 3, 4, and 5 did not have statistically significant results for either the BRS or the GRIT-S. See Table 2 for all ERGM results.
Discussion
The purpose of this study was to explore peer-to-peer classroom connectedness in psychology statistics classrooms, and to assess whether these connections were related to covariates (i.e., grit and resilience) known to influence academic achievement (Bowman et al., 2015; Brook & Willoughby, 2015; Johnson et al., 2015; Wintre et al., 2011). The results indicate that not all student networks are the same, even in settings where one might think the networks should be similar. This was indicated by the different levels of connectivity between the labs, measured via number of connections, transitivity, density, betweenness, degree, and assortativity, with Lab 2 having the highest level of connectivity overall. Indeed, similar networks may have been expected in this sample where students were enrolled in the same psychology statistics class, even though students were in smaller groups for the lab section of the course.
Results also indicate that students may have connections to other students based on grit and resilience (Clauss-Ehlers & Wibrowski, 2007; Frisby et al., 2020; Kooken et al., 2013; Wilks & Spivey, 2010), though students do not necessarily connect to others with similar levels of grit and/or resilience. Students in Lab 2 who were higher in grit were more likely to be connected to students lower in grit. This suggests that students higher in grit may have served as a social support to students lower in grit in a more connected classroom environment. Additionally, students of similar levels of resilience were more likely to be connected, further suggesting this component of shared social support (Clark et al., 2020; Frisby et al., 2020). However, these connections may only be meaningful in labs that are well-connected, such as Lab 2. We found that students in Lab 1, a not well-connected network, showed greater odds of being connected if they had dissimilar levels of resilience. Although these results are contradictory, they could be further support for the finding that not all student networks are the same, even where we would expect networks to be similar as we might for psychology statistics labs. Therefore, future research should examine the possible mediating role of resilience and/or grit between student connectedness and classroom performance, while also considering baseline levels of connectedness and how that is related to any covariates of interest, as results could be influenced due to baseline differences in classrooms.
Another way to interpret these findings is that connectivity in undergraduate psychology statistics labs is uncommon, and it may well be the norm to have relatively few connections among peers in this setting. One reason for low connectivity in this study may be due to the sample which consisted of a mix of residential and commuter students, who may have had varying connections to the campus and therefore other students. If low connectivity is indeed typical of psychology statistics labs, this may be an opportunity for instructors to conduct interventions that promote connectivity and improve student outcomes in the psychology statistics course. Interventions to promote connectivity have previously been used in mathematics classrooms (Irving et al., 2016; Pape et al., 2012), and could be implemented by the instructor with the potential to promote student engagement and achievement (Sidelinger & Booth-Butterfield, 2010; Sidelinger et al., 2011). As suggested by a reviewer for this article, an ideal next step in this area of research would be a manipulation aiming to increase connectivity and other outcomes which could be utilized and measured. Future research will be needed to examine if low connectivity is the norm, and if said interventions would be effective. However, promoting peer-to-peer connectivity may well be a promising way to promote learning in the psychology statistics classroom.
Conclusion
Limitations and Future Research
Limitations of this study include convenience sampling, suboptimal response rates, and a relatively high number of students choosing to not have their names included in the network survey. This was of major concern to the researchers conducting this study, as there were likely other connections occurring in the classroom that went unobserved. However, the authors of this study considered it ethically questionable to list the real names of students in the online surveys without their consent (Buchanan & Hvizdak, 2009). Considering that methodology is an ethical consideration (Markham & Bride, 2006), the researchers opted to err on the side of caution and used this opt-out system, which has resulted in this major limitation. Future research may wish to probe into the ethical considerations of listing student names in surveys or finding other solutions to ensure student autonomy is maintained while conducting classroom connectedness research.
Moreover, the sample was predominantly White (61%) and women (74%), which limits the generalizability of the results to other demographics. About 25% of participants chose to not provide demographic information; they may not have felt comfortable providing information which could potentially identify them. Additionally, the cross-sectional nature of the data does not allow for any causal inferences and the results should be interpreted as such. Lastly, the validity of grit as a unique construct is controversial (Credé et al., 2017), and is not always associated with academic achievement (Bazelais et al., 2016), so researchers may wish to focus on resilience or other variables associated with academic achievement moving forward.
In future research, it would be ideal to have more complete network data, larger networks, and longitudinal data to examine change over time. Researchers could also investigate classroom connectedness in advanced psychology statistics courses and in different populations (i.e., graduate students and STEM students), and use other, or more direct, measures of academic achievement rather than grit and resilience. Additionally (as suggested by a reviewer for this article), researchers could collaborate across universities to compare psychology statistics classrooms across campuses with different student populations. Many students at the university in this study live on-campus and thus it could be interesting to compare these findings to students at commuter-oriented campuses. Moreover, previous research suggests that personalized instructor connection in larger classes can potentially mitigate previous poor performance and lead to improvement over time (Isbell & Cote, 2009). Therefore, future research is needed to further examine the role of the instructor in fostering classroom connectedness in addition to peer-to-peer contact.
The results of this study suggest that the lab sections of psychology statistics classes may be relatively unconnected, but the little connection which does exist could be associated with variables (i.e., grit and resilience), which may be related to academic outcomes. As such, these findings are pilot data that could be used to foster further research into connectedness in the psychology statistics classroom using a social network analysis framework. If these findings are replicated and extended by others, it could be useful for instructors to put more effort toward promoting classroom connectedness, as that could lead to increased participation, stronger academic performance, and more favorable attitudes toward statistics—three main issues in the teaching statistics literature (Baloğlu, 2003; Gunderson et al., 2011; Ruggeri, 2011; Schutz et al., 1998). Promoting classroom connectedness could be a promising way to improve student experience in the psychology statistics course, which could, in turn, improve academic outcomes.
Footnotes
Declaration of Conflicting Interests
The author(s) declared no potential conflicts of interest with respect to the research, authorship, and/or publication of this article.
Funding
The authors disclosed receipt of the following financial support for the research and/or authorship of this article: Thanks are extended to a National Institutes of Health Grant G20RR030883 for L. L. Harlow (PI: Donald H. DeHayes).
Availability of Data and Material
We are willing to make our de-identified data available.
Code Availability
Code is available on the first author’s GitHub page and on our OSF page.