
Abstract
Background:
Allen, Fielding, East, et al. demonstrated experimentally that structural awareness, or the ability to disregard a research problem’s topic and instead focus on its structural features, can be trained using StatHand (https://stathand.net). Most training benefits persisted for 1 week.
Objective:
The objective was to assess the longer-term effects of training.
Method:
One year after training (or control activities), 54 participants were re-administered 5 measures of structural awareness and 1 statistic selection measure.
Results:
Trained participants continued to reliably out-perform control participants on 4 measures of structural awareness, though no longer on the 5th. Over the year, decrements in trained participants’ performance on the 5 structural awareness measures were mostly small. However, 1 year after training, the trained participants’ statistic selection advantage had largely disappeared.
Conclusion:
Brief structural awareness training can have long-term benefits, though selecting an appropriate statistical test for common research scenarios without assistance remains a difficult task.
Teaching Implications:
Structural awareness can be trained. However, even structurally aware students cannot reliably select appropriate statistics without assistance. Training plus easy access to a decision-making aid should maximize statistic selection accuracy. Our evidence-based training methods and materials, including StatHand, can be freely used and adapted for these purposes.
The ability to select appropriate statistical analyses for common research questions and designs is one of the undergraduate learning goals specified by the Society for the Teaching of Psychology Statistical Literacy Task Force (2014). Psychology students find this process difficult (Gardner & Hudson, 1999; Ware & Chastain, 1989). To make it easier, a range of decision aids have been developed. Chief amongst these are decision trees, which routinely feature in introductory statistics textbooks (e.g., Nolan & Heinzen, 2017). Paper decision trees are both popular and effective (Protsman & Carlson, 2008). However, they are also constrained by their format, which necessitates brevity and the separation of the tree from information that would aid its navigation (e.g., definitions, examples). Digital learning technologies can overcome these constraints. It was in this context that StatHand was developed (Allen, Roberts, et al., 2016). StatHand is a free iOS/iPadOS and web (see https://stathand.net) application that asks users a series of annotated questions about their research design and, based on the answers they provide, suggests an appropriate statistical analysis. In an experimental evaluation (Allen et al., 2019), psychology students randomized to StatHand demonstrated higher statistic selection accuracy than students randomized to three other common decision-making aids (a familiar paper decision tree, a familiar textbook, and the decision tree and textbook combined; δ = 0.50–0.64).
Despite outperforming the control groups by at least half a standard deviation, the StatHand group’s performance was still underwhelming (Allen et al., 2019). On average, they identified appropriate analyses for just 35% of the research scenarios they were shown. On most university marking scales, this would be a clear “fail.” This suggests that simply providing an aid like StatHand is not enough to promote accurate statistic selection. Rather, to use it effectively, students require some training.
The training described in Allen, Fielding, East, et al. (2020) targeted a mechanism proposed to underpin statistic selection competence: structural awareness. Structural awareness reflects the ability to disregard the surface/topic level features of a research design and focus instead on its deep structural characteristics (Quilici & Mayer, 2002). These structural characteristics include the number and nature of the design’s independent and dependent variables, as well as the associations between them. Most psychology students are not naturally structurally aware (Allen, Dorozenko, & Roberts, 2016; Rabinowitz & Hogan, 2008).
In Allen, Fielding, East, et al. (2020), 102 psychology students were randomized to a training or control group. The training group completed scaffolded activities in which they used StatHand to select appropriate statistics for four simple research designs (two-group independent and paired samples designs with ratio or dichotomous dependent variables; DVs). These activities, which took around 30 minutes to complete, highlighted the deep structural characteristics of each design, and encouraged students to reflect on how and why these characteristics were related to the statistics they selected. The control group used an origami iPad application for a similar amount of time. Following this, all participants completed five measures of structural awareness, and a statistic selection task. The first two structural awareness measures were triad judgment tasks. In these, participants chose which of two comparison research scenarios “goes best” with a target research scenario. The target and comparison scenarios shared surface (S) characteristics, deep (D) structural characteristics, or neither (N). Consistently choosing D comparison scenarios over S or N indicates structural awareness. The two triad judgment tasks were combined with two explanation tasks in which participants described why each selected comparison scenario “goes best” with the relevant target. People who consistently identify relevant structural characteristics (e.g., the nature of the design) are structurally aware. The fifth measure of structural awareness was a scenario generation task in which participants wrote new scenarios that were “similar” to the target scenarios from the triad judgment and explanation tasks. Finally, for the selection task, participants chose an appropriate statistical analysis for each target scenario. One week later, 99 participants returned for a second wave of testing. The Time 2 scenarios were structurally equivalent to those used at Time 1, although they had different surface characteristics.
We found that the trained group outperformed the control group on all five measures of structural awareness immediately following training, and again one week later (δ = 0.71–1.60). At both time points, the trained group also demonstrated stronger statistic selection skills (δ = 0.52 and 0.57). Finally, the only measure on which the trained group’s performance declined between Times 1 and 2 was the scenario generation task. Consequently, we encouraged educators to adapt our methods and materials for classroom activities and published additional guidance and resources to facilitate this (Allen, Fielding, Kay, & East, 2020).
That the trained participants largely held on to their new abilities for one week is impressive. However, one week will not carry them through their degrees and into their professional lives. Consequently, in this study, we sought to re-visit the same sample 12 months later. We hypothesized that trained participants would continue to score higher than control participants on the five measures of structural awareness and the statistic selection task. We also hypothesized that trained participants’ structural awareness and statistic selection abilities would not have decreased since they were previously tested.
Method
Design
This was a pre-registered (see https://osf.io/tv2fw) mixed factorial experiment with one randomized between-subjects independent variable (IV; condition: training or control), one within subjects IV (time: Time 1 immediately following training, Time 2 one week later and Time 3 one year later) and six DVs. Five DVs reflect structural awareness (the S-D and D-N triad judgment and explanation tasks, and the scenario generation task). The sixth, selection skills, reflects the ability to correctly identify appropriate statistical analyses for familiar research scenarios. During testing participants also completed a series of Surface vs. Neither (S-N) triad judgment trials. As the meaning of performance on these trials is ambiguous, its analysis is confined to section S1 of the online supplement at https://osf.io/gtxvb/.
Participants
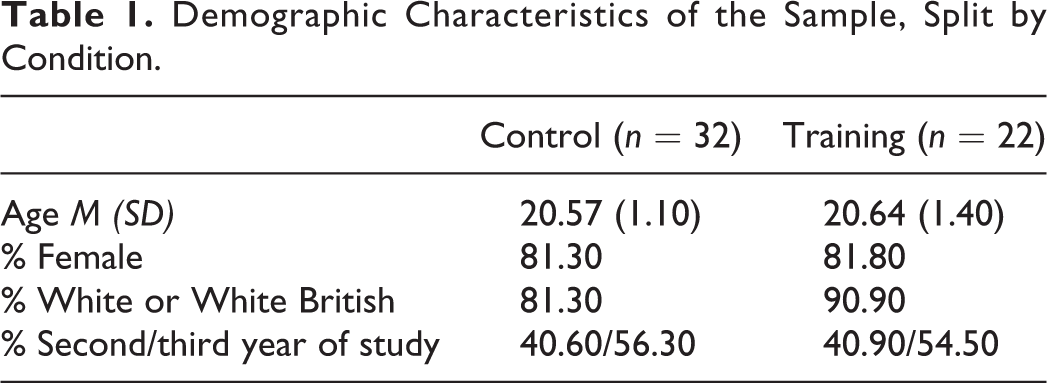
Based on a priori power considerations, we recruited 102 undergraduate psychology subject pool members to the original sample (Allen, Fielding, East, et al., 2020). Ninety-nine completed both parts of the study. We contacted each one year (±two weeks) after their initial training/testing and re-recruited 54 into this study. Each was compensated with their choice of subject pool credit or cash (£15/£25 for current/graduated students). Evidence indicating that these participants did not systematically differ from those in the original sample who ignored or declined our most recent invitation to participate is in S2 of the online supplement. The trained and control groups were demographically very similar (see Table 1).
Demographic Characteristics of the Sample, Split by Condition.
Measures and Procedure
The measures and procedure in this study were identical to those used at Time 2 by Allen, Fielding, East, et al. (2020), with the exception that 11 participants (control n = 6, training n = 5) were tested online. This was due to the UK COVID-19 “lockdown,” and the only deviation from our pre-registration. Testing took, on average, 50 minutes (SD = 17 minutes). The average time span between Times 1 and 3 was 369 days (SD = 14 days).
Data Analysis
We analyzed our data using Bayesian methods, which are of particular value when researchers need to quantify the strength of evidence in favor of the null hypothesis (H0). We had hoped to do this for our second hypothesis, which predicted the absence of change over time. A parallel set of frequentist analyses are in S3 and S4 of the online supplement. Both sets of analyses suggest the same conclusions. Our raw and processed data are available at https://osf.io/p7b4m/ and our data dictionary is in S5 of the online supplement. Confirmatory analyses are defined as those for which a pre-registered hypothesis and analysis plan were specified. All other analyses are considered exploratory.
Confirmatory analyses
It was hypothesized that trained participants would score higher than control participants on each of the six DVs at Time 3. These hypotheses were tested with one-sided Bayesian independent samples t-tests. It was also hypothesized that the trained students’ structural awareness and statistic selection skills would not have decreased since they were previously tested. These hypotheses were tested using Bayesian one-way repeated measures ANOVAs with planned comparisons. The planned comparisons were two-sided Bayesian paired samples t-tests.
Exploratory analyses
We used one-sided Bayesian independent samples t-tests to compare the training and control groups on each DV at Times 1 and 2, and one-way Bayesian repeated measures ANOVAs with planned comparisons to test for changes in the control group’s performance on each DV since they were previously tested. Planned comparisons were also used to compare Time 1 and 2 performance for both conditions. Finally, two-sided one-sample Bayesian t-tests were used to compare each group’s performance to “chance” on the S-D and D-N triad judgment and selection tasks.
The Bayesian analyses were implemented in JASP 0.13 using default prior widths (r = .500 and .707 for the ANOVAs and t-tests respectively; Wagenmakers et al., 2018), and robustness analyses (for the t-tests only) were used to determine the extent to which our conclusions would vary across a range of alternative prior widths. The Bayes Factors (BFs) we have calculated represent the probability of the observed data under the research hypothesis (H1, there is an effect, in the specified direction where applicable) relative to the null hypothesis (H0, there is no effect). As such, they quantify the strength of evidence in favor of either H1 or H0. Common heuristics suggest that BFs between 3 and 10 provide moderate evidence for H1, whereas progressively larger BFs provide strong (BF = 10–30), very strong (BF = 30–100) and extreme (BF > 100) evidence for H1. In contrast, BFs between .33 and .10 provide moderate evidence for H0, whilst BFs between .10 and .03, .03 and .01, and < .01 provide strong, very strong and extreme evidence for H0, respectively (Wagenmakers et al., 2018). BFs between 3 and .33 are considered non-diagnostic, in the sense that they provide merely anecdotal evidence for either H1 (0–3) or H0 (0–.33). We have used δ, a population estimate of the standardized difference between two means, as a measure of effect size for all pairwise comparisons. Finally, we can be 95% confident that the true value of δ lies within its 95% Bayesian Credible Interval (BCI; Wagenmakers et al., 2018).
Results
Confirmatory Analyses
The Time 3 rows in Table 2 (and rightmost third of each graph in Figure 1) indicate that the trained participants continued to reliably out-perform the control participants on four measures of structural awareness (the S-D and D-N triad judgment and explanation tasks; median δ = 0.80), though no longer on the fifth (the scenario generation task; δ = 0.47). Furthermore, by the third testing session, the trained group no longer reliably outperformed the control group on the selection skills task (δ = 0.25). To aid interpretation, the δs and associated 95% BCIs for these comparisons are illustrated by the darkest bars in Figure 2.
Descriptive Statistics and Bayesian Summary Information for the Comparisons Between Conditions at Each Testing Time.
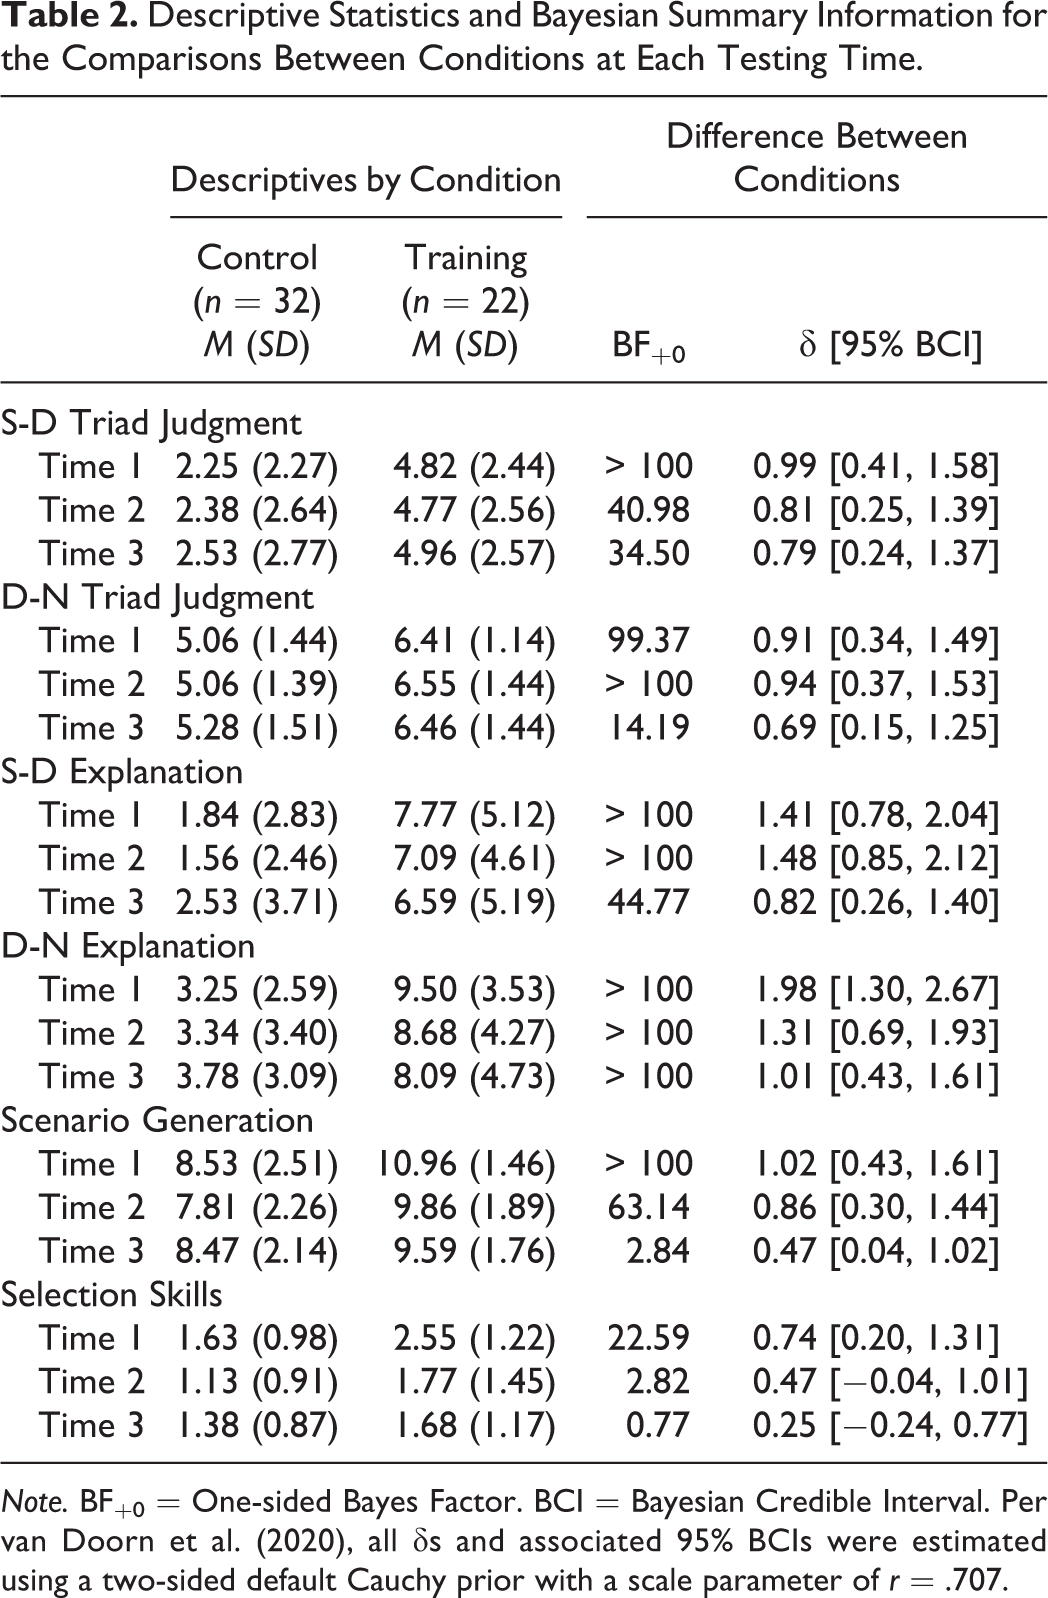
Note. BF+0 = One-sided Bayes Factor. BCI = Bayesian Credible Interval. Per van Doorn et al. (2020), all δs and associated 95% BCIs were estimated using a two-sided default Cauchy prior with a scale parameter of r = .707.
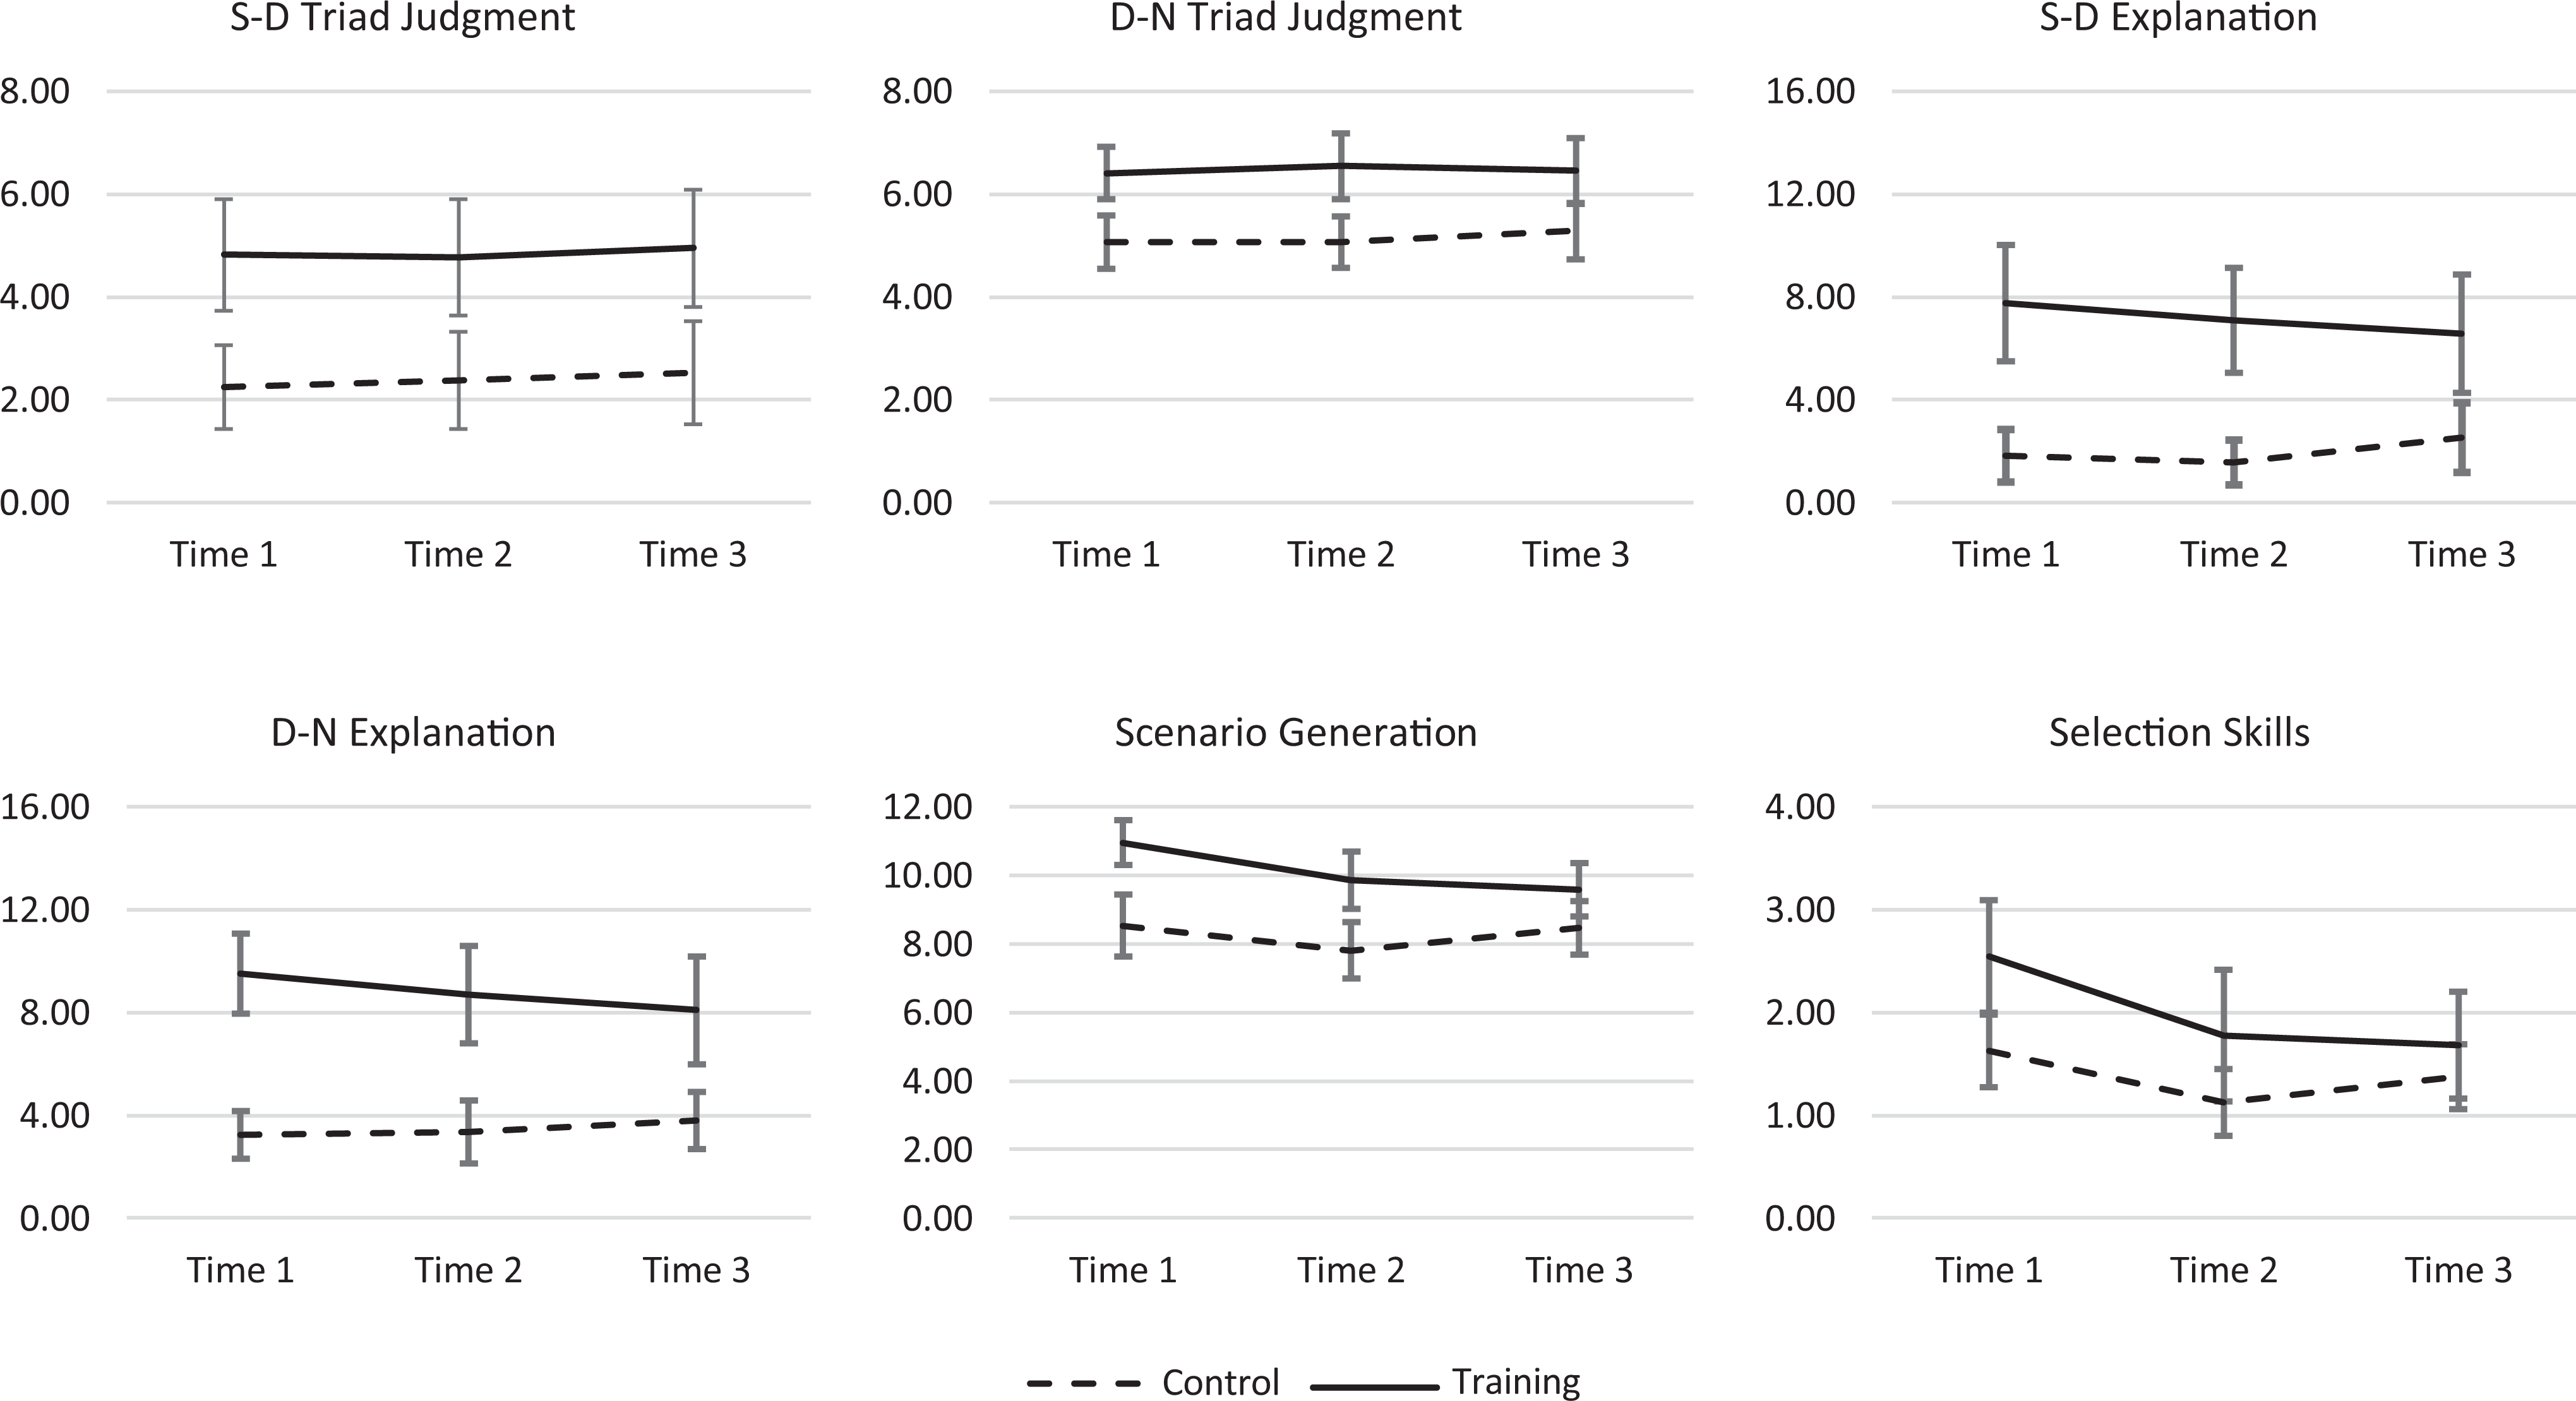
Means and 95% Bayesian credible intervals for each condition at each testing time. Note. To aid interpretation, the Y-axis on each graph spans the full possible range of values for each outcome variable.
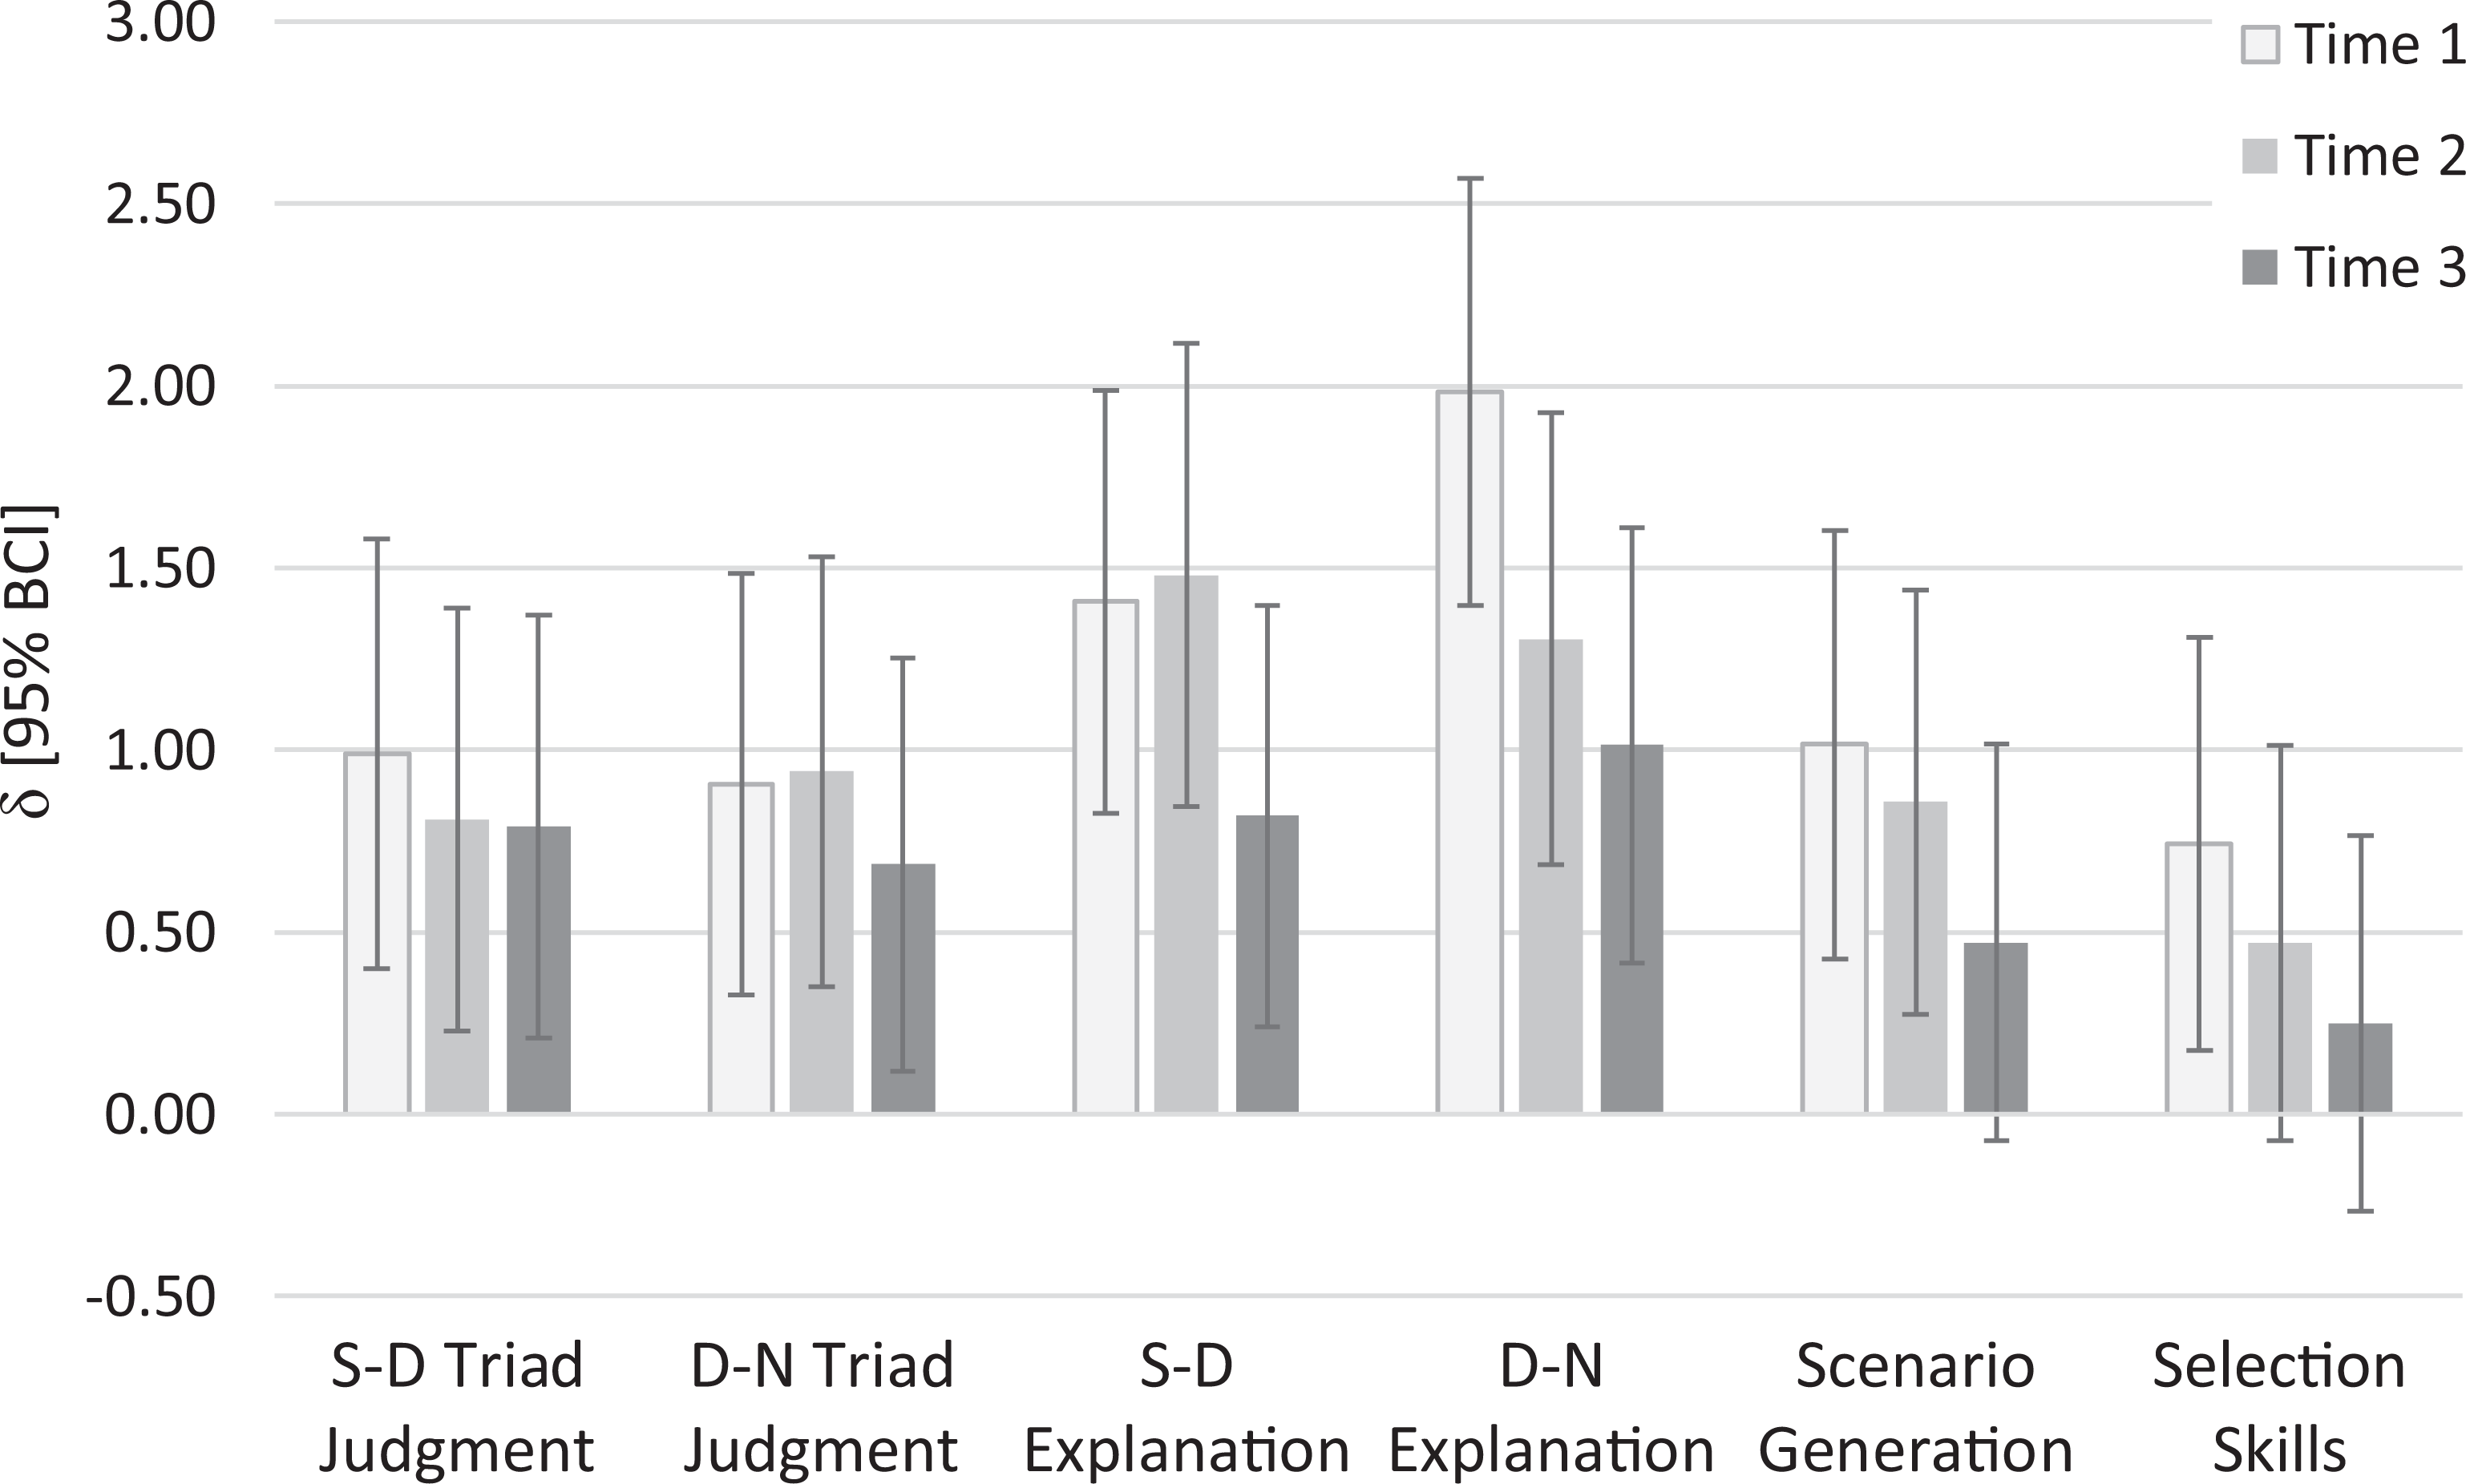
Standardized differences (δ) between conditions at each testing time. Note. BCI = Bayesian Credible Interval. Per van Doorn et al. (2020), all δs and BCIs were estimated using a two-sided default Cauchy prior with a scale parameter of r = .707. A positive δ indicates that the trained group outperformed the control group on the relevant outcome variable.
The right-hand side of Table 3 (and solid lines in Figure 1) indicates that decrements in the trained group’s performance on the five structural awareness measures from Times 1 to 3 (median δ = −0.24) and 2 to 3 (median δ = −0.10) were mostly small. Of the 10 BFs for these comparisons, seven indicated moderate and two suggested anecdotal evidence in favor of H0. The remaining comparison, between scenario generation scores at Time 1 and Time 3, indicated a clear reduction in performance (BF10 = 35.33, δ = −0.74). However, most of this reduction occurred between the first two waves of testing (δ = −0.67), rather than the second and third. There was also a clear reduction in selection skills between Times 1 and 3 (BF10 = 7.84, δ = −0.59), though very little of this occurred since the second testing session (δ = −0.05). Robustness analyses for all pairwise confirmatory analyses are in S6 of the online supplement.
Bayesian Summary Information for the Differences Between Testing Times, by Condition.
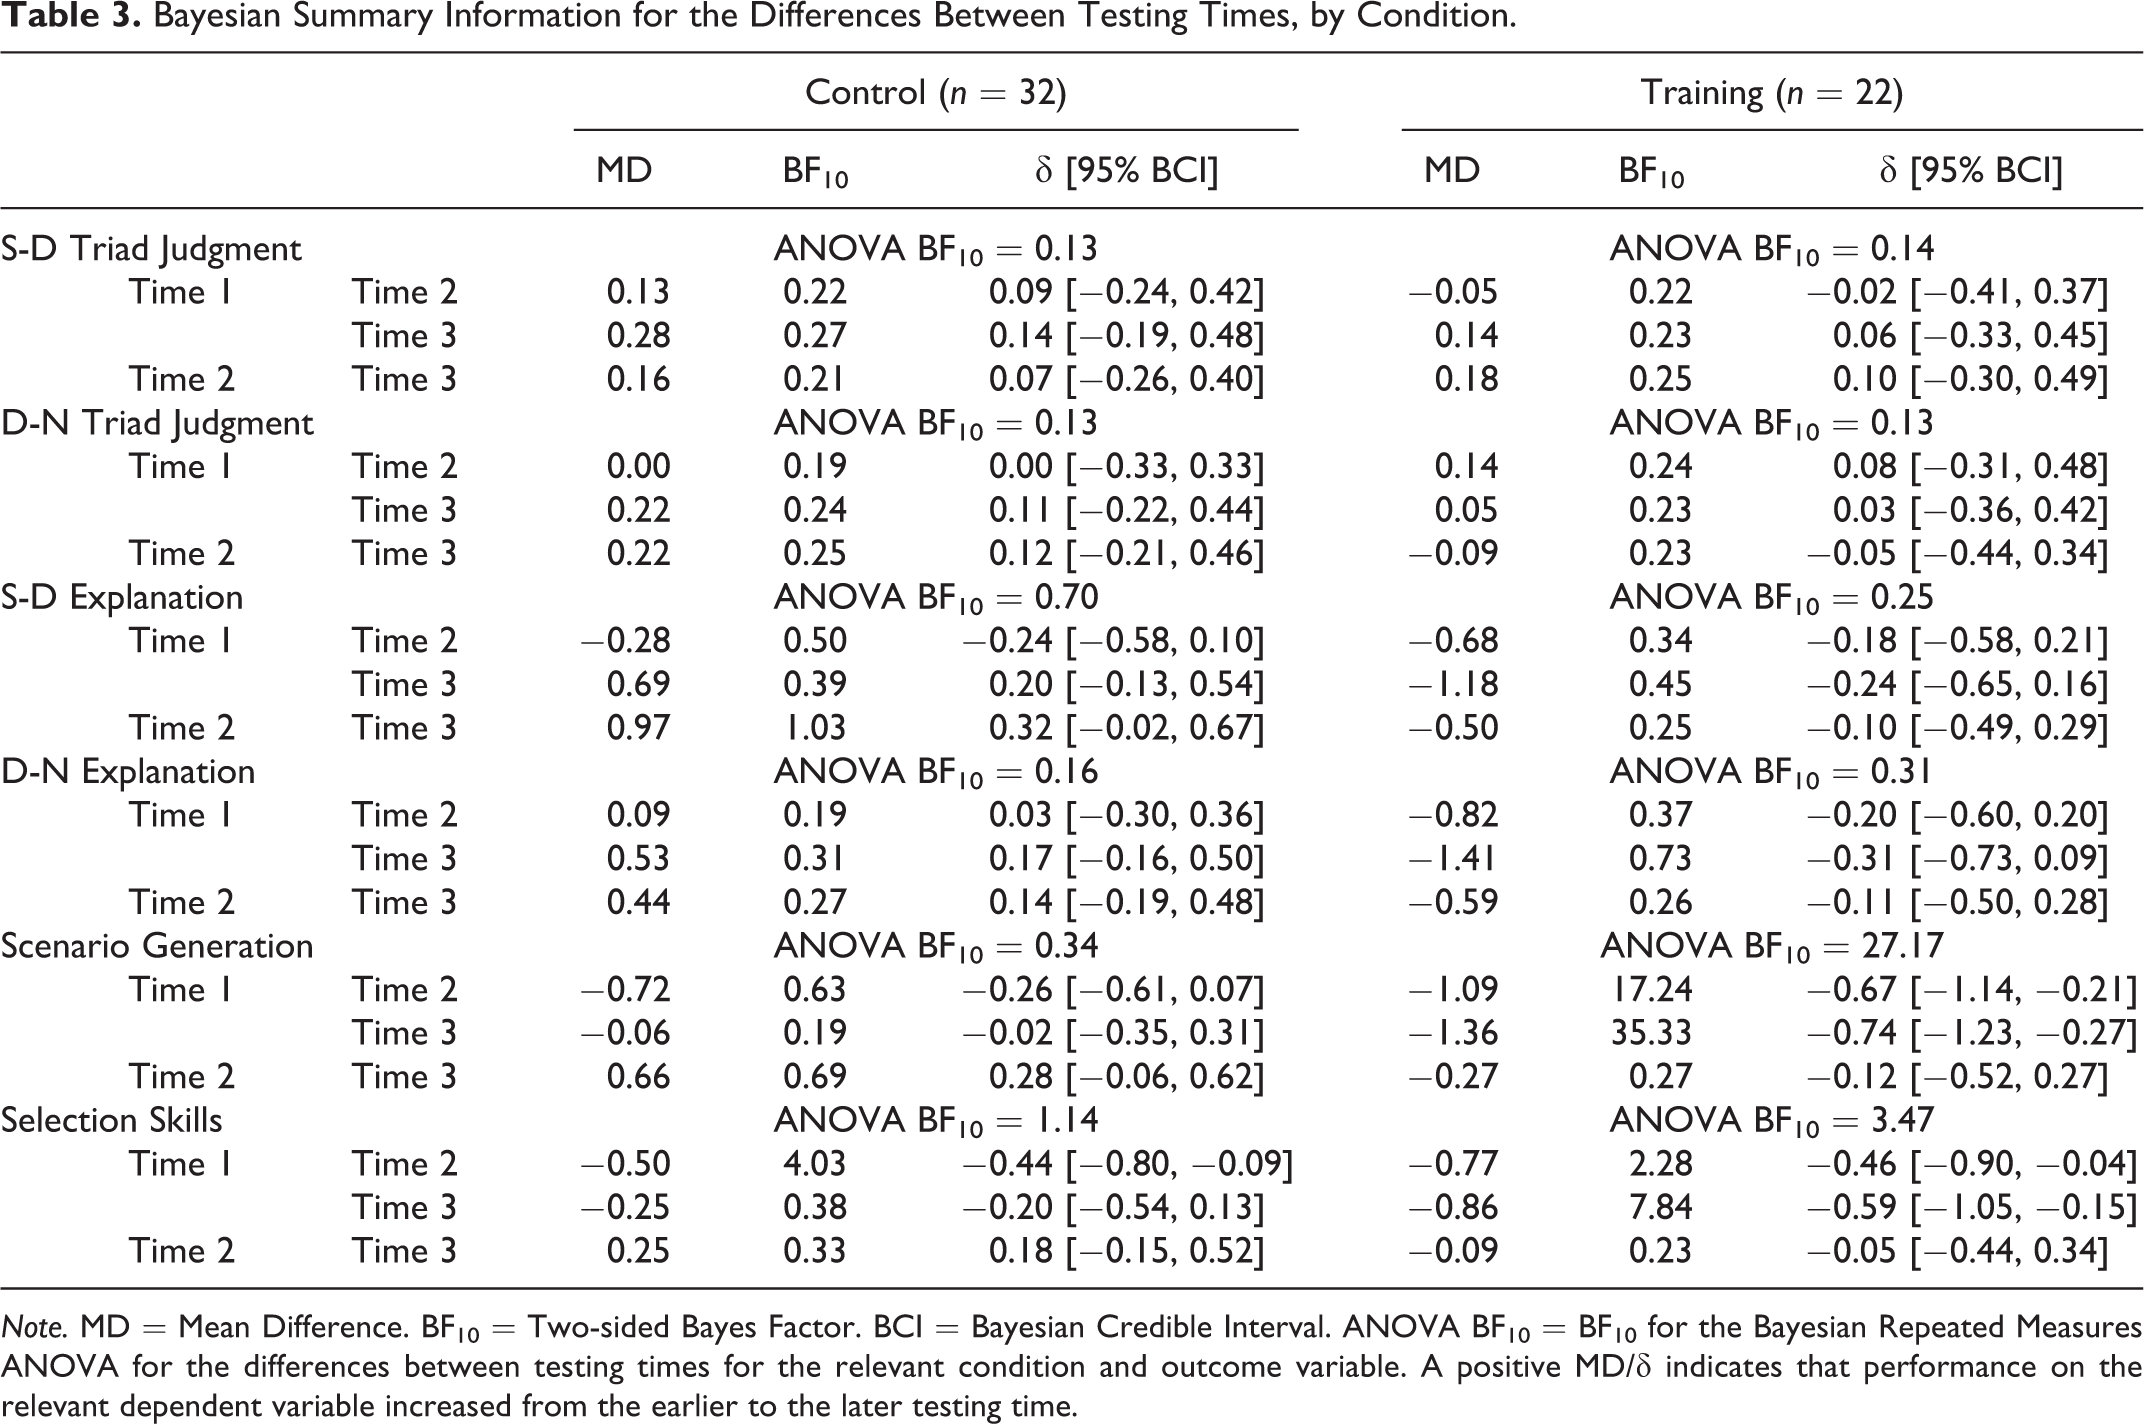
Note. MD = Mean Difference. BF10 = Two-sided Bayes Factor. BCI = Bayesian Credible Interval. ANOVA BF10 = BF10 for the Bayesian Repeated Measures ANOVA for the differences between testing times for the relevant condition and outcome variable. A positive MD/δ indicates that performance on the relevant dependent variable increased from the earlier to the later testing time.
Exploratory Analyses
The remaining rows of Table 2 indicate that there were large, reliable differences between the trained and control participants on all five measures of structural awareness at Times 1 (median δ = 1.02) and 2 (median δ = 0.94). At Time 1 there was also a large difference between the selection skills of the two groups (δ = 0.74). However, by Time 2, this difference had reduced to the extent that it could only suggest anecdotal support for H1 (BF10 = 2.82, δ = 0.47). These effects are illustrated as mean differences in Figure 1 and standardized differences in Figure 2.
The remaining rows in Table 3 (and dashed lines in Figure 1) indicate that the control participants’ performance on the structural awareness measures was stable across the three waves of testing (median δ = 0.11). However, their selection skills were somewhat more variable. Disregarding the trained participants’ early drops on the scenario generation and selection skills DVs, their performance across the first two waves of testing was stable (median δ = −0.10).
Table 4 illustrates how each group’s performance on the S-D and D-N triad judgment and selection skills tasks differed from “chance” levels. When given the choice between S and D comparison scenarios the control participants consistently selected S. The trained participants showed a weak preference for the D scenarios, although the corresponding BFs were non-diagnostic. When given the choice between D or N, both groups showed a clear preference for D at all three time points. The strength of the trained participants’ preference more than doubled the control participants’ preference. Finally, both groups achieved performance at levels clearly above “chance” on the Time 1 selection skills task. At Times 2 and 3 the picture was less clear. The effect sizes suggest that the performance of both groups was always above chance levels, however the corresponding BFs indicate that such conclusions should be made tentatively in the absence of more data. Robustness analyses for all pairwise exploratory analyses are in S7 of the online supplement.
Bayesian Summary Information for the Differences from “Chance,” by Testing Time and Condition.
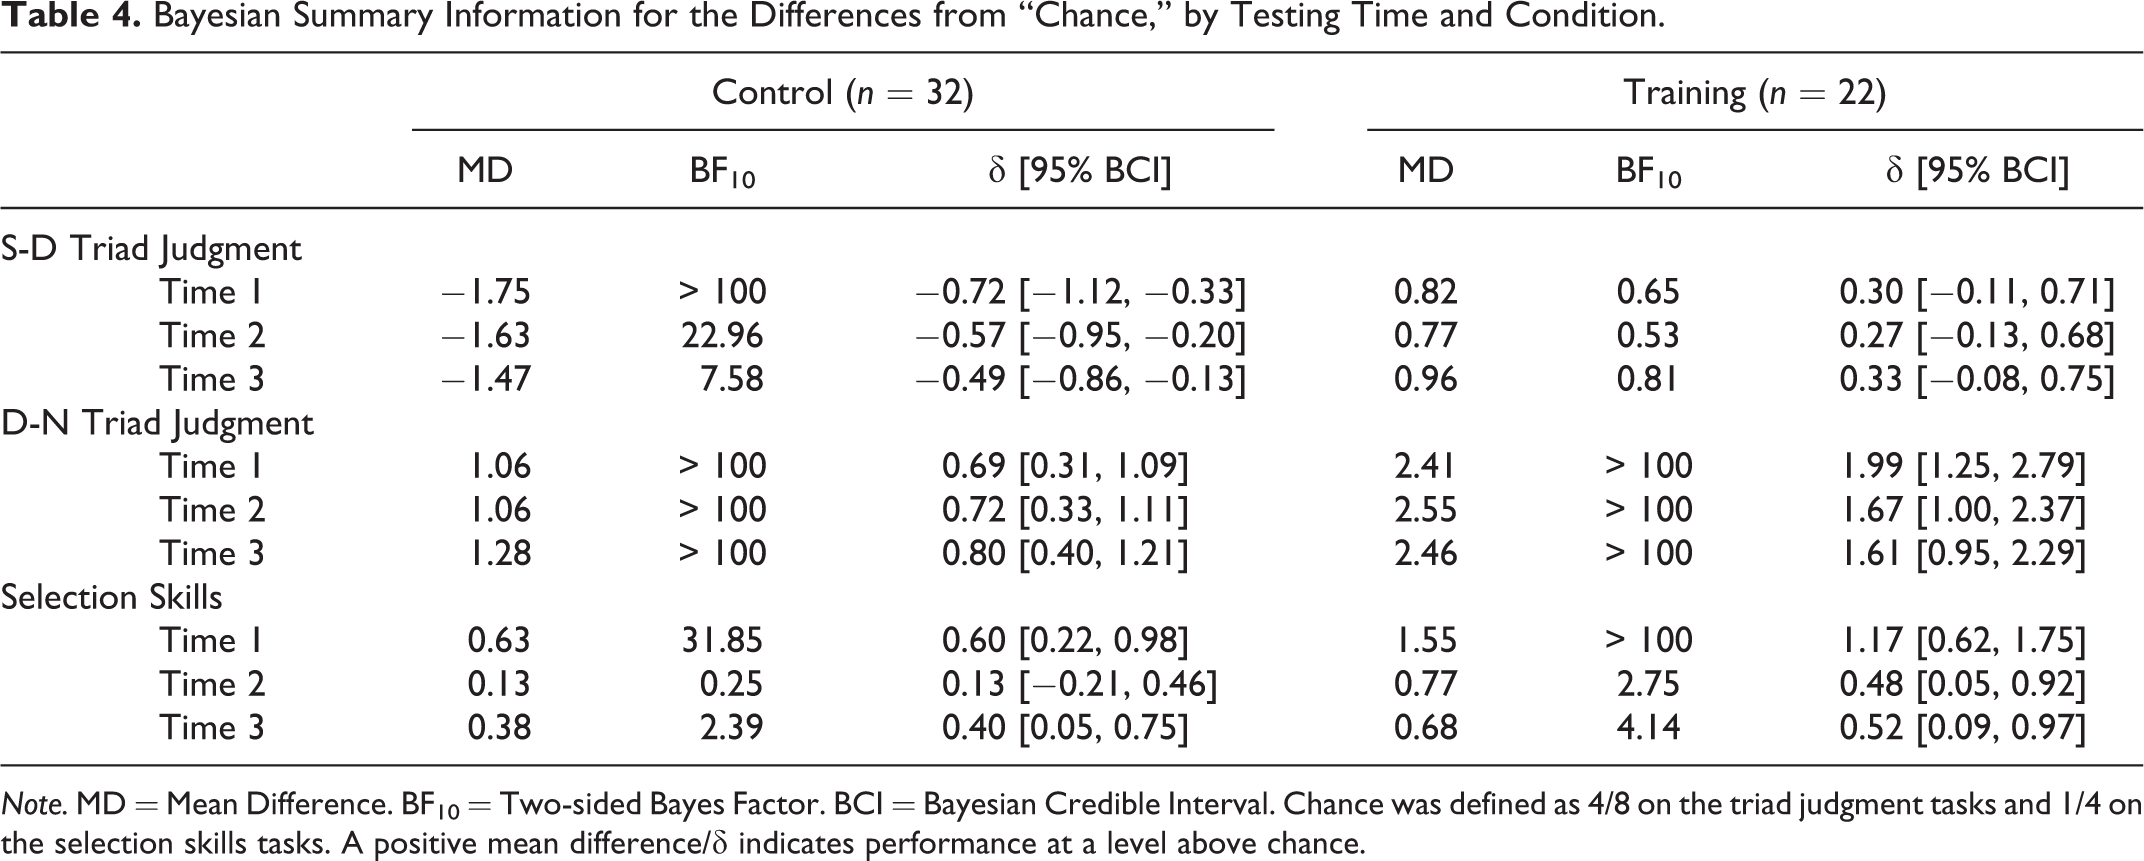
Note. MD = Mean Difference. BF10 = Two-sided Bayes Factor. BCI = Bayesian Credible Interval. Chance was defined as 4/8 on the triad judgment tasks and 1/4 on the selection skills tasks. A positive mean difference/δ indicates performance at a level above chance.
Discussion
This study extends findings reported in Allen, Fielding, East, et al. (2020) by demonstrating that many of the benefits of brief structural awareness training persisted for 12 months. For instance, in our third wave of testing, trained participants continued to reliably out-perform control participants on four measures of structural awareness. These effects (median δ = 0.80) were not as big as those observed for the same measures in waves one and two (median δ = 1.20 and 1.12 respectively). However, they were still “large” (Cohen, 1988), and around twice the typical size of effects for interventions aimed at boosting achievement in higher education (Hattie, 2015). They were also consistent with the immediate effects of other experimental attempts to train structural awareness (Quilici & Mayer, 1996, 2002; Yan & Lavigne, 2014). To our knowledge, this is the first time that longer-term effects have also been studied. This is not surprising, given the rarity of longer-term follow-ups of experimental interventions in education (Watts et al., 2019).
On the fifth measure of structural awareness, scenario generation, the trained participants no longer reliably outperformed the control participants, despite an effect size of δ = 0.47. This suggests insufficient statistical power. We only managed to re-recruit around half of the original Allen, Fielding, East, et al. (2020) participants. However, it is worth noting that those we did re-recruit did not obviously differ from those we did not (see S2 of the online supplement), suggesting that our effects are not merely an artefact of non-random attrition.
For the trained participants, performance on the structural awareness measures was generally stable over time (median δ = −0.11), with the one large drop, on the scenario generation task, occurring mostly in the week following training. On the triad judgment tasks they showed a weak and unreliable preference for D on the S-D trials (median δ = 0.30) and a very clear preference for D on D-N trials (median δ = 1.67). The performance of the control group was similarly stable over time (median δ = 0.11). In the triad judgment tasks at all three time points they preferred S over D (median δ = −0.57), but D over N (median δ = 0.72). However, the strength of their preference for D over N was only half the size of the trained group’s. When considered alongside previous research (Allen, Dorozenko, & Roberts, 2016; Rabinowitz & Hogan, 2008), these findings indicate that psychology students are not inherently structurally aware and are unlikely to become so during their undergraduate years without training. Our data suggest that such training can be brief, and its effects can be lasting.
Despite continuing to out-perform the control group on most measures of structural awareness, by Time 3 the trained group’s statistic selection advantage had largely disappeared (δ = 0.25). However, their performance was still modestly above chance levels, and just over the UK undergraduate “pass” threshold of 40%. The control group’s Time 3 performance was just under that threshold. These findings suggest that the relationship between structural awareness and statistic selection may be more complex than previously thought (Allen, Fielding, East, et al., 2020). They also indicate that selecting an appropriate statistical test for common research scenarios without assistance is stubbornly difficult for most students (see also Gardner & Hudson, 1999; Ware & Chastain, 1989, 1991). Finally, they suggest that any conceptual replication of this study should include an additional IV: with vs. without an aid during statistic selection. As there are few situations beyond exams where students would need to select a statistic “blind,” this would provide a more authentic assessment of the impact structural awareness training has on statistic selection skills.
In conclusion, students’ structural awareness should not be assumed, but can be trained. However, even structurally aware students cannot reliably select appropriate statistics without assistance. Training combined with easy access to a decision-making aid should maximize statistic selection accuracy. Instructors are encouraged to freely use and adapt our evidence-based training methods and materials (see particularly Allen, Fielding, Kay, & East, 2020; Allen, Fielding, East, et al., 2020), including StatHand, for these purposes.
Supplemental Material
Supplemental Material, sj-pdf-1-top-10.1177_0098628320985080 - Training Structural Awareness with StatHand: A 1 Year Follow-Up
Supplemental Material, sj-pdf-1-top-10.1177_0098628320985080 for Training Structural Awareness with StatHand: A 1 Year Follow-Up by Peter J. Allen, Jessica L. Fielding, Annabel H. Westermann and Amelia M. Lafratta in Teaching of Psychology
Footnotes
Declaration of Conflicting Interests
The author(s) declared no potential conflicts of interest with respect to the research, authorship, and/or publication of this article.
Funding
The author(s) disclosed receipt of the following financial support for the research, authorship, and/or publication of this article: Support for this project has been provided by the Australian Government Department of Education and Training (ID13-2954). The views expressed in this project do not necessarily reflect the views of the Australian Government Department of Education and Training.
Open Practices Disclosure
The raw and processed data for this study are openly available for download at https://osf.io/p7b4m/. Code is not available as the analyses were performed in JASP. However, the analyses can be fully reproduced with reference to the data dictionary in section S5 of the online supplement: https://osf.io/gtxvb/. The materials used in this study are identical to the Time 2 materials published as an online supplement to Allen, Fielding, East, et al. (2020). They are openly available for download at https://osf.io/2hkat/. The data collection methods for this study were pre-registered at https://osf.io/tv2fw, along with the hypotheses and data analysis plan. There was one deviation from the pre-registration: We had to test a small number of participants online due to the 2020 COVID-19 “lockdown” in the UK. This deviation is described in the paper. Prior to any data collection, this study was approved by the School of Psychological Science Research Ethics Committee at the University of Bristol (reference number: 96025). The complete Open Practices Disclosure for this article can be found at http://journals.sagepub.com/doi/suppl/10.1177/0098628320985080. This article has received badges for Open Data, Open Materials, and Preregistration. More information about the Open Practices badges can be found at ![]()
References
Supplementary Material
Please find the following supplemental material available below.
For Open Access articles published under a Creative Commons License, all supplemental material carries the same license as the article it is associated with.
For non-Open Access articles published, all supplemental material carries a non-exclusive license, and permission requests for re-use of supplemental material or any part of supplemental material shall be sent directly to the copyright owner as specified in the copyright notice associated with the article.