
Abstract
In the United States, which trades three-fifths of its electricity in competitive markets, the prohibitive capital cost of new nuclear power plants ensures that only a handful will be built. Nonetheless, with 40-year licenses being extended to 60 years, the 104 existing reactors’ relatively low generating costs are widely expected to justify decades of continued operation. But the generating costs of aging reactors have been rising, while competitors, including modern renewables, show rapidly falling total costs—and those opposed cost curves have begun to intersect. An expanding fraction of well-running nuclear plants is now challenged to compete with moderating wholesale power prices, while plants needing major repairs or located in regions rich in wind power increasingly face difficult choices of whether to run or close. Thus, even without events that might accelerate nuclear phase-out, as the Fukushima disaster did in Germany, shifting competitive conditions have begun to drive a gradual US nuclear phase-out. Its economics are illuminated by a detailed energy scenario that needs no nuclear energy, coal, or oil and one-third less natural gas to run a 158 percent bigger US economy in 2050—but cuts carbon emissions by 82 to 86 percent and costs $5 trillion less. That scenario’s 80-percent-renewable, 50-percent-distributed, equally reliable, and more resilient electricity system would cost essentially the same as a business-as-usual version that sustains nuclear and coal power, but it would better manage all the system’s risks. Similarly comprehensive modeling could also analyze faster nuclear phase-out if desired.
Nuclear power 1 in the United States, long considered the durably low-cost generator of electricity, faces intensifying competitive risks: New reactors are far too costly to replace the aging fleet of existing reactors, which in turn face rising pressure from even cheaper-to-operate ways to save or make electricity. For economic or other reasons, the gradual phase-out of unprofitable nuclear power plants, already quietly under way, may accelerate. Transparent empirical data and orthodox analytical techniques can illustrate the economics of this US nuclear energy transition—a complex transition embedded in a context that extends far beyond nuclear power.
The US electricity system is aging, dirty, and insecure, so almost all of it must be replaced by 2050, just to offset retiring generation and grid assets. This will cost approximately $6 trillion in net present value, whether the electricity industry builds more of the same infrastructure, new nuclear power plants and “clean coal” facilities, or centralized or distributed renewable plants (Lovins and RMI, 2011). But these divergent possible futures differ profoundly in risks—related to security, safety, finance, technology, fuel, water, climate, and health—and in how they would affect innovation, entrepreneurship, and customer choice.
Nuclear power’s public risks depend on many uncertain factors, including how well and long existing US nuclear plants are run, whether more are built (and if so, which kinds, how big, where, and by whom), and how much they are exposed to and how well they withstand natural disaster, technical mishap, or attack. Risk choices are highly political, influenced by public perceptions and by competitive forces and offerings. Energy—especially nuclear energy—has long been a uniquely subsidized, regulated, politicized, and powerful US industrial sector, so nuclear power’s economics form only one thread in a complex tapestry of influences on its use. Recent shifts in the economics of both nuclear power and its competitors are overturning some long-held assumptions. These shifts shed light on how quickly nuclear power may or should phase out and what may or should replace it.
The competition problem
The 104 nuclear power plants operating in the United States—totaling 102 gigawatts of capacity and long assumed to run so cheaply that they could always make economic sense—now face competitive risks less obvious than those bedeviling new plants, but no less real. The most recent reliably operating US nuclear plant to be written off as uneconomic—the 38-year-old, small (566-megawatt), single-unit Kewaunee pressurized water reactor in Wisconsin, which has been relicensed to operate until 2033—will instead close in 2013, because its owner could neither sell it nor make it compete with natural-gas-fired electricity (DiSavino, 2012; Dominion, 2012). Once closed, the plant is extremely unlikely to reopen even if gas prices rise again. But gas isn’t nuclear power’s only competitive threat.
With the benefit of the production tax credit, a federal subsidy for wind and other renewable energy installations, new wind farms in the High Plains wind belt are highly competitive with both wholesale power prices (Wiser and Bolinger, 2012) 2 and typical nuclear operating costs, and wind power’s costs continue to fall. The tax credit, which partly offsets nonrenewable generators’ permanent and generally larger subsidies (Koplow, 2011), is set to expire for wind farms whose construction doesn’t start by the end of 2013. But even after the credit’s ultimate expiration—the wind industry has proposed a six-year phase-down to zero (Trabish, 2012)—wind’s very low generating cost (Wiser and Bolinger, 2012) will still beat the best nuclear plants’ generating cost, despite continuing nuclear operating subsidies 3 and despite costs for grid integration to address wind power’s distinctive operating characteristics. 4
Of course, each nuclear reactor’s competitiveness depends on a complex and shifting set of both market- and plant-specific considerations, so no comparison of average conditions in a specific year can support conclusions about any individual plant. But it is safe to say that reactors that are sited in wind-rich regions or have relatively high generating costs confront increasing economic challenges (Wald, 2012a; Williams, 2012). Most distressed are reactors facing major repairs. Three examples, all with large and capable operators, are the San Onofre Nuclear Generating Station in southern California, shut down when replacements for 28-year-old steam generators failed within two years (Associated Press, 2012); the Crystal River Unit 3 Nuclear Generating Plant in Florida, with a repair bill exceeding its insurer’s roughly $3.5 billion reserves (Penn, 2012), abandoned in February 2013 while this article was in press; and the Oyster Creek Nuclear Generating Station in New Jersey, America’s oldest reactor, which its owner plans to close in 2019 at age 50 rather than spend $750 million to add state-ordered cooling towers for a subsequent decade of operation.
The consequences of uncompetitiveness
From 2005 to 2012, coal lost one-third of its US market share to competition from natural gas, renewables, and efficiency. 5 Could existing nuclear plants be the next victim of shifting energy economics? The answer to that question depends not only on how competitive each plant appears on paper, but also who owns it. Many US reactors are owned by regulated utilities, whose recovery incentives and perceived regulatory risk of deviating from industry norms can sometimes bias performance toward “industry average.” Merchant nuclear plants are often spurred by keener market incentives and their greater exposure to market volatilities to run better and more cheaply. It is nonetheless instructive to consider the operational profitability of an “industry average” nuclear plant to get a sense of the emerging economic dilemma confronting some operators. This unit-based profitability differs from the asset’s ownership profitability, which depends on its specific regulatory environment.
Nuclear plants are normally considered “must-run” assets. With substantial fixed operating and maintenance costs and little flexibility to follow varying loads, these units are built to run at a high and consistent output when they can and are increasingly forced to achieve rapid turnaround of repairs and refueling when they can’t. Once their initial construction costs are sunk, nuclear plants must compete on their average running cost relative to electricity’s wholesale market prices over an extended period. That incremental running cost has five elements that fall into two groups.
Operating costs
This first group sustains, and scales directly with, the plant’s day-to-day operation. While one can argue that few costs in a nuclear plant are truly variable—its skilled staff, for example, can hardly be furloughed in a skill-short market and then rehired—these costs nonetheless are treated as variable because they approximate the plant’s marginal cost of sending out electricity over time. The operators’ 2010 reports to the Federal Energy Regulatory Commission on its required “Form FERC-1” show that operating costs averaged $26 6 per megawatt-hour of output to the grid, including about $17 for routine operation and maintenance, 7 $1 for the statutory federal nuclear-waste-management fee, and almost $7 for fuel, 8 plus an unreported and highly discounted cost of operation 9 —nearly $1 to cover future decommissioning, for which operators must book a reserve fund on their balance sheet.
Net capital additions
The second group comprises two kinds of post-construction capital investments (so big and durable that they’re capitalized rather than expensed) that may overlap: major capital maintenance and upgrading to address issues of aging and reliability, and equipping a plant, with Nuclear Regulatory Commission approval, to produce more power than its original license allowed. 10 Net capital additions averaged $4.2 per megawatt-hour in 1993, 11 when last assessed by government analysts, but have more than doubled since, 12 and are highly erratic and unpredictable.
Adding $26 per megawatt-hour for operating costs to at least $4 per megawatt-hour for net capital additions yields a total generating cost that averaged at least $30 per megawatt-hour in 2010. In comparison, and in the same 2010 dollars, US wholesale electric energy prices in 2011 averaged $36 per megawatt-hour and normally 13 ranged from around $24 to $45. If an industry value (below) were used for today’s typical net capital additions, the average 2010 nuclear generating cost would match the grid’s $36 average 2011 wholesale price. Moreover, that price fell even further in 2012 (DOE/EIA, 2013b) than the year before (DOE/EIA, 2012f), so competition against 2010’s average nuclear generating costs is tightening.
Even though each nuclear plant is unique, this parity of average costs suggests that the industry should be experiencing heightened competitive pressures, to which operators must and will respond. But the full picture is more complex. The wholesale electricity price range varies widely, both across the country and over time (Wald, 2012b). Wholesale prices also reflect the existing generating mix, and could shift—whether higher or lower is unclear—with less or no nuclear generation. And it is fair to include capacity prices as well as energy prices. Nuclear plants’ high average capacity factor (around 90 percent) and relatively low variability earn bigger capacity credits than such competitors as gas, solar, and wind power. This nuclear advantage can range from zero (in markets that pay no capacity credit) to about $4 per megawatt-hour 14 —useful for operators, but still not enough to put many nuclear plants safely clear of the lower end of the average wholesale energy-price band. In fact, that $4 equals the real increase in average operating costs from 2010 to 2011 (EUCG, 2012), the biggest annual rise in a decade.
The implication is profound: Nuclear power plants, long thought to be very cheap to run once constructed, are under increasing competitive pressure—more immediately for some reactors than others, as new industry data reveal next.
Figure 1 compares the 2010 average generating costs derived above with a recent proprietary analysis
15
by the operators’ Electric Utility Cost Group (EUCG, 2012); those industry data illustrate how nuclear generating costs, like power prices, vary among plants and over time. Figure 1 sorts the generating costs of the 104 operating US reactors into four “quartiles” of 26 reactors each, ranked from the lowest-cost fourth (first quartile) to the highest (fourth quartile). From 2009 to 2011, Figure 1 shows a 2.4-fold range of average generating costs between the quartiles (hence an even wider range between outlier plants within the quartiles), and a nearly six-fold range of net capital additions. So why such wide cost variations?
Nuclear power’s price problem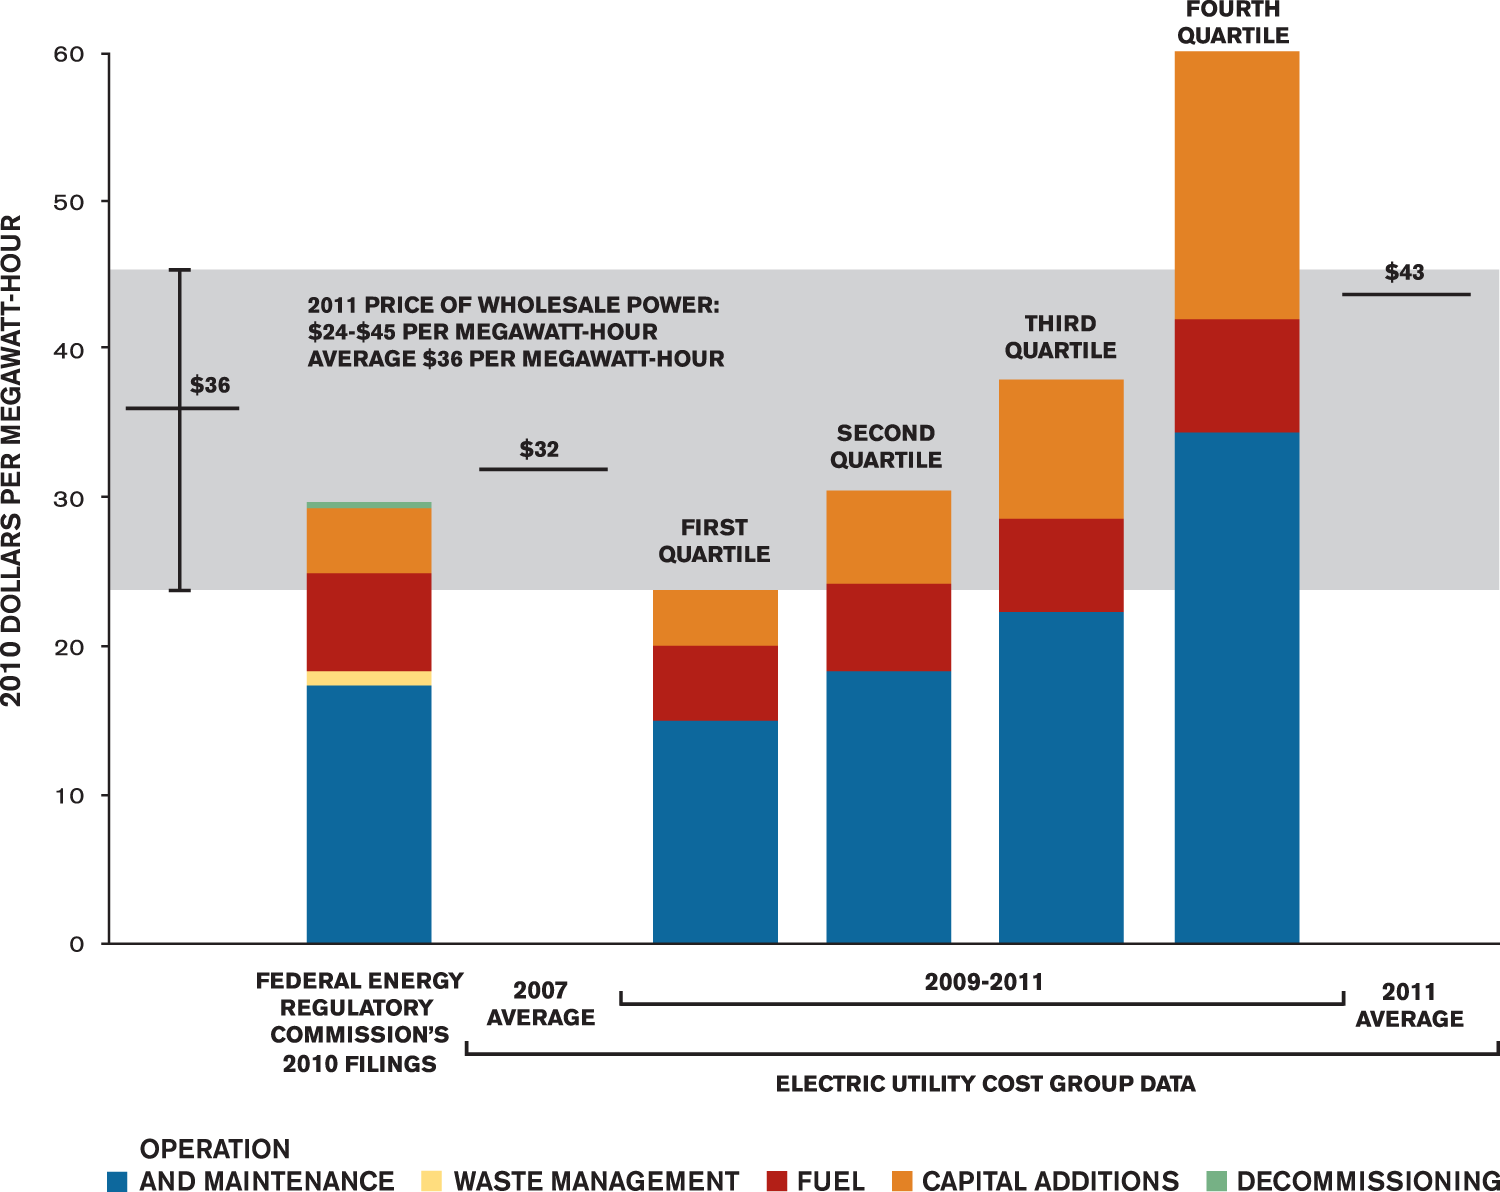
Most if not all of the high-net-capital-addition plants are said to have suffered extraordinary repair costs or invested in major upgrades to increase capacity and extend lifetimes—valuable benefits, but with significant costs. Such upgrades correct, anticipate, or forestall the effects of age: wear, corrosion, fatigue, leaks, cracks, contamination, and thermal and radiation embrittlement inexorably damage materials and degrade technical systems. Such deterioration presumably makes major repairs, prolonged outages, and potential accidents more likely and frequent, maintenance costlier, and profits lower. Operators therefore seek to minimize future regret. Renewing old components can indeed extend operating life if nothing else breaks first—it’s a bet, like putting a new engine in an old car. But the required investment is as much a cost of continued operation now as a future repair would be later. Either way, rising capital additions like these may belie the assumption that nuclear plants will enjoy low future generating costs.
According to the Electric Utility Cost Group’s analysis, the average nuclear total generating cost rose by one-third between 2007 and 2011 (especially in 2011) to $43 per megawatt-hour—two-fifths higher than my FERC (2010) estimate. 16 The biggest cause: 18 percent annual real escalation in net capital additions. That spending occurred chiefly in a modest number of high-cost units that bought power upratings or life extensions or both, or needed major repairs.
The 104 US reactors are diverse. With some exceptions, the units that are single or isolated, small, or trouble-prone may be harder to keep competitive. Yet other units could face greater pressure later, as non-nuclear competitors, especially renewable generators, become cheaper with mass production; as aging potentially raises nuclear generating costs and lowers capacity factors; as already-scarce spare parts for old equipment become less available from vanishing vendors in a dwindling market; and as imminent retirements from the rather aged staff population erode institutional memory and potentially weaken some operators’ skill or focus.
Deciding whether to repair or shut down a nuclear unit will often depend less on its average generating cost than on its unpredictable, spiky, and large major-repair costs, like some of those units illustrated in the fourth quartile in Figure 1. As with fixing an old car, a reactor’s owner must bet whether the investment will be justified by sufficiently long, cheap, and reliable future operation. A nuclear plant will be lucky to run for 40 to 60 years without facing a fix-or-close decision at least once: Of the 132 US power reactors ever licensed, by 2008, only 68 were still operating without having suffered at least one shutdown of a year or more (Lochbaum, 2008), and their clocks are ticking, too. Historic average costs, however, include no aging effects, making them a risky guide to the future in light of the emerging age-related trends that the Electric Utility Cost Group data in Figure 1 appear to imply.
The 2011 Fukushima Daiichi disaster intensified nuclear power’s capital burdens worldwide. European reactors now face costs up to $33 billion for post-Fukushima safety retrofits (Kanter, 2012), while Électricité de France alone, operating an aging 58 of Europe’s 134 reactors, estimates it will need as much as $46 billion to keep them in working order (Patel and de Beaupuy, 2010). US units too may face unpredictable ratcheting of regulatory requirements, and the few recently licensed new reactors, if completed, may need design changes as post-Fukushima safety reforms are defined.
“No [US] nuclear plant I know of,” said former Nuclear Regulatory Commissioner 17 Peter Bradford, “has ever closed because it hit the end of its license” (Wald, 2012b). To be sure, license extensions have lately moved the goalposts and put the game into 20 years of overtime, but 28 US nuclear facilities closed between 1963 and 1998 (DOE/EIA, 2012a: 271) because they lost their cost-competitiveness, including one that melted down. While this primacy of operating economics may well persist, other reasons for closing nuclear plants may also emerge. Nobody can foresee how shutdown decisions might depend on such noneconomic factors as political unease about old units near big cities, vulnerabilities to natural disaster or terrorism, another major accident anywhere in the world, or shifts from inflexible and vulnerable centralized units to flexible and resiliently linked distributed units.
The bleak competitive future for new nuclear plants
New nuclear plants face daunting economic and financial challenges rooted in recurrent history. From the early 1960s to 1978, when the first US nuclear boom stalled before the 1979 Three Mile Island accident, 18 US utilities ordered 253 reactors. Three-fifths were abandoned or prematurely closed as lemons (Lochbaum, 2008). The completed units averaged threefold construction-cost overruns (Koomey and Hultman, 2007), due mainly to evolving safety regulations, unstandardized and unstable designs, challenges in managing big, complex projects, and deteriorating finances as demand growth slackened and costs soared (Moody’s Investor Service, 2009). 19 Owners, paying hundreds of billions more than expected, averaged four-notch downgrades on 40 of 48 debt issuances (Moody’s Investor Service, 2009). Then in the 2000s, proposed next-generation US reactors suffered even steeper cost escalation (Lovins and RMI, 2011).
The past decade saw another “nuclear renaissance” that economics choked off well before Fukushima. Starting in August 2005, US nuclear power enjoyed four years of the strongest political and policy support and the most robust capital markets in history, plus three years of high natural gas prices. 20 Yet none of the 34 reactors then proposed could raise normal project financing, despite federal subsidies rivaling or exceeding their construction cost (Koplow, 2011; Lovins, 2010b). 21 Only a few projects survived. Two new reactors under construction in Georgia attracted private bond financing only after they were sufficiently de-risked by an $8.33 billion conditional federal loan guarantee projected to close in 2013, plus an unusual state law mandating customer financing in advance and guaranteeing full cost recovery even if the plant never runs. 22 In 2011, Moody’s Investors Service downgraded similar bonds over concerns about analogously customer-financed South Carolina reactors (Bagley, 2011). Such financial structures lost bondholders up to $4 billion when a nuclear financing vehicle called the Washington Public Power Supply System collapsed in history’s biggest municipal bond default (Lovins, 2010b).
Independent analysts estimate that new US nuclear plants would produce electricity at a total cost of roughly $110 to $342 per megawatt-hour.
23
Not only is that uncompetitive with new or old gas-fired electricity; it can’t even beat the construction plus operating cost of four abundant, widespread, and carbon-free options, each of which could readily displace all US nuclear output:
Utilities’ end-use efficiency programs, which help customers adopt equipment that converts less electricity into more and better services, cost about $17 to $34 per megawatt-hour or roughly $26 on average (Friedrich et al., 2009)—often less in factories and big buildings. Integrative design can make efficiency much cheaper still, with expanding rather than diminishing returns (Lovins, 2010e; Lovins and RMI, 2011; Lovins et al., 2010). Cogeneration, which produces electricity together with useful heat, often costs around $13 to $30 per megawatt-hour in industry and scarcely more in buildings, net of credit for its useful heat.
24
New wind farms in the wind belt, during 2011 and 2012, sold power long-term for $25 to $40 per megawatt-hour, and prices are trending downward (Wiser and Bolinger, 2012).
25
Utility-scale
26
photovoltaics cleared California’s April 2012 public auction for new power supplies at an average price of $86 per megawatt-hour
27
—cheaper than a new combined-cycle gas plant—and their prices are also trending downward.
These comparisons conservatively omit many lesser but collectively important renewable options, valuable “distributed benefits” that can enormously increase the value of decentralized resources (Lovins et al., 2002), efficiency and renewables’ protection from volatile natural-gas prices (a free “price hedge” worth tens of dollars per megawatt-hour), and avoided delivery costs (which average about $40 per megawatt-hour) when electricity is saved or made at or near the customer.
Shale gas, too, is often said to ensure that gas-fired plants will beat new nuclear plants for decades 28 on operating costs, despite gas’s rising and volatile US prices (Lovins and Creyts, 2012), which doubled in seven months after their April 2012 low. Yet the most durable, benign, and abundant competitors to new nuclear plants—efficiency and renewables—have falling costs and no fuel, and would be equally advantaged by pricing carbon emissions.
Old reactors’ generating cost alone is increasingly challenged to compete with new carbon-free alternatives, but new reactors would add the crushing burden of construction costs—an order of magnitude larger yet. On a purely microeconomic basis, few can claim a plausible business case for replacing retiring reactors with new reactors, leaving even one-time industry champions of nuclear energy skeptical of prospects for new construction. 29 A US nuclear phase-out will occur and indeed has been quietly under way for many years; 30 only the timing of its endgame is in question.
Paths to US nuclear phase-out
So what are the economic implications of the seemingly inevitable US exit from commercial nuclear generation? America’s 104 operating reactors average 32 years of age, and range in age from 16 to 43. They were originally licensed for 40 years, but 68 percent have been routinely extended to 60 years, another 14 percent have sought extension with equally strong prospects, and 16 percent plan to ask for extensions. Retirements have been buffered by Nuclear Regulatory Commission approval for 6.5 gigawatts of increased power ratings at existing plants, with another 7.6 gigawatts proposed (DOE/EIA, 2012g; DOE/EIA, 2013a). After that, the key question will be how long existing reactors will run—not how long their licenses last—before they’re replaced by non-nuclear resources.
Properly analyzing the elimination of nearly one-fifth of the country’s electricity production requires detailed and rigorous study, not only of the extremely complex electricity system, but also of the sectors that depend on it. Buildings use three-fourths of US electricity; industry uses one-fourth; both can profitably become far more efficient. 31 In transportation, too, recent design and manufacturing innovations could advantageously electrify automobiles (Lovins and RMI, 2011), adding flexible loads and distributed storage that could help the grid accept variable supplies. Even partial capture of these lucrative opportunities could well stabilize or even decrease long-term electricity needs (Faruqui and Shultz, 2012).
In a 2011 whole-system analysis (Lovins and RMI, 2011), 61 independent nonprofit practitioners, helped by dozens of industry experts, showed how to run a US economy 2.6-fold larger in 2050 than in 2010, but with no oil, coal, or nuclear energy, one-third less natural gas, tripled energy efficiency, 74 percent renewable primary energy supply (up from 8 percent in 2010), 82 to 86 percent lower fossil carbon emissions, a $5 trillion lower net-present-valued cost than an extension of the status quo (pricing climate risks and all other external or hidden costs at zero), and no new inventions or acts of Congress. This transition could be led by business for profit.
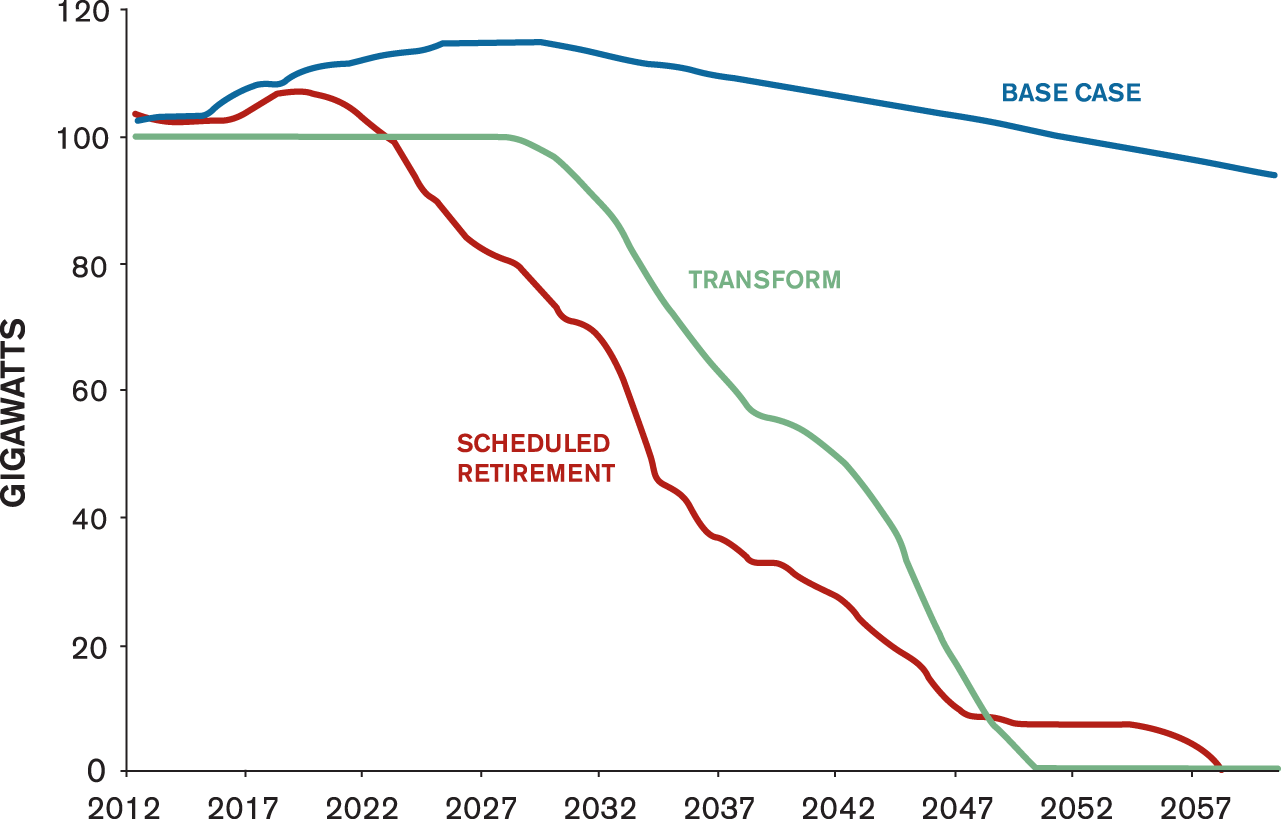
That study, Reinventing Fire, compared four electricity scenarios: Maintain, which follows official forecasts; Migrate, a low-carbon new-nuclear-and-“clean-coal” case; Renew, a centralized 80-percent-renewable case; and Transform, a half-distributed, 80-percent-renewable case.
By choosing nuclear phase-out trajectories similar to the Maintain and Transform scenarios, Reinventing Fire’s in-depth analysis and modeling can be applied to three illustrative phase-out paths (Figure 2) that are by no means the fastest plausible ones:
US nuclear phase-out paths
Of course, when a reactor closes will depend not just on its age, but also on many other site- and system-specific factors. But average figures suffice to explore two linked economic questions: What economic costs could be avoided by phasing out nuclear power? And what economic costs would be incurred by replacing nuclear with other resources?
Avoided costs
Phasing out existing nuclear plants as just sketched could potentially avoid many costs. Some of those costs will exceed historic averages if aging effects, not yet fully understood, prove real. Subject to that uncertainty, not running nuclear plants can avoid fuel purchases, routine operation and maintenance costs, major repairs or retrofits (net capital additions), and paying to relicense plants not yet approved to run for an extra 20 years. Phase-out also proportionately reduces waste-management burdens
32
and somewhat reduces decommissioning costs (but may increase their present value by incurring them sooner). Figure 3 summarizes these potential gross savings, which total on the order of $0.4 trillion to $0.5 trillion.
Could a phase-out save money?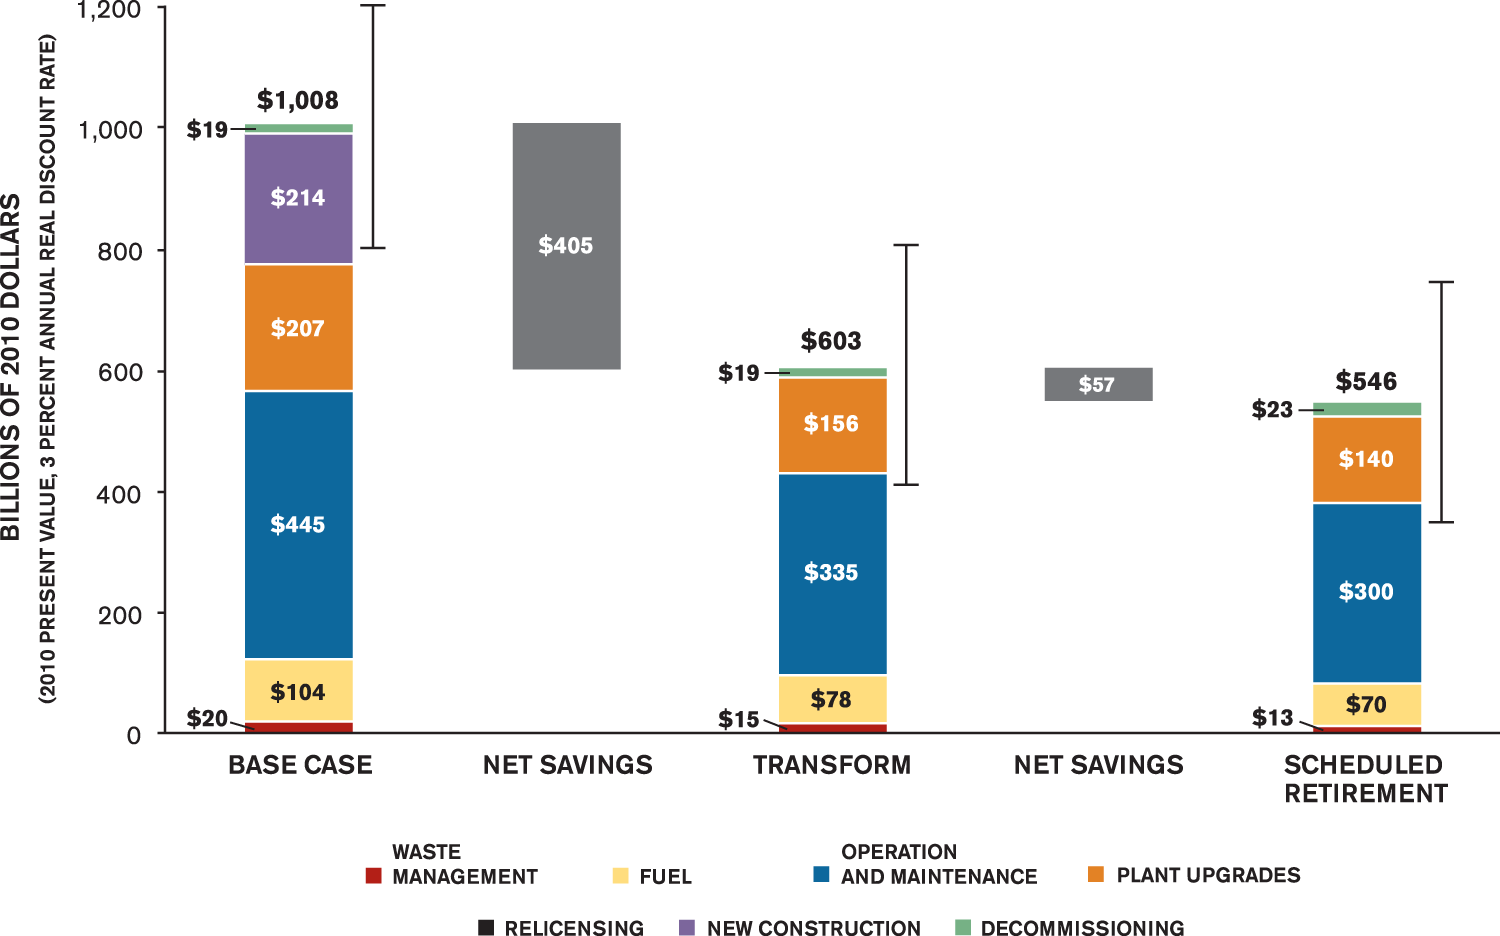
Replacement costs
The electricity production foregone by nuclear phase-out can be replaced by many different energy options. Properly assessing such systemic changes, especially to renewable and distributed options, requires an integrated whole-system analysis that continuously balances electricity supply and demand, subject to grid constraints. The Reinventing Fire analysis therefore used the National Renewable Energy Laboratory’s state-of-the-art Regional Energy Deployment System (ReEDS) linear programming model, which assesses grid balancing, transmission needs, and annual planning requirements over 134 balancing areas and 356 renewable resource regions throughout the lower 48 states.
The economic results will surprise many. Despite the Maintain and Transform scenarios’ very different technologies, cost structures, and operating characteristics (Lovins and RMI, 2011), the net present value of their total system costs differs by only 2 percent. That is, the cost of a gradual nuclear phase-out in favor of modern carbon-free alternatives is negligible. Of course, actual resource portfolios and costs will depend strongly on local conditions.
The output of wind farms and photovoltaics fluctuates with the wind and sun, so upholding strict grid reliability standards requires new approaches to operating the system. Grid operators already have considerable experience managing grid variability and uncertainty. The Reinventing Fire analysis shows that reliable operation with 80 percent (or greater) renewable generation can be achieved by integrating a diversified portfolio of flexible supply- and demand-side resources. These include demand response (which unobtrusively shifts loads off-peak, partly via ice-storage air conditioning and smart charging of electric vehicles), electrical energy storage (more than one-third of it distributed in vehicles), increased and optimized transmission and interconnection capacity, and better coordination of regional electricity supply and demand through wider balancing areas and more frequent market clearance. 33 Such integration into a larger, more diverse grid is how Denmark gained the capacity to produce, in an average wind year, 36 percent of its electricity from renewables in 2010, including 26 percent from wind (Lovins and RMI, 2011). It’s also how four German states ranged from 43 to 52 percent wind-powered in 2010 (Molly, 2011), how Germany was making 25 percent of its annual electricity from renewables by mid-2012 (BDEW, 2012)—up to half at times in spring 2012 (Kirschbaum, 2012)—and how the power pool supplying 85 percent of the electricity in Texas was 26 percent wind-powered in November 2012 (Mirzatuny, 2012).
European and US studies have shown (European Climate Foundation, 2010; NREL, 2012) how, by similar techniques, even whole continents could make 80 percent or more of their electricity renewably by 2050. This may require far less bulk electricity storage than commonly assumed, 34 if the two variable renewables, wind and photovoltaics, are properly diversified by type and location, forecasted, and integrated with flexible demand- and supply-side resources on the grid.
Some of the best US wind sites are remotely located in the High Plains, and the best solar sites lie in the desert Southwest, so moving those plentiful, low-cost resources to faraway load centers would need costly new transmission lines. An all-centralized, 80-percent-renewable US electricity system could need 220 to 370 percent higher transmission investment through 2050 (NREL, 2012). It may, however, cost more to exploit the best renewable resources if they are remote, compared to using merely good ones that are closer: For example, might Dakotas wind power cost more delivered to Chicago than the excellent wind resource in Lake Michigan? Such regionalization helps RMI’s half-distributed Transform scenario reduce transmission costs (though distribution investment rises). And how much new transmission could be profitably displaced by three potentially cheaper alternatives at or near the customers—efficiency, demand response, and distributed generation? Regulators and investors will increasingly compare these options, and many transmission proposals may flunk that test. Any conclusions today about extra transmission’s necessity and cost would thus be premature.
The Transform scenario’s diverse, dispersed, renewable architecture could also be far more resilient than the base case. Lawrence Berkeley National Laboratory has estimated that blackouts already cost the US economy up to $160 billion annually (Hamachi LaCommare and Eto, 2004). Centralized grids are vulnerable to cascading blackouts—caused by natural disaster, accident, or malice—that could be even larger, longer, and in some cases irreparable. But grid reorganizations being piloted abroad (Ackerman et al., 2008; Lovins, 2010a) have shown a path to making prolonged regional blackouts impossible when distributed renewables, bypassing the vulnerable power lines where most failures start, feed local “microgrids” that can stand alone to support critical loads if needed. The US Defense Department has adopted this approach to ensure its own mission continuity. So should the citizens the department is defending, who need their devices to work, too.
Finally, the Transform scenario demonstrates that phasing out nuclear power as part of a larger system transformation need not raise carbon emissions: They could fall by 82 to 86 percent at a $5-trillion net savings. Using zero-carbon renewables 35 to displace nuclear and coal power would accelerate scaling renewables and reducing their costs, much as Germany’s photovoltaic scaling has already cut its installed solar-system costs to half the US average (Wesoff, 2012). But what about the total cost of such a post-nuclear transformation?
The economic implications of nuclear phase-out
Reinventing Fire’s scenarios explore, among other changes, phasing out nuclear and coal power plants in the United States by 2050 by integrating advanced end-use efficiency, 80-percent-renewable electricity supply from both centralized and distributed resources, and a diversified portfolio of flexible resources including demand response, electric vehicle integration, energy storage, and better operational integration of the whole electricity system. The result could be operationally secure, economically competitive with continued nuclear (or coal-plant) operation, and lower in waste generation, water use, and many risks. This strategy could also advance nonproliferation and global development (Lovins, 2010c; Lovins, 2010d) in concert with profitable climate protection (Lovins, 2005; Lovins et al., 2009).
A US nuclear phase-out could occur on many possible timelines. Post-Fukushima Germany changed a slowdown of its 2002 phase-out plan into a two- to three-year acceleration, led by the country’s most pro-nuclear party, and with no political party dissenting. Remarkably, the 41 percent of German nuclear output shut down in August 2011 was replaced during 2011, over three-fifths by new renewable generation—while wholesale electricity prices and carbon emissions fell, employment and economic activity grew, and the country remained a net power exporter (Carrington, 2012; Gipe, 2012). Repeating 2011’s pace of renewable expansion for three more years could replace Germany’s entire pre-Fukushima nuclear output before 2015 while meeting, in concert with comprehensive efficiency efforts, ambitious economic and environmental goals.
Might a US nuclear phase-out comparable to Germany’s decade-long timetable cost more or less than the Transform scenario’s 40-year phase-out? A proper answer to that question needs not just microeconomic comparisons between technologies, but rigorous simulation of nationwide shifts that ensure loadshape-matching, regional adequacy, grid stability, and reliable integration of variable renewables. In principle, modeling tools like those used in Reinventing Fire’s Transform scenario could yield an approximate answer.
Alternatively, greater use of existing combined-cycle gas plants could buffer a more leisurely deployment of renewables, efficiency, and cogeneration. Costs would depend on natural gas prices, which would react to such a demand surge, and on any carbon prices. If overall costs did fall, that could heighten the economic case for a faster nuclear phase-out. Carbon implications would need modeling too: Substituting gas for nuclear rather than for coal could delay a coal phase-out, but faster complementary shifts to efficiency and renewables could make both coal and nuclear phase-outs faster and cheaper.
As rigorous analysis explores the economic costs and benefits of different ways to provide electricity services on a local and regional basis, where and when renewables and efficiency present a “winning hand” compared with nuclear operation will depend on a host of local resource, grid, demand, loadshape, and dispatch issues. But whenever a nuclear plant must be either fixed or closed, regulators should insist on such a thorough whole-system analysis of alternative portfolios and their risks.
In many parts of the country, though, utility business models, electric utility regulation, and public policy are not yet fully aligned to allow proper competition between nuclear generation, end-use efficiency, demand response, and distributed generation. Federal subsidies advantage nuclear power (Koplow, 2011) and often, to a lesser and less-analyzed degree, fossil-fuel generation. But there are other major distortions, too. Sometimes prices are opaque and purchasing biased. In 35 US states, regulated utilities earn more profit by selling more electricity but less profit if customers’ bills fall, disadvantaging efficiency. In one-third of the states, regional auctions do not yet allow companies that save electricity to bid against new power supplies. Many arcane and archaic rules inhibit cogeneration, competition, and interconnection. 36 In most if not all states, impediments to full and fair competition among all ways to save or provide electricity persist. Wherever such impediments are removed, efficiency and renewables will compete more effectively, and customers and national security will benefit.
Nuclear power enjoys the advantages of comprehensive and durable 37 subsidization, supportive regulation and public policy, a grid designed around it, and operational practices and organizational structures that favor predictability over flexibility and centralized brittleness over distributed resilience. However, the emerging and far more dynamic marketplace, permeated with information and new players, is rapidly creating new business and regulatory models that enhance flexibility, diversity, customer choice, innovation, and entrepreneurial opportunity (Lovins and RMI, 2011). Nuclear power faces complex and ultimately existential challenges in adapting to stiff competition from efficient, diverse, distributed, renewable alternatives. The inevitable US nuclear phase-out, whatever its speed, is therefore just part of a far broader and deeper evolution from the remarkable electricity system that has served the nation so well to an even better successor now being created.
Footnotes
Acknowledgements
The author acknowledges the kind counsel of many colleagues at RMI and elsewhere and peer review by many experts, including Ralph Cavanagh, Geoff Fettus, Peter Fox-Penner, Victor Gilinsky, Jonathan Koomey, and Doug Koplow (none of whom is responsible for the content).
Funding
This article was made possible by the generous support of private donors Fred and Alice Stanback. The article is part of a three-part series on the implications of phasing out civilian nuclear power in Germany, France, and the United States. Additional editorial services for this series were made possible by grants to the Bulletin of the Atomic Scientists from Rockefeller Financial Services and the Civil Society Institute.
Notes
Author biography
![]() )— an independent, apolitical, nonprofit think-and-do tank that drives the efficient and restorative use of resources. Lovins, originally an experimental physicist, has led energy innovations for four decades (chiefly with the private sector), written 31 books and more than 470 papers, and taught at 10 universities, most recently Stanford’s School of Engineering and currently the Naval Postgraduate School. The views expressed here are solely those of the author and do not represent any government agency, particularly the US Defense Department.
)— an independent, apolitical, nonprofit think-and-do tank that drives the efficient and restorative use of resources. Lovins, originally an experimental physicist, has led energy innovations for four decades (chiefly with the private sector), written 31 books and more than 470 papers, and taught at 10 universities, most recently Stanford’s School of Engineering and currently the Naval Postgraduate School. The views expressed here are solely those of the author and do not represent any government agency, particularly the US Defense Department.