
Abstract
(War) destruction of a city is not easily representable. Not only is the entirety of urban space hardly ever equally affected but also, within the damaged areas, there are different degrees of ruination. Along with photos and aerial photography, maps are one of the most common means of representing cities’ war destruction. Despite their appearance, however, they are not an objective and impartial representation, but rather a narrative that can be deconstructed and interpreted in various ways. This paper inquires to what extent the Cottbus war damage map is a reliable testimony of the urban disaster, what its limitations are, and what story it tells. For all its precision, it was not made to serve utilitarian purposes, but rather as a mean of commemoration. This draws our attention to the fact that maps should not be only measured by their accuracy, but rather recognized and assessed on their own terms.
Introduction
Destruction of an urban space is not easily comprehensible. Unequal importance in social, cultural, economic, and symbolic terms as well as complex spatial relations do not lend themselves easily to being represented in two dimensions, let alone by a number. And yet, for various reasons people found it necessary or even desirable to do just that. For instance, 60 percent of Cottbus was assessed to be damaged, and this figure was often referred to in municipal documents in the year following the end of the Second World War. Of course, this phenomenon was by no means restricted to Cottbus alone. The use of the number not only allowed to easily communicate how much the given place suffered during an armed conflict but also to compare it with other towns and cities, thus promising a more comprehensive (and “objective”) understanding of the broader situation.
Between the homogenizing percentage for the whole city and detailed registers which recorded each property, other tools such as aerial photos and war damage maps were used. The latter not only allowed an overview of the situation but also could be enriched by additional information such as time of destruction, degree of damage, or planned action after the war. Depending on when, why, and by whom a given map was made, the cartographic image could be drawn and consequently read in very different ways. While in the past, the main concern was with the accuracy of such representation, new scholarship suggests that one should look beyond the issue of exactness when interpreting a map. Far from denying the importance of this feature, this article argues for a more holistic interpretation of a war damage map, based on the Cottbus example. A (war_damage) map similar to a pictorial depiction of a cityscape can be read and interpreted in a meaningful way, even if it is not entirely accurate. Assessing the precision should be an important aspect of the analysis but does not exhaust the matter.
It is well established that maps, beside documenting the situation on the ground, have been used to show and justify plans for the future. However, maps can also serve other purposes, such as commemorative one. This should not automatically deny them historical credibility, but it should be considered when reading such maps in their full complexity.
Article’s Scope
This paper examines the war damage map of Cottbus (Figure 1) and asks what story it told, how, and why. It argues that the map, despite its artistic appearance, transmits a detailed, albeit not flawless, portrait of the city at the end of the Second World War. It not only shows what was lost but also highlighted what was saved. The way the cityscape is shown suggests that the map was conceived as a mean of commemorating the fate of the city. One could argue that it was more intended to give orientation in time (i.e., memory) than in urban space.
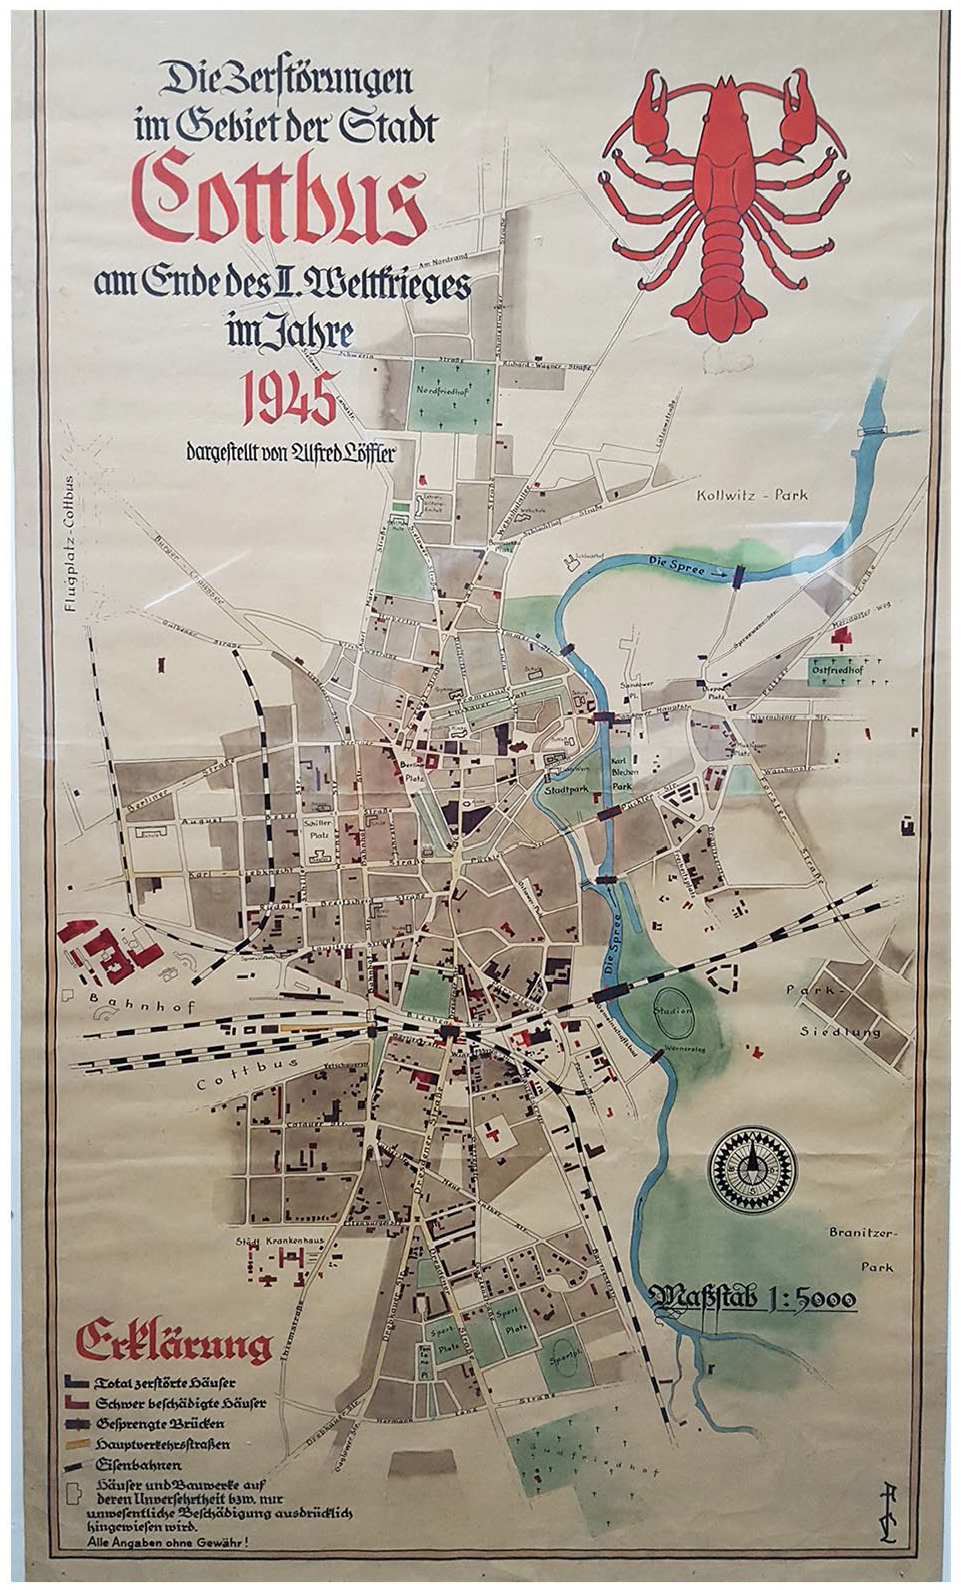
War damage map of Cottbus, collection of the Stadtmuseum Cottbus; © Städtische Sammlungen Stadtmuseum Cottbus.
This means that the proper reading of this depiction requires us not only to put it in the context of other maps of the city but also other war damage maps as well as other commemorative devices. This paper argues that a war damage map does not speak for itself. A deep reading of a map, requiring additional, external information is required to fully understand its meaning. It is not a mirror of reality, but a composed image of it.
This paper contributes to the study of the cartographies of catastrophe by close reading, contextualizing the war damage map of Cottbus, and placing it within a broader context of other such depictions. 1 It is beyond the ambition of this paper to provide a comprehensive overview of the war damage maps. The examples used in this paper were chosen to provide some insight into the genre, without guaranteeing the representativeness of the sample.
The focus on the cartography means that it prioritizes the map itself, and the city it depicts is treated solely as a case study. Therefore, no claim is made to comprehensive analysis of the war events in Cottbus. Inhabitants’ experiences during this time period are of concern for this paper only as far as the examination of the map requires it. Finally, it is beyond the scope of this paper to deal with the popular perception of political regimes before and after 1945.
Literature
This article draws from different strands of literature. On the one hand, it is indebted to the recent works on cartography, and war damage maps in particular. On the other, academic works concerned with representation of cityscapes form the foundation of this paper. Finally, the existing academic works on the history of Cottbus were consulted to better grasp the local context.
From the Renaissance onwards, maps were seen as mirroring the territory they showed. These scientific and thus objective objects could be probed in terms of accuracy of depiction as well as effectiveness, that is, how accessible they were to a reader. 2 A map was seen as merely a frame through which the naked eye could see a space. This approach, however, came under critique, at least since Harvey’s work. 3 Creation of a map, necessary, requires a series of choices and judgments, and thus no map could possibly be totally objective. 4 The very basic choice of territory to be depicted is not neutral or objective. Because of those concerns, maps lend themselves well to the analysis of power structures and the ability of maps to show but also to conceal reality on the ground.
The more recent scholars drew attention to the fact that cartographic depictions are very different from how individuals perceived the territory around them. 5 Moreover, the ontological status of the maps has been questioned. 6 Kitchin and Dodge argue that a person looking at a cartographic depiction is not merely a passive receptor of a fixed imaged, but rather creates the meaning of this map in the process of reading it. 7 For this reason, maps should be understood as highly contextual. These qualities of maps and mapping led scholars such as Roth to argue for “visual storytelling” using cartographic means, however primarily in the digital context. 8
It would be impossible to properly read the map of Cottbus without understanding depictions of that kind made for other cities. And indeed, there are quite a few works on the topic. However, as argued by Elżanowski and Enss, academic literature so far has been primarily interested in quantitative analysis of destruction, and far less attention has been paid to their qualitative analysis. 9 This paper uses precisely such an approach.
War damage maps were developed from the visual representation of urban fires during the nineteenth century. 10 The efforts made to conceptualize, trace, and eradicate illnesses troubling cities, such as the famous map of the cholera outbreak in London by Snow, can be seen as a forerunner for the war damage maps. 11 Other thematic maps, such as flood maps, were also precursors to the war damage maps. 12 Such depictions allowed better understanding of the phenomenon, its spatial dimension, as well as planning more rational countermeasures.
The connection between war damage maps and reconstruction plans is not as sharp as one might expect. Recent academic works has shown that the two often went hand in hand. 13 Many architects and urban planners saw the Second World War and its destruction as a sort of a “blessing in disguise.” Some saw the lack of war destruction as an unfortunate lack of opportunity to build new, better cities. 14 However, the literature shows that the war damages were not always determining the post-war reconstruction plans. 15 Last but not least, this article demonstrates that not all damage maps were made to be used during the reconstruction process.
As mentioned before, the prime interest in war damage maps so far has been in extraction and evaluation of underlying data. However, the qualitative comparison between the different cities is often flawed. On the one hand, there is the source limitation (e.g., war damage records were not created or did not survive in all cases), and on the other hand, areas considered in such assessments (e.g., “city center,” “old town” etc.) tend to differ significantly. Furthermore, it is surprisingly difficult to learn the actual degree of destruction. Even though categories used to describe them are more or less similar (such as “heavily damaged” or “destroyed”), what they signify is far from being the same. 16 Hohn points out that while, in Germany, there was a directive on the assessment of the war damages, in practice, one needs to be very careful, as such documentation was partly based on official, partly on private, surveys. 17 Furthermore, one must consider that these figures were often a result of estimations, rather than deep examination of damages. For this reason, the distinction between “heavy,” “middle,” and “light” damage (in contrast to “destroyed”) is particularly unreliable. This was exacerbated by the incentive to inflate the damage to receive more construction materials or financial support. Sedlmeyer provides examples of how one property was re-evaluated, and the degree of war damage increased. 18
This paper seeks to explore a map as a representation of a particular place and deconstruct its visual narrative. The existing works on urban visual representations tend to focus on images, paintings, and photography. Maps seem to be considered less often, and in the case of works focusing on them, the attention seems to center on analyzing the development of urban territory and its morphology. 19 We can look to the deconstruction of urban imagination in other formats such as photographic postcards. For instance, Mellinger showed on the example of the US South how postcards can feed nostalgia for the past, rather than depict actual locations. 20 And in doing so, postcards may play a political role, even if they are apparently politically neutral. DeBres and Sowers traced the standardization of images of places in the United States and showed how visual cues were used to create a universal image of the American town, regardless of its location and individual characteristics. 21 Banaś argued that the idealization of postcard images in Europe is meant to confirm belonging to a civilization and cultural community and thus allow everyone to recognize themselves in this standardized image. 22
When it comes to the case study of Cottbus, its historiography is not as extensive as the more prominent cities, but a few works cover this topic. In the general histories of the city, the destruction during the Second World War is treated as a minor event summarized in one or few paragraphs. 23 Christl provided a more detailed account of the bombing on the February 25, 1945, but his narrative is focused decisively on the experience of the local population, rather than the spatial analysis. 24 In the history of the city’s architecture, the bombing is referred to, but its impact on the city is not systematically analyzed. 25 The most detailed account of the air raid can be found in the two short, semi-professional articles in the local journal Cottbuser Zeitung. 26 Their author, Helmut Schweitzer, was not only able to reconstruct which exact areas of Cottbus were affected by the bombing but also identify why the city was not as heavily damaged as other places such as Dresden. As far as I am aware, no systematic research on the effects of the Soviet takeover of the city was published, nor was the war damage map an object of a scientific research as far as it was possible to establish.
These considerations on maps, and war damage maps in particular, as well as visual representations of urban space provide a framework to examine the war damage map of Cottbus beyond the question how accurate it is. Far from disregarding this issue, this paper argues that it is vital but only one of the layers of meaning. Conceptualizing it as a “spatial story” rather than “merely” an inventory of damages, this paper examines it as a narrative about a provincial German town. 27 In contrast to existing literature, it places the war damage map not in the context of post-war reconstruction, but rather contextualizes it as a commemorative device.
Methodology
Examination of the “spatial narrative” of the Cottbus’ war damage map was conducted primarily in a comparative framework, including analog as well as digital tools. This was supplemented by cross-referencing the map with written sources.
First, the map at the center of this paper was compared with five other street maps of Cottbus. 28 This was done to verify whether it was consistent with other cartographic representations of the city, in particular when it came to the category of “significant buildings.”
Examination of the cartographic accuracy was conducted with the help of the QGIS software. The war damage map and a 1939 map of Cottbus (Figure 2) were georeferenced using the same points such as a corner of the city church (Oberkirche) or the northern cemetery (Nordfriedhof). Using different degrees of transparency, both maps were overlaid on each other. This juxtaposition was not ideal, not least due to the quality of the image of the war damage map. Nonetheless it allowed to check if war damage corresponds to built structures shown on the 1939 plan. Irregularities detected on the war map were identified and analyzed.
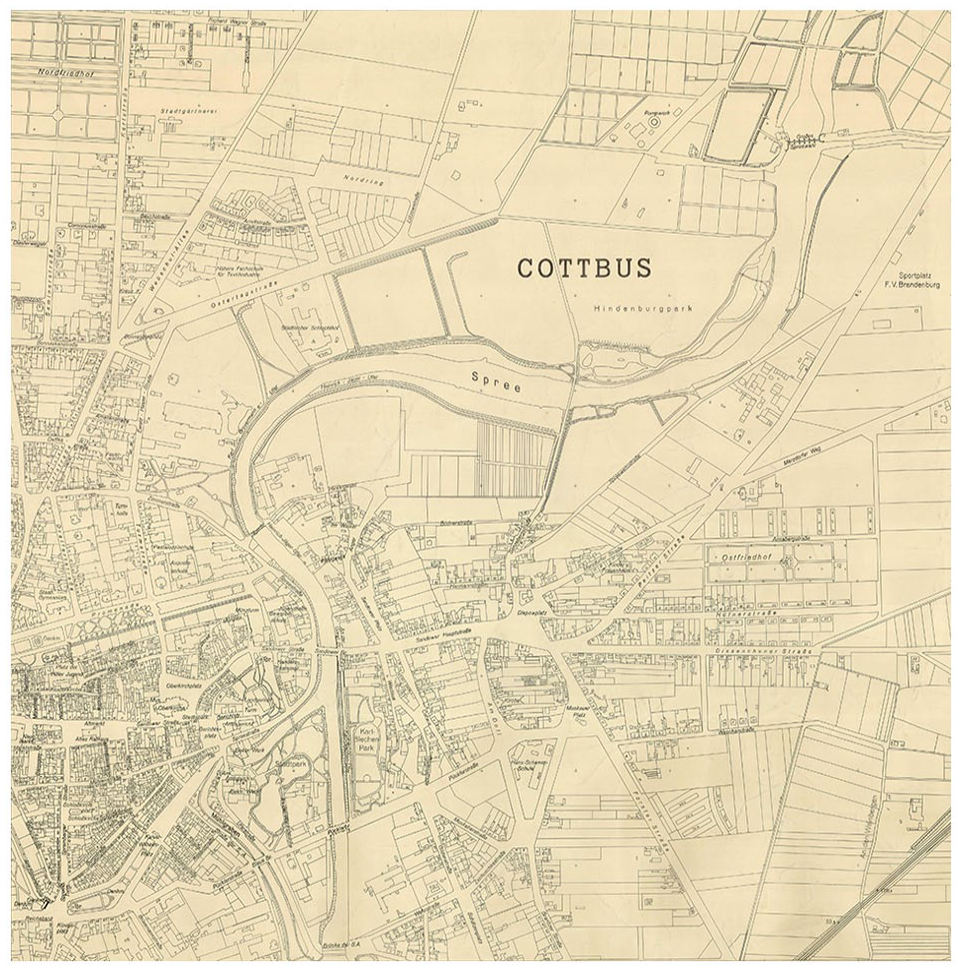
Map of Cottbus 1939 (fragment); Stadtarchiv Cottbus (Sig. Fa. 19/F10/Ma4.13/G14/Nr 6); © Städtische Sammlungen Stadtarchiv Cottbus.
Georeferencing made it possible to allocate individual addresses to the damaged buildings. Over 150 properties were marked in this way, which were than compared with the assessment made in two other sources on war damages: a register of war damages completed in the late 1945 and a register of the damages caused by the bombing on 15.2.51 (sic!) signed by the city’s archivist on August 1, 1951. 29 Neither covers the territory of the whole city. War damages on four streets were analyzed in detail. This procedure allowed assessment of the map’s accuracy in terms of the degree of destruction of the city.
In order to understand whether the war damage map of Cottbus is typical for the genre and whether it can add something new to the scholarship in this regard, a comparison with other such cartographic depiction was made. For practical reasons the comparison is drawn primarily from the Atlas Kriegsschadenskarten Deutschland, as well as limited archival query on this topic. 30 In particular, scale, colors, and categories of damages on different maps were examined.
Cottbus/Chóśebuz: An Unremarkable City
The history of Cottbus, like many other provincial towns, is quite unremarkable, especially when compared to world-famous cities in the wider region: Berlin, Dresden, or Wrocław (Breslau). Arguably this unexceptional character makes is a good case study to understand how “average” cities dealt with the destruction brought by the war.
Mentioned for the first time in mid-twelfth century, it was obtained by margraves of Brandenburg in fourteenth century. It remained part of Brandenburg and then Prussia until its dissolution in the aftermath of the Second World War, with only a brief interlude during the Napoleonic period when it was incorporated into Saxony. 31 Cottbus was decimated during the Thirty Years’ War, but the town managed to get up from its knees and developed again, with the textile industry being its motor, the regeneration process being helped by a group of French Huguenots who settled in the city. 32 During the period of the German unification, the city gained an additional role as a regional railway hub. 33 The turn of the twentieth century brought a typical modernization process, marked by the development of the modern water supply, sewage, electricity, and a tram network. 34 It was a period of demographic expansion too; in 1860s, its population crossed the mark of 10,000, and at the time of the First World War, it was approaching 50,000.
In contrast to many other cities during the Second World War, Cottbus was long spared from air raids. It was only at the very end of the conflict, on February 15, 1945 that the city experienced its only serious bombing. Furthermore, there were some fights during the Soviet takeover of the city on the April 22, 1945. The first post-war urban development plan was passed by the city council only in 1965. 35 The reason for this delay might be traced back to the fact that the city was given very low status in the state-wide reconstruction plans of East Germany. 36
Cottbus can therefore be taken to represent a typical middle-size town, with an unexceptional trajectory of development over the centuries. Of course, just like any other place, it has its own distinctive features, but on the whole, it is not dissimilar to other urban centers in the wider region. And this seems to make it a good case study, to see how such a city would represent its losses during the Second World War, an experience shared by many cities across the region.
Löffler’s Map: An Artwork?
The hand-painted Cottbus’ war damage map (0.77 × 1.28 m) is visually striking (Figure 1). It is painted with broad strokes of brown, with lines of black and spots of red. The big red crayfish in the right upper corner draws the attention; the animal is taken from the city’s coat of arms. In the left corner, one can see the title of the map in a beautiful Gothic font: “The destructions / in the territory of the city [of] / Cottbus / at the end of the Second World War / in the year / 1945 / depicted by Alfred Löffler.” In the left bottom corner, the same font is used for the legend. However, beneath it, directly above the frame in a very different, modern font is written: “All data without guarantee!” The stylized Gothic font is used again to provide scale (1:5,000). In the bottom right corner, there is a sign that seems to be a styled monogram (AL) of the author of the map, Alfred Löffler.
On a closer inspection, the war damage map might raise some questions regarding its scientific credentials. First of all, it does not have a map grid, a typical feature which allows easy of use. Nor does it have the index of all the streets in the city. Not even all street names are provided, nor are there house numbers shown. The map uses city blocks as units, not individual structures (i.e., there is no distinctions made between buildings and yards). This seems to be a problem for a map intended to show the destruction caused by the war.
Not all colors used on the map are explained in the legend. However, it is not difficult to understand that brown is meant to represent built-up areas. It is worth noting here that this category also includes yards, pavements, and other free spaces between the buildings. Green color is used for greeneries and blue for bodies of water. The legend includes a symbol for a destroyed bridge, and it does not include one for those that survived, even if such elements are also to be found on the map.
A black outline is meant to show buildings that were undamaged, but this is reserved for a very specific group of structures. Namely, it applied only to “significant” ones, whose survival or limited damage was specifically pointed out to the author of the map [ausdrücklich hingewiesen], as the legend puts it. In this way, it is suggested that some other “important” structures might have been saved as well, even further undermining its own reliability.
There is very little additional context in terms of authorship or the date of creation. Unfortunately, there is no information about who Alfred Löffler was. The municipal records indicate two people of that name in Cottbus in the late 1940s, but there is no proof whether any of the two made the map. 37 However, considering what the map shows, it is very likely that this person used pre-war detailed maps of Cottbus as well as the war damage reports, and thus had access to municipal documentation.
It is also not clear when the map was made, besides the fact that it must have been after the end of the Second World War. The street names, however, can help us in this regard. The map shows the Rudolf-Breitscheid-Straße and Karl-Liebknecht-Straße, which indicates that the map had to be made after November 1, 1946, when names of Kaiserstraße and Kaiser-Friedrich-Straße, respectively, were changed. Furthermore, the fact that Pücklerstraße is on the map shows that it had to be made before April 1950, when this street was renamed. 38
It means that the map of Cottbus was most likely created after the dust had settled. While there is, of course, a possibility that the map might have been made immediately in the aftermath of the bombing and the street fighting and that the street names were introduced later, it does not seem to be a likely scenario.
Löffler’s plan makes no claims to representing the situation correctly. There is an explicit warning that no guarantee is given for the validity of the depiction and an additional remark noting that probably more “significant” buildings survived than what the map shows. There is no grid, and not all street names or house numbers are shown. Individual buildings are not, in general, shown, but rather whole city blocks. All that seems to point out that it is not an objective mirror of reality, but rather an artistic interpretation of the situation. However, there is more to Löffler’s work that what it might seem at first.
Cottbus through Cartographic Lens
The war damage map not only shows damaged buildings, as one would expect on such a plan, but also highlights those unscathed by the war. However, as mentioned before, it is only “significant” ones whose survival or whose limited damage was specifically pointed out to the author of the map. It is also interesting that not all buildings marked as undamaged are labeled, even such prominent ones as the Spremberger Turm, a medieval tower within the city’s fortification which was refashioned in the nineteenth century by Karl Friedrich Schinkel (1781-1841). Equally, none of the destroyed buildings was named, not even old and new city halls or the city church [Oberkirche].
Löffler’s map, as one would expect, explicitly highlights churches (3) and schools (5). This is consistent with the five other maps of Cottbus consulted, all of which showed churches, and except for the 1960 map, schools were also highlighted. 39 A park in the north of the city (Kollwitz-Park on the war damage map) can also be found (under different names) on all the maps expect the 1909 one. 40 Another place which features on all maps, again except for the 1960 one, is public baths on the riverbank [Badeanstalt]. On some city plans, it is shown as a building, but in others, only its site is marked. Notably the 1927 map does it in a similar way to the war damage map. 41 Last, but not least, the city theater is displayed on all the maps, which is not surprising since it was considered the symbol of the city. It is worth noting that no other map shows the theater to have a similar shape to Löffler’s work.
The electric works as well as the slaughterhouse were other institutions which were seen as important for Cottbus’ cityscape. They can be found in all plans preceding the war damage map and on it, but they seem to go out of favor in the post-war period. Neither the 1954 nor the 1960 cartographic works show them.
The Synagogue in Jahr-Str was marked clearly on the 1909 and the 1927 maps, but for obvious reasons, it disappeared from the 1934 map. All three maps made before the war also marked the Wintergarten venue, a prominent site in the city (Liersch 2017). It cannot, however, be found on the war damage map. Neither is the post-office labeled, a constant feature of all the other maps. This is because the building in the Berliner Platz was damaged, as marked on Löffler’s work. The latter is also the only map to highlight the Karl-Marx-Halle, whereas the collage of education [Lehrerbildungsanstalt] located on the other side of the square can be seen on the all the other maps.
The comparison between six maps of Cottbus from the period 1909-1960 suggests that there was a shared understanding of which buildings were important for Cottbus. And while this civic topography of Cottbus evolved over time, it is possible to anchor Löffler’s work safely in this landscape.
Assessment of Cartographic Accuracy
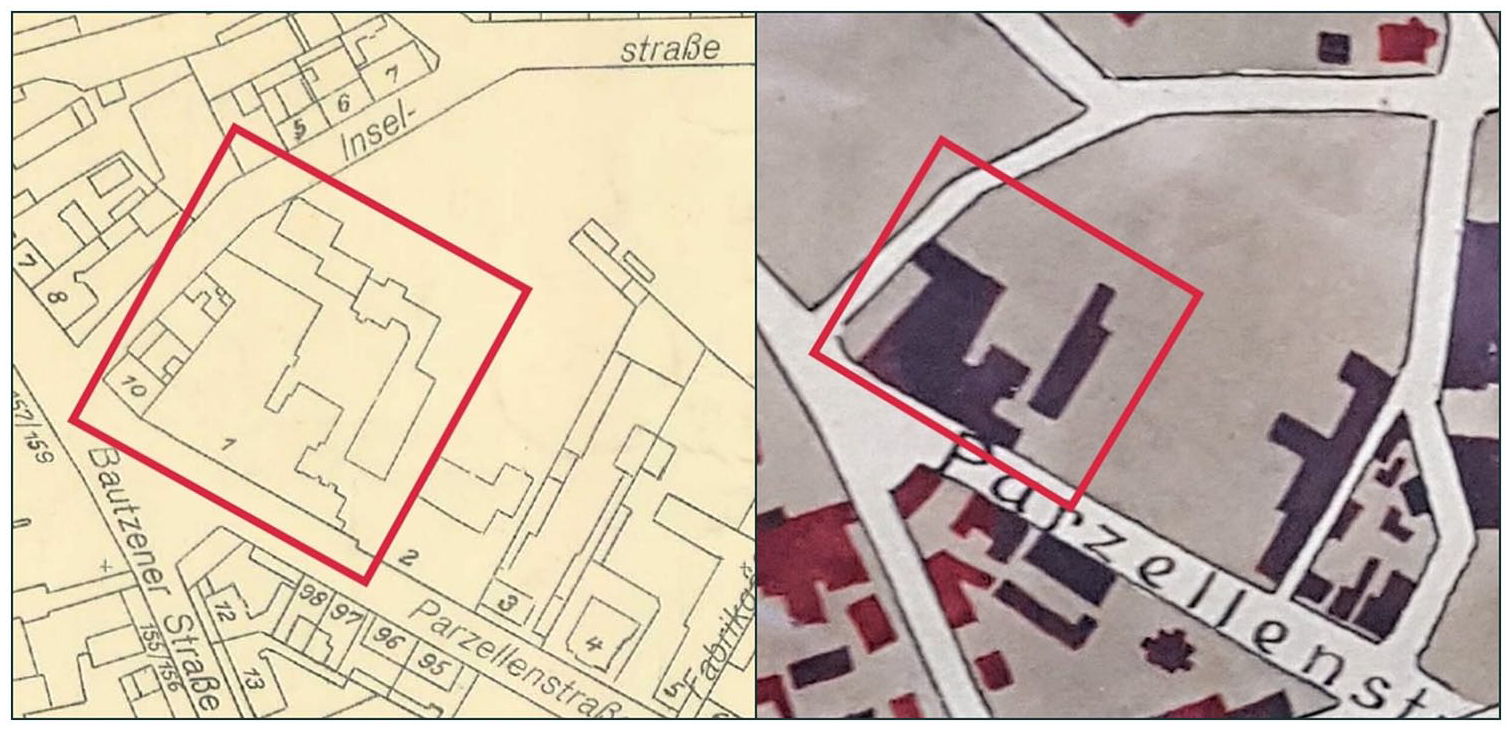
The comparison of the 1939 map to the war damage map shows striking similarities, even considering the limitation of the overlay. The shapes of the buildings in Parzellenstraße, for instance, are unmistakably recognizable on the war damage map (Figure 3). It is implausible to assume that someone could make such a plan without the use of a detailed pre-war map, even possibly this 1939 map. However, there are some significant omissions, which cast doubt on how exactly the map was made.
Parzellenstraße on the 1939 map and the war damage map.
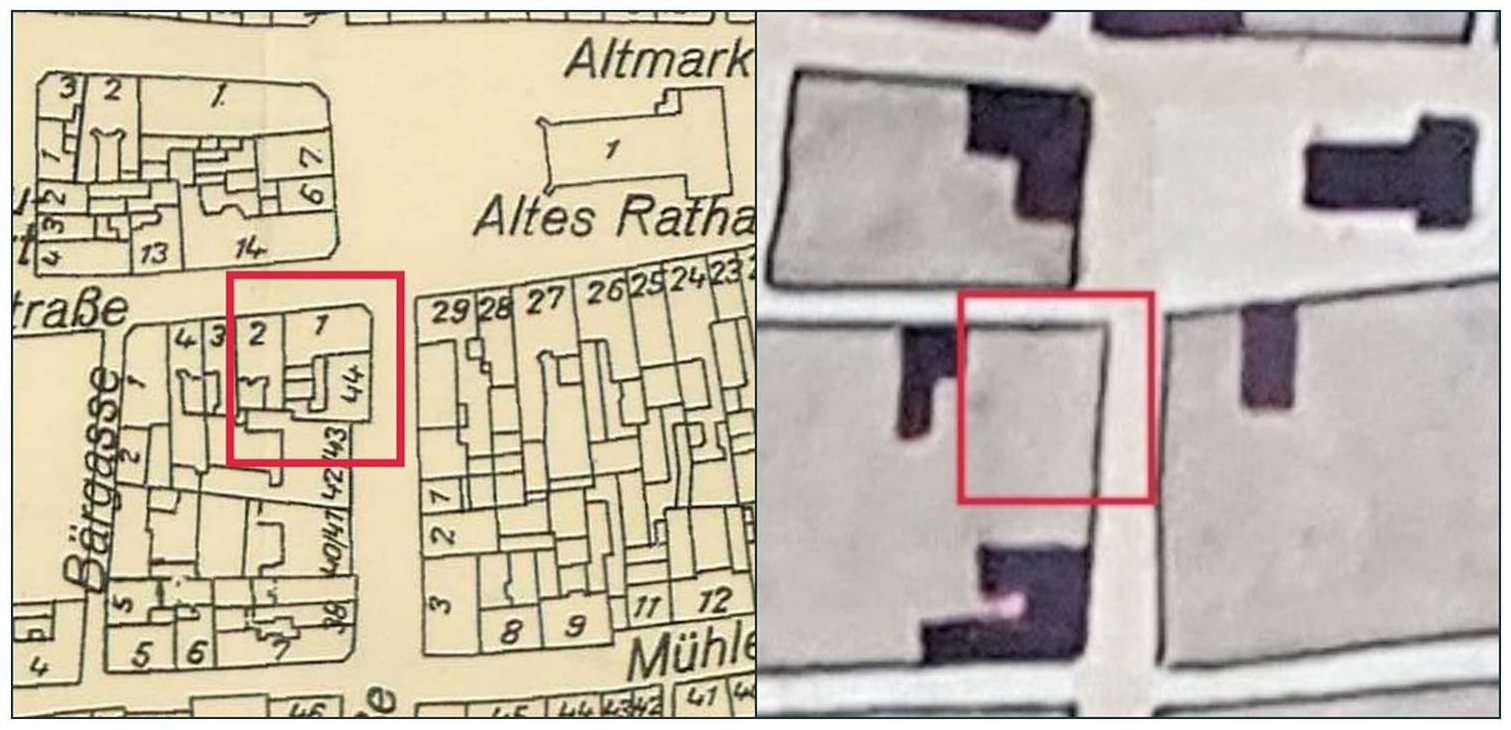
The comparison revealed a few significant errors on the war damage map. For instance, the latter simplifies the shape of the streets in some cases, for instance, on the 1939 map, we can see that the buildings Markstraße 1 and Sprembergerstraße 44 stick out into Sprembergerstraße which is not presented on the Löffler’s map, where the street is shown to be straight (Figure 4).
Sprembergerstraße 44 on the 1939 and the war damage map.
Moreover, there are some inconsistencies when it comes to the built-up areas of the city. For instance, Weisenstrasse between August-Babel-Straße (Bismarkstraße) and Karl-Liebkneckt-Straße (Kaiser-Friedrich-Straße) is shown to be unbuilt; however, the 1939 map clearly shows that it was lined up with houses (Figure 5). Similarly, Marienstraße between Taubenstraße and Dresdenerstraße is shown to be undeveloped. Indeed, the whole block of Marienstraße, Taubenstraße, Dresdenerstraß, and Blechenstraße is colored green, presumably indicating that it was a green space. Yet, the 1939 map shows buildings in the northern part of this city block. Both interwar maps show the buildings along the Marienstraße. 42
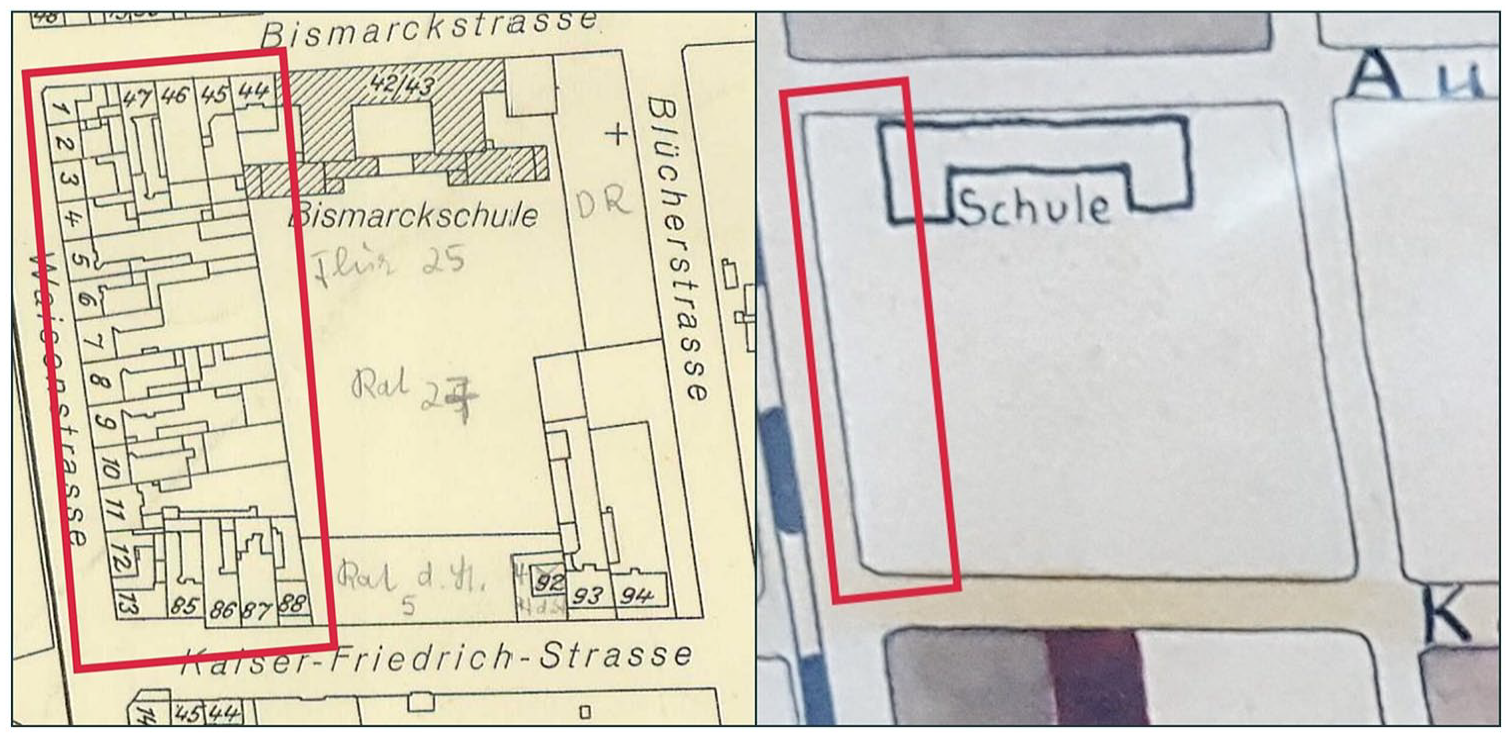
Waisenstraße on the war damage and the 1939 maps.
In the very north of the city, west from the northern cemetery, a single building is marked as damaged. This building seems to have stood within a huge city block between Schwerin Straße, Sielower Landstraße, and a narrow (unnamed) road at the side of the graveyard. However, if we compare the Löffler’s plan with the 1939 map, we can clearly locate the house as standing along Alvenslebenstraße, which divided the said city block. Furthermore, there were three other streets that “disappeared” on the war damage map.
Finally, there is the case of the city theater (Figure 6), which it could be argued was the symbol of the city, depicted on numerous postcards and mentioned in virtually every description of the city. 43 Taking this into account, it is somewhat surprising that such an important building would be shown imprecisely on the war damage map: not only does its outline not correspond to the shape it had on the 1939 map, but its location is also slightly misplaced (Figure 7). As I have mentioned before, none of the earlier maps of Cottbus showed it as it does on Löffler’s map. Both interwar plans show the characteristic rounded form. 44 It is possible that the theater building was simply so difficult to draw that its shape was simplified. Maybe it was left until the end of the project and then it was finished hastily. This seems plausible considering the schematic outline of the theater building, contrasting enormously with the elaborate shape of the actual building. This is nonetheless a hypothesis which cannot be verified at this point.
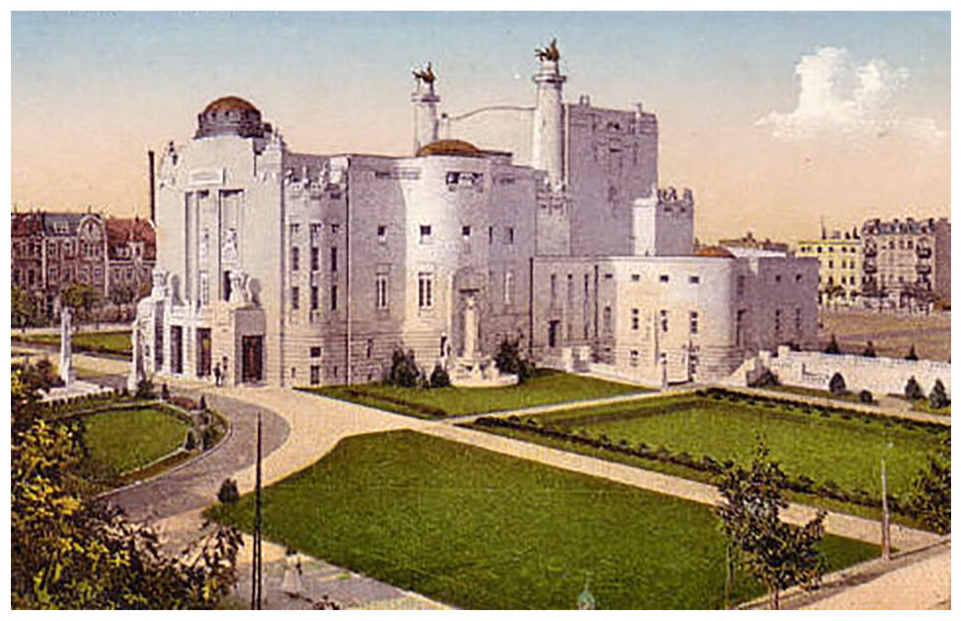
The theater building in Cottbus; Anon, Postcard, ca. 1916.
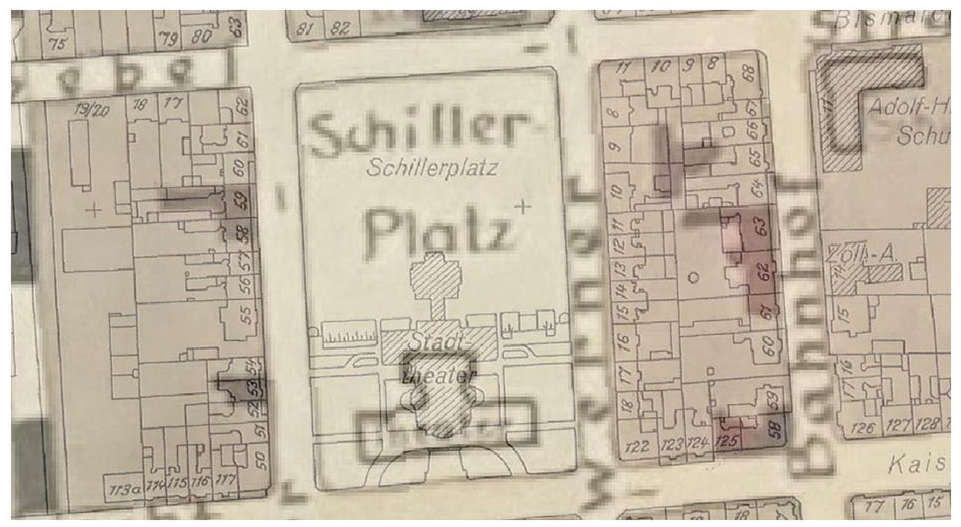
The theater building on the 1939 and the war damage maps.
A comparison of the 1939 and Löffler’s map using the QGIS software revealed that the latter was clearly made on the basis of a detailed map of the city. Despite its artistic appearance, the war damage map is therefore not “merely” a work of art, but it is also an actual map of the city. Despite this, it contains some noteworthy errors. Some of them can be attributed to the fact that it was made manually (e.g., the “strengthening” of streets), whereas others are more difficult to explain (e.g., “removing” whole row of buildings from the cityscape). The changes to urban morphology that occurred since the 1939 did not explain those inconsistencies, for example, erasing a whole street from the map. Finally, there are traces of some of the changes that occurred during the war to the urban morphology. Namely, a camp-like structure on the right side of the river (close to the railway line) is marked as destroyed on the war damage map. These buildings were not indicated on the 1939 map.
Verification of War Damages
As mentioned in the introduction, war damaged maps have been primarily examined to extract information about the destruction. How credible is Löffler’s plan in this regard? The comparison with two archival documents can help us answer this question. The first register can be found in the archival file containing the internal municipal correspondence written between 30 April 1945 and 22 May 1946. 45 Each of the buildings listed in the register (identified by its street addresses) is categorized into one of the three groups: light damage, heavy damage, and destroyed. In addition, there is a column of remarks, which explain these assessments. There are such entries as “roof and window glass damaged” (light damage), “one side collapsed” (heavy damage), and “burned out” (destroyed).
The other register comes from files containing war damage (reparation) applications. In the introductory text, one finds the information that in total 174 such applications had been received; that 14 percent of all the apartments in the cities are partly heavily, partly, or completely destroyed; and that 54 industrial plans were completely destroyed. However, according to this introduction, this was only a fraction [einen Bruchteil] of all the damages in the city. The register itself is not uniform, and different parts of the cities seem to have been surveyed by different people who made the assessment in slightly different ways. Having said that, there are only two categories used: totally destroyed and heavily damaged. These are not just ticked but assessed as applying either to the whole building or only to a part which is reflected by the use of 1, ½, ⅓, and ¼ in the appropriate column. Furthermore, in some of the sections of the register, a separate category of “risk of collapse” [Einsturzgefahr] is used, and in other, this is noted in the remark section. In the latter, we can sometimes find information on the type of the building (front building, rear building, factory building, etc.), and in other cases, this is a distinct column. Finally, names of the owners of the properties are recorded for a part of the register.
The northern end of the Parzellenstraße (house numbers 1-7 and 93-98, 14 properties in total) was covered by the three sources. Out of those on the war damage map, three are shown to be unaffected by the war (no. 2-4), and the rest as being totally destroyed. The first register listed six properties as totally destroyed (no. 6-7 and 96-98) and two others (no. 1 and 93) as partly heavily damaged and partly destroyed. 46 The other register counted all fourteen properties on this section of Parzellenstraße as affected by the war, but one of them (no. 3) was counted as only lightly damaged, three other properties (no. 2, 4, and 98) as heavily damaged, and the rest as destroyed. 47
That means that in five cases (35%) all three sources completely agree in their assessment, furthermore in two other cases two sources classified a building as totally destroyed, whereas one assessed those buildings to be partly destroyed and party heavily damaged. Furthermore, one building is categorized as lightly damaged, and in two other sources, such a category was not used; thus, in principle, there was no difference there. That means that in eight cases (58%), three sources share the assessment of the situation.
However, if we consider only the two post-war sources, that is, the map and the second register (StAC Sig. 579), an interesting pattern emerges. Namely, they disagree only in the assessment of three houses (21%). This is true also for other streets. In Marienstraße (no. 1-30), if we discount light damages, there are four houses (13%) assessed differently between the map and the register. In Lausitzer Straße (no.1-58), out of thirty-three houses, the two sources agreed in twenty-four cases (73%). To be sure, in some streets, they were not as unanimous. In Taubenstraße on the map, five buildings are marked as totally destroyed (no. 10, 11, 14, 20, and 21) and one as heavily damaged (no. 9), whereas in the register, buildings no. 9-11 are not recorded at all, and the others are marked as only light damaged (“damages to roof and windows”).
All in all, for those streets analyzed, it seems that in general, the war damage map and the second register confirm each other, but the map tends to have more buildings marked as affected by the war than the register. The first register provided confirmation of fewer cases. This can be explained by a few factors. First, the first register was created before the fighting during the liberation of the city by the Soviet forces. Second, even its author(s) acknowledged that it was far from being complete. Finally, we know from other cities that the initial assessment of the war damages tended to be more conservative than others made later on. 48 Paradoxically, in some cases, the further away temporally from the war, the greater the damage recorded.
Context of the Genre
The maps documenting the war destructions were often made from the written documentation; however, there are also cases where damages were recorded directly on a map. Moreover, maps were used not only to record and visualize destruction but also to serve as an aggregator of different data. Thus, Sedlmeyer argues that one should distinguish between three distinct layers of information: recording of bomb sites, assessment of damages, and reconstruction plans. 49 Not all damage maps cover all three layers; the Löffler’s work falls into the second category only.
The function of war damage maps, especially if they were made after the end of the military conflict, was typically to locate available building sites and help to determine which buildings and in what form should they be reconstructed (e.g., redrawing building lines) or reserved sites for specific purposes (e.g., building or widening of roads). Dühr argues that one should distinguish between “internal maps” intended for analysis and reference within administration and “external maps” made as a method of influencing the public opinion. 50 For instance, Polish authorities published a Polish-English map of Warsaw in 1949 to show the scale of the destruction caused by the NS regime in the Polish capital and therefore strengthen the Polish claims on the international stage. 51
The analysis of the Atlas Kriegsschadenskarten Deutschland shows that most maps were made using the pre-war cartographic documents. 52 As this paper demonstrates, this was also the case with Löffler’s work. However, in contrast to the latter, others did not mask the base map, but rather used them to mark the damages. In practice, this means that the older map is not painted over, as was done in Cottbus, but rather individual color or hatchings were used to signify war damages. Spaces between the buildings (e.g., yards) are usually visible because individual buildings rather than whole city blocks were marked, which is not the case with the war damage map of Cottbus. Similar to Löffler’s map, most of the other city plans were colored by hand. However, they were not pained but rather marked using a color pencil or pen.
As mentioned before, in Germany, already during the war, a directive on the assessment of war damage was published on July 15, 1944. 53 It is worth noting that a scale of 1:5,000 was prescribed as the “main scale” [Hauptmaßstab] for such maps. Furthermore, only total destruction or heavy damage was to be recorded. In terms of color scheme, it was prescribed that black should be used for destroyed, red for damaged, and white for unscathed buildings. Without mistake, we can see that Löffler’s work complies with those terms, even if not entirely, as it uses white only for “significant” buildings and brown as a default color.
Examination of other maps gathered in the Atlas provides us with some interesting counterexamples. For instance, the 1946 maps of Essen also used brown as a default color and mark the damage with light and dark red. However, they also provide explanation of what those categories mean (percentage of damage) as well as showing the municipal border with thick black lines. 54 The 1944 plan of Freiburg im Breisgau uses blue for light and medium damages and black for heavy damages and destroyed buildings. 55 Blue was also used for light and medium damage on the map of Nürnberg from April 1945, and heavy and total damage was marked with two shades of red. 56 These examples come from the west part of Germany and were made either during the war or right after it ended. The Atlas also shows a few plans for Leipzig, but these are substantially different from Löffler’s work (e.g., one map marks each wave of bombing). The maps made in the following years tend to be designed in the process of making the reconstruction plans, which is also quite different from the map at the center of this article.
And this seems to be what makes the plan of Cottbus different. It contains no indication that it was made to facilitate reconstruction. Some early reconstruction plans made for 1947 planning competition in Cottbus were preserved (e.g., Freese’s plan, Figure 8). Interestingly the area to be redesigned was not the one most destroyed by the war. 57 For example, south of the train station was not covered by those development plans. On the other hand, the war damaged map of Cottbus does not show any planned works, such as projected roads, new parks, and so forth.
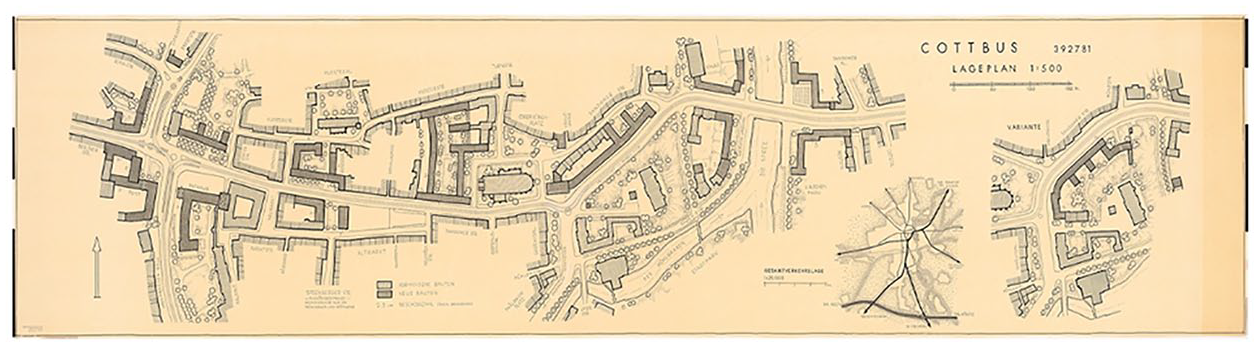
Hans Freese (1889-1953), Wiederaufbau Cottbus, 1945-1953; Architekturmuseum der TU Berlin, Inv. Nr. 10333.
The comparison with other German war damage maps shows, therefore, that the Löffler’s plan fits into the genre, through the use of similar scale and color scheme as well as categories of damages. It does deviate from the trend by not revealing the base map as well as by not showing individual buildings. Considering that it was made most likely in the late 1940s, it is also different because it is not meant as a part of reconstruction plans. We should however remember that Löffler’s map is not part of the municipal documentation; it is not even stored in the archive. Rather it is part of the museum collection. Most published war damage maps, including those shown in the Atlas Kriegsschadenskarten Deutschland, stem from the archives. These, as we can see, were made for practical purposes (“internal maps” in Dühr’s terminology), either to facilitate removal of debris or to be used in the reconstruction process. Löffler’s work would be rather useless for this. 58 However, there is no indication that this map was made to serve practical purposes. And in this context, its inaccuracies and distortions should be considered. 59 It was most likely made to commemorate the destruction experienced in 1945. The map’s inaccuracies do not impede this purpose. The map communicates which areas were hit and summarizes the scale of destruction. And in this sense, Löffler’s plan has more in common with ruined churches left in cityscapes to remind us of the war than it does with the war damage plans made in the process of preparing the post-war reconstruction. 60
Spatial Narrative of Post-War Cottbus
What are we to make of the war damage map by Alfred Löffler? First of all, it actually is a map, not “just” an artistic vision of the wounded city, and a rather precise map too, most likely based on the detailed pre-war map of Cottbus. The damages shown on it were not painted according to reasons of compositions, out of the artist’s imagination, but were rooted in the administrative records. That does not mean, however, that Löffler’s map can be trusted without reservations. Neither the depiction of the urban space nor the presentation of the war damages is flawless. The map shows a tendency toward more generous interpretation of the damages.
The comparison with five other maps of Cottbus shows that Löffler’s work uses well-established understanding of the civic topography of Cottbus. The same categories of buildings which had been considered important in the preceding decades were marked on the war damage map. It can be thus argued that this made the war damage map more accessible to the inhabitants of the city. However, not all buildings were named, but only those that survived. Thus, it is surprisingly unsentimental, for instance, about the loss of the old city hall. While commemorating the damages experienced in the city, it also discards the lost heritage.
Comparison with a selection of other German war damage maps indicates that Löffler’s work fits into the genre: It uses the same scale (1:5,000), the same categories (heavy damage, destroyed), as well as the color scheme often applied on such maps. However, there is no map grid, outlines of individual buildings are missing, and not all streets are signed. The base map is also concealed. Moreover, there are some inaccuracies in its depiction of the cityscape. All this supports the conclusion that it was not intended to be used in the reconstruction process, but rather was meant as a commemorative device.
This draws our attention to the fact that maps do not have to be always understood as technical instruments or scientific products striving for perfection, useful in urban planning, and other such practical goals. They can serve other purposes too, regardless of their title and the genre they appear to be part of. To fully understand them and appreciate them, we should assess them according to their intended purpose and the intended public. In the case of Löffler’s work, the cartographic imprecisions would make it a flawed tool for post-war reconstruction, but they did not undermine the commemorative function. It is likely that similar maps exist in other cities, but until now, they did not draw enough scholarly attention, possibly because they did not adhere to the scientific criteria of cartography.
Acknowledging the shortcoming of Löffler’s map in terms of its precision does not invalidate it as a spatial narrative. The methodology of this paper suggests that it is a story that highlighted what was saved in terms of civic infrastructure, rather than what was lost. At this same time, it drew attention to the magnitude of the destruction, from a single house in Richard-Wagner-Straße in the very north through the old city to Dresdener-Straße on the very southern edge of the city. Likely it was a tale intended for the inhabitants of Cottbus, who could easily recognize their own homes. It was a picture that showed both waves of destruction, in February and in April 1945, the latter of which was not discussed in public.
Footnotes
Acknowledgements
I would like to thank Udo Bauer (Stadtarchiv Cottbus) for his immense support and assistance during my research at the City Archive in Cottbus. An early version of this paper was presented at the X AISU Congress—Adaptive cities through the Postpandemic Lens—Times and challenges in urban history (2022). This paper would not be possible without Georg-Felix Sedlmeyer (Otto-Friedrich University Bamberg) generously sharing insights into his in-depth knowledge of the German war damage maps. I’m very grateful to John Pendlebury (Newcastle University), Laura Demeter (Otto-Friedrich University Bamberg), and Carmen Enss (Otto-Friedrich University Bamberg) who took their time to read and comment on this paper, which helped in its development.
Declaration of Conflicting Interests
The author(s) declared no potential conflicts of interest with respect to the research, authorship, and/or publication of this article.
Funding
The author(s) disclosed receipt of the following financial support for the research, authorship, and/or publication of this article: This research was supported by the German Federal Ministry of Education and Research (Bundesministerium für Bildung und Forschung, BMBF) Project UrbanMetaMapping: Planung (01UL2004C). The Leibniz Institute for Research on Society and Space (IRS) has provided the means for Open-Access publication.