
Abstract
The aim of this paper is to discuss the problem of describing an urban plot and to propose a definition that can be used in comparative studies of historic towns. The need for a uniform definition results from comparative research using spatial databases and historical GIS (hGIS). The article discusses the problems in vectorization of plots for the purposes of hGIS analyses, as well as the methods of presenting urban plots on historical plans that have been used so far, on the example of the Historic Towns Atlas series. We compared the results of the analysis with the plot definitions appearing in the literature on urban studies. Based on the literature review and research discussed in the article, we developed and proposed a plot definition for the ontology of historical urban spaces.
Introduction
Plots (or parcels) are often the primary point of reference for urban study analyses. According to Michael R.G. Conzen, there are three basic elements of the town plan: streets (street-system), buildings (block-plans), and plots (street-blocks). 1 Michael P. Conzen has argued that “[an] individual urban plot is a fundamental spatial unit embedded within the town plan” since Lower Saxony atlases appeared in the 1920s. 2 Plots could form the basis for all the comparative approaches listed by Dietrich Denecke: qualitative, quantitative, temporal, and spatial. 3
When engaged in historical research, it can be difficult to indicate the exact location of a building which no longer exists. However, it is possible to determine on which plot it was situated, and the location of that plot is either reconstructible or its boundaries have survived to modern times. Therefore, plots are the basic reference point in many kinds of urban studies. They have always been essential in sociotopographic studies. 4 With the development of historical GIS (hGIS), analyses involving plots could have been used and shown potential to become more approachable and elaborate. As shown by Keti Lelo, analyzing cadastral maps in conjunction with additional census data and geostatic analyses enables drawing conclusions about many socio-economic aspects. 5 Plots could be used, for example, to reconstruct destroyed urban space, 6 social relationships, 7 real estate markets, 8 or analyze urban development in relation to social conditions. 9 Sometimes projects result in the emergence of historical urban geoportals. 10 Plots are also used as a basic reference area in citizen participatory projects. 11
Research on urban spaces is often conducted on the example of a specific town over a defined period of time. Thus, the proposed concepts and their definitions may refer to a specific period in history, or equally well to a specific urban space, or selected towns which were founded under the same law or had a similar pace and manner of development. This makes it difficult to conduct comparative studies. These studies could facilitate the understanding of many aspects of urban phenomena by comparing towns and cities to other towns and cities from different parts of the country, continent(s), or even the world, showing to researchers parallels and disparities in phases of the history of many urban centers. 12 Due to the fundamental importance of plots in the space of a particular city, they play the main role in many comparative analyses. As Denecke stresses, comparable specialist terminology is essential for comparative urban studies, since it conditions mutual understanding between researchers. 13 Denecke emphasized that such terminology should be developed with reference to “national conditions and languages.” Anngret Simms 14 describes several barriers to comparative topographical analysis. Among them, she lists: language barriers and different terminologies, universal comparability of data, and conceptual differences.
In research conducted with the use of databases, using domain ontology may prove to be the method for solving these problems. One of the aims of the Historical Ontology of Urban Spaces (HOUSe) project 15 is to develop a domain ontology 16 based on the Historic Towns Atlas (HTA) series and tailored to the needs related to the digital turn. 17 The HOUSe ontology (also referred to as “UrbanOnto”) structure is based on the Topographic Object Database 18 (hereinafter: BDOT10k). Tomasz Panecki 19 was the first to embark on completing the BDOT 10k structure with objects appearing on old maps. This structure was then supplemented by the HOUSe project with objects present in historical urban space in order to create UrbanOnto ontology. The developed UrbanOnto ontology was used to construct the HOUSe database model. The application of ontology in relational databases is profitable for effective data retrieval, and sharing information and knowledge. 20 Ontologies have been successfully implemented in historical research. 21 Work on the historical ontology of urban spaces requires compilation and comparison of notions and their definitions used in various studies across Europe. Research on each part or element of the urban space involves exploration and comparison of written and cartographic sources. This step is necessary for the developed domain ontology, so as to render it applicable to studies of various towns and comparative research.
As plot is a commonly used term, we decided it should be among the first designations to be developed in the HOUSe ontology. We approached this task with full awareness of both its importance and difficulty. The need for this definition also arose from a problem encountered during the vectorization of the base map used in the project, when we ran into difficulties in the precise delineation of plots. We discuss these obstacles in the second section (Urban Plots in GIS). Further on, in the third section (Urban Plots on HTA Plans), we discuss the matter in relation to the solutions employed in the HTA series. In the next section (Urban Plots—State-of-the-Art Review), we summarize our conclusions on selected plot definitions appearing in literature and put forward the definition developed under the HOUSe project.
Urban Plots in GIS: Warsaw Case Study
In order to test the HOUSe ontology developed under the project and the accompanying database, it was necessary to select a test site. Warsaw was chosen as the case study and trial research area. An HTA volume has not yet been developed for Warsaw, but is planned for this city. It had already been decided that Lindley’s Plan, at the scale of 1:2,500, was to serve as the base cadastral map for the future HTA volume on Warsaw. We therefore decided to use this cartographic material as the base map for the HOUSe project as well. As a result, our base map is a plan prepared under the direction of William Heerlein Lindley for the purposes of constructing the water supply and sewage system from the 1880s. As part of the preparatory work, a series of plans with scales from 1:200 to 1:25,000 were developed at that time. This is the first fully mathematically precise material. 22 For project purposes, we use the plan at the scale of 1:2,500 which consists of 26 sheets (hereinafter referred to as “Lindley’s Plan” or “base map”). It presents the exact grid of town streets and buildings. This material provides street names and numbers assigned to individual plots. All sheets are available in digital form at the website of the State Archive in Warsaw (SAW). 23 The whole plan covers about 88 sq km, which corresponds to 17 percent of the current city surface area. For comparison, when the map was produced in the late nineteenth century, most town buildings were still situated within the Lubomirski embankments constructed in 1770 (about 20 sq km, Figure 1). Lindley’s Plan, that is, the cartographic material used in the project, had been in constant use as an urban document in public offices and in surveying. Its contents have been updated in magenta ink even 50 years after the development of the plan. 24
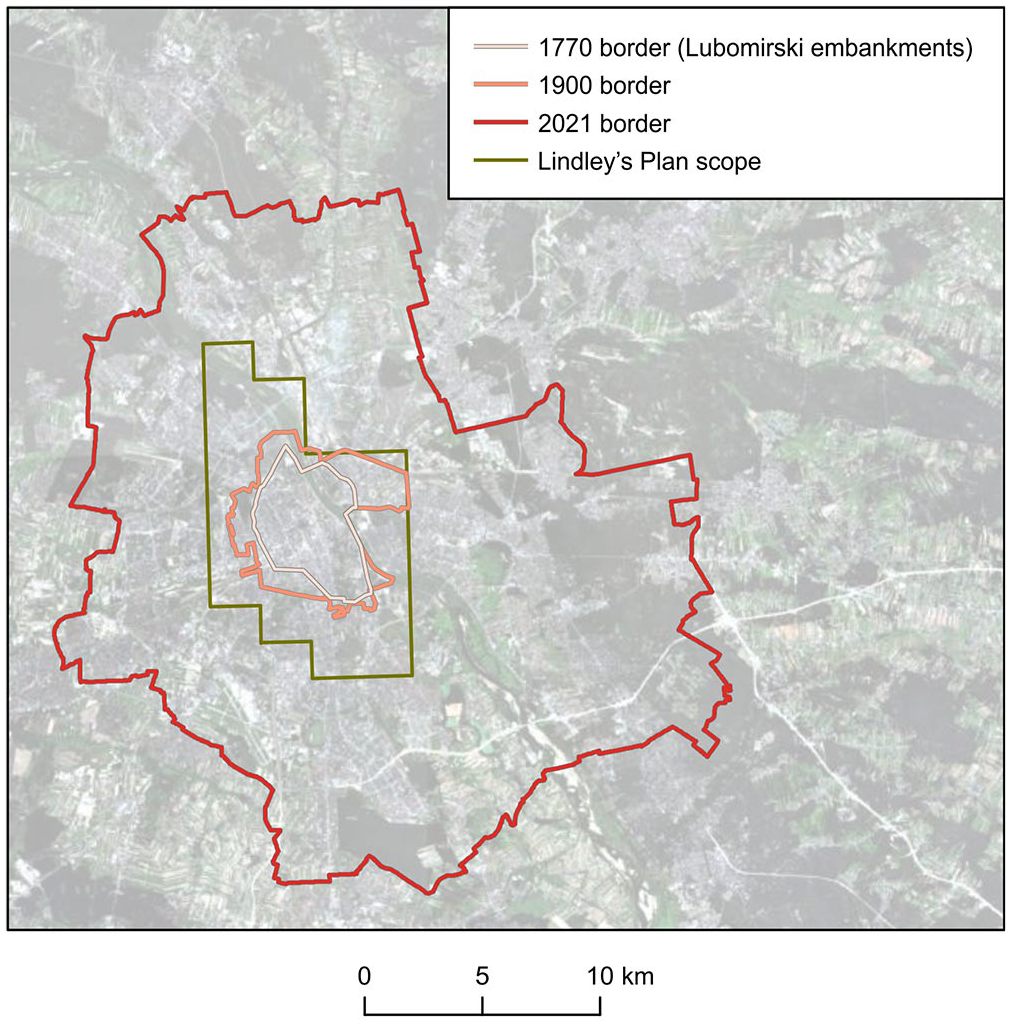
Lindley’s Plan and today’s Warsaw (SAW sign. 72/1001/0/1.9/785; orthophotomap and 2021 border from National Geoportal, https://www.geoportal.gov.pl/).
Lindley’s Plan presents the division of Warsaw into plots, that is, the land framework stemming from urban fragmentation processes which Old Warsaw witnessed since the turn of thirteenth and fourteenth century, and which prevailed until the end of the eighteenth century in the suburban areas of Old and New Warsaw. As the suburban areas of both Warsaw’s experienced demographic growth, the need arose to carve individual plots out of previously undivided land. The eighteenth century in particular ushered in an intense division of suburban space. Depending on the landowner, plot delimitation was either well-thought-out or spontaneous. The former case is well illustrated by Bielino, a private district carefully demarcated within the south-western part of the suburbs of the royal town of Old Warsaw. Another example of precisely outlined plot borders can be found at the northern tip of the New Warsaw suburbs, that is, the land held by the Holy Spirit Hospital. Otherwise land subdivisions emerged spontaneously, in a manner dependent on the financial capacity of the buyer or topographic conditions. 25 The numbers assigned to individual parcels date to 1784. Of course, the plot division depicted as of that year continued to evolve, with land units being merged and subdivided, and new parcels appearing in areas not subjected to parcellation before 1784.
In the project, tackling plots was the first step taken toward map vectorization since this land unit constitutes one of the three main elements of any town plan, and forms the basis for further analysis. M.R.G. Conzen names three distinct complexes of the town plan: streets, plots, and buildings. 26 Based on Conzen’s three-layer composition, the next subsection will discuss the plot and its place in database structure, its hierarchy, and its relations to other elements. Below we discuss the problems that arose in the vectorization process. The main focus was on cases where the cartographic source did not enable determining the exact plot boundary, that is, where it was not feasible to identify relations between plots and streets, as well as between plots and buildings, plot numbers, symbolization of borders, and the life of a plan.
Relations between Plots and Streets
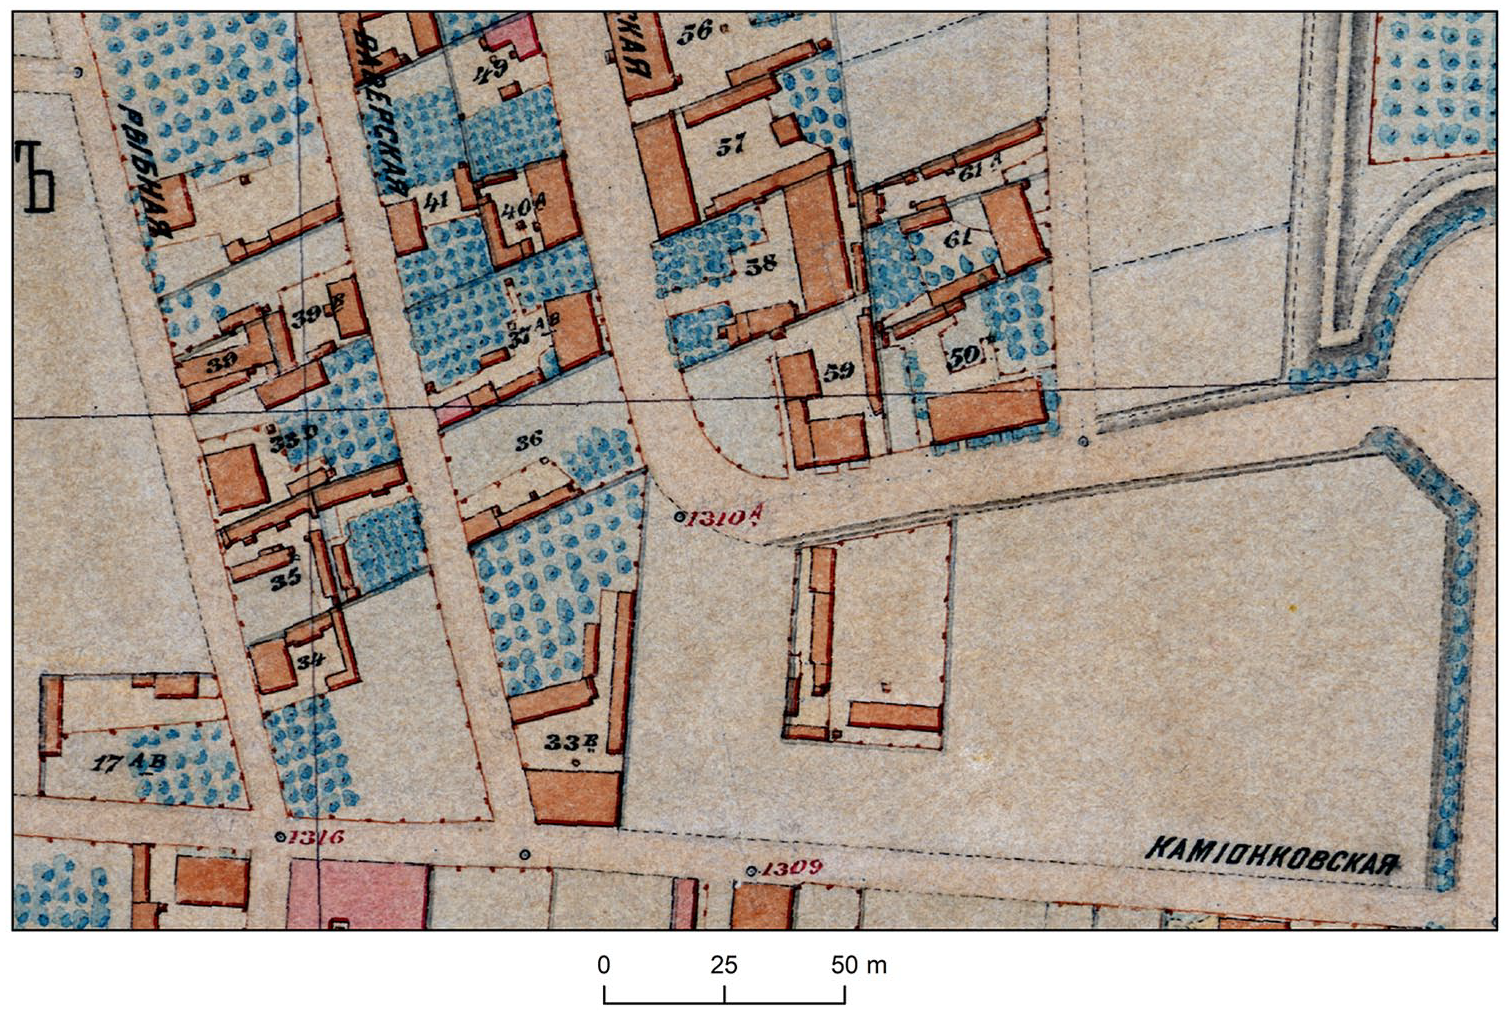
M.R.G. Conzen stated that streets and plots were separate systems 27 . When looking at the real, physical urban space and its model (town plan) alike, however, it proves challenging to relate Cozen’s theory to practice, and to separate or distinguish space for plot and street layers. Figures 2 to 4 present cases of interweaving layers—of plots and streets—encountered during the vectorization process. Figure 2 depicts examples of dead-end streets (cul-de-sac) placed on the map, including both those designating plot parts and those drawn as separate units. One may conclude that in some cases blind alleys formed part of a plot, yet in others they functioned in separation from plots, as individual elements of urban space. An example of the latter case is a cul-de-sac leading to more than one property. The following examples illustrate even more intense overlapping of the transportation network and plots. Let us start with park alleys, which constitute a subcategory of roads (Figure 3). At the same time, however, park alleys are substantial elements of plots with publicly accessible green space. 28 To give an even more clear-cut case, let us take the following example: as the transport network expanded, roads started passing through a plot of land without affecting its borders or internal division (Figure 4). The Lindley’s Plan depicts two plots bearing the same number (2317). At a more detailed scale (plan from Lindley’s series in a scale of 1:250), however, it becomes visible that the in-between plot numbers (2314 and 2315) have been crossed out. As a result, the longer side of plot 2317 is approximately 800 m and is intersected by two streets.
Examples of dead-end alleys—(right) not included, and (left) included in the structure of urban plots (Lindley’s Plan, SAW sign. 72/1001/0/1.9/785, sheets 2 (right), 15, 16 (left)).
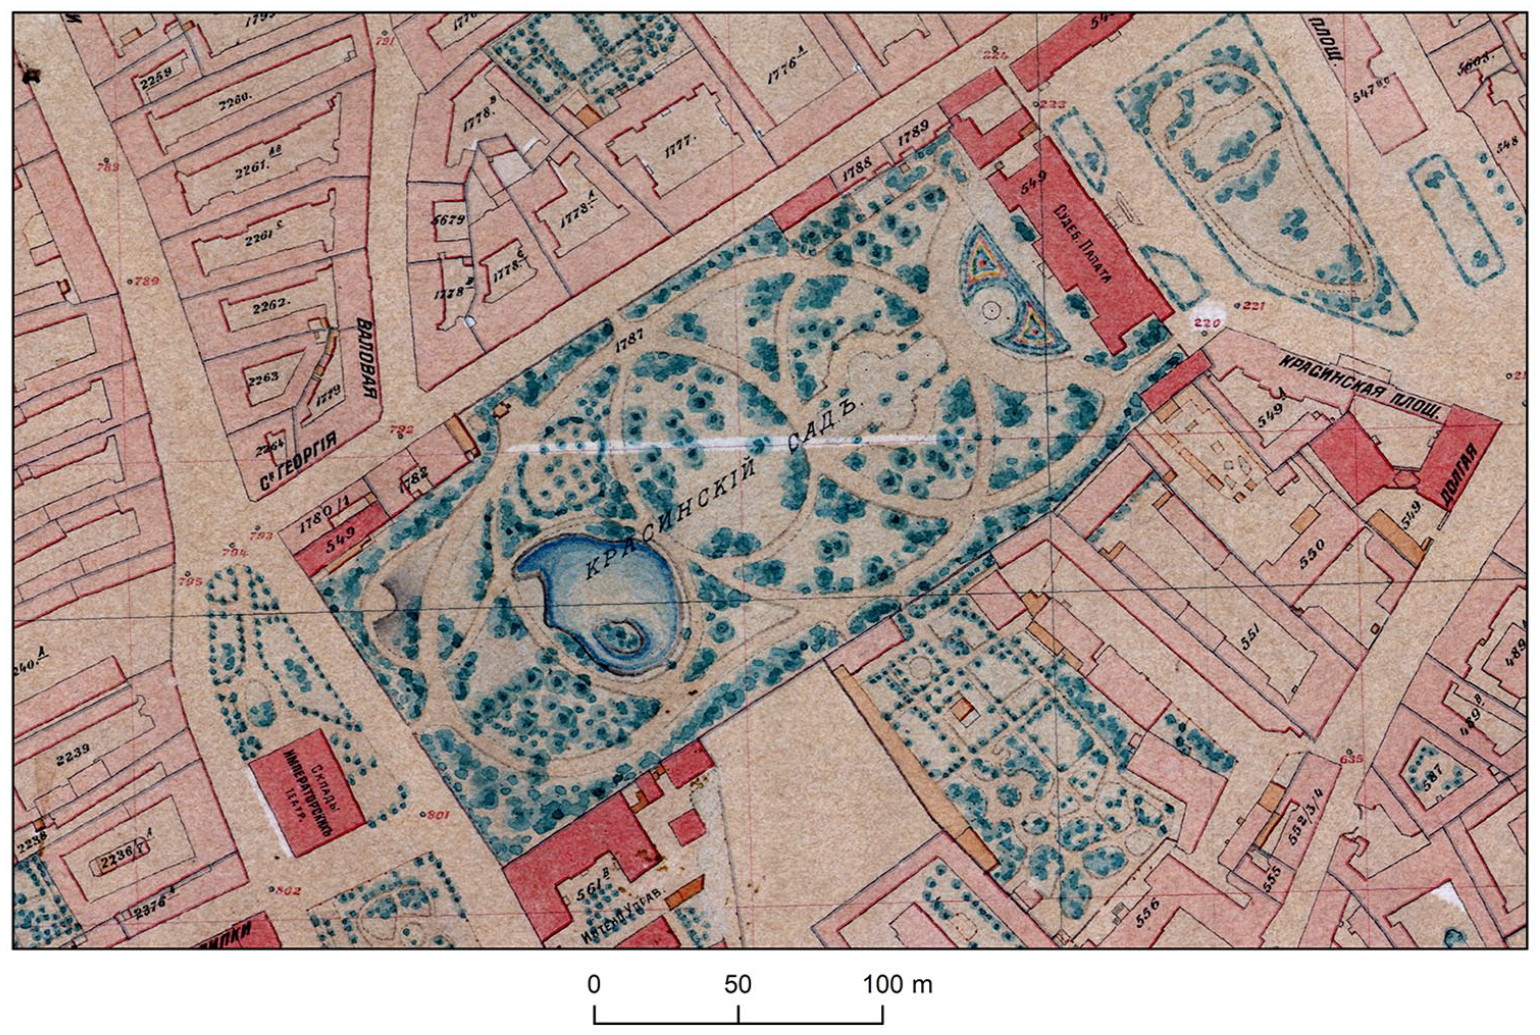
Urban plot with park traversed by alleys (subcategory of road) (Lindley’s Plan, SAW sign. 72/1001/0/1.9/785, sheet 11).
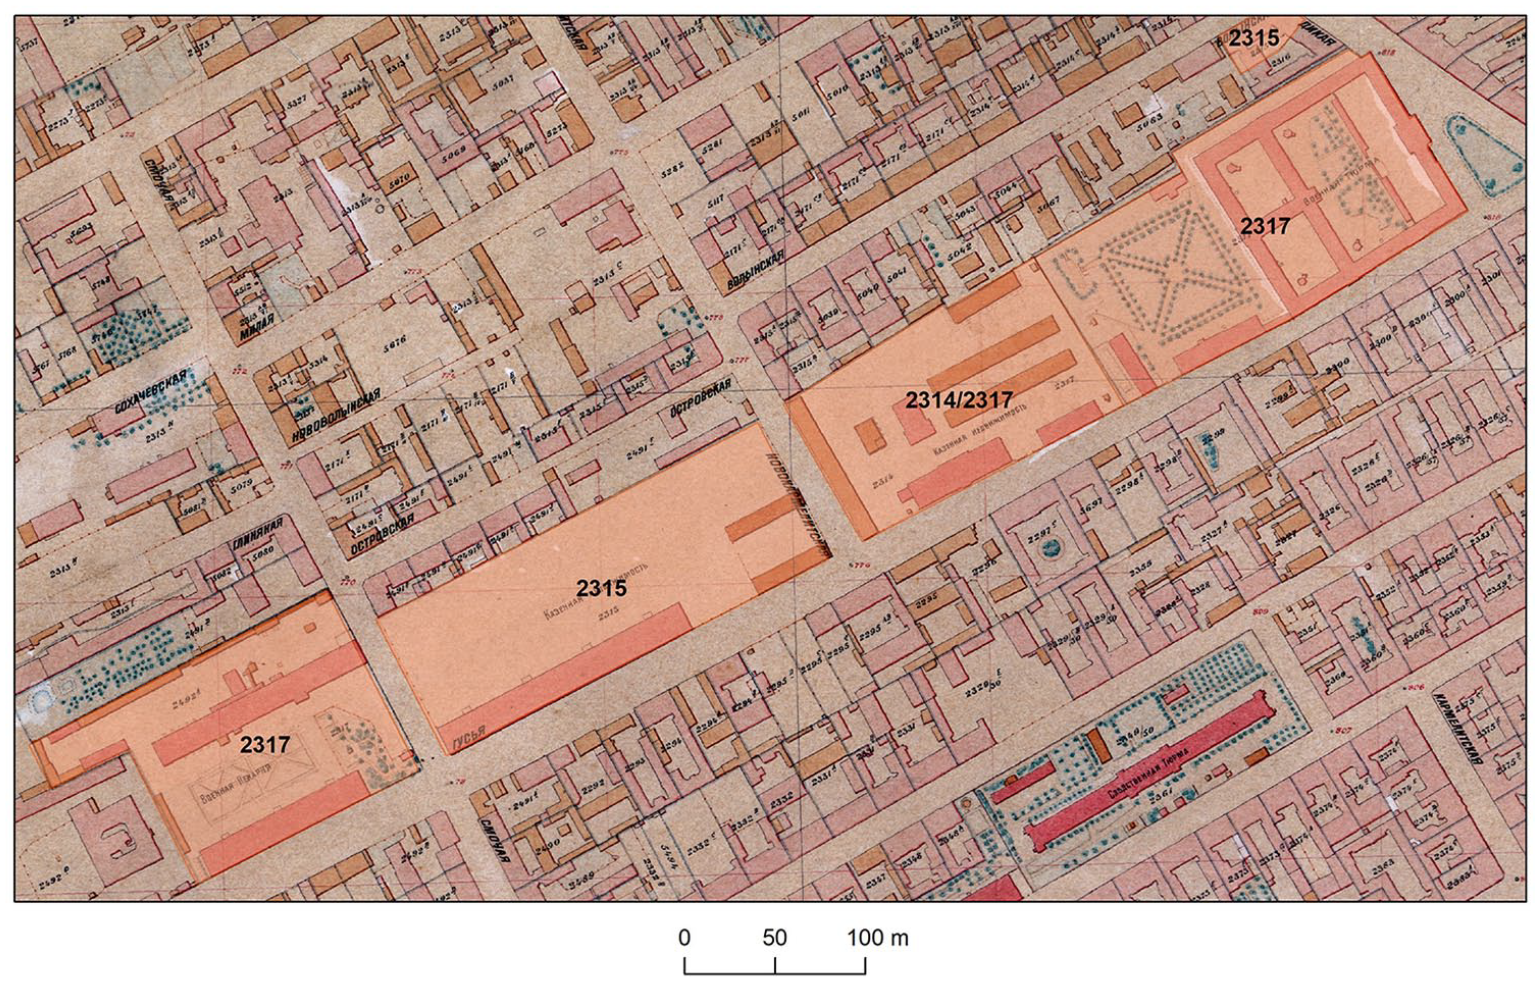
Example of urban plot intersected by roads as a result of transport network expansion (base map: Lindley’s Plan, SAW sign. 72/1001/0/1.9/785, sheet 11).
All above objects are separate street categories, and at the same time constitute important plot elements. Therefore, when applying Conzen’s triad, it is necessary to assign them to the correct layer. One solution is to make a strict distinction between objects forming part of the street system and objects which are plot elements. Another approach would be to state that these objects are simultaneously part of the street system and the street-blocks. Such an approach, though, would not yield a town structure—and consequently neither a database structure nor town plan situation—fully consistent with Conzen’s assumptions. HOUSe ontology has a hierarchical structure, with plots and streets constituting different categories. Moreover, it is not possible to assign one object to two ontological types (which belong to two different categories) at the same time. To address this, these layers should not be absolutely separated, but should be allowed to interweave.
Building without a Plot
Borders are the basic feature of an urban plot. Still, maps do not show plots for all marked buildings. This triggers the question of whether a parcel of land was delimited for such a “plotless” building at all. If yes, it calls for determining the course of plot boundary, and the possible source of relevant data.
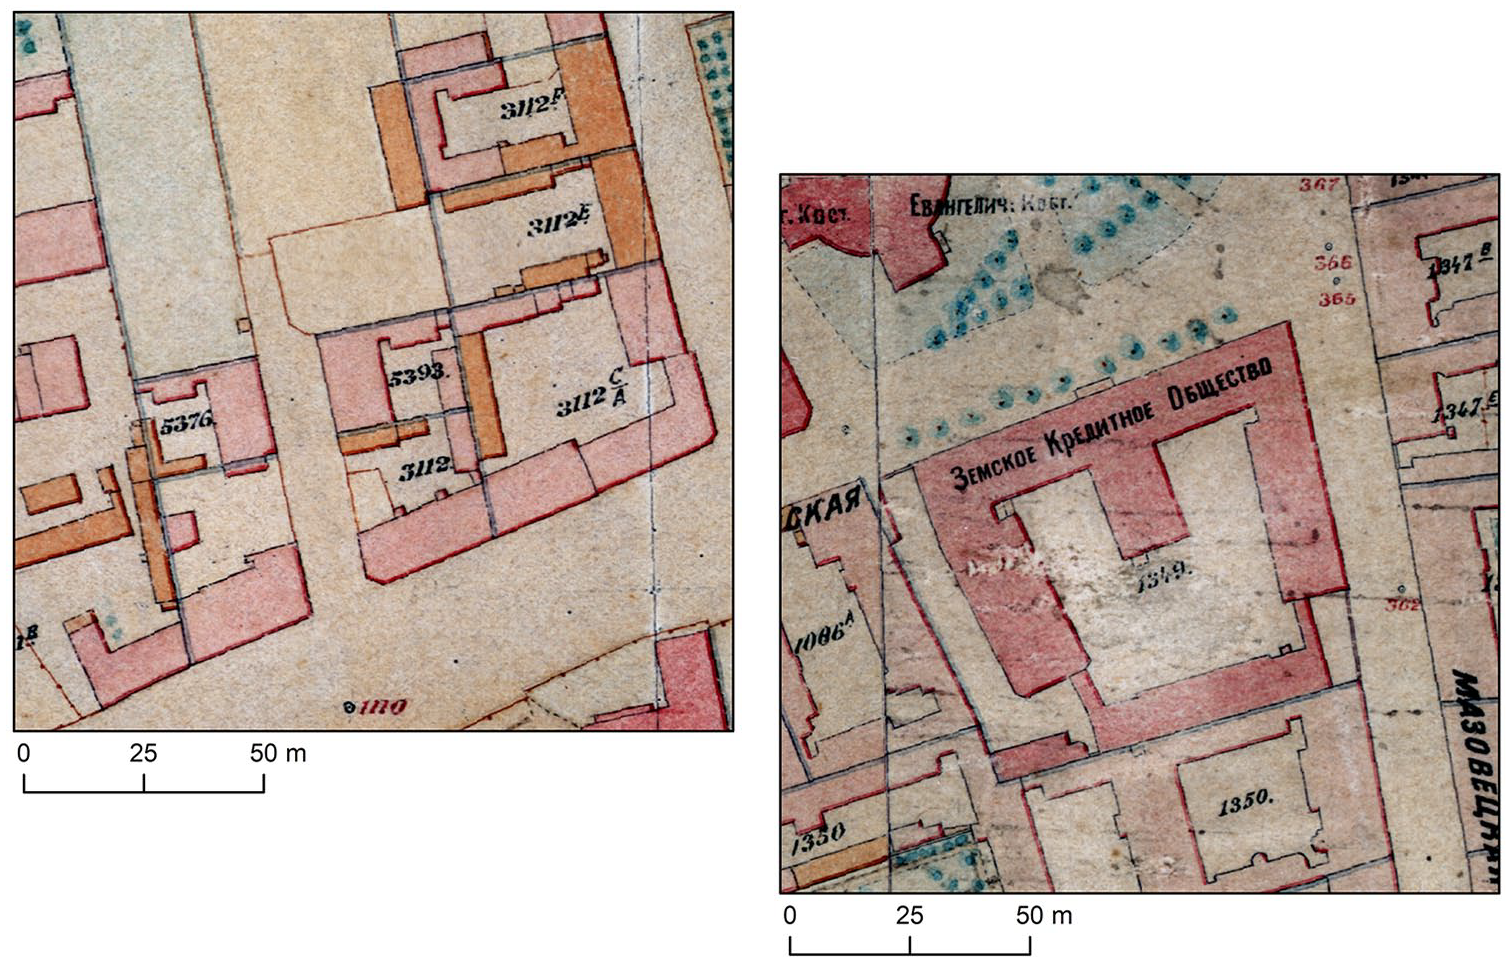
Let us illustrate this issue with an example from Lindley’s Plan, that is, St. Alexander’s Church in the Three Crosses Square (Figure 5). The church building was constructed in the years 1818–1825. Changes were introduced between 1886 and 1895, and Lindley’s Plan depicts the resulting altered form. After World War II, the church was rebuilt to its early nineteenth-century appearance.
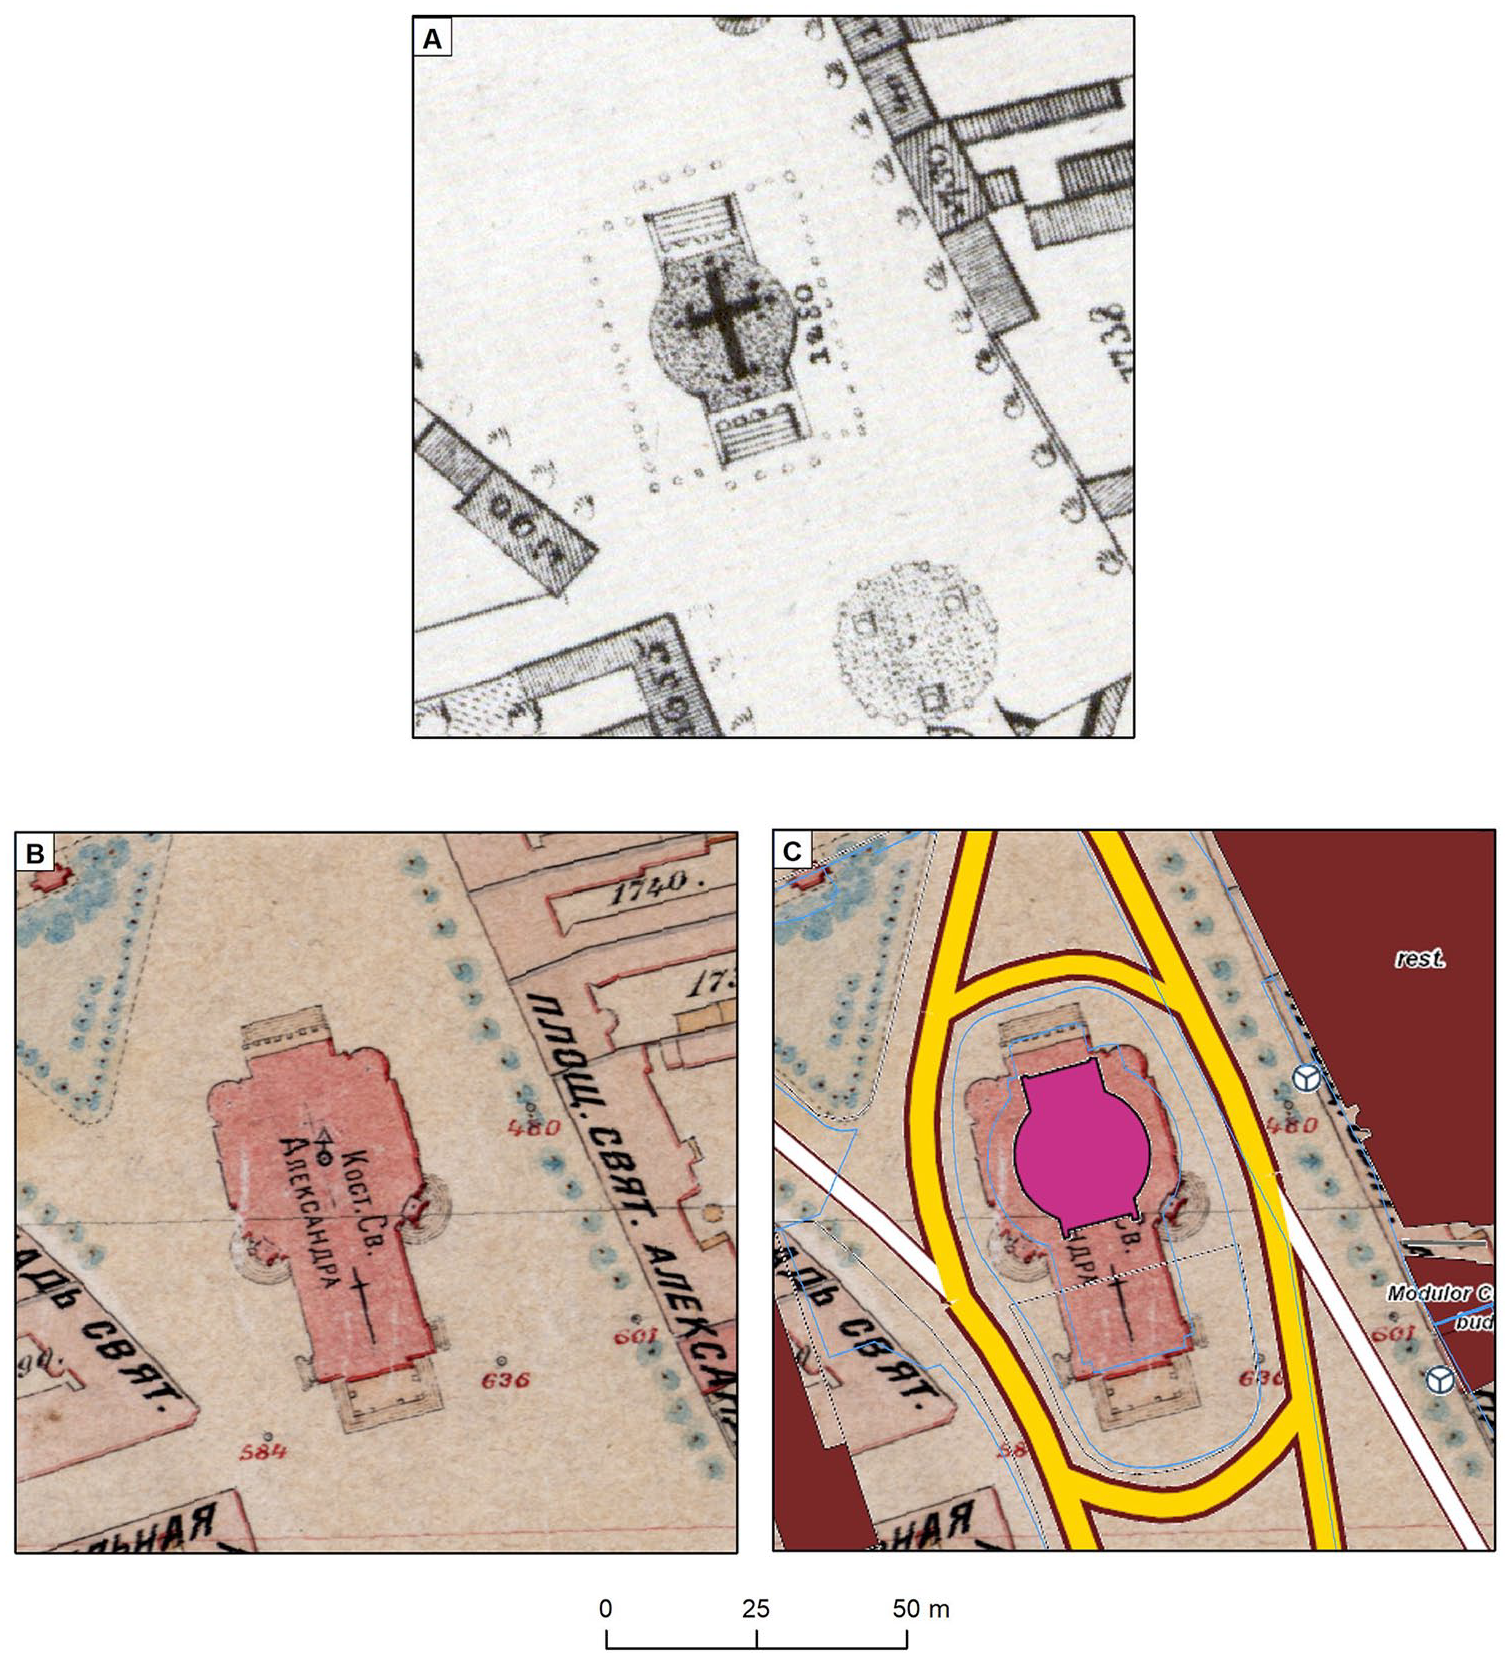
Lindley’s Plan, elaborated at a scale of 1:2,500, does not provide the plot number or depict the border of the church plot. The more accurate 1:250 plan from Lindley’s series also fails to give the plot number. For us, it was a prerequisite to identify the plot number and border, since our intention was to combine the data generated as part of the project with information from, for example, registers. The plot number—1250—can be found on the Corps of Military Engineers map from 1822. This map, however, does not depict the plot boundaries (the church is surrounded by a symbol other than that used for borders in this map). In order to determine the missing boundaries, we compared old maps with modern databases where contemporary plot borders run along the walls of the building marked on Lindley’s Plan (blue line, Figure 5C). For the purpose of this project, we assumed that this was the plot boundary at that time, and was not visible on the source map due to this overlapping.
Single Building in Several Plots
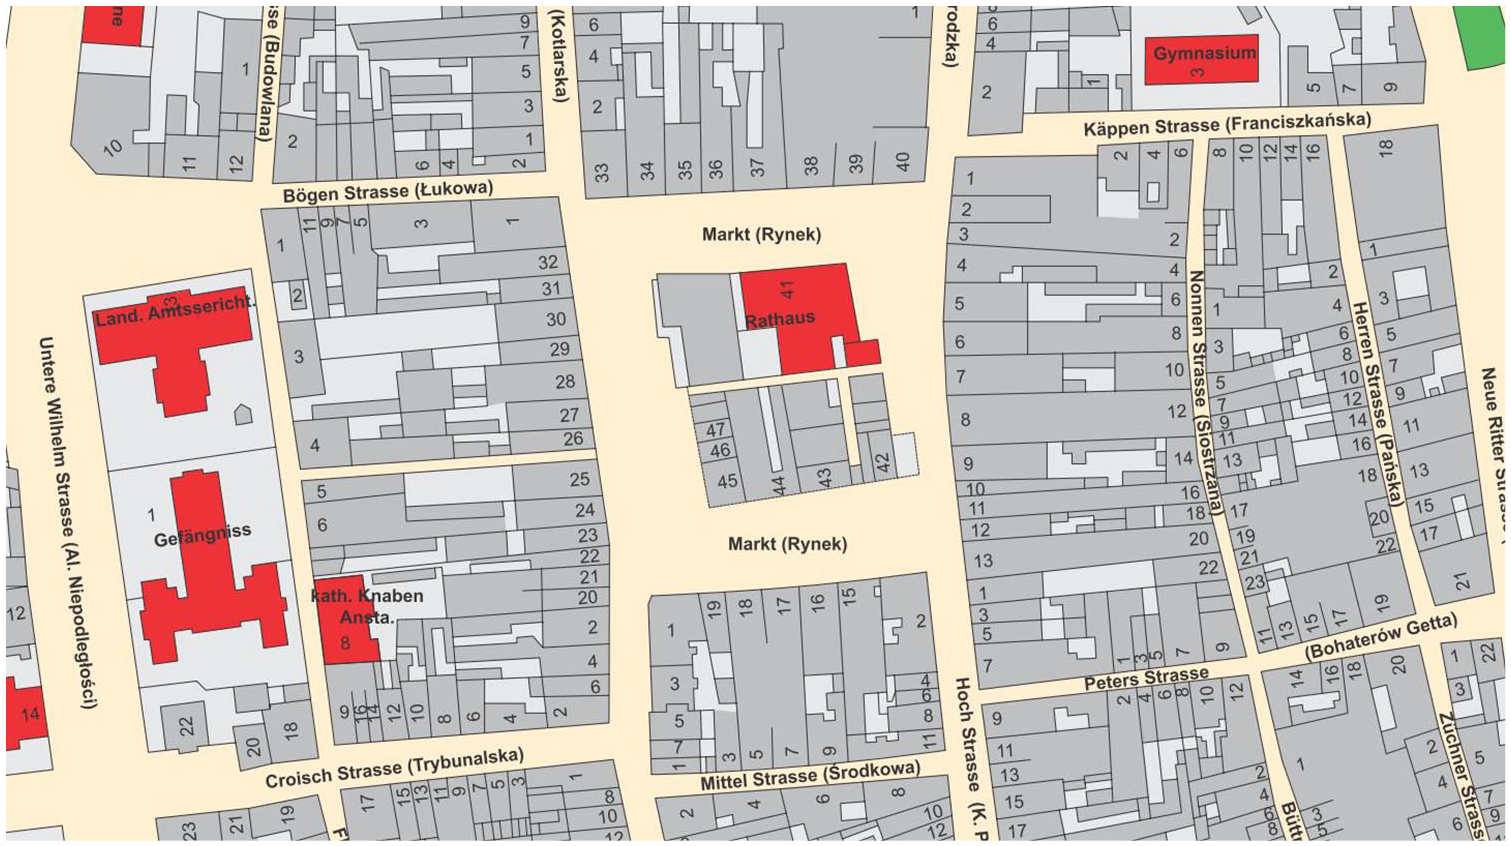
Another problem arose when we identified a single building situated in more than one plot of land. Were this relation to be included in the database, it would be necessary to design a “one to many” connection. The Jabłonowski Palace is an example of a Warsaw building which occupies multiple plots. In the early nineteenth century, the Jabłonowski Palace was adjusted to serve as the town hall. To this end, the building was expanded to better fulfill its new function. The 1:2,500 Lindley’s Plan shows that this building was located on four plots (Figure 6). This is hardly unusual, as the same cartographic source offers similar depictions of the Holy Spirit Hospital (plot no. 710 and 751) and at least other six buildings, most likely tenement houses. All the more, this issue deserves to be recognized and taken into account in the analyses of historical urban space.
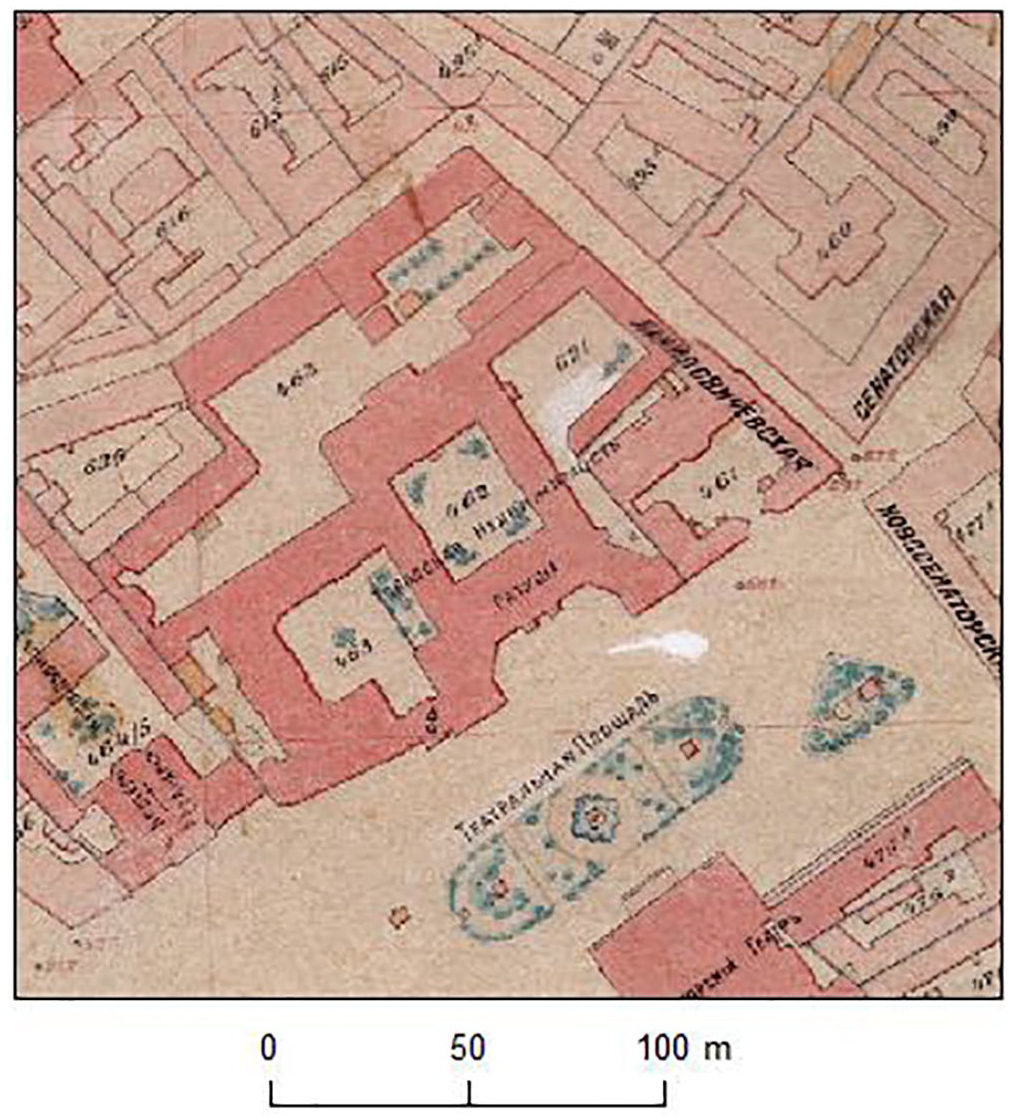
The Jabłonowski Palace was situated on four urban plots (SAW sign. 72/1001/0/1.9/785, sheet 11).
Plot Numbers
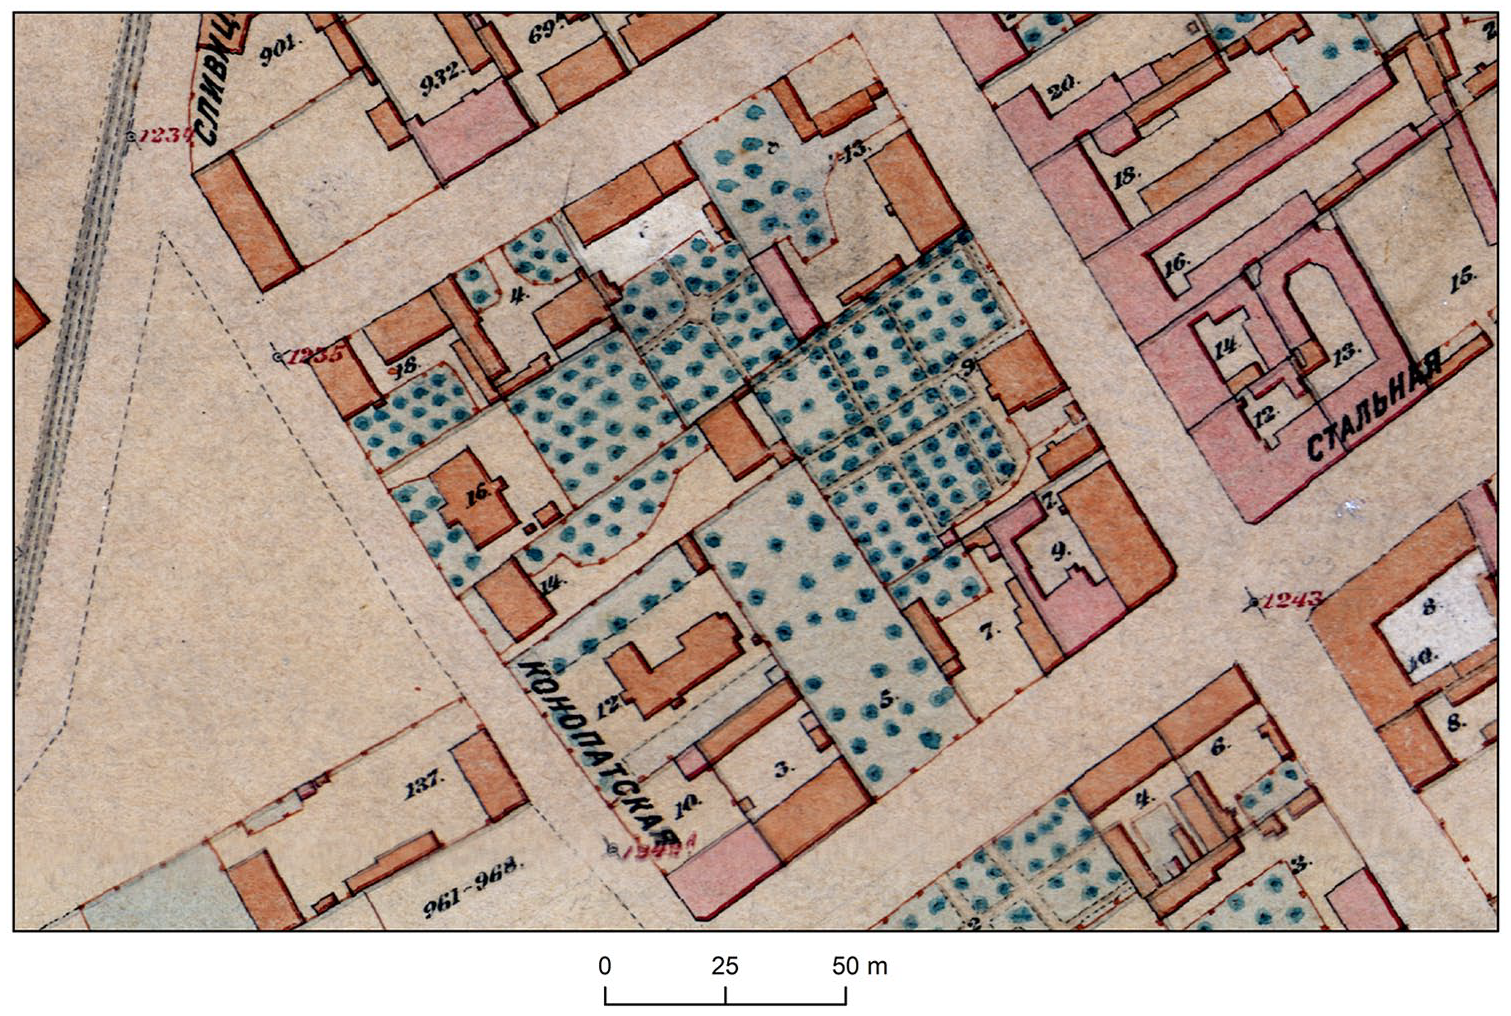
For the purpose of differentiating between plots, it is often useful to correlate plot numbers with property owners. The cartographic source, however, was not uniform for the analyzed city. In Figure 7, we present an example of an area where the plan depicts more than one numerical category. Cadastral numbering probably consists of the high numbers visible on the map (e.g., no. 932). The repetitive, low numbers are the so-called police numbers, which were used to mark buildings along streets. Overlapping numeration is represented by the double numbering of the corner plot in the eastern part of the presented area. The repeatability of low values, such as 8 or 7, also stands proof to this assumption.
Example of area with inconsistent plot numeration annotations (SAW sign. 72/1001/0/1.9/785, sheet 8).
Problems also arise when the same plot of land is labeled twice (with the same number). Such plot numbering was often the result of dividing an urban plot into two smaller parts, after which the same numbers appeared next to each other on maps (Figure 4). Two numbers might be assigned to the same plot also when working with an old plan, as this effect might be produced by georeferencing and combining two sheets on which a given property is located (Figure 8). The border is subtly marked, however, in the northern part of plot no. 2943/3 in Figure 8. This border mark prompts a reflection on internal plot divisions and the types of line symbols presented in the cartographic source, which brings us to the matter of plot borders.
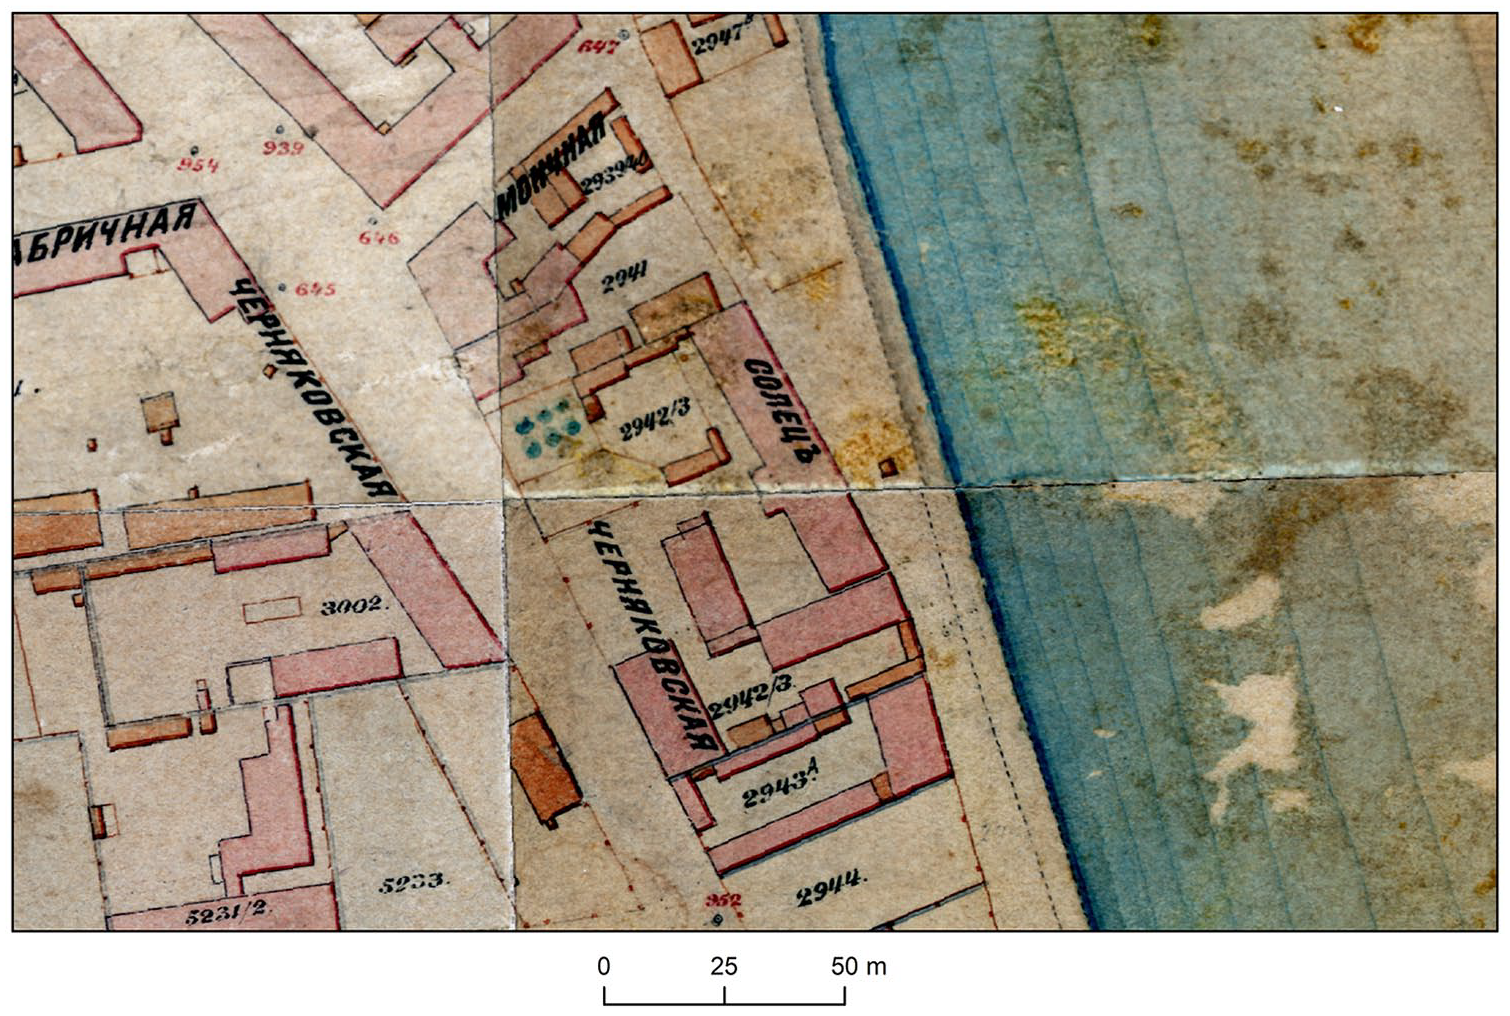
Example of urban plot situated at the intersection of two plan sheets (SAW sign. 72/1001/0/1.9/785, sheets 16, 17, 20, 21).
Plot Borders
Old maps and town plans often fail to provide a legend, which necessitates a reconstruction of map symbolization. Plans developed over long periods by multiple authors might exhibit inconsistent use of symbols. Possible post-publication updates should also be taken into account.
Plan vectorization gave rise to difficulties not foreseen at the outset of the project, namely mapping the partitions within plots (e.g., Figure 8). At the beginning, it was assumed that the problem lay in the presence of fences reflecting plot structure and functional divisions. However, plan authors used a similar sign to mark boundaries on later plan sheets (Figure 9).
Example of sheet with different symbols for boundaries (SAW sign. 72/1001/0/1.9/785, sheet 13).
Lindley’s Plan shows plots marked only with numbers, and without a clearly demarcated border (e.g., Figure 4, plot no. 2317). One reason for this may be the process of dividing and merging, and the delimitation of new plots. At times, even the use of auxiliary cartographic sources does not enable border reconstruction, especially for periods of intense urban development.
Life of a Plan
When working with historical cartographic sources, one must not ignore the possibility that a given town plan had been updated in the past. After determining the history of a given source, one ought to consider which version should be used for research purposes, that is, the original or the updated plan. An important advantage of such a source is the possibility of using it to trace changes in the urban tissue. For example, thanks to the availability of plans in various scales from the series from which Lindley’s Plan comes, it is possible to recreate the process of division into parcels. Figure 10 presents this type of situation near Frédéric Chopin Street. At the top of the figure on the plan at the scale of 1:2,500 one can observe only plot numbers without marked borders, and at the bottom of the plan at the scale of 1:250 boundary symbols are visible. It may also happen that adjacent sheets developed at a different time do not represent a consistent situation. In Lindley’s Plan, this was the case of the buildings to the northeast of Zgoda Street on sheets 15 and 16 (Figure 11).
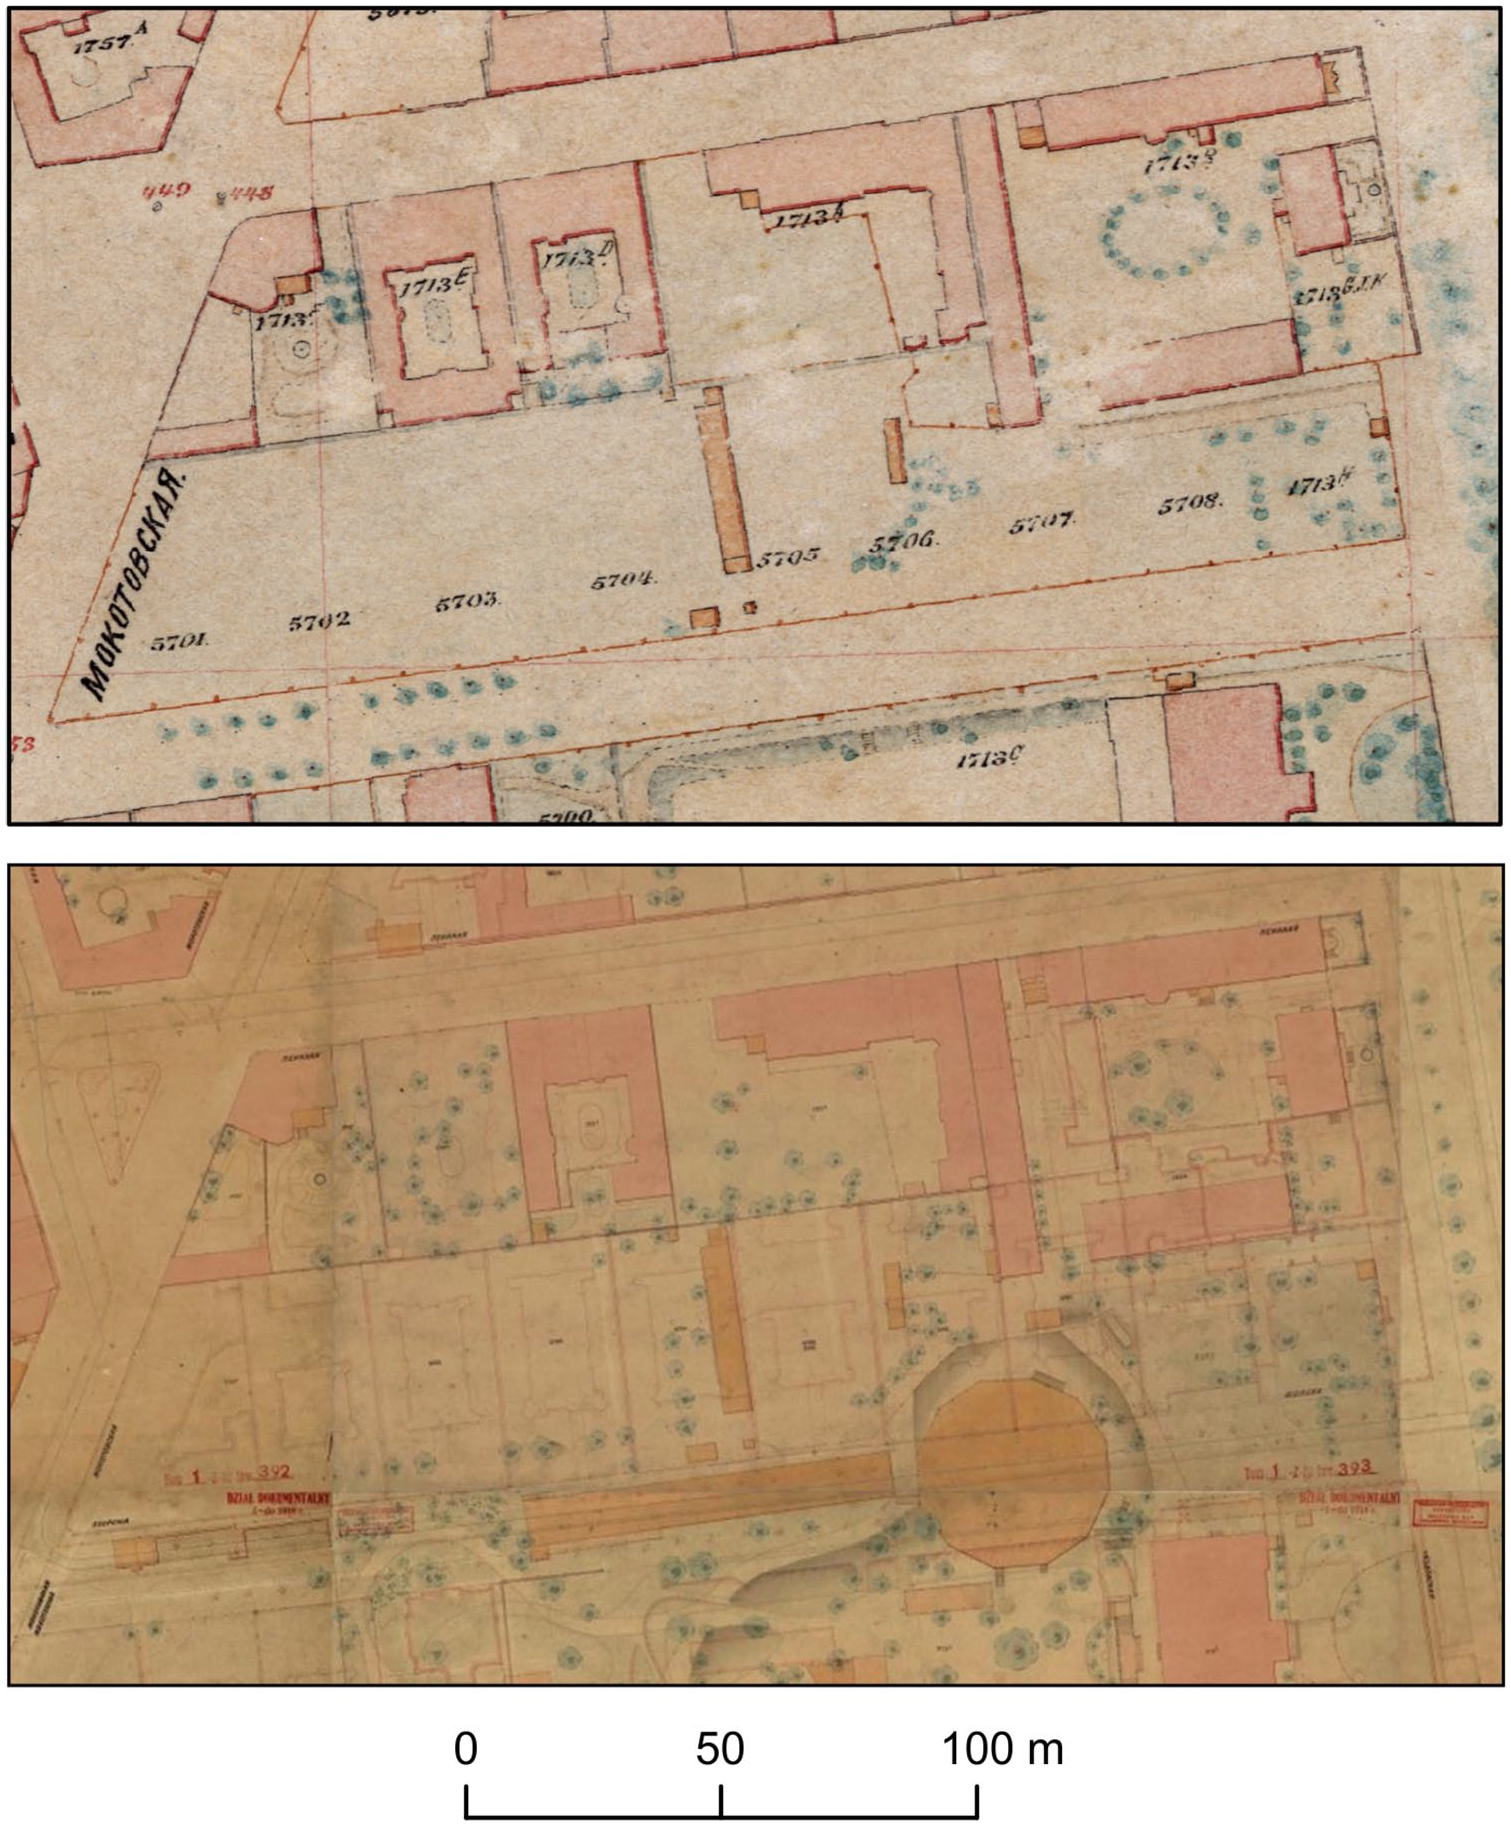
Process of division into parcels near Frédéric Chopin Street (SAW sign. 72/1001/0/1.9/785, sheet 20; Map of Warsaw—Office of Surveying and Cadastre, http://mapa.um.warszawa.pl/en/index.html).
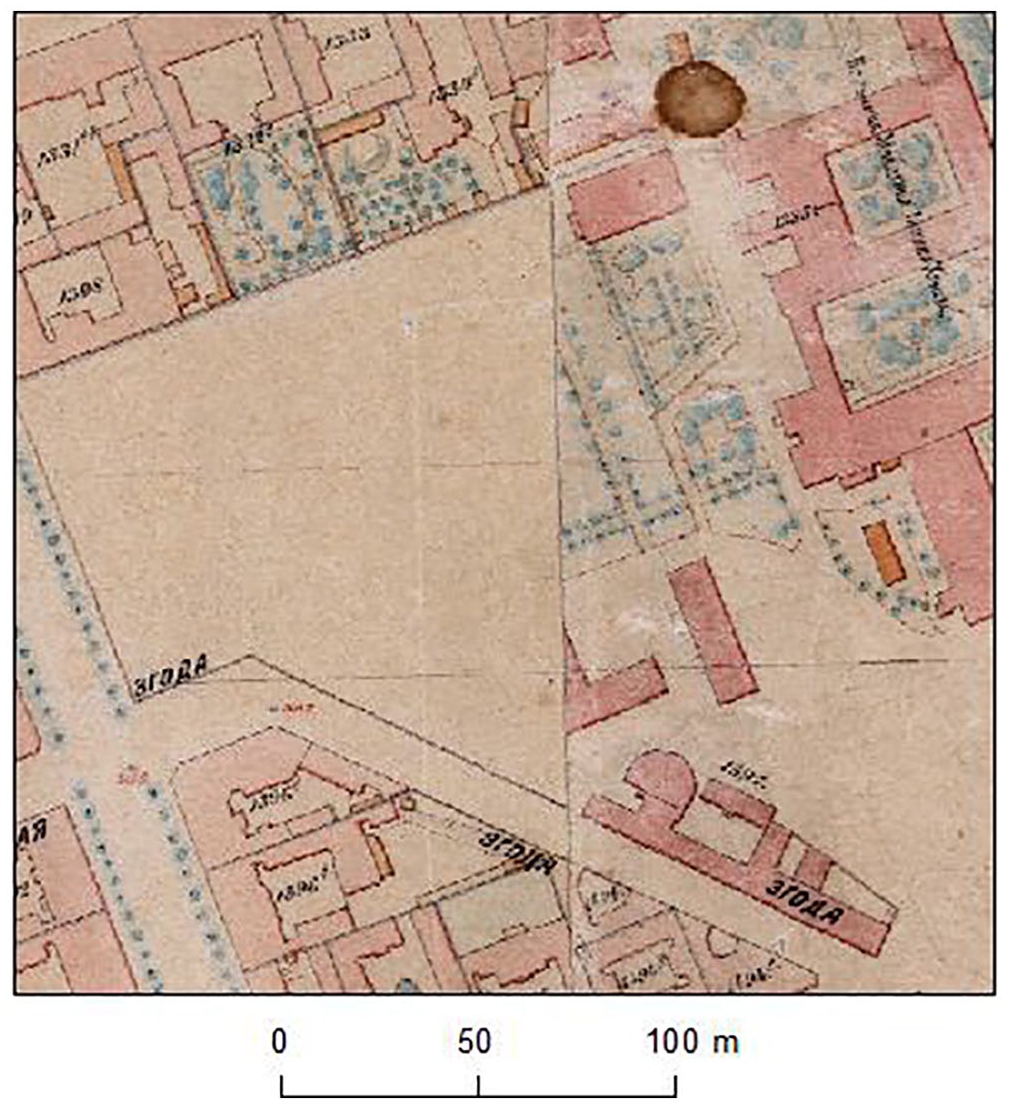
Inconsistent situation on adjacent sheets of Lindley’s Plan Street (SAW sign. 72/1001/0/1.9/785, sheets 15 and 16).
However, one should also establish whether the given cartographic source presents future plans or whether the actual structure of the town has been accurately reflected (Figure 12). Sometimes, it can also be difficult to distinguish which part of the plan was updated and which fragments have survived in their original form.
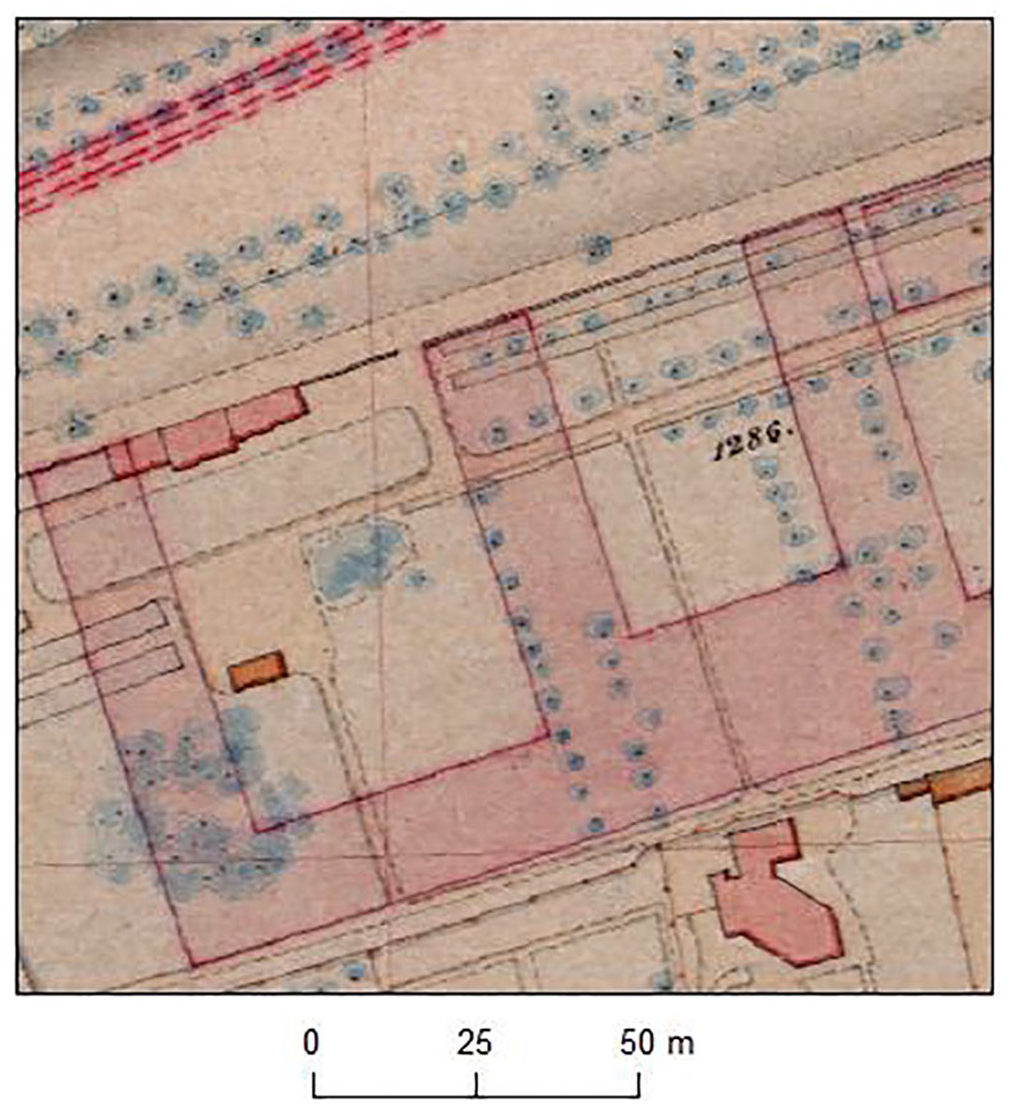
Example of sheet with updates marked in magenta (SAW sign. 72/1001/0/1.9/785, sheet 16).
Vectorization of Urban Plots—Summary
To sum up, one has to bear many aspects in mind while vectorizing urban plots, namely:
relation between plan elements
○ plots and streets
○ plots and buildings
plot merging and subdivision
plot numbers
○ various types of classification on one plan
○ repeated numbers
impact of different functions served by individual plot parts on their presentation/visualization
vague or missing symbolization of borders
different symbolization of borders
life of a town plan, updates
Urban Plots on HTA Plans
In order to compare the obtained results of Lindley’s Plan vectorization, we intended to confront them with selected volumes of the Historic Towns Atlas. We also thought that such an analysis could, in some way, contribute to the drafting of a definition for HOUSe ontology. A lot has been written about the HTA series, let us only stress some basic and important information about it. At the beginning of 2022, over 580 atlases have been produced in 19 countries. 31 One of the main objectives in establishing the HTA was to enable comparative studies of European towns, and the prerequisite for the overall scheme was the use of maps with common scales and date ranges. The main map in the comparative endeavor is a redraw of the oldest surviving cadastral map for the nineteenth century at the scale of 1:2,500, which is the main subject of this section. It should be considered that using the scale of 1:2,500 limits possibilities of even more detailed depictions of some small elements of urban space. This oldest cadastral plan was to reflect the undisturbed shape of the town prior to rapid changes in urban tissue triggered by nineteenth-century industrialization. 32 It has been indicated in literature, however, that pre-industrial urban space also underwent changes. Moreover, even the oldest prevailing cadastre reflects only a limited stage of town life 33 —and not necessarily that which occurred in the early nineteenth century as Heinz Stoob proposed 34 —which resulted from both the specific conditions of the region where the town was located and the choices made by authors of particular volumes. What is more, the comparison-related issues might also arise from the great diversity of HTA volumes. These discrepancies arose from the fact that due to many difficulties, mainly in the cartographic and written source materials, national atlases slightly differ from the basic principles of the series. 35 Apart from the above noted and described problems arising upon the launch of a comparative study using HTA volumes drafted over the last 50 years in different countries, 36 let us mention another potential addition to this list: how can one compare towns with surviving cadastral plans from the first decades of the nineteenth century with those whose oldest useful cadastral maps reflect urban space as at the late nineteenth century or even the first decades of the twentieth century?
As this specific model is used in the HTA series, we must refer to this standard. It is worth reflecting on how atlases of the HTA series have presented plots, in relation to both small and big towns. This twofold approach arises from the obvious fact that the space of small towns differed from that of large towns, in terms of both foundation model, type, and density of housing development, and the qualitative elements of urban space. 37 These differences influenced the degree of plot development (discussed further on) and durability of land parcellation. While plots in town centers quite frequently survived even in their medieval shape (mainly thanks to the presence of brick housing), those further away from the center, on the outskirts of the town, did not display such permanence. 38 The question remains, of course, to what extent this thesis can be supported for small towns whose buildings were mainly made of wood—as it was building structures of brick and stone that were favorable to the petrification of parcel size. 39 Small towns differed from large towns in terms of urban framework. Differences were determined by the scale of urban planning assumptions, to name one reason. Again, one may generally state that the layout of a small town most often comprised a town square (which was sometimes a main street wider than other streets 40 ), main streets with denser housing development radiating from that square, which also served as exit roads and auxiliary tracts. In general, urban centers of this size were not surrounded by town walls. They were rather enclosed by structures resembling dykes or high (wooden) fences. The area within these structures was mainly undeveloped, occupied by gardens or even small thickets of fruit trees. While the parochial church served as an important landmark for any small town, smaller urban settlements did not necessarily have a town hall. Residential housing was predominantly low and wooden, with nearby outbuildings typical of rural landscapes, such as sheds and barns. 41 Housing was much denser in larger towns, and larger green areas were situated rather in the suburbs. The character of urban space could have had influence on how it was evaluated and presented in maps, and thus it continues to impact contemporary analyses and our perception of historic urban space.
As the character of urban space was greatly divergent depending on town size, we cannot make do without a reflection on how such varied space should be described in terms of definitions, databases, and cartography. We reviewed mainly Irish, Austrian, and Polish HTA volumes, and supplemented our observations with individual volumes of the German, Hungarian, and Romanian series. Our selection was guided mainly by volume availability. Irish and Austrian volumes were most easily accessible, as they have been published online in a more or less limited form. Similarly, most Polish volumes have been uploaded online, yet the scale of their availability is varied. 42
All in all, whether we worked with a base map of Dublin in Ireland (Figure 13) or Marchegg in Austria (Figure 14), similar visualization seemed to be at work: borders of parcels and buildings, watercourses, and green areas are all marked with a line of the same width and color. In cases where plot distribution is relatively regular, it can intuitively be determined that the area behind a building may have formed part of a given plot, along with the object at the front.
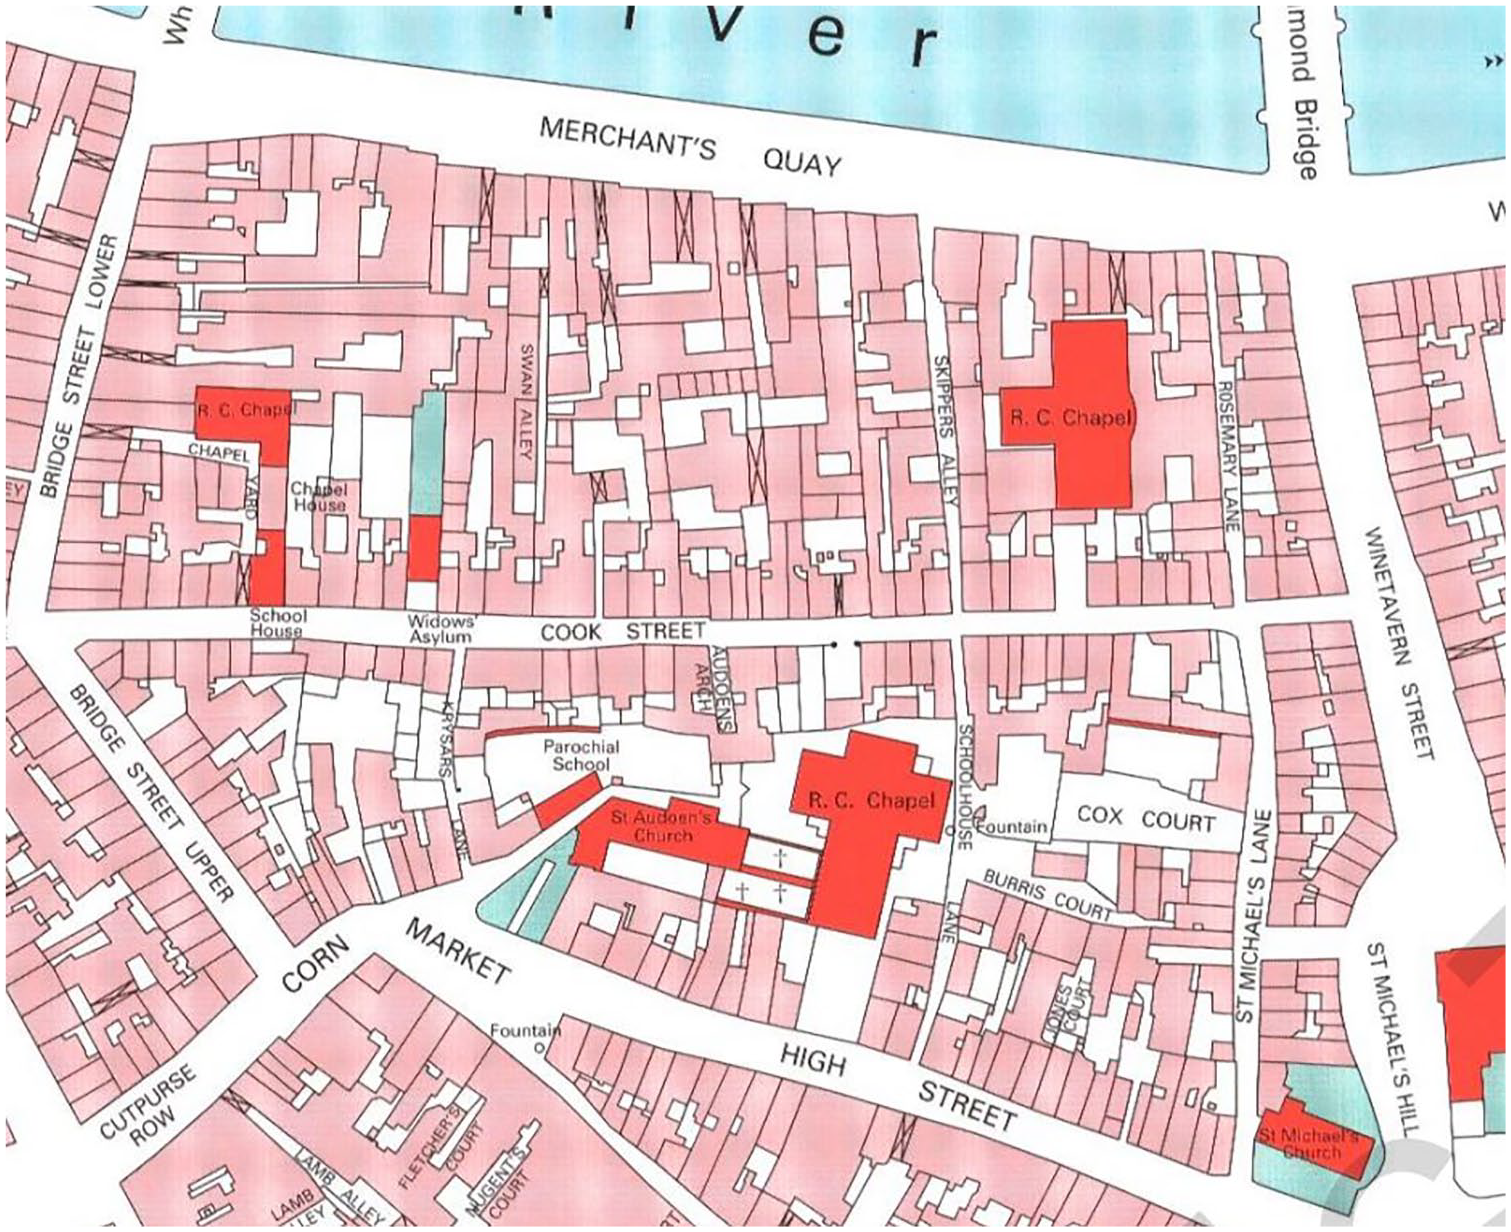
Part of cadastral base map of Dublin from 1846-1847.
Part of cadastral base map of Marchegg from 1821-1822.
However, it was not always possible to identify precisely which element of urban space belonged to a given parcel. For the high-density urban space of Dublin, where parcels located in the central part of the town were sometimes small in size, this issue concerns mainly the affiliation of courtyards, and other utility and residential buildings. It is mainly because of characteristics of cartographic source material used in Irish Historic Towns Atlas to prepare map at the scale 1:2,500—the Ordnance Survey, which is different from the cadastral town plans in that they do not include clearly defined, numbered plots. The plan of the Austrian town of Marchegg gives us a slightly clearer picture, as the town had a smaller population and less dense housing. Nevertheless, even Marchegg offers examples of structures and spatial elements situated within town walls which escape unproblematic classification as parts of specific plots, just like the cartographic source for Warsaw discussed in the “Urban Plots in GIS” section. Owing to the intuitive perception of urban space (caused by familiarity with that space) or the Gestalt principle of perception, 43 it would be difficult to suggest, given the type of cartographic visualization chosen by the authors, that map users might assume that buildings, courtyards, and green areas constitute independent objects falling within urban space. Yet a detailed analysis of the plans might create that very—perhaps misleading—impression. The way of presentation validates the method of interpretation, as it does not provide a hierarchy of symbols which would differentiate between individual object categories (plot, building, garden). The symbol of a straight line, let alone an explanation of its meaning, is in fact absent from the legend to the Marchegg plan. 44 The Dublin plan legend indicates that lines define borders, but fails to specify what objects are enclosed by this symbol. As a result, it seems that these borders may be interpreted as the land-use area of the given spaces and objects, not plot borders. The legend to the redrawing of the Siret cadastre from 1855 describes lines as borders of parcels, gardens, and buildings. 45 In essence, we are dealing with a situation resembling that of Marchegg and Dublin: it is not entirely clear where the parcel—but not the utility—border runs, and what is situated within a single parcel. We describe a similar issue in the “Plot Borders” section, in reference to the Warsaw case study of the HOUSe project. Although in that specific case the origin of the problem was different (the plan used a few different symbols for borders), plan users are faced with the very same difficulty. Similar observations hold true for other volumes of the series which we studied, that is, Ireland (e.g., Trim 46 and Fethard 47 ), Austria (e.g., Feldkirch 48 , Kufstein 49 ), and others alike.
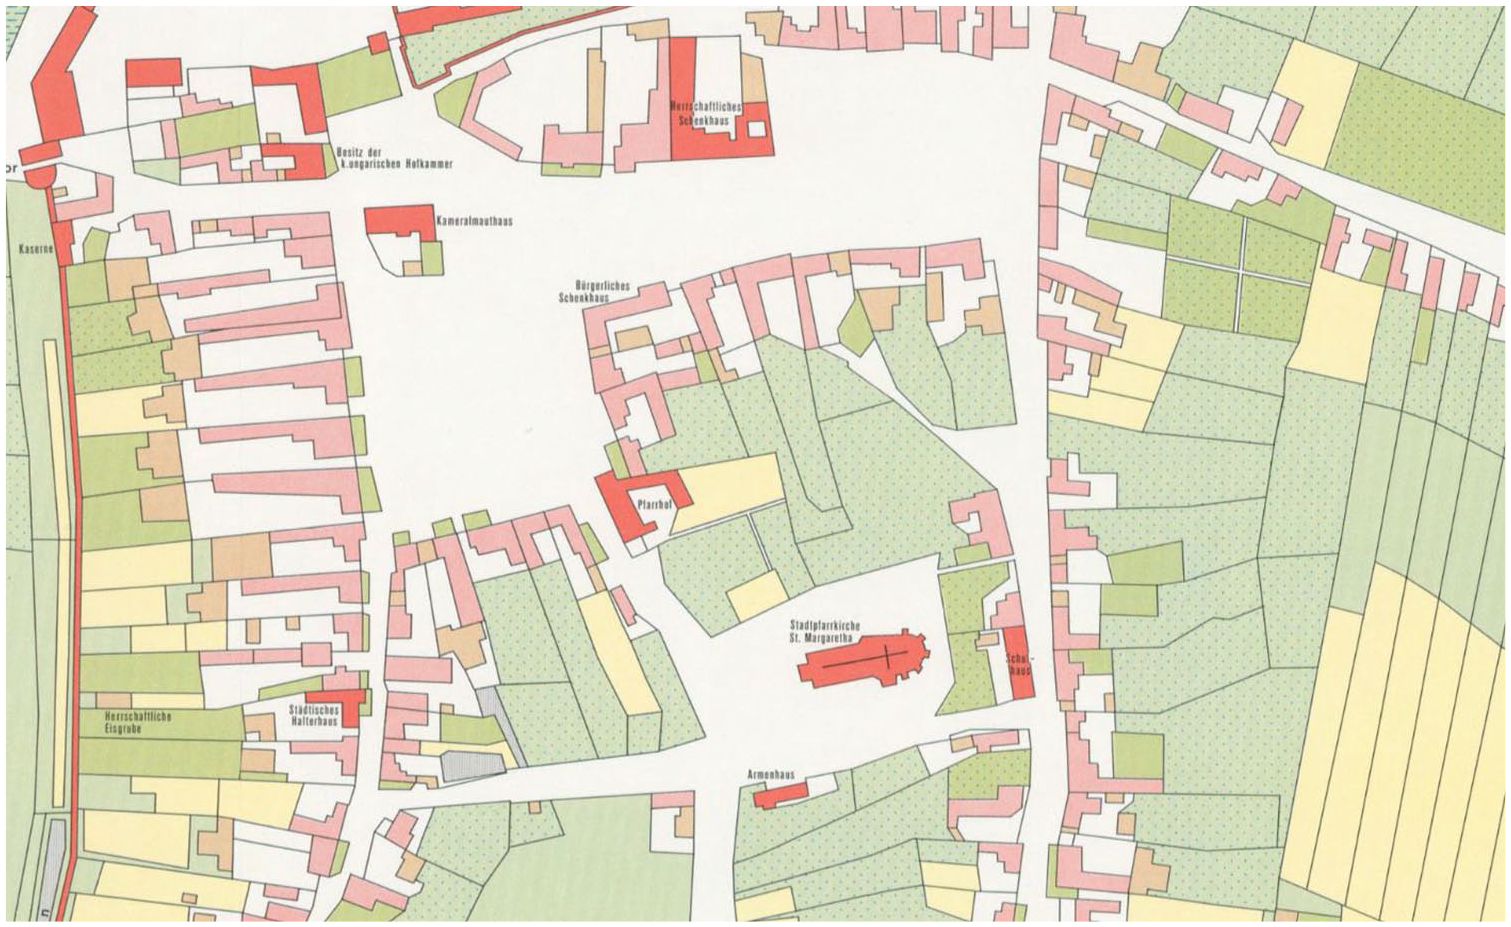
The authors of the German Deutscher Historischer Städteatlas series adopted a different approach to outlining plots of land. One may note that the Braunschweig volume marks parcel borders with thicker contours, and internal parcel subdivisions with thinner lines (Figure 15). At the same time, the same color is used for both line types. This choice suggests a coherent system of symbols.
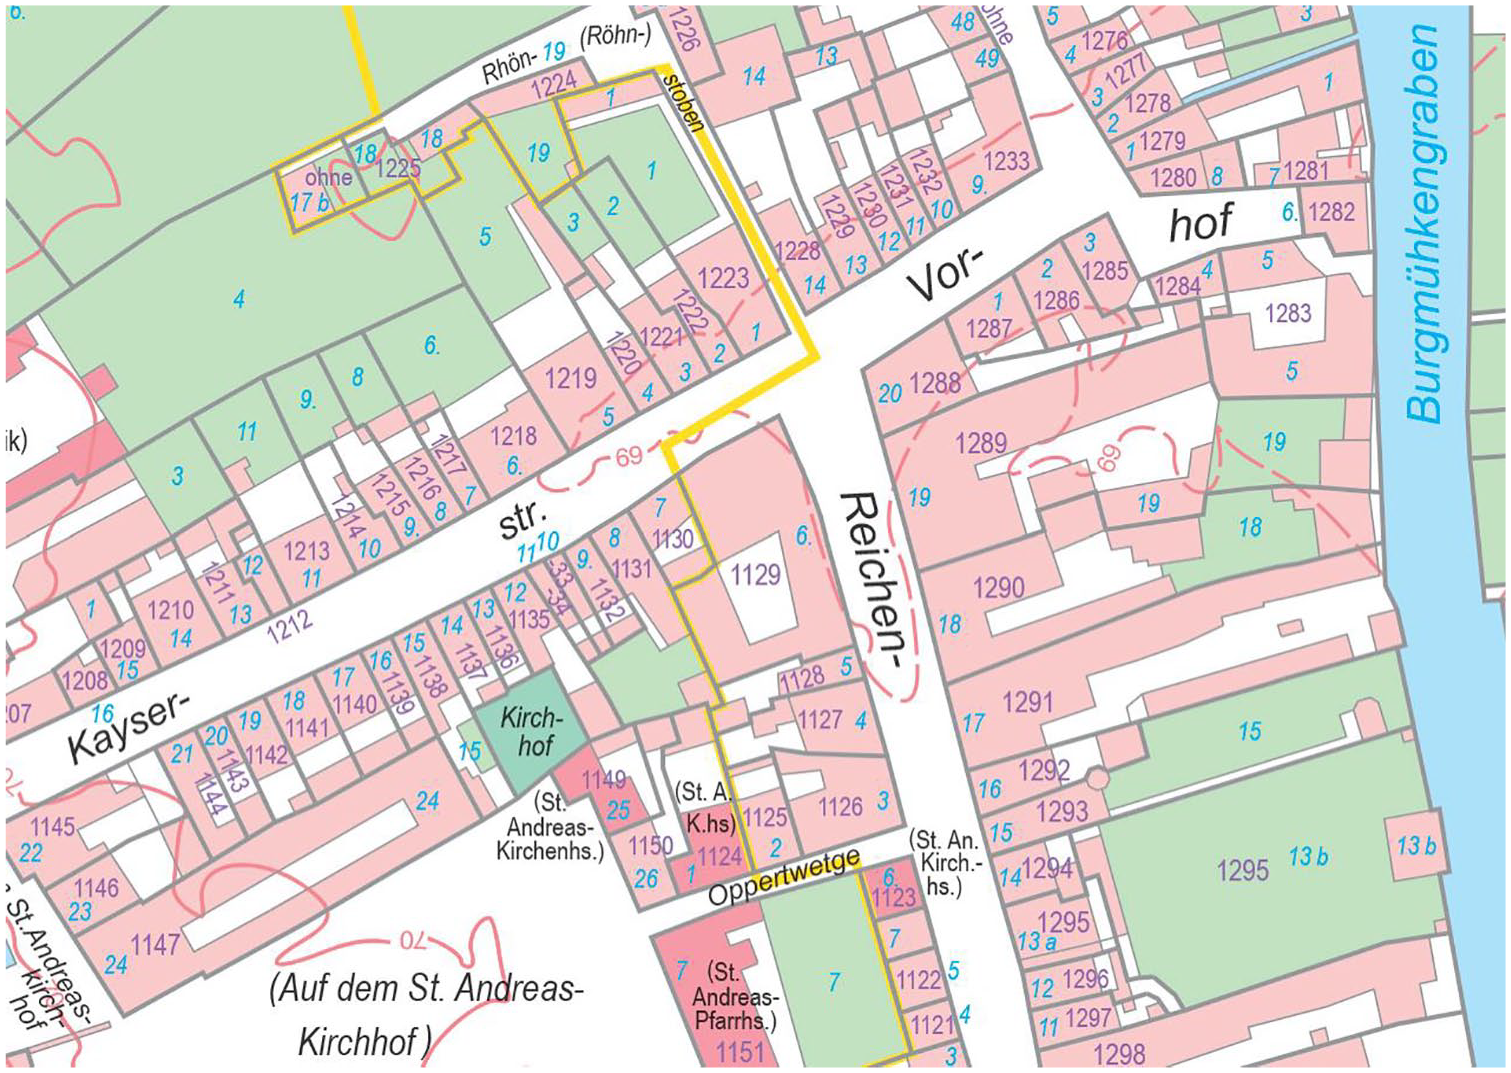
Braunschweig parcels based on 1750/66 plan. Tafel 1.2 in Wolfgang Meibeyer, Henning Steinführer, Daniel Stracke. Braunschweig. Deutscher Historischer Städteatlas, 4 (Münster: Ardey-Verlag, 2014); online: accessed October 28, 2021, http://www.staedtegeschichte.de/Stadtkarten/braunschweig/stadtgrundriss.html.
This subdivision can easily be seen in the plots forming the northern frontage of Kayserstrasse and some plots situated in the northern part of the eastern frontage of Reichenstrasse. The legend to the map also provides information about this division (Figure 16). Specific (blue and pink) numbers are indicated for each plot, to reflect the numbers assigned to the plots in the period of drafting the plan which formed the basis for the redrawing. These plots form a single unit with the buildings situated in the plots (marked in pink), courtyards, and other undeveloped space used for different purposes (marked in white), and space generally understood as green areas (marked in green). In order to underline this fact, the number of the plot was sometimes marked multiple times to indicate the affiliation of several objects to one plot.
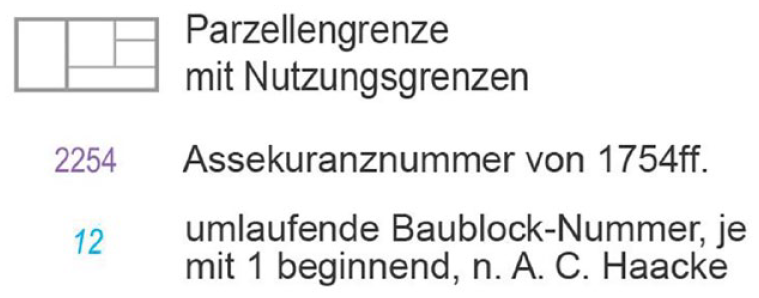
Legend to 1750/66 Braunschweig plan with clear distinction between parcel borders and borders of utility areas within those parcels.
We consider, for example, the redrawn cadastral map of Świdnica in Silesia (Figure 17) to be an attempt at introducing a similar solution. The redrawn 1895 cadastral map allocates numbers to buildings in all depicted streets. Such a solution, though interesting, did not enable resolving certain problems which arose when vectorizing Lindley’s Plan. Using a line of equal width blurs information about boundaries and parcel range. This solution renders it unclear whether the prison building, visible to the east of the town market square, occupied two separate parcels, or maybe the line running more or less along the center of the building was an internal border reflecting the subdivision of a single parcel.
Cadastral base map of Świdnica (Poland) from 1895.
Redrawn cadastral maps are not the only elements of the HTA series which offer cartographic visualizations of plots. Their presence, however, depends on the source material available for use. For instance, the atlas of the Hungarian town of Sátoraljaújhely provides not only reproductions of cartographic material, but also a source dating to the late eighteenth century which depicts parcels held by the local Calvinist Church. 50 In cases where a mapped town had been subjected to thorough archeological studies, the sheets illustrating the analyzed issue also provide a reconstruction of the medieval division of parcels. 51 The legend to the maps depicting the spatial development of Stary Sącz in Poland clearly indicates the line used to mark parcel borders; the parcels themselves have been categorized by purpose of space usage. 52 This visualization, however, is heavily generalized. It corresponds to the assumption underlined in the commentary to the Stary Sącz volume that the depth of urban plots might point to their residential and garden character. 53 Thus, this map fails to present a building and border outline which would meet the standards of a cartographic source elaborated with high precision. Commentary parts of volumes often shed light on how the plots were used. The commentary to the topography of Kilkenny in Ireland mentions gardens at the back of parcels. 54 In his description of residential parcels in Sátoraljaújhely, 55 István Tringli wrote that an urban parcel consisted of a building surrounded by a courtyard and a garden. Similar, relatively brief information on diverse parcel surface use appear in the commentaries on Niemcza and Trzebnica in Silesia. 56
An analysis of the HTA plans makes clear that the difficulties in determining the range of objects in a town plan (e.g., the range of plots) concern both primary sources (Lindley’s Plan at the scale of 1:2,500) and secondary sources (HTA plans). Problems arise from insufficient explanations in plan legends, and failure to hierarchize or sufficiently differentiate between symbols. Therefore, the following issues call for a reflection. First, it ought to be established how information from written and cartographic sources should be combined with that of the future database. Second, it is necessary to devise an appropriate cartographic representation for uncertain, inaccurate and often general information which will reflect this aspect of urban space—a frequent issue in small and average European towns—to the greatest extent possible.
Urban Plot—State-of-the-Art Review
When drafting the definition of Polish term działka (plot), we reviewed other attempts at providing a precise definition for this term described in literature. We omitted the issue of analyzing primary sources dating to the Middle Ages and the early modern period. It follows from similar research that analyzing Latin and vernacular terminology requires a separate study questionnaire and a slightly different methodology. 57 Nevertheless, we incidentally availed ourselves of such works. 58 We sought two types of information: (1) definitions of the Polish term działka (plot); (2) definitions of terms used to denote plot in other languages. Our analysis covered mainly texts on researching historic urban space, along with texts on studies in medieval and post-medieval urban archeology. These were mainly papers written in English, German, Polish, and Czech. We focused primarily on works about urban space. As a result, we did not take into account definitions connected with general demarcation of space or use of farming areas. 59
Various Definitions from Literature
The majority of such works do not contain a definition of plot. In most cases, definitions are absent in works where an analysis of urban morphological structure is not a prerequisite. Such is the case of the book about Alnwick in Northumberland by M.R.G. Conzen. Significantly, this author—a classic figure of morphological studies—uses two terms for plot. In one definition, he states, “Each parcel is essentially a unit of land use; it is physically defined by boundaries on or above ground and may be called a plot, whatever its size.” 60 So, a parcel could be called a plot. Further on, however, Conzen uses burgage to refer to plot (a reference to an early-modern-period source term) and provides the following definition for this word: “the urban plot held by a burgess. It contained his house, yard and ‘garth,’ and was charged with a fixed rent as a contribution to the communal borough tax or firma burgi of the town.” 61 Depending on the aspect in focus, M.R.G. Conzen used two different terms to denote plot. The first definition stresses the physical aspects of a plot, namely its outlined borders and the used space enclosed within them. The second definition stresses the ownership-related aspects of a burgage, meaning the legal rights and tax duties of the owner (burgess) of a plot. When combined, these two definitions form the interpretation given by Terry Slater. Slater defined plot, denoted with the term burgage (probably in line with the period of Slater’s academic interest), as the primary cell of urban space characterized by its lengthiness and narrowness, situated along a road, and whose outer borders remained permanent once delimited, and whose ownership gave the burgess full burgher rights. 62 Vanessa Harding presented a similar definition of the burgage plot, that is, the counterpart of plot: “[b]urgage plots were, typically, long, narrow properties laid out at right angles to urban streets, with a house at the street and yards or gardens behind.” 63 This definition refers to the physical aspects of a plot and adds a new trait to its description. Harding states that part of a plot was occupied by a house, while the remaining space was used as a courtyard or garden. Nonetheless, the term used—burgage—implies the right to use, buy, sell, or bequeath the property in return for rent (so-called burgage tenure), arising from the fact that the owner of a burgage was subject to town law. 64
An extensive definition of plot is to be found in an article by Czech archeologist Rudolf Procházka. The definition reads, a plot can be understood as a measured and delimited section of space usually containing one residential building and its extensions/supplements. It is owned and inherited (rented), with the charge paid to the land owner [. . .]. Together with the residential house, it represents the basic spatial unit of the urban floor plan and, of course, also the cornerstone property structures with a significant impact on the social status of the proprietor (holder)—only the (quasi) owner could be full burgher.
65
In this definition, Procházka underlines the physical spatiality of a demarcated unit of urban space and points to two features: delimiting that section of urban surface and the structures present in that unit. Procházka’s definition emphasizes that the plot forms the basic unit of urban space. It also indicates that plot ownership was of importance: only the owner of an urban plot could be a burgher.
One Polish article to offer a definition of plot/parcel is that by archeologist Cezary Buśko: “A bourgeois parcel is a fragment of space separated by borders from the urban organism, together with the buildings functioning within it, constituting an independent economic complex.” 66 This definition adds a new dimension to the analyzed term. Next to the attributes discussed above, such as demarcated borders and buildings used for specific purposes, plot has now been described as an economic unit. Roman Czaja introduced the term in a very succinct manner, by stating that a plot is the smallest unit of the urban spatial arrangement. 67
For the purpose of our study, we sought the assistance of two Polish historians-medievalists and asked them to define the term plot. Mateusz Goliński decided to use a dictionary definition, that is, “a plot of land, separated from a larger area, intended for buildings,” 68 and supplemented it with three elements 69 (hereinafter: Goliński 2020). First of all, he highlighted the issue of the plot border. Second, he pointed to the matter of taxes. Finally, he indicated that from the eighteenth century onward, the urban plot has been equivalent to a cadastral town plot. The second researcher was Urszula Sowina, who—in reference to her work on medieval urban plots in written sources 70 —defined plot as “a limited surface with strictly defined boundaries—for tax and ownership purposes” 71 (hereinafter: Sowina 2020). Paweł Cembrzyński and Maciej Radomski provide a definition related to those observations. Cembrzyński and Radomski characterize the plot as “the basic unit of both a town’s spatial structure and its governing and taxation systems.” 72 Art historian Rafał Eysymontt sees parcel as the “basic element of a medieval town” and points to its inherent feature of being “connected [with parcel—K.S.-P., M.S.] right to having a house and its free inheritance, which gives an urban community spirit, that makes a bourgeois awareness’ core.” What is more, the parcel was a major element of parcellation, important in forging the geometrical composition of a town. 73 In addition to identifying the plot as a basic element of urban space, which was a standard component of such definitions at that time, Eysymontt underlines the implication of owning a plot for the mentality of town residents: the emergence of an urban resident community.
Considerable terminological differentiation can be noted in works published in German. Contexts where a Polish author would use działka abound with terms such as die Parzelle, das Grundstück, 74 das Bürgergrundstück, das Hausplatz, and die Hofstelle. 75 Hubert Drüppel, author of the entry under the headword “Grundstücke” in the “Lexicon des Mittelalters,” indicated two features: the fact that a plot was demarcated to form a unit of land surface, and that individual plot parts made up a real property as defined in property law. 76 What is interesting, the terms used differ depending on which aspect of physical plot features a given definition emphasizes. Fred Kaspar differentiated between die Parzelle and die Hausstätte. He noted that die Parzelle refers mainly to a delimited section of surface area, 77 while die Hausstätte denotes the use of that space, primarily by implying that a residential building is constructed within die Parzelle or that its courtyard or garden are in use. 78 It seems that Karsten Igel used the terms das Grundstück and die Hausstätte interchangeably, similarly to Kaspar. 79 Some Polish works on urban design and spatial planning attach the meaning of a place designated for development to plot. 80
Hans Strahm, who discussed die Area in towns, used mainly das Grundstück as a synonym for the term discussed. Strahm equated die Area with plot. All in all, this author presented two possible understandings of the term, that is, a narrower and a broader meaning, which we will combine here for the purpose of comparative analyses. Strahm defined die Area as a demarcated and separate segment of land (broader sense), a delimited site designated for development (narrower sense). Strahm identified such a land segment with land property held by burghers. 81
However, it generally appears that most of the above terms denoting plot are used synonymously. In his article on the possibilities for using GIS systems in spatial analyses of medieval towns, Tim Bisschops based his discussion of this issue on the example of Antwerp and interchangeably used two terms for plot: plot (used 24 times in the article) and parcel (21). 82 Such terms as działka and parcela are used synonymously also in Polish sociotopographic works. 83
Discussion
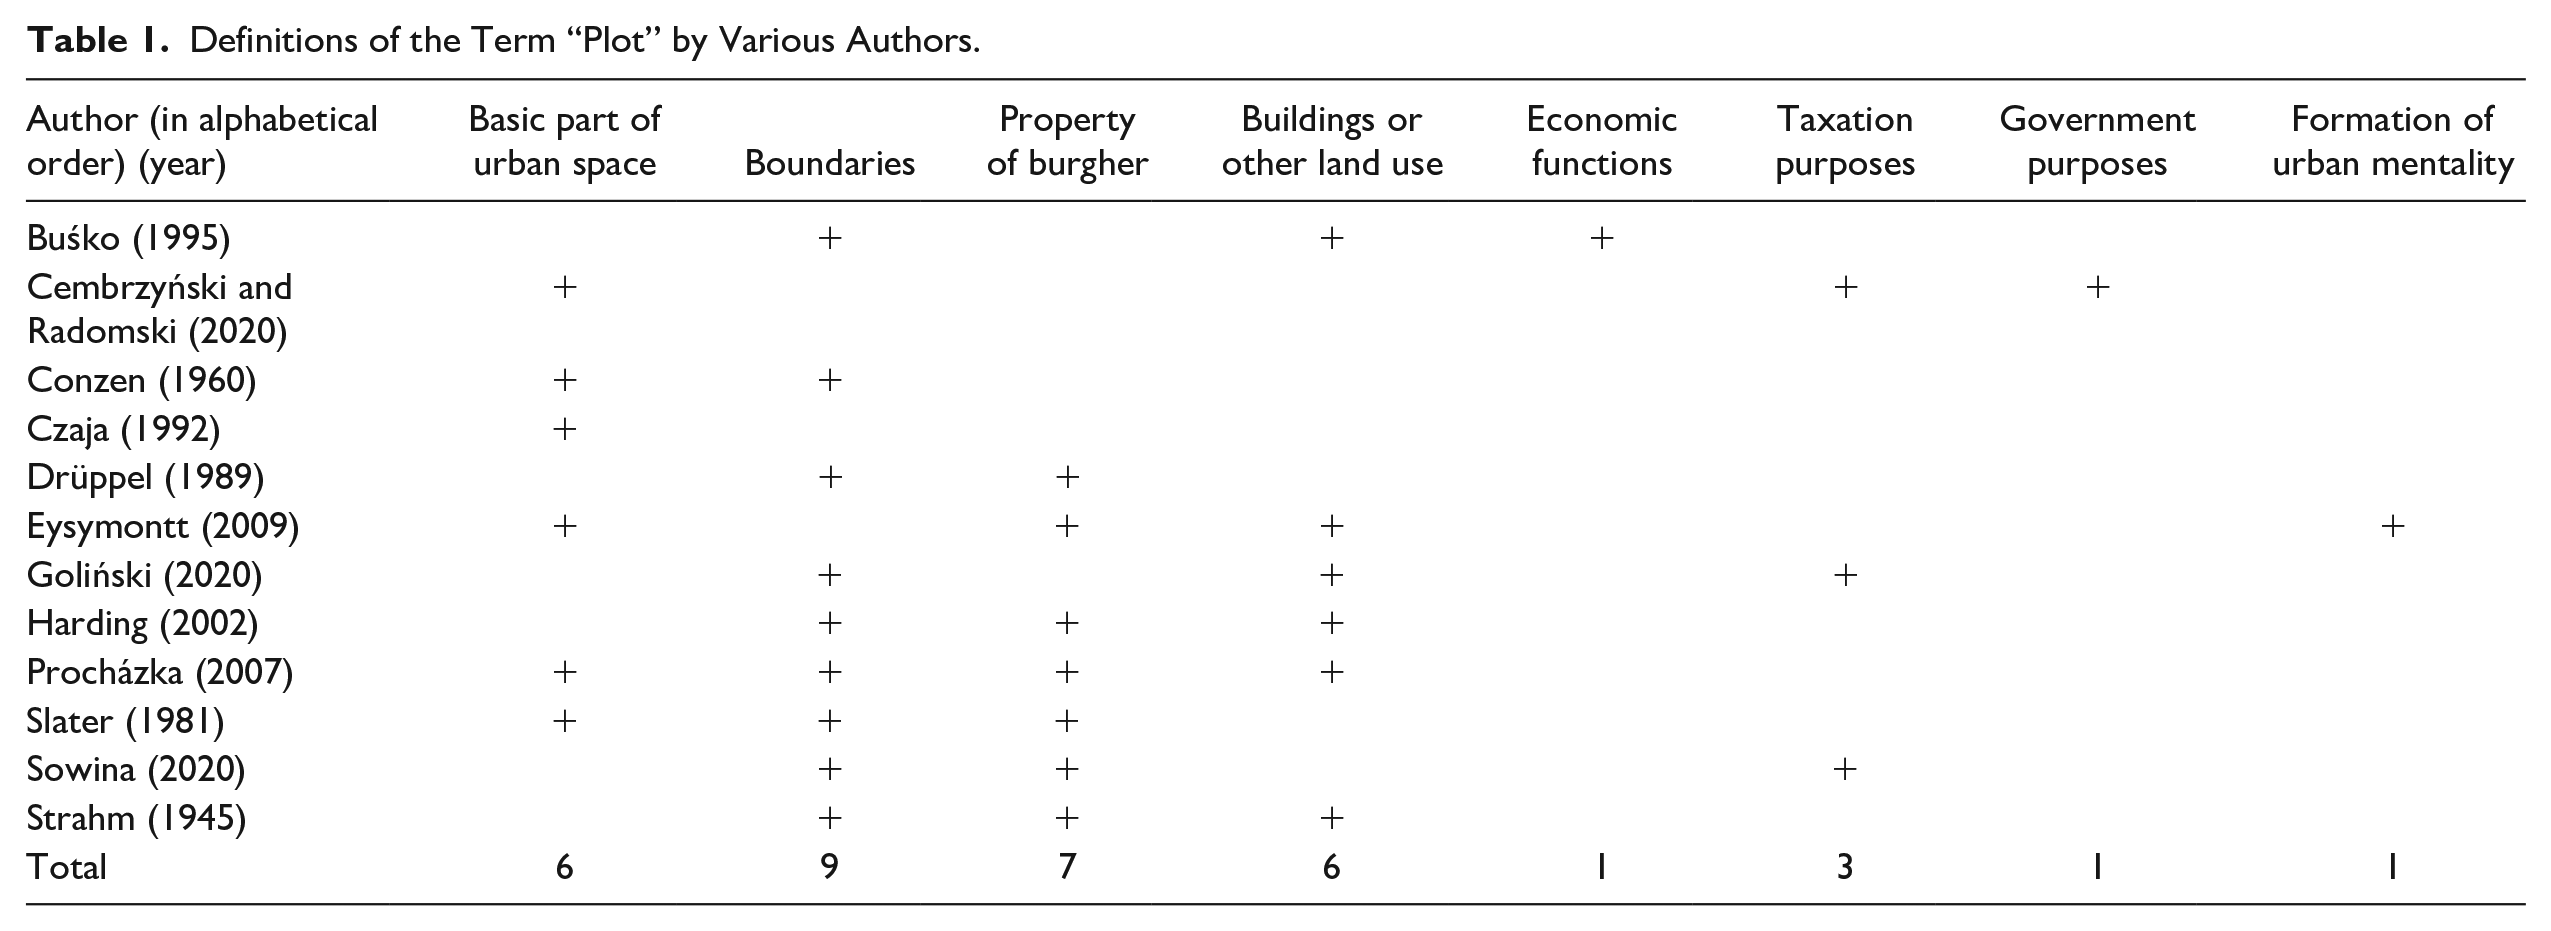
The elements of the above definitions can be grouped into several categories. In Table 1, we indicate whether a given element is present in the definition formulated by a specific author.
Definitions of the Term “Plot” by Various Authors.
The analysis of existing definitions and explanations forms the grounds for several conclusions. Precise measurement of plot acreage and demarcation of its borders are most often emphasized. As concerns the quantitative aspect of the term, that is, plot being a delimited fragment of space, English works seem to use plot most often. 84 Slater’s emphasis on the permanence of outlined parcel borders does not come across as significant in terms of drafting a general definition of plot. As Keith Lilley noted, the permanence of medieval (and even earlier) parcellations was and is dependent on the size and significance of a given town, and this holds true for both the Middle Ages and contemporary times. Lilley also underlined that even if it is possible to prove the permanence of borders in one town part, such findings cannot be applied to all other regions, let alone all other towns. 85
Most above-mentioned definitions underlined that urban plots were held by burghers. This statement is true, yet let us bear in mind that in many towns parcels were bought out by nobility, and were granted to or acquired by Catholic Church institutions. As not only the physical, land-related aspects of plots, but also ownership-related issues (plots forming part of their owner’s property) had to be expressed, authors turned to terms other than plot: English: burgage, Polish: realność, 86 and it seems the German die Hausstätte can also be assigned to this category. It appears that these terms are too narrow for the purpose of our considerations, as they define plot as a unit connected with property, buildings, and land use. One ought to bear in mind that attaching plot ownership with burgher rights was typical rather of the pre-industrial period and that this meaning continued to diminish over time, until it was completely lost in the nineteenth and twentieth centuries.
Definitions frequently indicated that plots were designated for development. This could not be more true: buildings were most often constructed in specific plots of land. Development scale varied, however, depending on plot location within a town, its size, the owner’s profession, and, finally, the decision taken by the plot user. 87 Not all plots were developed, and the degree of their development changed over time. 88 The same plot could be occupied by different structures in different historical periods. It seems that in most cases plots were developed gradually, parallel to a town’s demographic growth. M.R.G. Conzen coined the term burgage cycle for this process. 89 And so, the same developed plot of the late nineteenth century may have housed fewer or no buildings in the sixteenth century.
Development scale and type differed also because plots served different purposes. Depending on the degree of land development, town size, and urban growth, plots had a single dominant function or were an aggregate of several interdependent roles. Swedish towns, which were very small as compared with urban settlements of the European continent, are one example here. These multifunctional plots (Swedish: stadstgård) accommodated not only residential buildings but also other outbuildings (stables, barns), craft workshops, and gardens providing stadstgård residents with sustenance. 90 This observation can be applied to small towns of other European regions with relatively high certainty. M.R.G. Conzen wrote of the tadpole structure of plot, where residential houses and storage facilities occupied the front of a plot, while the rear accommodated a garden with additional structures. 91 The outcomes of archeological research conducted in smaller towns of medieval Silesia prompted Buśko to design a model for internal plot division. In this model, Buśko discerned five functional zones: a residential area, an economic area, a back buildings area, a sanitation area, and a garden area. 92 Although it seems that the dominant function of plots was residential, not every plot was inhabited. Some plots were vacated for temporary intervals of non-residence, yet some were designated solely for crafts and utility structures (e.g., malt houses or granaries 93 ) or gardens.
How to Define the Term “Urban Plot (działka)”—Proposed HOUSe Ontology Definition
One of the assumptions adopted during the development of the UrbanOnto ontology was that the natural language definition should resemble the so-called classic definitions. We therefore referred to the Aristotelian pattern of a classic definition. 94 In line with the “per genus et differentiam,” the classic definiens consists of two parts: the closest genus, and the difference which gives its species.
As indicated above, definitions of the term plot appearing in literature often refer to the characteristics of the period studied by the definition authors. Emphasis was sometimes placed on aspects important to the field researched by a given author. The definition proposed in this article is intended for broad-based—in terms of both time span and spatial range—comparative analyses. It was therefore crucial to ensure that this definition was applicable under various circumstances.
We propose the following definition of the term plot: “the basic unit of urban space organization delimited by borders, on which a building can be built, assigned to an owner.” We consider three aspects—demarcation, building, and ownership—to constitute the key elements of the most general definition of the term plot. Some of the definitions discussed above also contain references to the functional aspects of a plot. However, plots of land can be used for purposes so varied that we decided not to take them into consideration.
Summary
Town plots, much like the basic cells of any living organism, undergo various processes. This renders plots volatile and prevents them from remaining largely unchanged throughout the course of a town’s existence. Delineating borders, so basic a task for the creation of a spatial database and developing the concept of a plot, sometimes proves a tedious exercise, which potentially entails comparing many cartographic and written sources. Another question arises: if we perceive the individual elements of a town as pieces of a puzzle which all fit together, then should subsequent groups be regarded as completely separate categories, or should we think of them as strongly related and interweaving layers?
Meticulous problems with the vectorization of old plans may lead to problems with historical plan interpretation. Interpretation problems might also be triggered by cartographic source content and its surviving condition, as well as the availability of supplementary materials (e.g., instructions followed during plan elaboration). Decisions concerning how a plan ought to be handled are also prone to impact elaboration outcomes, for example, authors may decide to either edit a source in a form that most closely corresponds to the original, or perform its interpretation and publish the resulting critical edition.
Defining the meaning of the term plot, along with identifying plot components and determining plot boundaries, may prove problematic at the stages of both preparing and interpreting a historical map. Such difficulties impact plan accuracy, as well as the precision of accompanying research. Failure to determine exact plot boundaries hinders, for example, analyses of quantitative indicators relating to plot surface area, such as population density or plot unit price. This is also important in relation to analyzing spatial ownership aspects, such as the acreage belonging to a specific person or even the division of land between owners.
It would seem that with such a simple type of object, a plot of land, which is the basic element of urban space, it is not necessary to develop a definition, and that this term may seem so obvious that all researchers would define it unequivocally. However, there are differences in the definitions of plot formulated by different authors, and these discrepancies may impact the perception of this term by text recipients. Adopting a domain ontology of historical urban space for comparative research would establish an unambiguous reference framework for the terms used by the authors, and thus help conduct comparative—both spatial and temporal—research on a wider scale.
Footnotes
Declaration of Conflicting Interests
The author(s) declared no potential conflicts of interest with respect to the research, authorship, and/or publication of this article.
Funding
The author(s) disclosed receipt of the following financial support for the research, authorship, and/or publication of this article: This article has been supported by the Polish National Agency for Academic Exchange under Grant No. PPI/APM/2019/1/00053/U/00001.