
Abstract
This study examines the proposition that national culture is related to urban planning practices. It uses Hofstede’s seven dimensions of national culture, a survey of 500 urban planners across 10 countries, and one-way ANOVA to test for national culture differences. The analyses reveal that urban planners across countries differ on all seven of Hofstede’s national culture dimensions. We argue against the proposition of a homogenizing culture or the development of a “common planning practice.” We comment on how cultural differences might factor into urban planners’ attitudes toward advocacy and social equity planning, citizen participation, and other issues relevant to planners’ practice.
Keywords
Introduction
Urban planners, as public service professionals, are often portrayed as fully informed, rational, and utility-maximizing decision-makers. This technocratic ideal assumes the existence of shared professional values across national boundaries. Such assumptions, however, are increasingly questioned. Early cultural convergence theories (e.g., Ralston et al., 1997) proposed that global economic forces – such as neoliberalism and managerialism – might standardize planning practice. Yet, a growing body of planning literature highlights persistent divergence, shaped by distinct local cultures, political institutions, and professional norms (Healey, 2012; Kelley et al. 2006, Knieling & Othengrafen, 2009).
This study contributes to that discussion by empirically examining the extent to which urban planners in ten countries differ in their cultural value orientations, using Hofstede’s (2001) seven-dimension framework. Hofstede’s model remains one of the most widely used comparative tools for assessing national culture and its implications for behavior, including within public sector organizations.
While Kaufman’s (2000) study of planners in three countries was long the most extensive comparative study of its kind, subsequent research by Rodriguez and Brown (2014) expanded the field to six countries. This study builds on that foundation, offering data from ten nations and further testing the proposition that national culture shapes planners’ decision-making orientations. Contrary to Kaufman’s argument for a “common planning practice,” our findings challenge the convergence hypothesis by demonstrating meaningful variation in planners’ cultural profiles across national contexts.
In doing so, this study deepens our understanding of how culture informs not only planning values but also professional identity and leadership. Studies such as Kaufman and Escuin (2000), Sanyal (2005), and Healey (2012) emphasize that even globally circulating planning ideas are filtered through culturally specific lenses. This article adds to that literature by using a relatively large-scale comparative dataset to explore how value differences may shape what we might call “cultural products,” including planning outcomes and institutional behavior.
Here, we first review the concept of values and their relevance to decision-making. We then introduce Hofstede’s framework and the 2008 Values Survey Model, followed by the methodology, results, and a discussion of how cultural differences influence planners’ roles across diverse national settings.
Values and Decision-Making
Values as Mediators of Urban Planning
Clarifying differences across national cultures requires a solid understanding of cultural values. Over time, values have been persistently confused with attitudes due to the unclear definition of the values construct. Rohan cites Campbell’s list of 76 concepts related to values as a way of supporting the claim that the “values” concept has been abused and misused by researchers and laypersons alike (Campbell, 1963; Rohan, 2000). Hofstede defines values as the inclination to accept certain situations over others (Hofstede, 1980). According to Rokeach (1972), attitudes are differentiated orientations or judgments about a social entity or object that leads one to react in a preferential manner. An example of the interplay between values and attitudes from urban planning might be planners’ positive views of participatory planning. Such an attitude can be attributed to two or more underlying values that can be contradictory (Schultz & Zelezny, 1999). That is, planners might positively view participatory planning because of beliefs in democratic values (liberty, justice, due process, and the like) or a belief that the organization’s survival depends on getting outside clientele to agree to proposed alternatives – the “cooptation” process Selznick (1949) described.
This study assumes that values, more than attitudes, are the underlying convictions guiding individuals’ social choices, making values more stable than attitudes (George & Jones, 1997; Hofstede, 1983; Kamakura & Novak, 1992). Furthermore, it implies that values form the building blocks of culture and influence individual behavior. A review of the literature focused on discussing the importance of values to the planning practice follows.
Cross-National Value Differences
This study focuses on general cultural values as measured by Hofstede’s dimensions. We acknowledge that these may not always align with planners’ professional values shaped by ethics, institutional roles, or legal mandates. Future studies could complement this work with Public Service Motivation (PSM) theory (Perry & Wise, 1990), which explores how personal and institutional motivations interact in public service.
To date, only three studies have focused on cross-national research on city planners’ values and culture. Jerome Kaufman (1985), the first researcher to empirically study planners’ values in two different cultures, created a survey that found that Israeli planners were more likely than Americans to allow personal values to shape their work. In 2000, Kaufman extended the crossnational scope of his 1985 study to include attitudes of a sample of planners from three countries:the Netherlands, Spain, and the U.S. Kaufman found that “similarities greatly outweigh differences among the three groups of planners we sampled” (Kaufman, 2000, p. 6). He reported similarities in their views of public-interest goals, including protecting the environment, improving mass transit, promoting equity in planning, and generally negative views toward private developers. Kaufman’s 1985 and 2000 studies also found that planners’ values had an intervening effect on their professional practices, and the cultures of each country affected how the planners confronted different job situations.
Kaufman noted the studies were in no way conclusive because of sampling and other methodological limitations (Kaufman 1985, 2000). Although recognizing these studies’ exploratory nature, the results suggest that individual values, attitudes, and ethics affect urban planners. On the question of why planners from three different cultures reported such convergence in attitudes, Kaufman speculated that these similarities resulted from the development of “a common planning culture or ideology among all three groups” (Kaufman 2000, p. 1).
Friedmann disagrees with the notion of a common planning culture, arguing that planners and planning practice are inevitably conditioned by politics, economics, and cultures, among other contextual factors (Friedmann, 2005). These factors may lead the profession away from a universalized “planning culture” and toward more distinctive manifestations of planning practices. Rodriguez and Brown’s findings generally agree with Friedmann, concluding that planners from six countries are notably different on five dimensions of culture as measured by Hofstede’s national culture indexes (Friedmann, 2005; Hofstede, 2001; Rodriguez & Brown, 2014).
Measuring Cross-Cultural Differences
This study will use Hofstede’s model to measure culture across countries (Hofstede, 1980, 2001, 2008). Hofstede developed his national culture model through theoretical reasoning and multivariate statistical analysis of data collected from more than 116,000 International Business Machine (IBM) employees in 66 countries in the late 1960s and early 1970s. The data were collected using questionnaires that measured employees’ attitudes and values. Initial statistical analysis of the data showed that employees’ value orientations differed significantly across countries (Hofstede, 1983). Factor analysis of the mean scores for the different value questions showed that three independent factors explained 50% of the variance between countries. Hofstede split one of the three factors into two independent factors, theoretically linking the four resulting factors to fundamental human problems: power-sharing and inequality, relating to other individuals, uncertainty avoidance, and fixing gender roles. Societies vary in how they go about addressing these human problems, resulting in different cultures. Hofstede developed an index for each of these factors and called them dimensions. Each of the 66 country scores on a particular dimension can be represented as points along a continuum of two opposites. The dimensions are largely independent of each other, and scores occur in nearly all possible combinations. The measures range from 0 to 100, where “0” represents small power distance, strongly collectivist societies, high masculine societies, and weak uncertainty avoidance, and “100” large power distance, strongly individualist societies, high feminine society, and strong uncertainty avoidance. The dimensions are defined as follows:
Large or small power distance (PDI) – Although inequality affects all societies, some societies show less inequality than others. In countries where the prevailing values agree with large Power Distance, members of groups or organizations accept an unequal share of power. These unequal distances to power are accepted by influential members of society and the less powerful. Less powerful people accept this inequality because of their psychological need for dependence.
Individualism versus collectivism (IND) – This concept addresses the fundamental human difficulty of how individuals relate to other members of their group. At one extreme of the individualism/collectivism continuum, individualist groups imply a loosely integrated social unit. People are expected to take care of themselves and their immediate families only. These groups afford their members maximum freedom to go about achieving individual goals. On the other end, collectivist groups in a tightly integrated social unit are expected to put the group, family, and clan’s welfare and interests before their self-interests. Collectivist-minded individuals expect the support of their in-group in exchange for member loyalty.
Masculinity versus femininity (MAS) – This dimension is theoretically linked to the fundamental human problem of assigning social roles between males and females. All societies arbitrarily assign different roles to men and women, but some societies maintain a more determined and rigid separation of gender roles. Masculine-centered societies emphasize values traditionally associated with male domination, such as aggressiveness, assertiveness, money-making, and acquisition of objects that denote status and power (big cars, big houses, and so on). At the other end of the dimension, the prevailing values of “feminine” societies focus on maintaining quality of life, nurturing, taking care of others, sharing, caring for the environment, and energy conservation. Societies deemed “masculine” markedly differentiate between social sex roles, while “feminine” societies allow for flexibility (Hofstede, 1983).
Strong or weak uncertainty avoidance (UAI) – The UAI index relates to the fundamental human problem of not being able to predict the future and the stress in a society in the face of uncertainty. “Weak Uncertain Avoidance” societies more readily accept an unpredictable future and feel more secure and less stressed by risk, changes, or unfamiliar events or people. “Strong Uncertainty Avoidance” societies are more threatened by uncertainty and attempt to predict the future or cope through the use of law, religion, ideology, science, and technology. Members of these groups prefer career stability, controlled environments, security, stable political systems, formal rules, and absolute truths, and often demonstrate intolerance of different ideas and behaviors.
In the 1980s, collaboration between Hofstede and Michael Harris Bond led to work on a Chinese Value Survey (CVS). Recognizing that Hofstede’s survey was biased towards a Western perspective and values, Bond collaborated with four Chinese colleagues to develop the CVS to better reflect an Eastern view of culture (Chinese Culture Connection, 1987). The CVS was used to collect student data from 23 countries around the world. A new dimension, “long-term versus short-term orientation,” was found in the survey’s answers. Like Hofstede’s measures, 0 represents a “low” Long-term society and 100 a “high” Long-term society. The description of the fifth dimension is as follows:
Long-term versus short-term orientation (LTO) – This dimension fundamentally addresses “time orientation.” Time orientation affects how societies deal with family problems, work, religion, and philosophical viewpoints. Long-term oriented societies value persistence, patience, building business relationships for future benefits, frugality, saving, and the view that the best things come later in life. Short-term orientated societies value leisure time, quick results, immediate satisfaction, and the belief that the best in life has already happened.
In 2008, the researchers added two more dimensions to the VSM 08 based on the work of Hofstede et al. (2005) and Minkov (2007). In these measures, “0” indicates an indulgent and monumental society and “100” a restrained and self-effacement society. These are defined below.
Indulgence vs. restraint (IVR) – The dimension fundamentally addresses the importance of leisure in the pursuit of happiness. IVR measures the extent to which societies indulge in behaviors related to enjoying life and having fun versus suppressing such gratification, based on the conviction that indulgence needs to be regulated by strict social norms. Indulgence-oriented societies value the freedom to enjoy friendship, leisure time, worry-free spending, sex, and believe that it is healthy to control their own lives. Restraint-oriented societies value communal and family control, moral and religious discipline, and the firm conviction that gratification must be suppressed.
Monumentalism versus self-effacement (MON) – This dimension measures the degree to which a society rewards pride and a strong sense of identity versus rewarding humility and acceptance that one’s identity can change. Monumental groups seek recognition and to make their kin, societies, and nation proud. They tend to be religious and tend to help others fulfill the need to be admired and recognized for their monumentality. Self-effacement societies are unconcerned with pride or a strong sense of identity. To these groups, identity is changeable and improvable. Self-effacement groups are humble, flexible, and accepting of new knowledge and ideas.
Methodology
Instrument
Hofstede’s 2008 Values Survey Module (VSM 08; Hofstede et al., 2008) was used to collect data from the 10 countries in this study: Brazil, China, Congo, Georgia, Ghana, Iran, Nepal, Peru, South Africa, and the United States. VSM 08 is a 28-item questionnaire developed to measure seven dimensions of culture (outlined above) across countries or geographic regions within countries. Each of the seven dimensions is measured by four specific items in the questionnaire. The VSM also included six demographic questions: sex, age, education level, occupational status, nationality, and nationality at birth.
This study used seven language versions of the VSM 08. Geert Hofstede generously provided the English, Spanish, Persian, Portuguese, and Chinese versions of VSM 08. The English version was used to survey planners in Ghana, Congo, South Africa, and the United States. Bilingual native speakers translated the original English-language version of the VSM 08 into Georgian and Nepali. A different set of native speakers translated the resulting versions back into English without referring to the original English version. The resulting back-translated text then was compared to the original English-language questionnaire for any unwarranted non-equivalence in meaning. Minor corrections were made to bring the translations as close as possible to being equivalent to the original texts.
Participants and Procedures
Although Hofstede’s model originated in organizational and management studies, its dimensions – particularly power distance, uncertainty avoidance, and long-term orientation – are directly relevant to planning functions like public engagement, regulatory enforcement, and strategic development.
Here, we surveyed 50 planning employees in each of the 10 countries, for a total of 500 participants. The ten countries were selected based on researcher access, translation capacity, and the opportunity to represent Global South and Global North planning contexts. The exclusion of Western Europe was a deliberate choice to diversify the geographic scope and include culturally underrepresented regions in comparative planning research.
In the cases of Georgia, Ghana, Iran, Peru, South Africa, and the U.S., the authors and research assistants, following a purposive sampling strategy, selected the participants. That is, researchers solicited the voluntary and uncompensated participation of professional urban planners, technical personnel, support staff, and managing personnel in metropolitan planning agencies. Since the purpose of the survey was to collect data on value orientations across cultures and control for a public sector occupation was necessary, participation was limited to professional urban planners or employees working closely with city planners on the planning agency’s mission. The same purposive sampling strategy was used to collect data in the remaining four countries. In these four countries, the authors relied on professional contacts at planning agencies to administer the survey. Research contacts were instructed on appropriate data collection procedures, the importance of maintaining anonymity, the voluntary nature of the participation, and the criteria used to acquire a representative purposive sample of the planning agency. In all cases, the survey was administered to the respondents during their workday. All participants anonymously and independently completed the questionnaire within approximately 20 minutes. Professional contacts in host countries ensured that the data were collected without compromising the participants’ anonymity and mailed the completed questionnaires to the authors.
Table 1 shows the demographic characteristics of the respondents for the 10 countries sampled. The mean age for the countries’ respondents ranged from 30 to 59 years, with an overall mean across the 10 countries of 43 years. Mean educational levels ranged from 10 to 18 years of formal education. Iran showed the highest level of education for the planners sampled (18 years). China (14 years), Congo (14 years), and Nepal (10 years) showed lower mean educational levels than the 15-year overall mean across countries. The overall mean of the percentage of women responding to the survey was 44%. Women in the Georgia sample were overrepresented at 68%, while women were underrepresented in the samples from Ghana (34), Peru (20), and South Africa (30).
Demographic Characteristics of the Sample by Country.
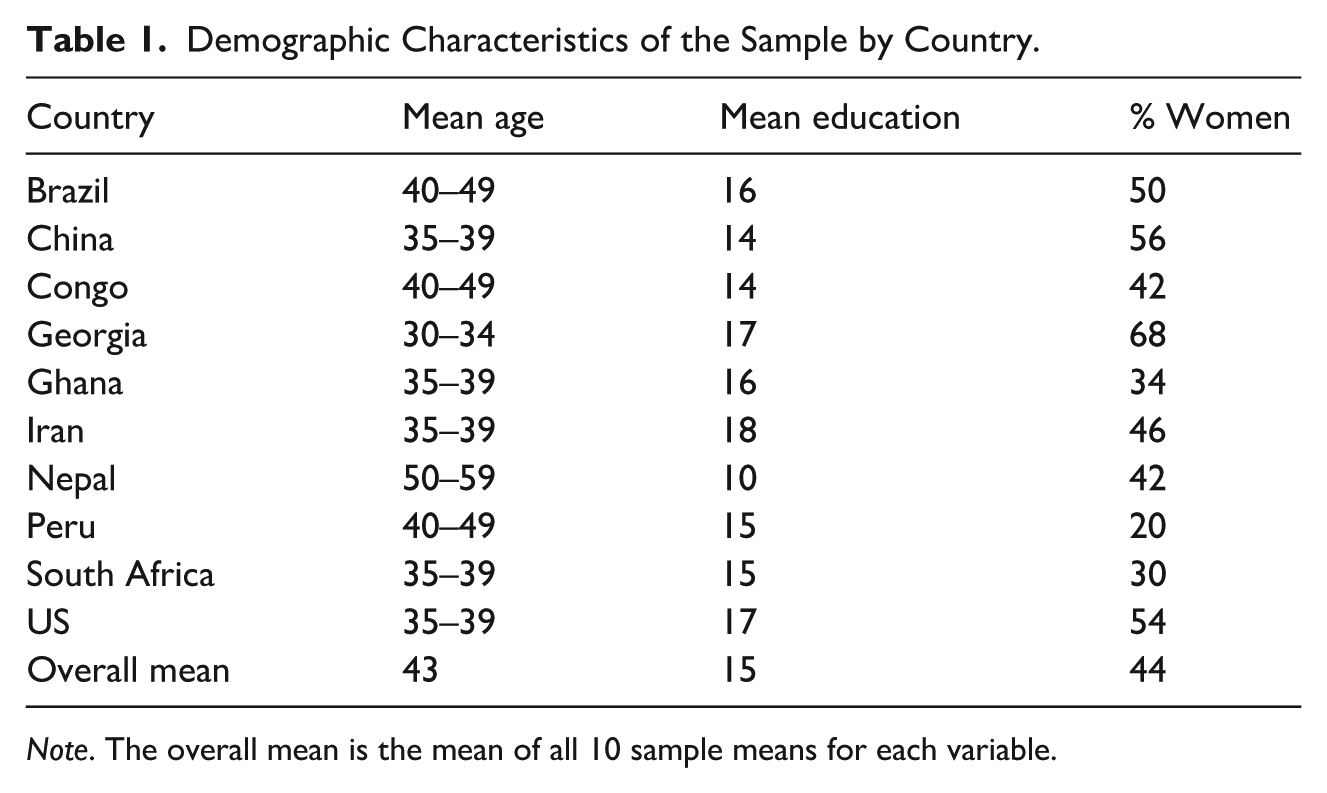
Note. The overall mean is the mean of all 10 sample means for each variable.
Results
Descriptive Statistics
Table 2 presents the index scores and standard deviations for the seven dimensions of culture for each of the 10 countries in the study. Shown as well are the F (and p) values for each of the seven ANOVAs, Welch statistics, Eta squared (η2) effects.
Index Scores and Standard Deviations for Hofstede’s Culture Dimensions for Each of the Countries in the Study.
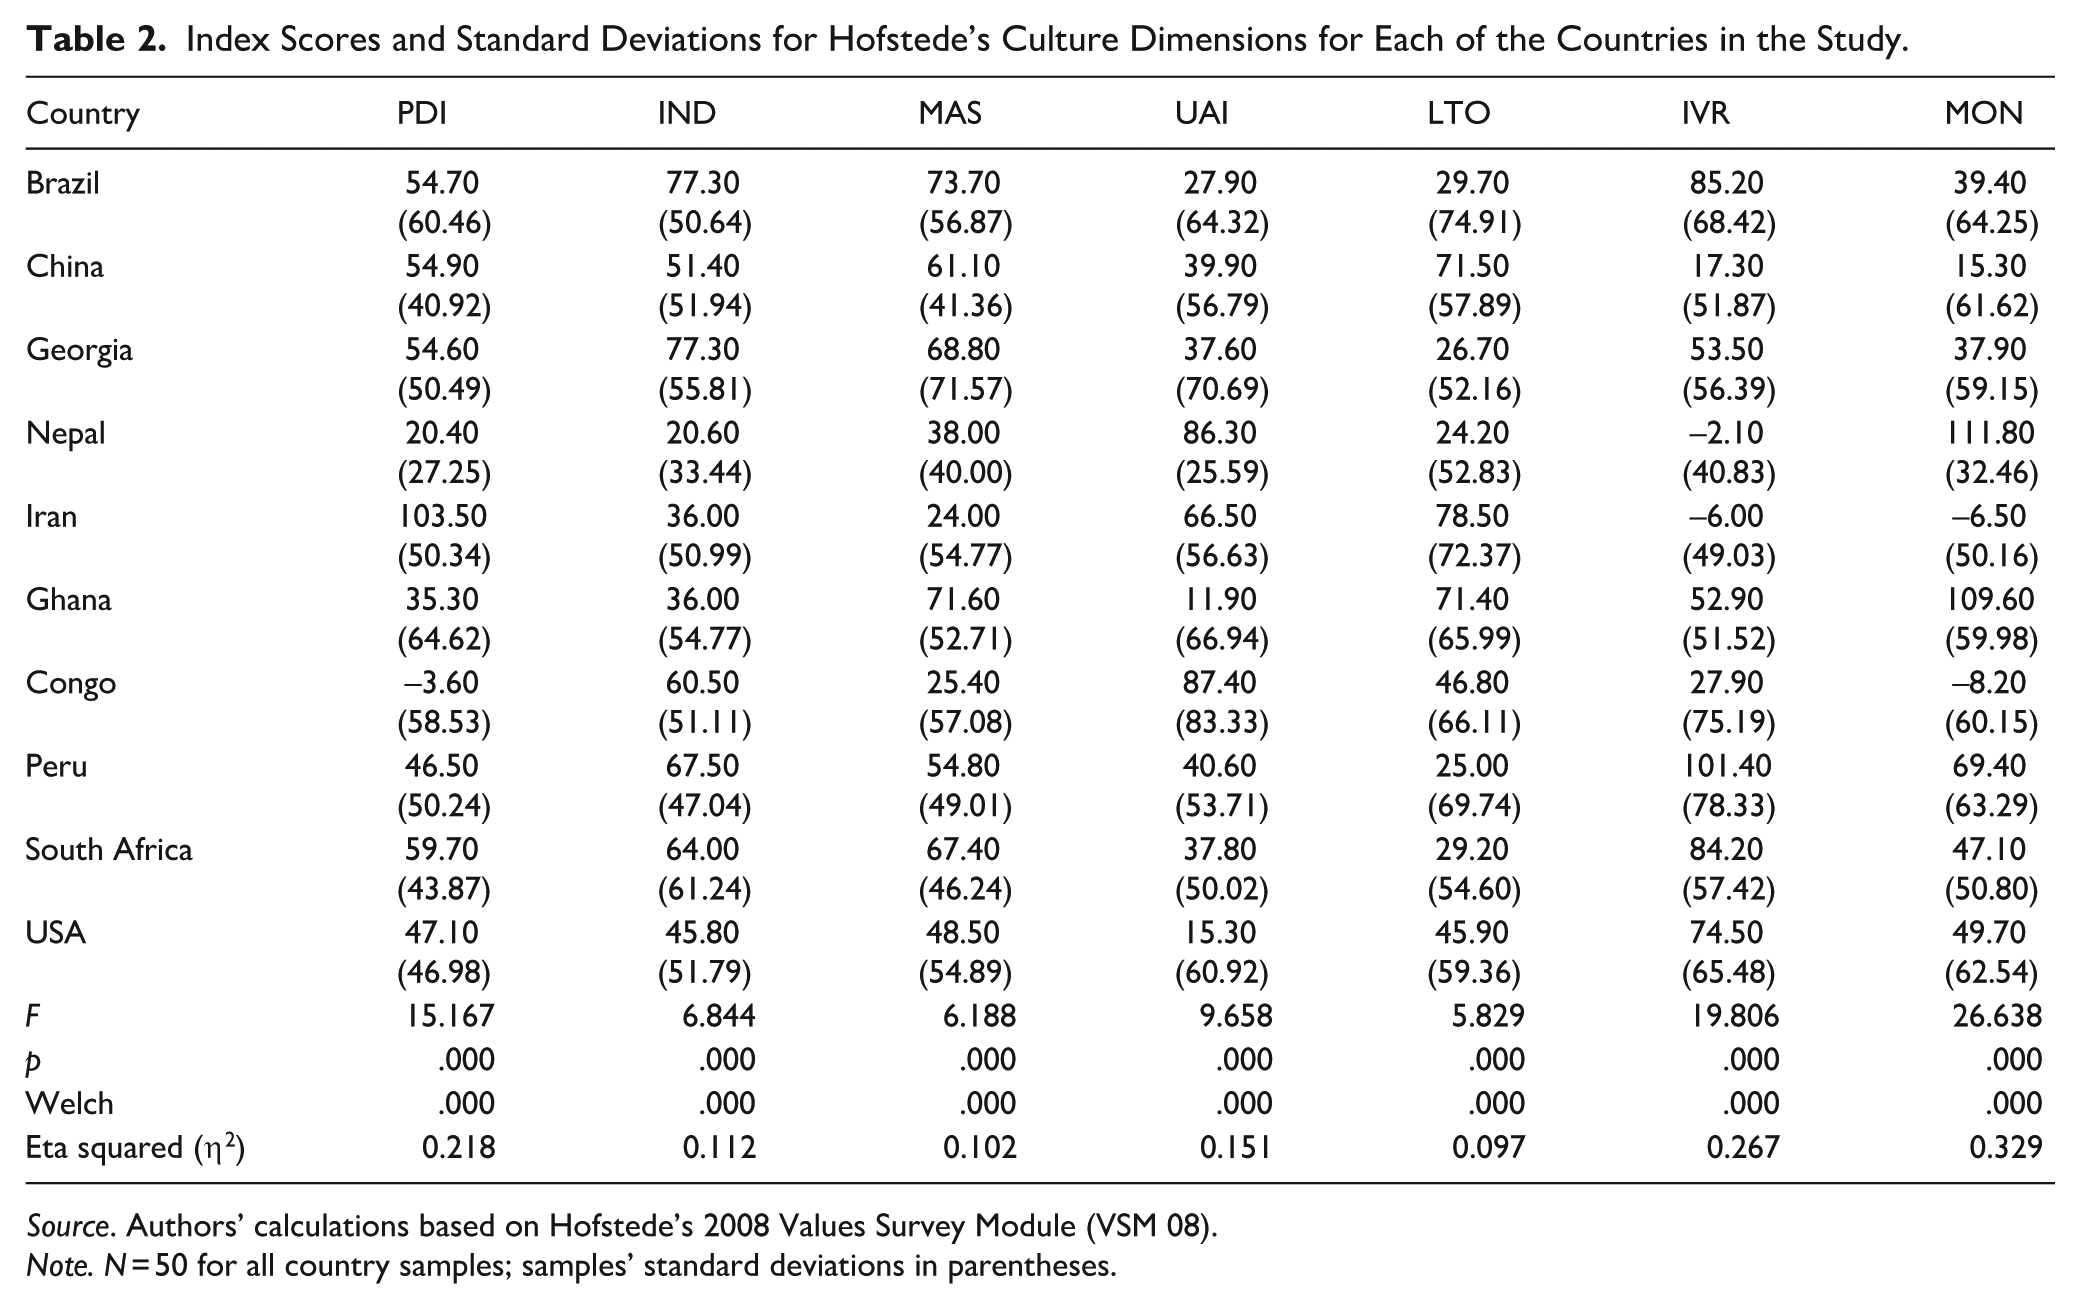
Source. Authors’ calculations based on Hofstede’s 2008 Values Survey Module (VSM 08).
Note. N = 50 for all country samples; samples’ standard deviations in parentheses.
Tests of the Research Questions
Seven separate one-way, between-groups analyses of variance (ANOVA) were calculated to test for overall differences in Hofstede’s seven dimensions of culture across groups of urban planning employees residing in the 10 countries sampled. Specifically, the General Linear Model (GLM) Univariate method was used in SPSS. This method of performing a one-way ANOVA is recommended when equal variances are not assumed, as is the case for the current study. The Welch statistic was calculated for all ANOVAs as one more method to lessen the threat of unequal variances. In all seven cases, with a p = .000, the Welch statistic confirmed the robustness of the standard F-statistic values of significance reported by the GLM Univariate procedure.
Table 2 shows that all seven ANOVAs yielded a statistically significant effect. In all cases, the F statistic has degrees of freedom of 9 and 490 and p = .000, but varying magnitudes of the effect size. Most importantly, given the p-values, the null hypotheses of no differences between the means were rejected. Simply stated, the variances of how planners scored on each of the seven dimensions of culture are explained by their nationalities. For example, for the power distance dimension (PDI), the ANOVA shows F(9, 490) = 15.167, p = .000, η2 = .218. Thus, 21.8% of the variance in how planners perceive power differences is explained by their nationalities. In comparison, regarding the self-effacement versus monumentality (MON) dimension, the ANOVA shows F(9, 490) = 26.368, p = .000, η2 = .329. Thus, 32.9% of the variance in how planners perceive their nationalities explains monumentality.
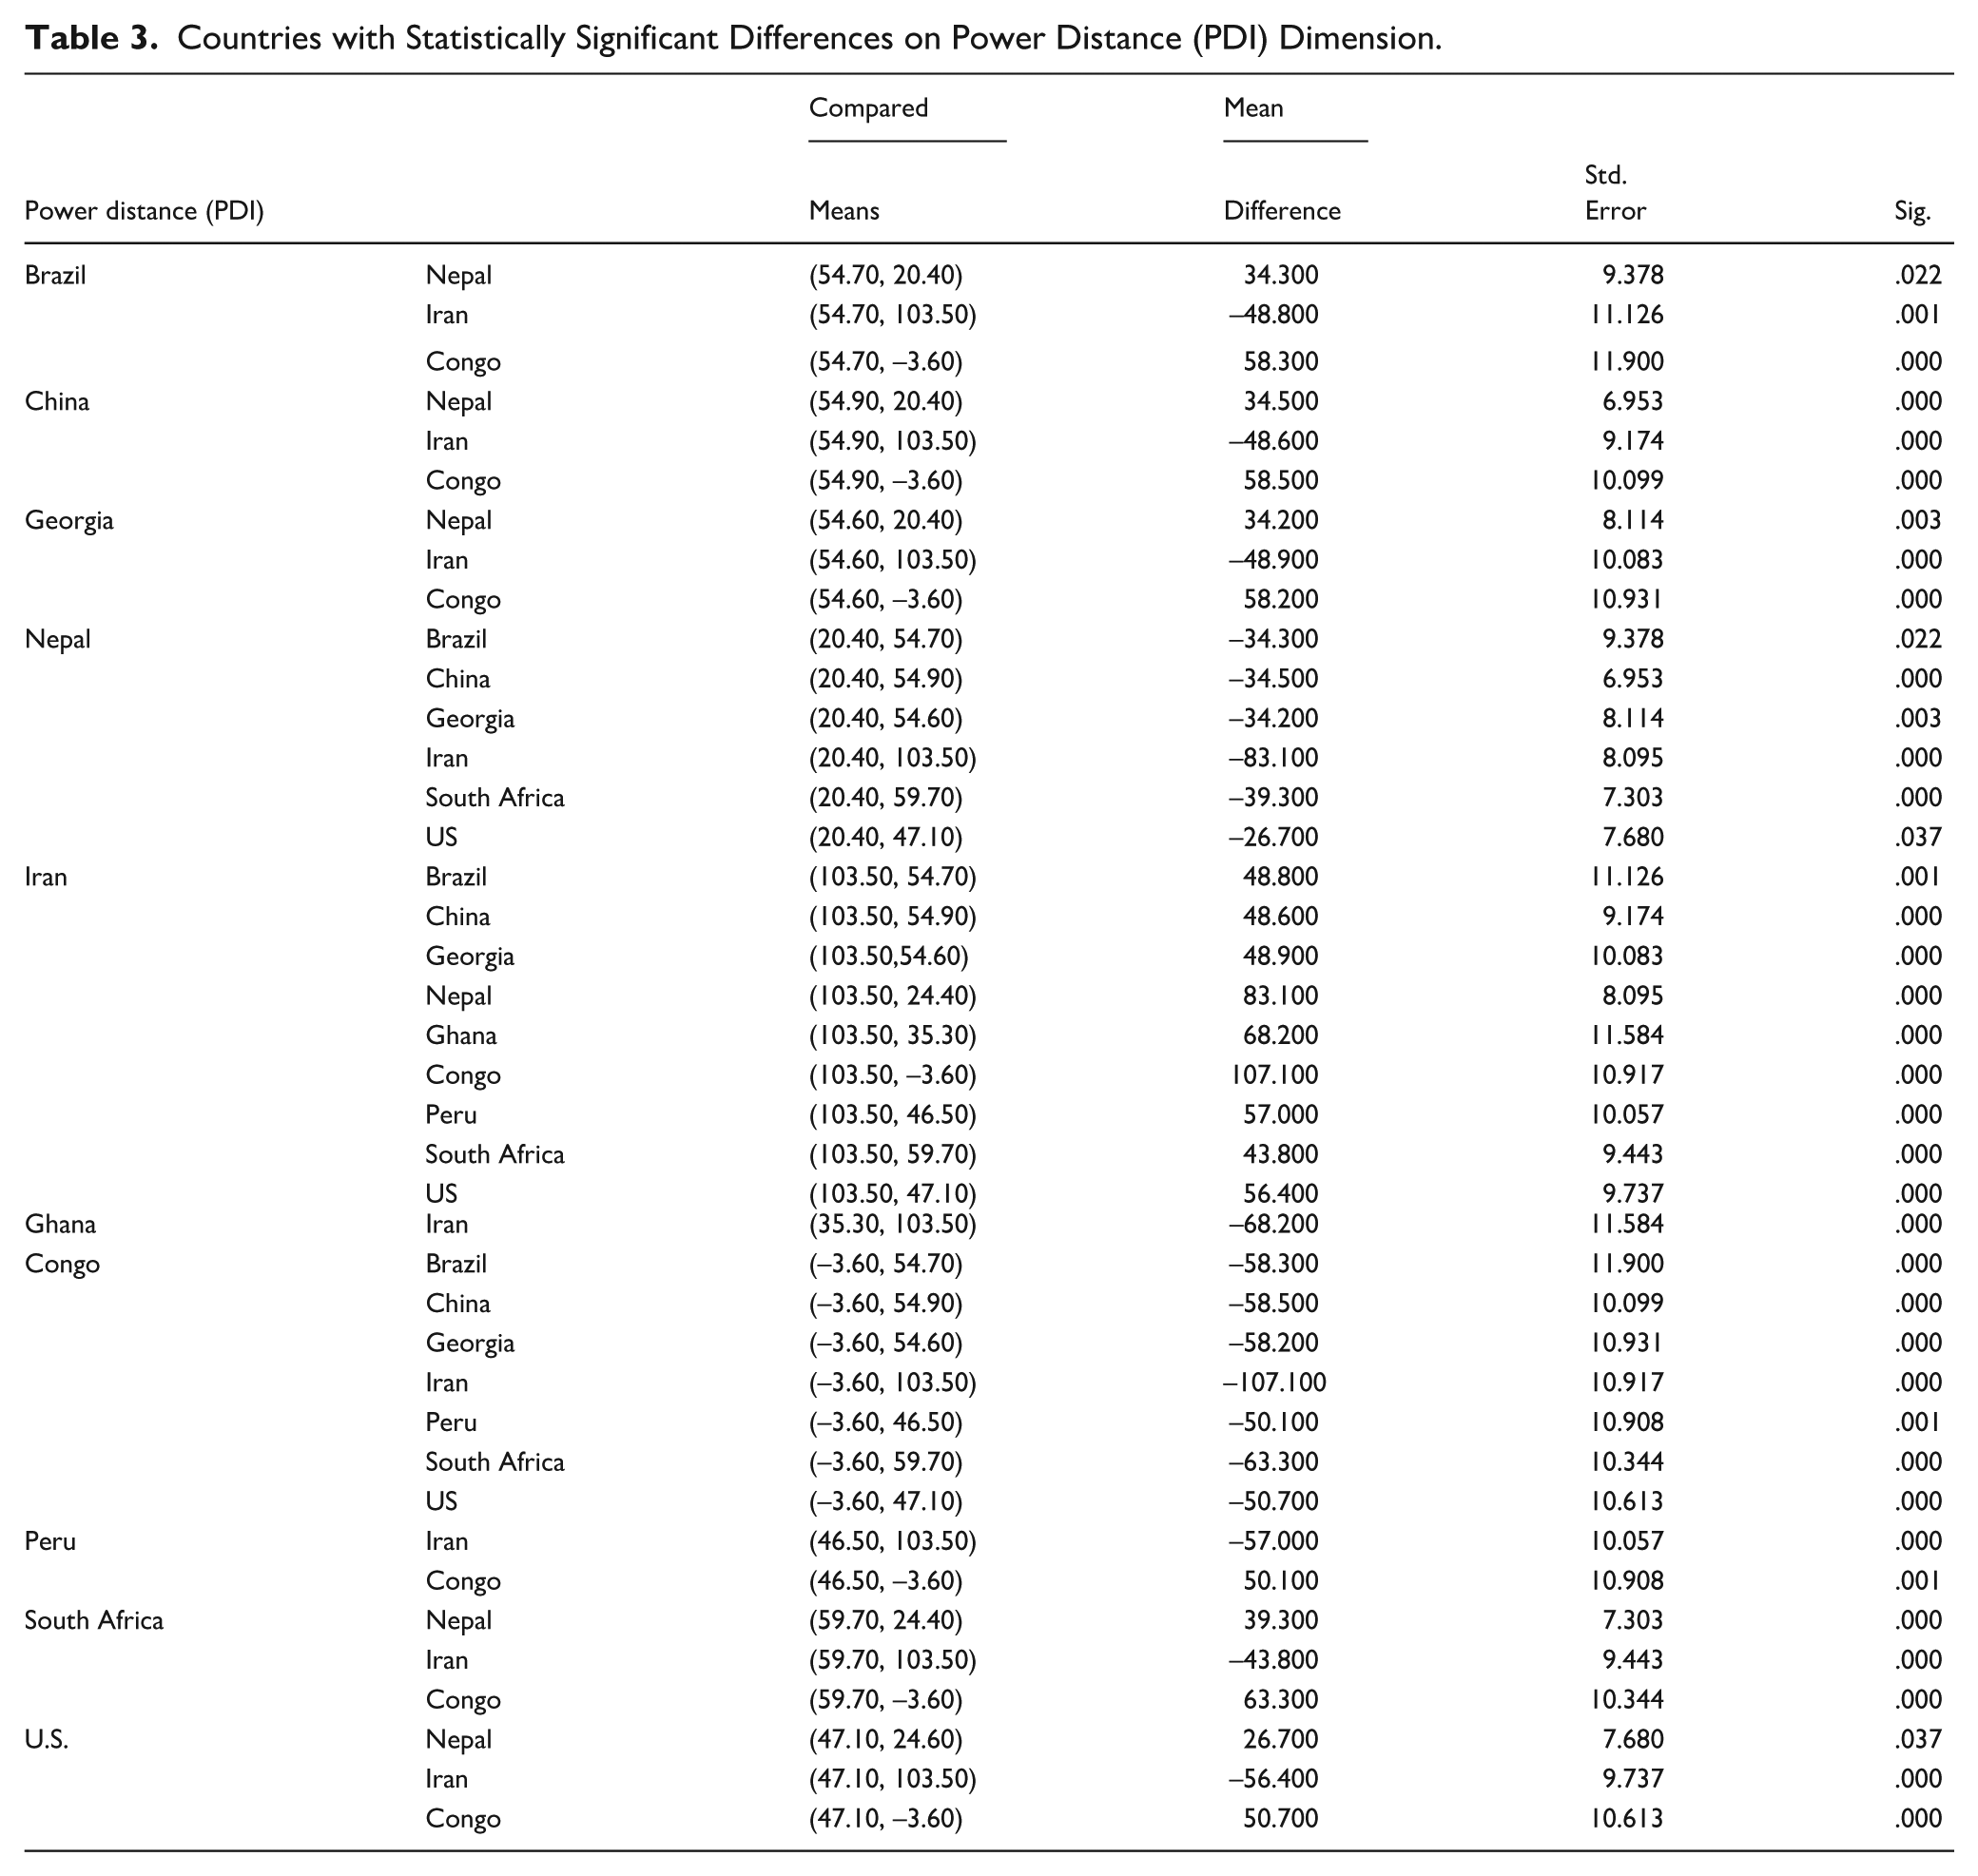
The ANOVA test allowed us to reject the null hypothesis of equal means, but it does not specifically identify which country is different from the others. To evaluate the nature of the differences between the means further, the ANOVA was followed up with Tamhane’s T2 post hoc test for each of the seven dimensions. The Tamhane’s T2 post hoc test was chosen because it does not require sample variances to be homoscedastic. The post hoc tests every independent pairwise comparison among all ten countries in the study. For ten countries and seven dimensions, the number of independent pairwise comparisons total 315. Instead of showing a table of all 315 comparisons, the study shows seven separate tables (one per cultural dimension) of only those countries found to be statistically significantly different on each of the seven dimensions.
Power Distance (PDI)
Table 3 shows all the statistically significantly different countries on the power distance (PDI) dimension. It also shows Tamhane’s T2 post hoc test statistics results, including the level of significance. Regarding the PDI dimension, the ANOVA results suggest that a significant overall difference exists across the 10 countries, F(9, 490) = 15.167, p = .000, η2 = .218. The magnitude of the effect size between the respondents’ nationality and their mean score on the power distance variable, as assessed by η2, was large, with power distance accounting for 21.8% of the PDI variable variance. The post hoc Tamhane’s T2 test shown in Table 3 reveals a significant difference in mean levels of the PDI variable between inequality-accepting countries, including Iran (M = 103.50), Brazil (M = 54.70), China (M = 54.90), Georgia (M = 54.60), South Africa (M = 59.70), and the U.S. (M = 47.10) and countries which scored low on the PDI index such as Congo (M = −3.60) and Nepal (M = 20.40). Specifically, the results indicated that Congo and Nepal report experiencing practically no power distance between individuals. In contrast, in Iran (M = 103.50), South Africa (M = 59.70), and China (M = 54.90), the perception of inequality between a less powerful and more powerful individual is much more salient.
Countries with Statistically Significant Differences on Power Distance (PDI) Dimension.
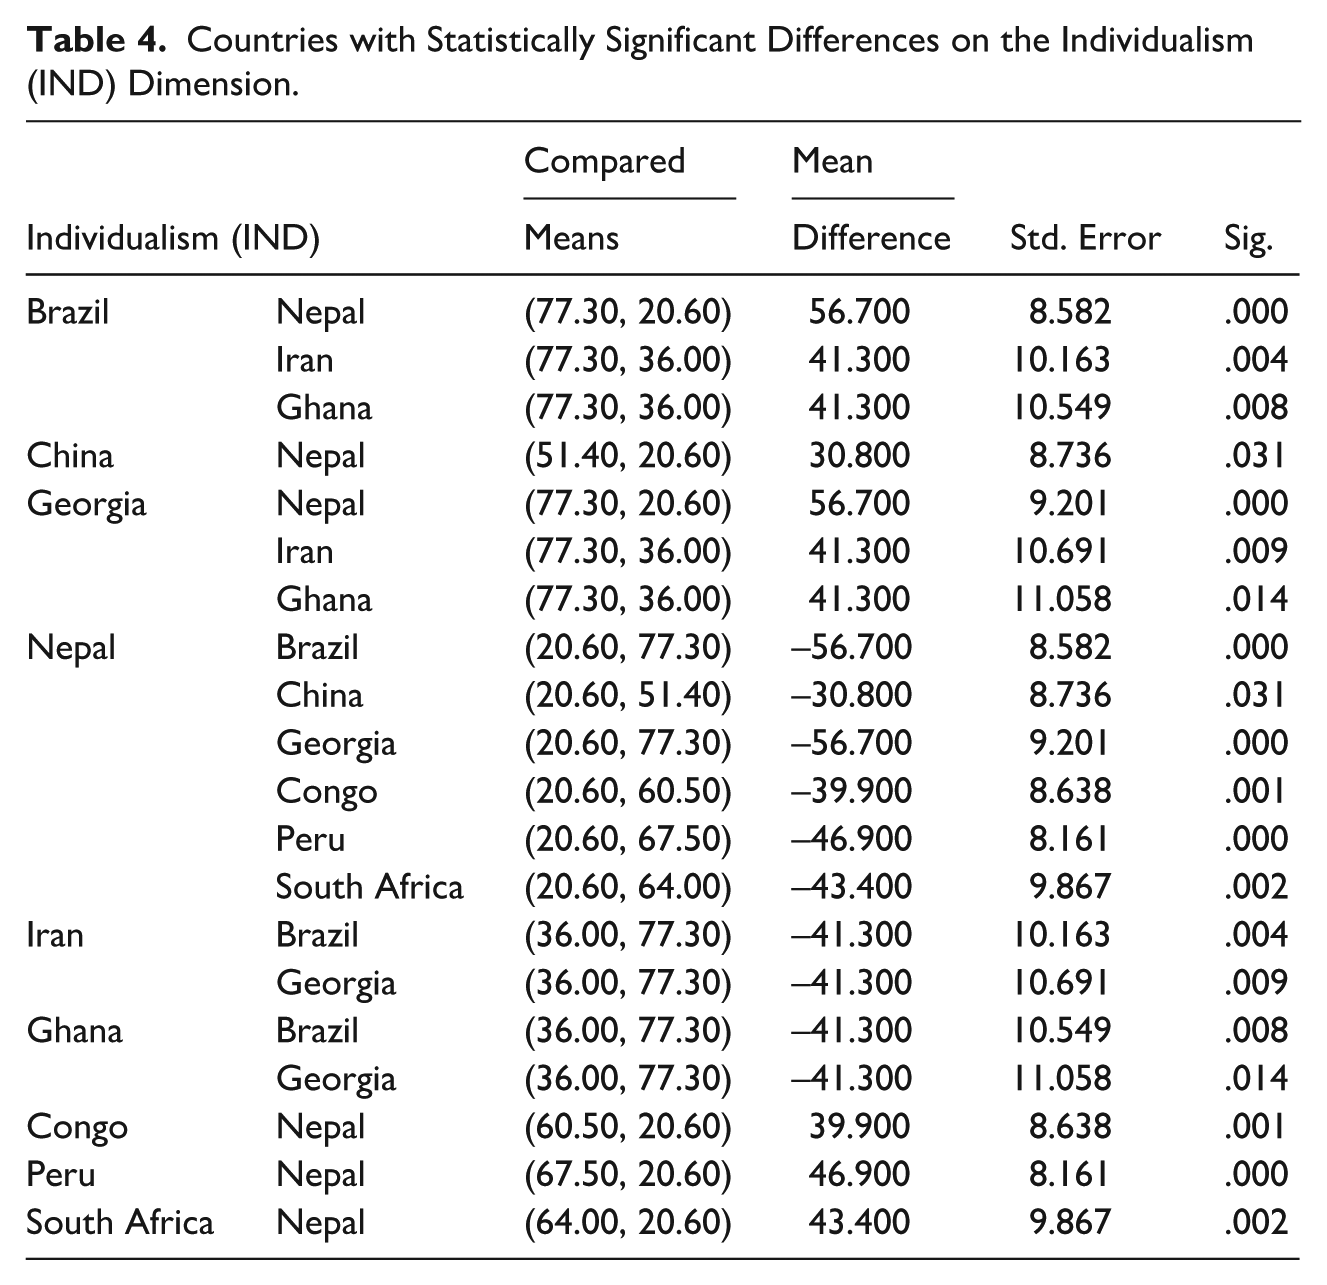
Individualism Versus Collectivism
In terms of individualism versus collectivism (IND), the results of the ANOVA revealed a statistically significant overall difference across nine of the 10 countries in the study [F(9, 490) = 6.844, p = .000, η2 = .112]. The magnitude of the effect size between the respondents’ nationality and their mean score on the power distance variable, as assessed by η2, was “medium,” with nationality accounting for 11.2 % of the variation in the dependent variable. Table 4 shows the nine countries with statistically significantly different on the individualism dimension. The U.S. is not shown because the post hoc test did not find a significant difference between the U.S. and any other country. Table 5 also shows Tamhane’s T2 post hoc test statistics results, including its significance level. The post-hoc Tamhane’s T2 test indicated that Nepal planners exhibit a significantly greater focus on the goals and needs of communities or societies (M = 20.60), compared to planners from Brazil (M = 77.30), China (M = 51.40), Georgia (M = 77.30), Congo (M = 60.50), Peru (M = 67.50), and South Africa (M = 64.00), all of which are relatively similar in individualistic orientations. Post hoc analysis further revealed that planners in Iran (M = 36.00) and in Ghana (M = 36.00) also exhibit a significantly greater focus on community and societal needs and goals, but only compared to those in Brazil (M = 77.30) and Georgia (M = 77.30).
Countries with Statistically Significant Differences on the Individualism (IND) Dimension.
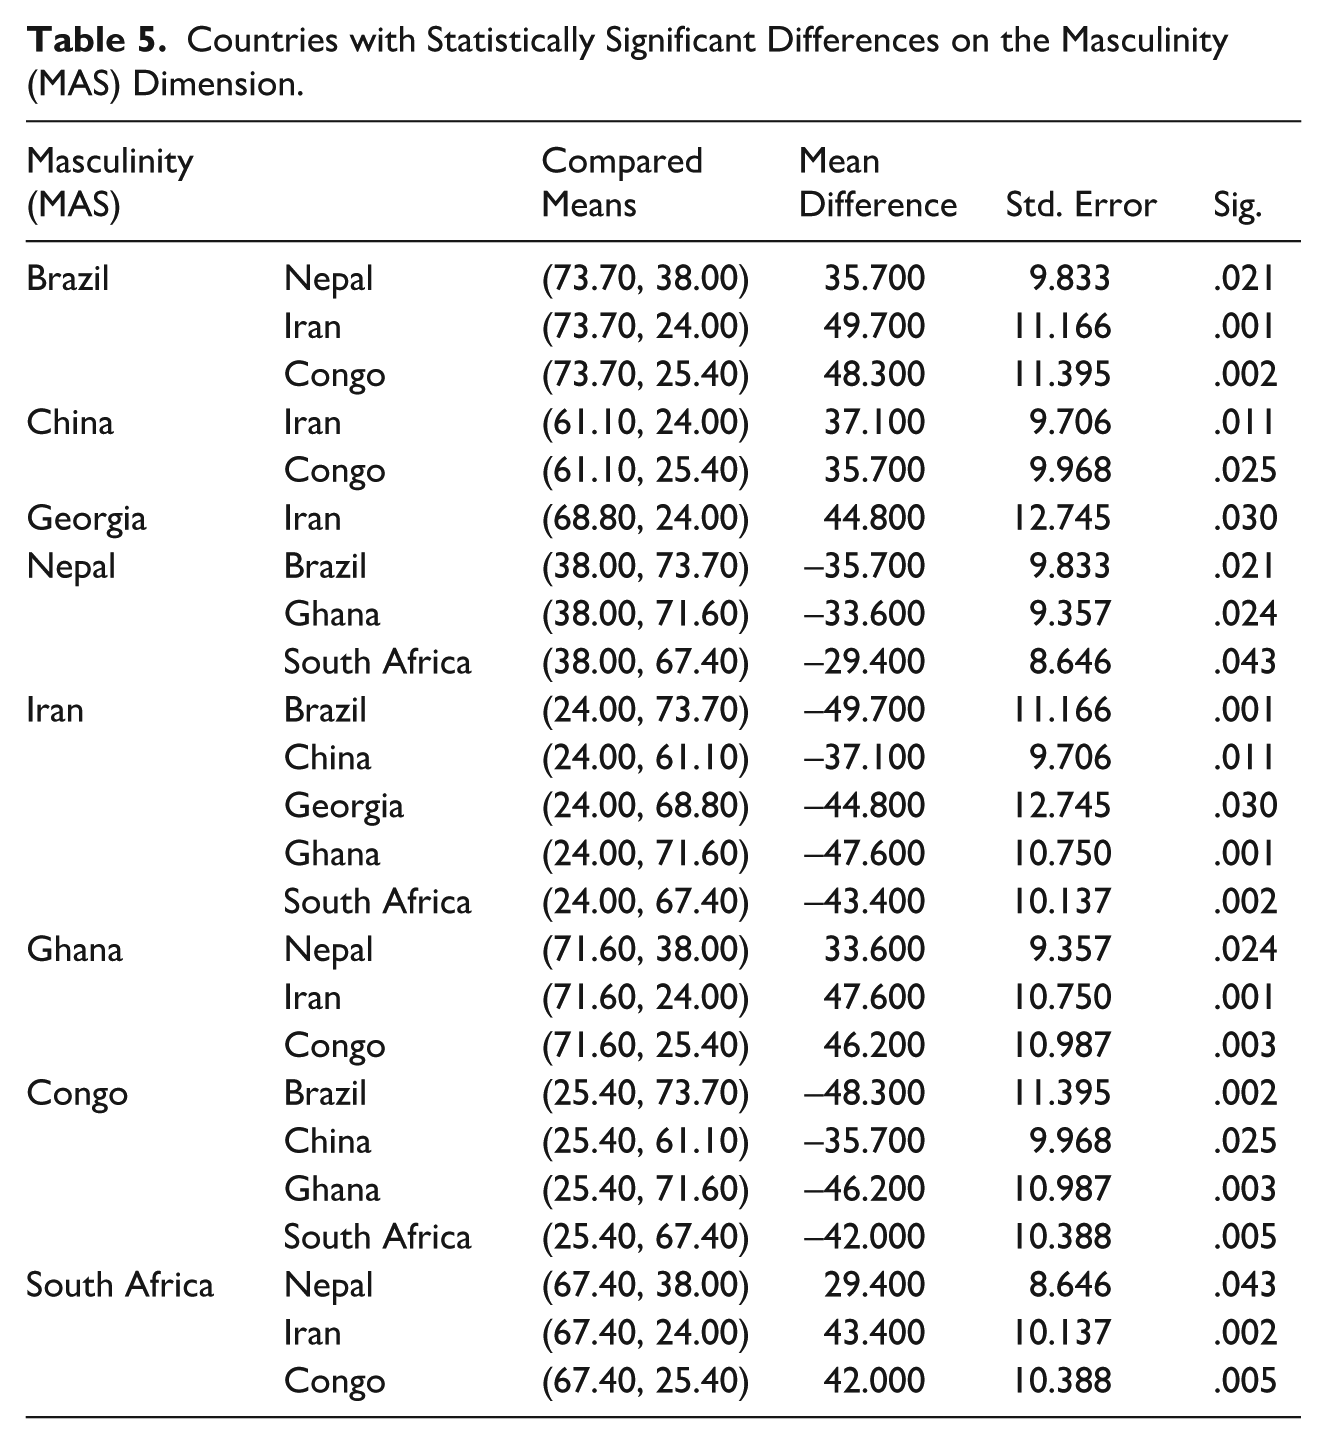
Countries with Statistically Significant Differences on the Masculinity (MAS) Dimension.
Masculinity Versus Femininity
Turning to differences between masculinity and femininity (MAS), ANOVA revealed statistically significant overall difference across eight of the 10 countries [F(9, 490) = 6.188, p = .000, η2 = .102]. The magnitude of the effect size between the respondents’ nationality and their mean score on the masculinity variable, as assessed by η2, was “medium,” with nationality accounting for 10.2 % of dependent variable variance. Table 5 shows all the countries that are statistically significantly different in the masculinity dimension (MAS). The U.S. and Peru are not shown in Table 5 because the post hoc test did not find that the two countries statistically differed from any other country. Table 5 also shows the results of the Tamhane’s T2 post hoc test statistics, including statistical significance. Nepal (M = 38.00), Iran (M = 24.00), and Congo (M = 25.40) scored low on the masculinity dimension and, as a group, differed significantly in their orientations. More specifically, Brazil (M = 73.70), China (M = 61.10), Georgia (M = 68.80 ), Ghana (M = 71.60), and South Africa (M = 67.40) all adopt masculine traits, significantly more than Nepal, Iran, and Congo adopt a more feminine approach to living. Peru (M = 54.80) and the U.S. (M = 48.50) each scored higher than Nepal, Iran, and Congo, but not enough to be statistically different.
Uncertainty Avoidance
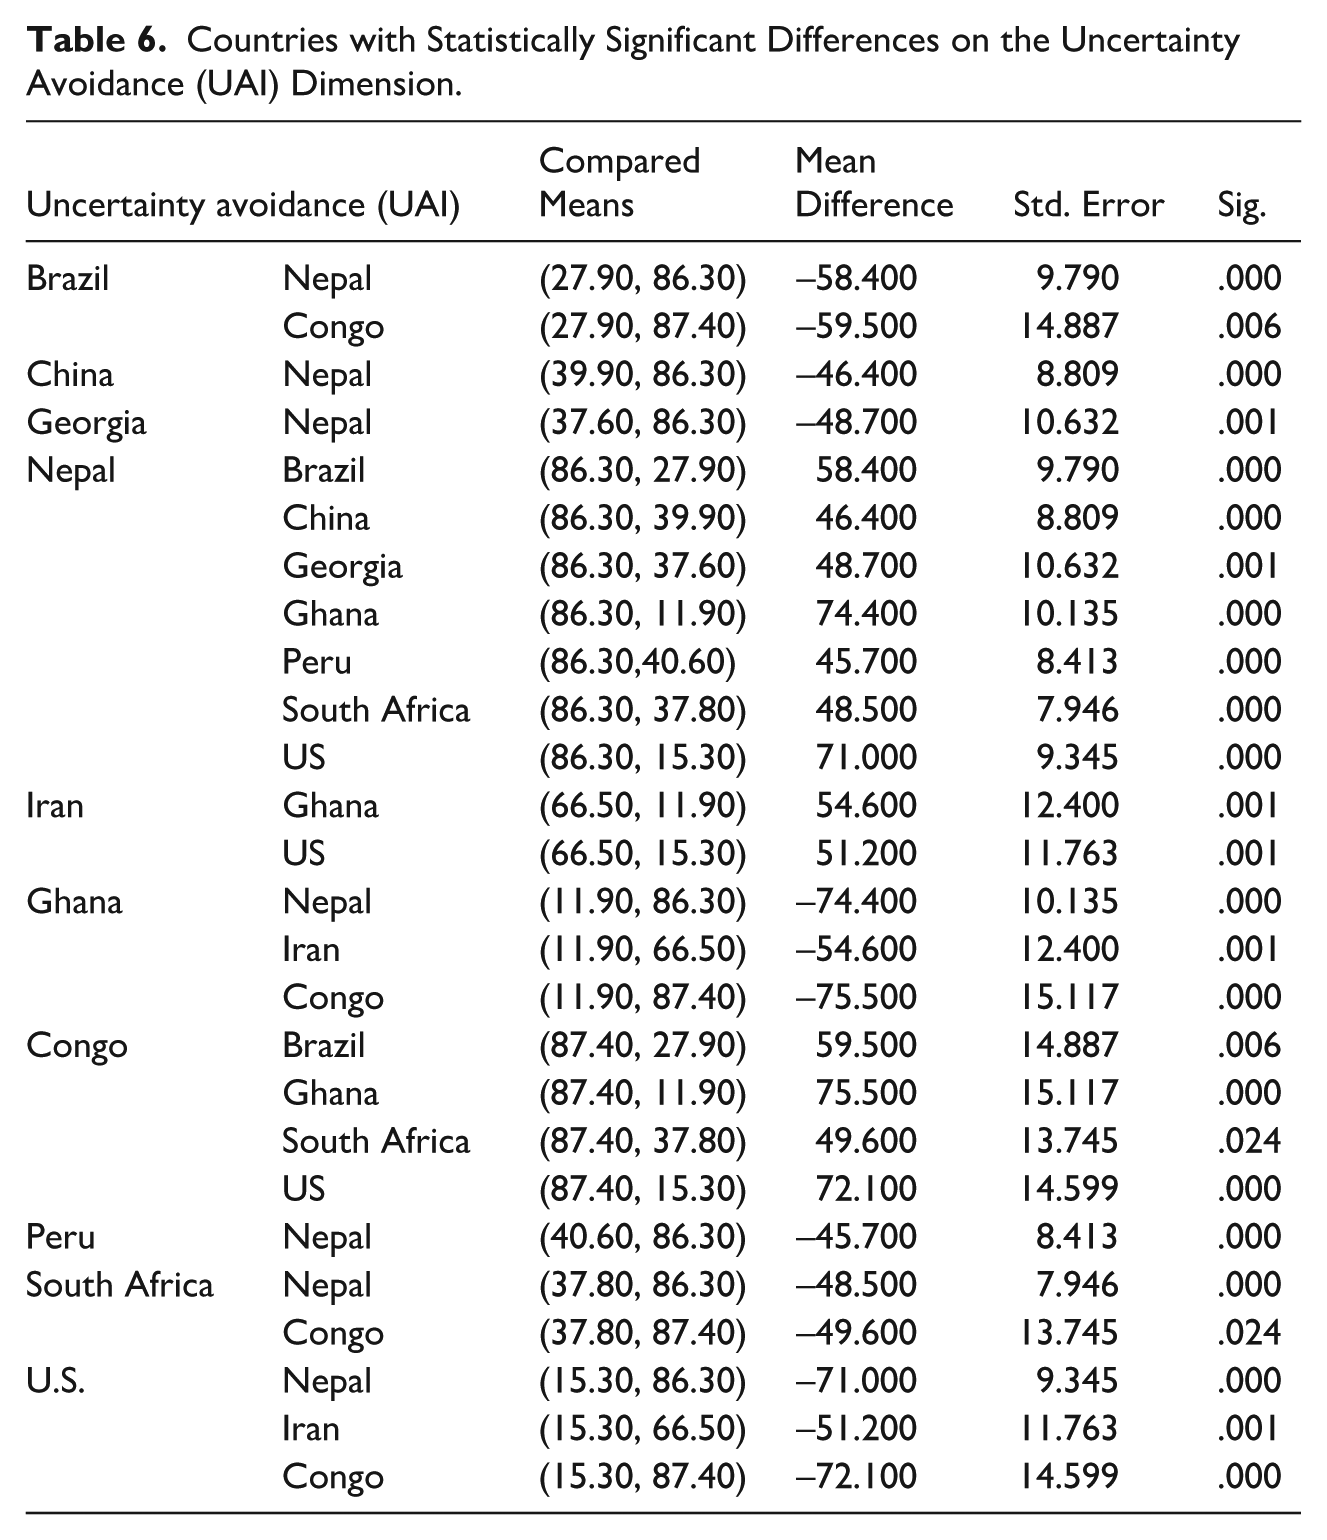
The results of the ANOVA testing uncertainty avoidance (UAI) suggest a significant overall difference across the 10 countries [F(9, 490) = 9.658, p = .000, η2 = .151]. The magnitude of the effect size between the respondents’ nationality and their mean scores on uncertainty avoidance, tapped by η2, was relatively large, with nationality accounting for 15.1 % of the variation in uncertainty avoidance. The Tamhane’s T2 (Table 6) suggest that Nepal (M = 86.30), Congo (M = 87.40), and to a lesser extent, Iran (M = 66.50) impose more formal rules on the conduct of behavior and prefer to control risk situations compared to Ghana (M = 11.90), the United States (M = 15.30). and Brazil (M = 27.90). Nepal’s UAI index is so high (M = 86.30) that Nepalese planners differ statistically from those in China (M = 39.90), Georgia (M = 37.60), Peru (M = 40.60), and South Africa (M = 37.80).
Countries with Statistically Significant Differences on the Uncertainty Avoidance (UAI) Dimension.
Long-Term Versus Short-Term Orientation (LTO)
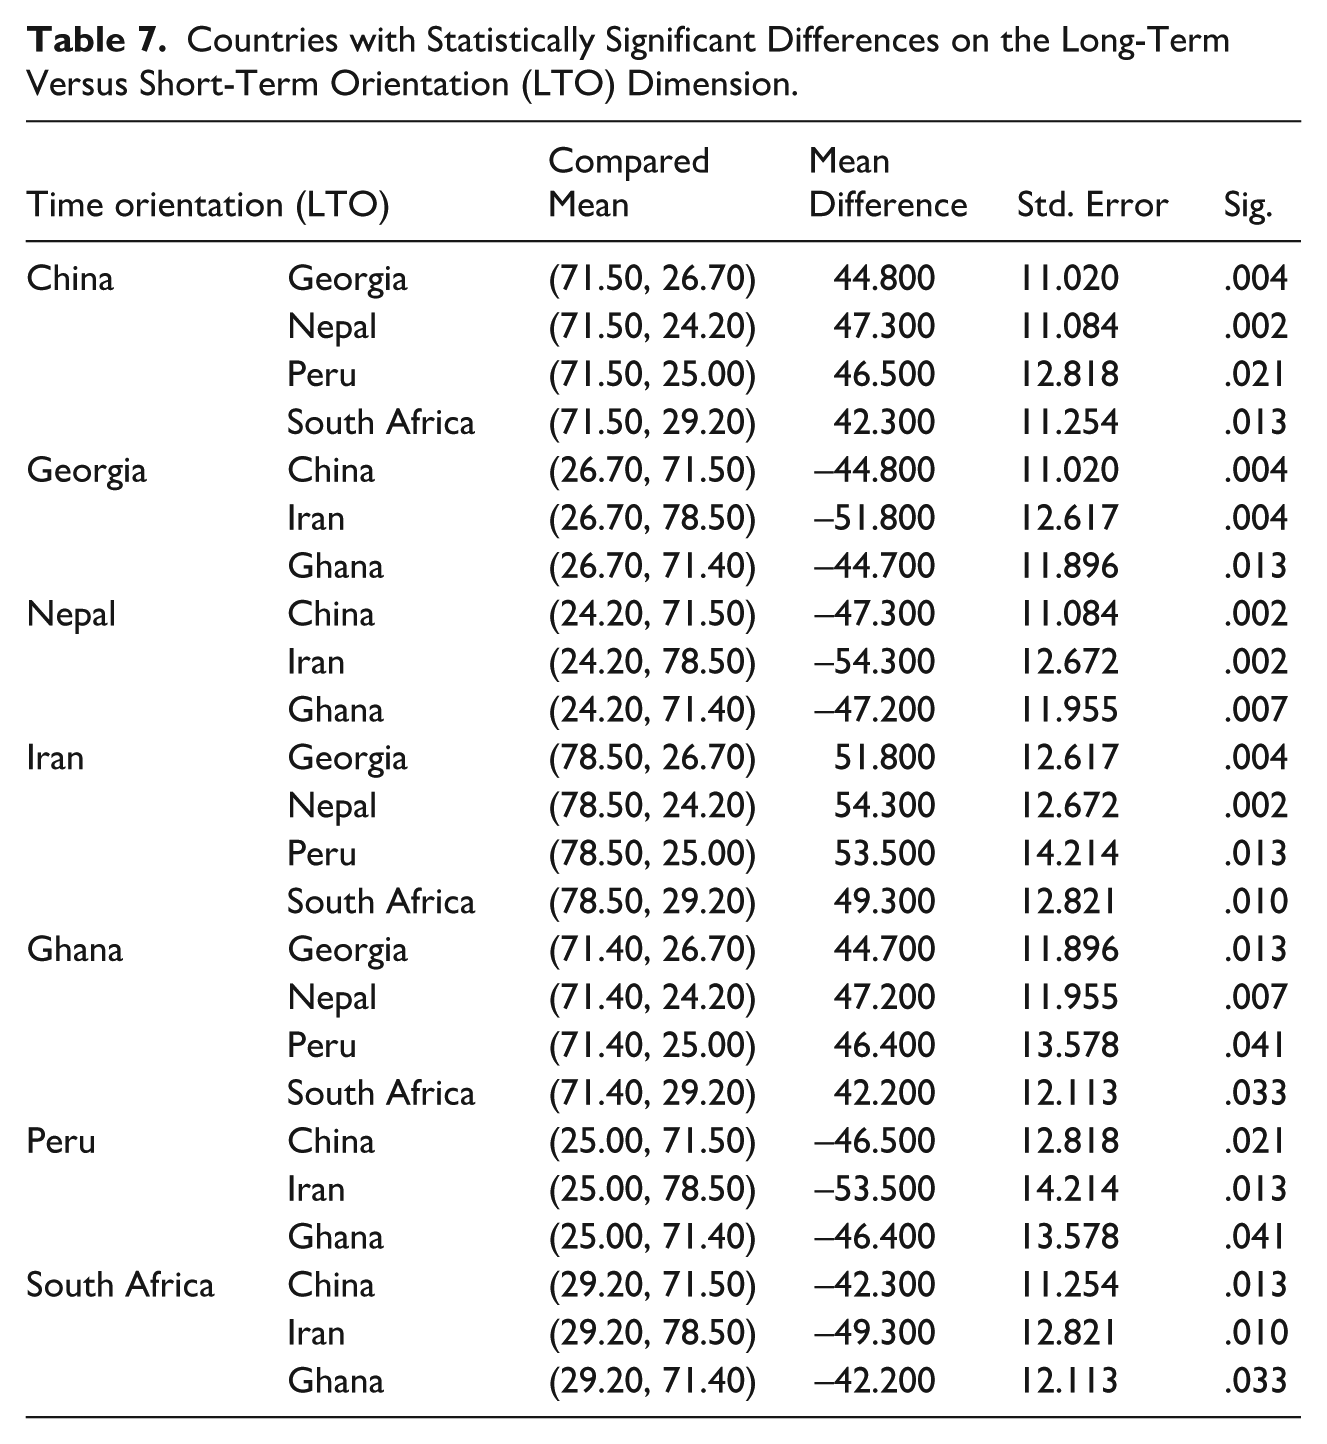
On the fourth dimension of interest, ANOVA tests of long-term versus short-term orientation (LTO) showed statistically significant overall difference across seven of the 10 countries [F(9, 490) = 5.829, p = .000, η2 = .097]. The magnitude of the effect between respondents’ nationality and their mean score on long-term versus short-term orientation, again was medium, with nationality accounting for 9.7 % of the variance in orientation. Brazil, Congo, and the U.S. do not appear in Table 8 because they did not have significant differences from other countries. The follow up Tamhane’s T2 in Table 7 suggests significant differences between short-term oriented planners in Georgia (M = 26.70), Nepal (M = 24.20), Peru (M = 25.00), and South Africa (M = 29.20) and planners who scored high on the LTO dimension in China (M = 71.50), Iran (M = 78.50), and Ghana (M = 71.40).
Countries with Statistically Significant Differences on the Long-Term Versus Short-Term Orientation (LTO) Dimension.
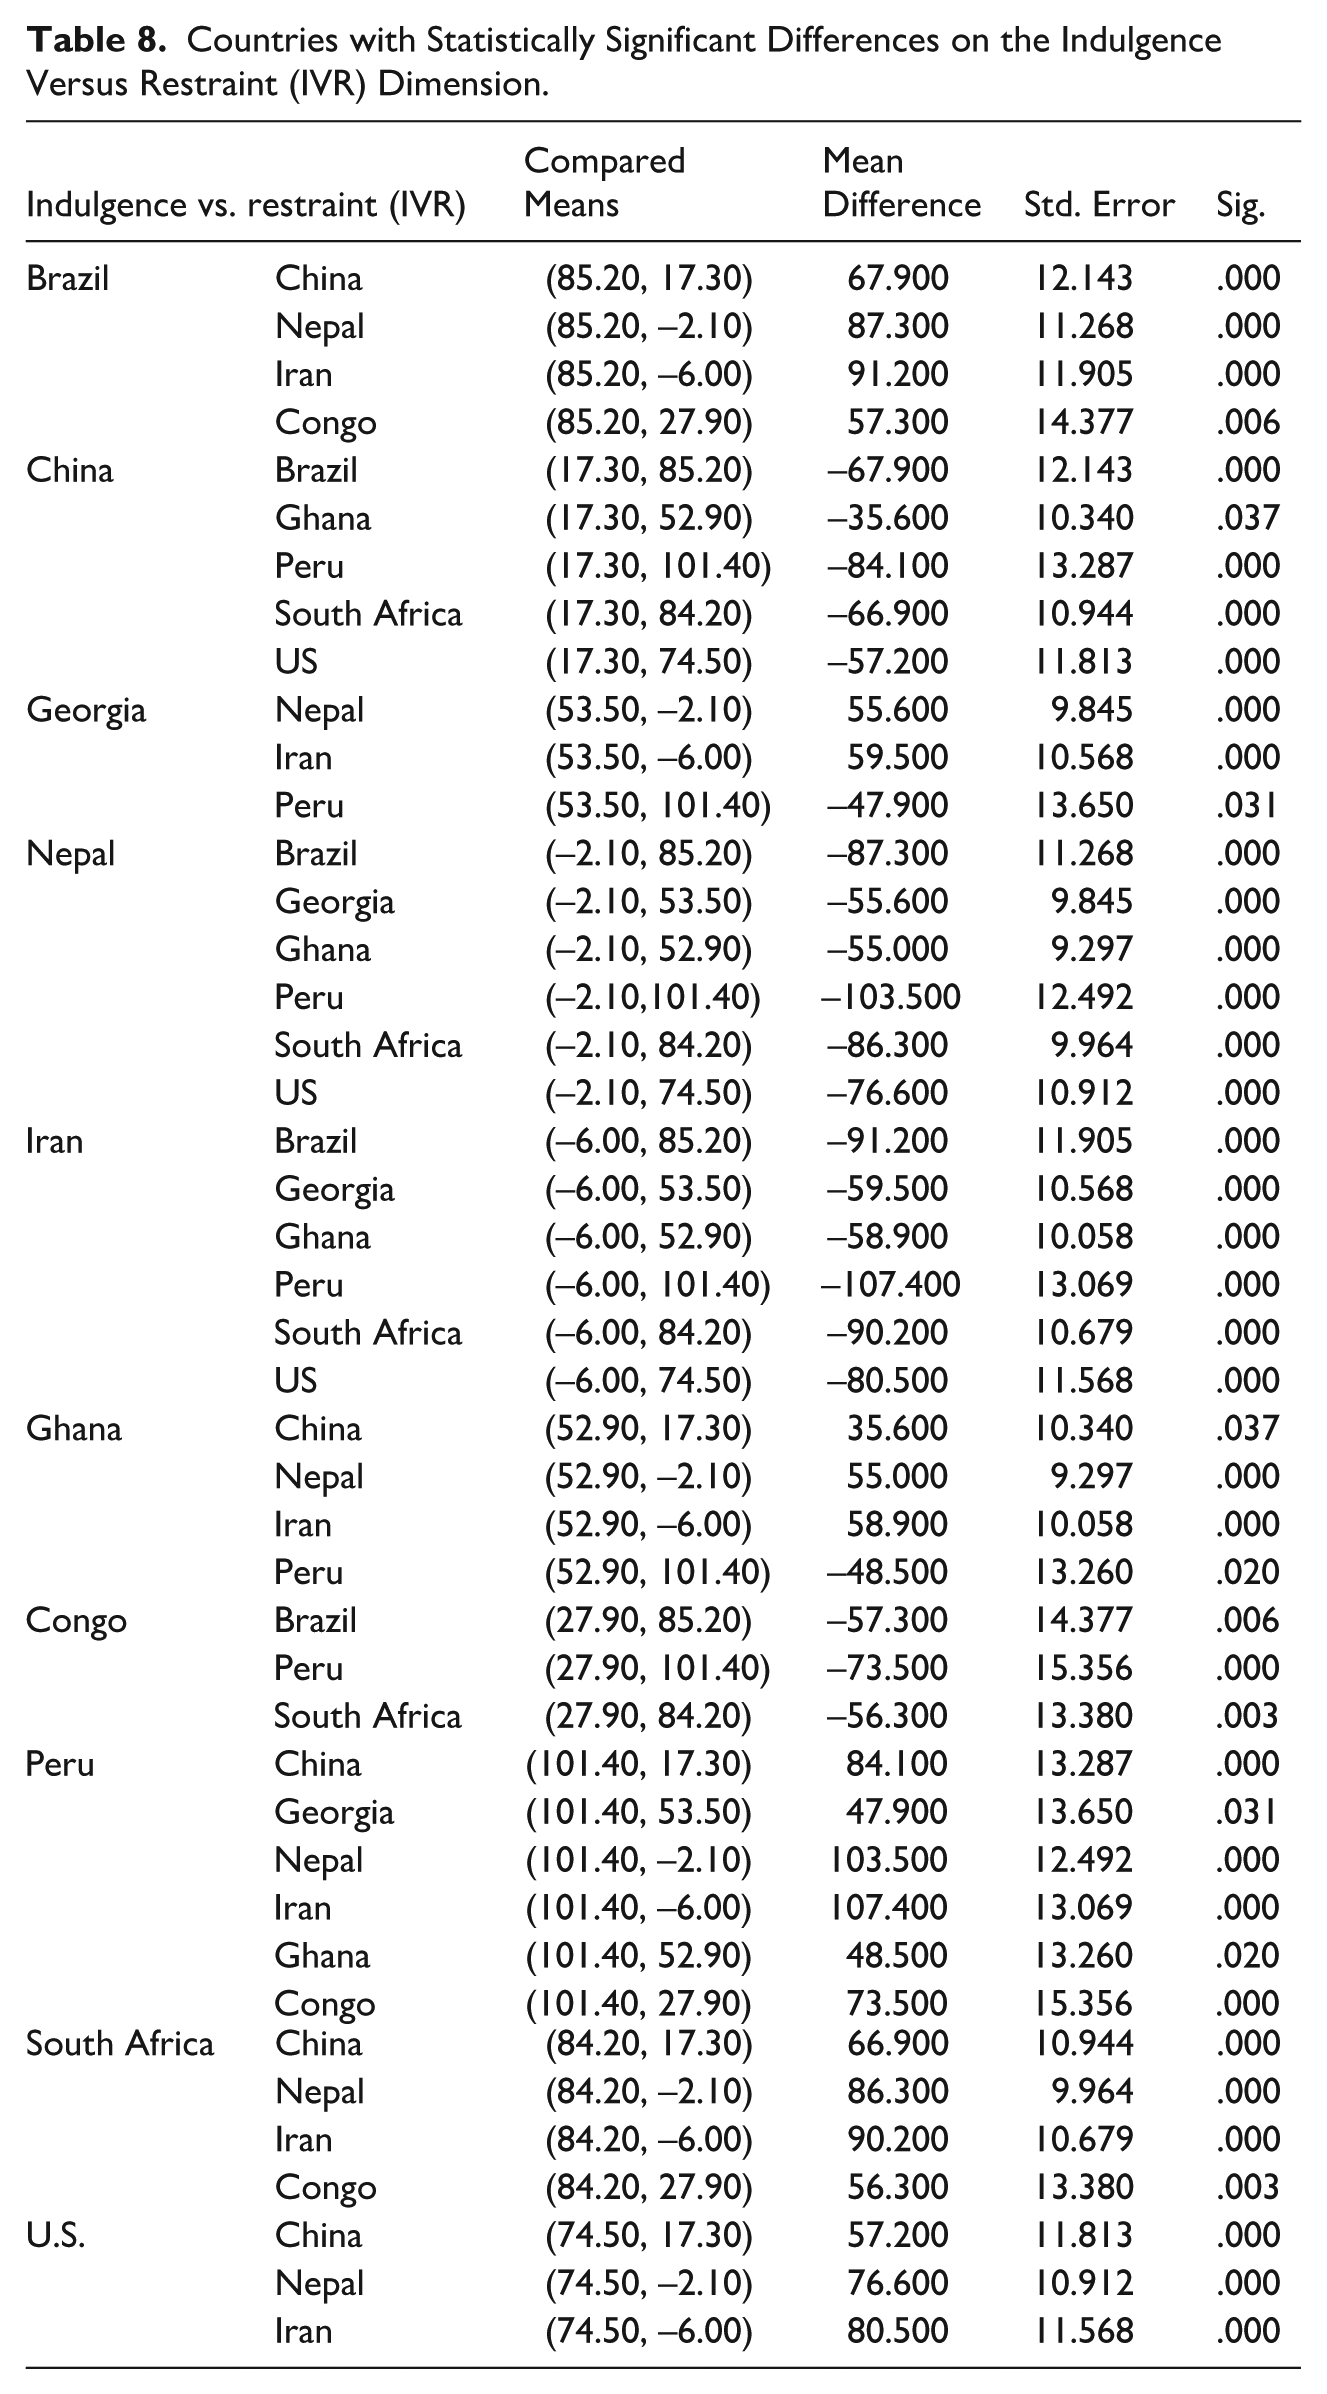
Countries with Statistically Significant Differences on the Indulgence Versus Restraint (IVR) Dimension.
Indulgence Versus Restraint (IVR)
On the indulgence versus restraint (IVR) dimension, the ANOVA results point to significant overall difference across all 10 countries [F(9, 490) = 19.806, p = .000, η2 = .267]. The magnitude of the effect size between the respondents’ nationality and their mean score on the indulgence variable (indicated by η2, was large, with nationality accounting for 26.7 % of the variation in indilgence versus restraint. The post hoc Tamhane’s T2 test in Table 8 reveals statistically significant differences in mean levels of the IVR variable between Brazil (M = 85.20), Peru (M = 101.40), South Africa (84.20), the U.S. (M = 74.50) – all restraint-oriented societies – and indulgence-oriented countries including China (M = 17.30), Nepal (M = −2.10), Iran (M = −6.00), and Congo (M = 27.90).
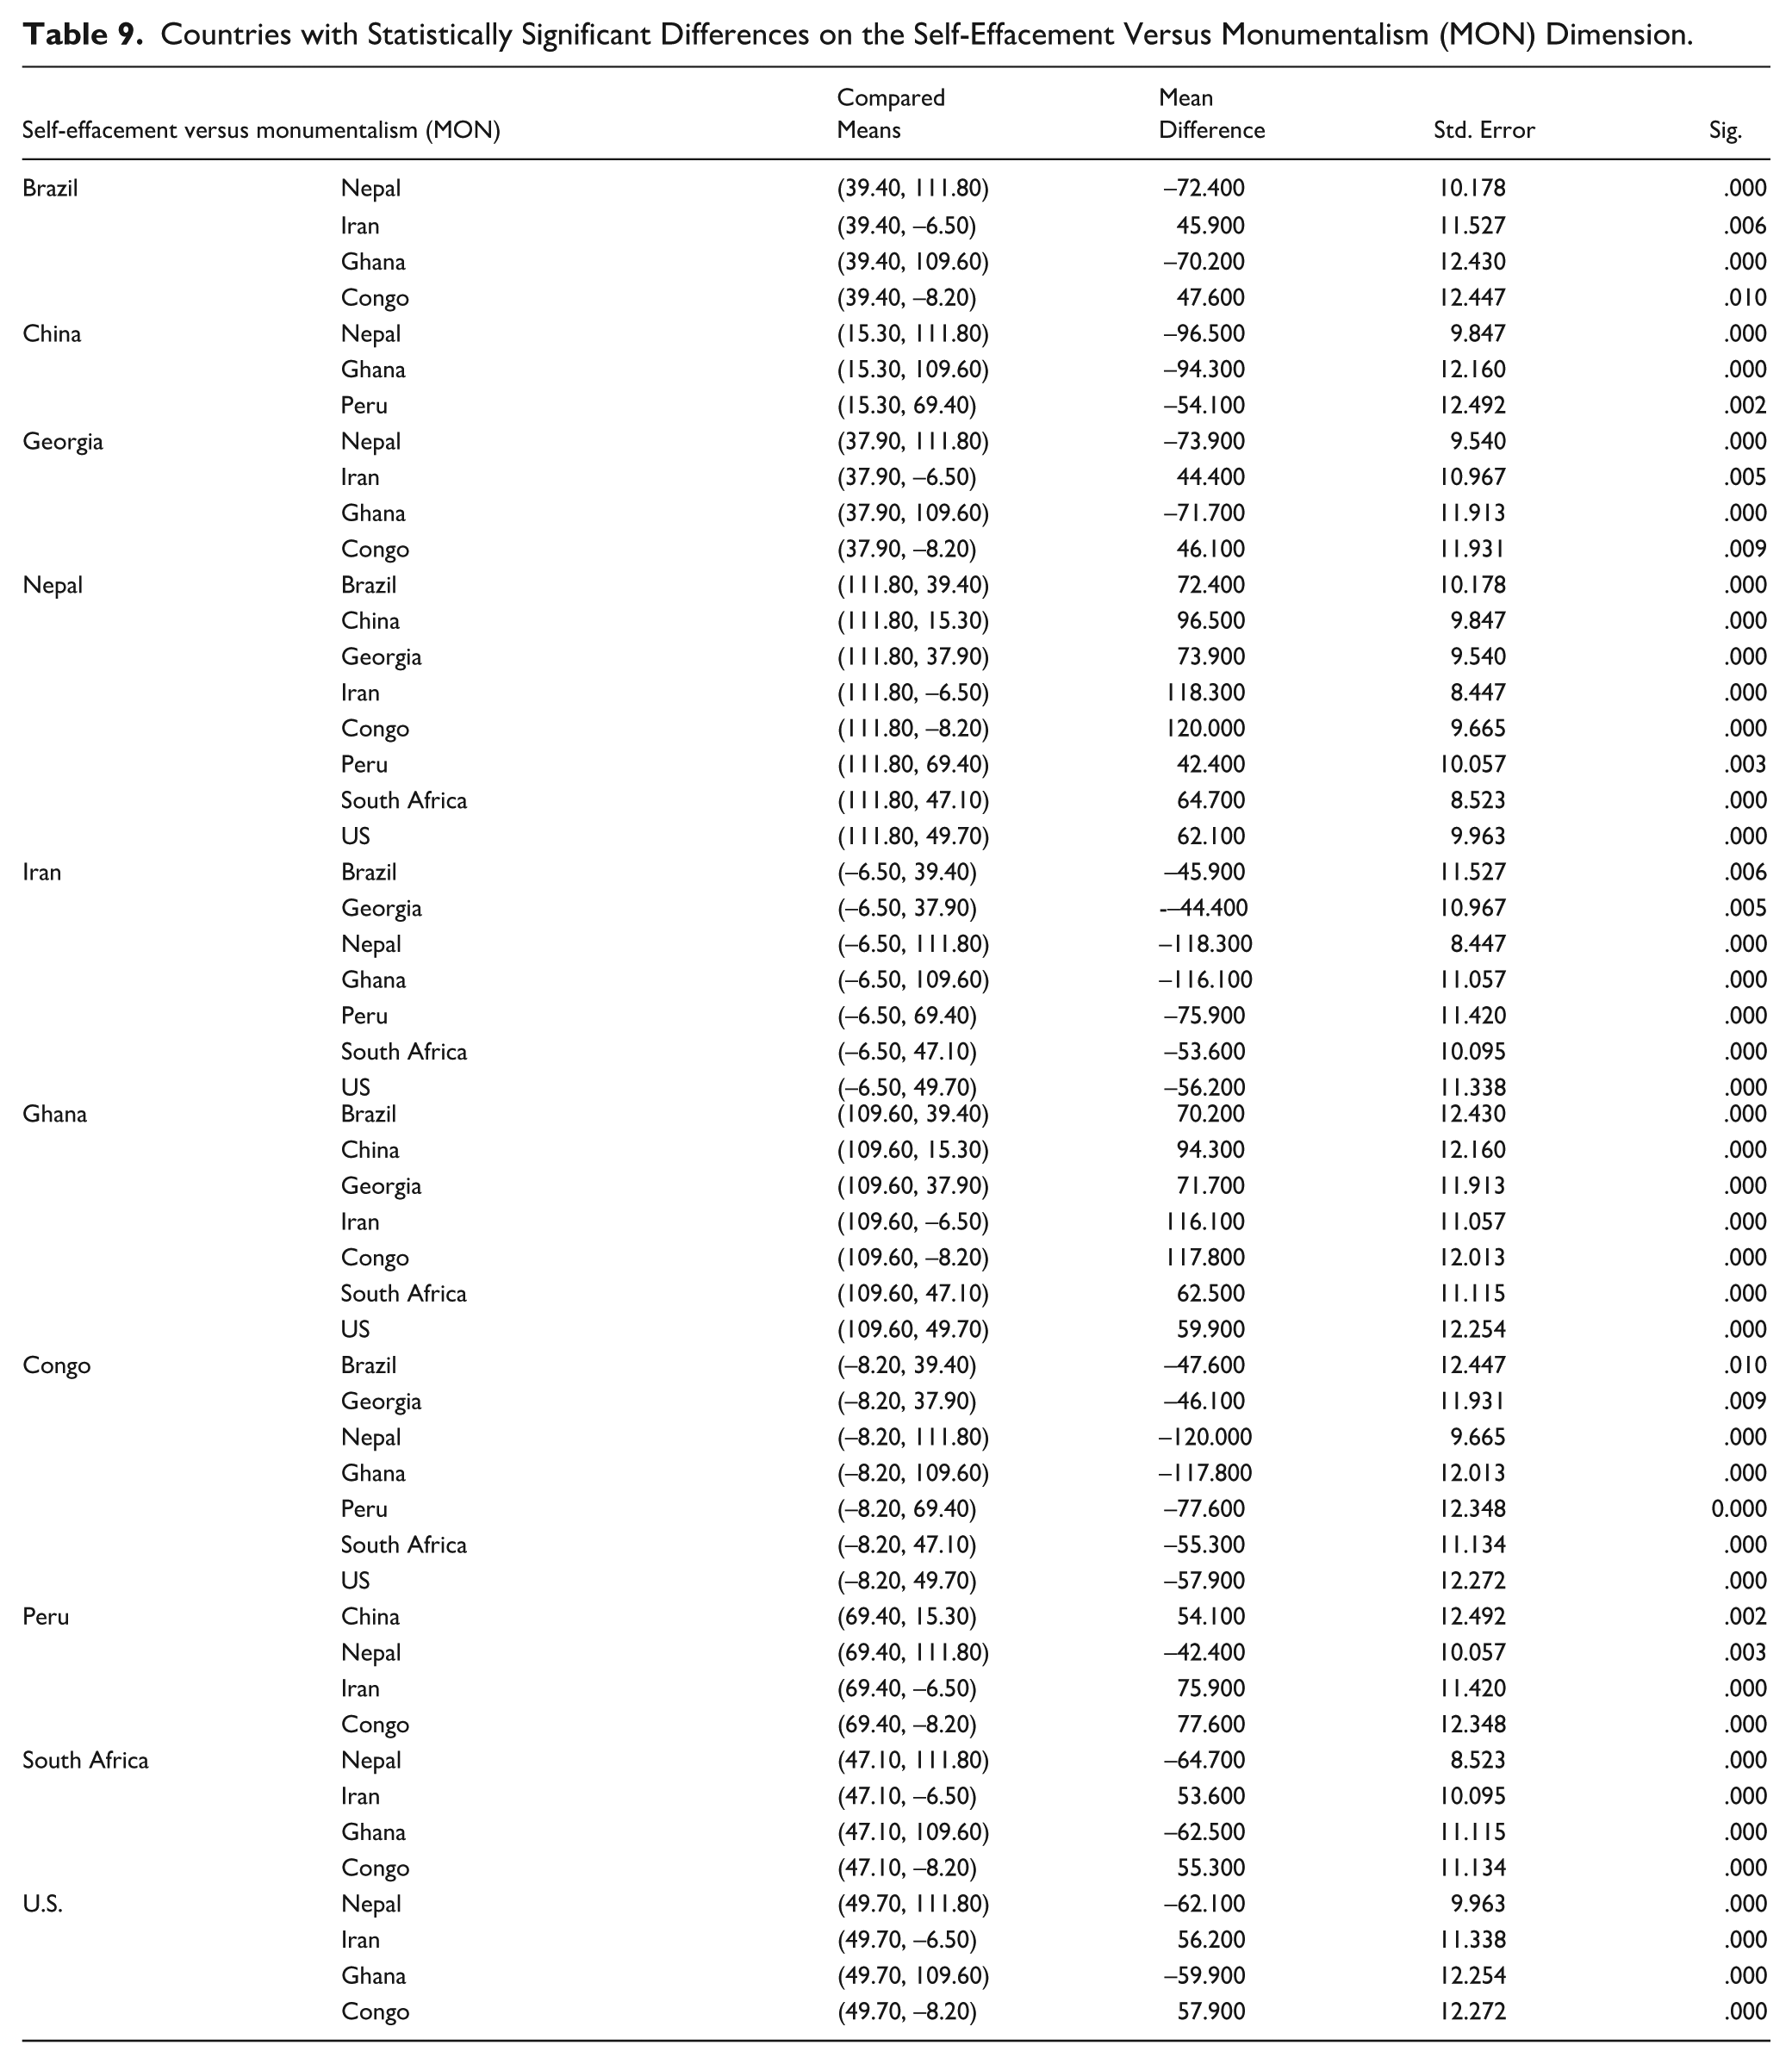
Self-Effacement Versus Monumentalism (MON)
Lastly, focusing on self-effacement versus monumentalism (MON), ANOVA results suggest that a significant overall difference exists across the 10 countries [F(9, 490) = 26.638, p = .000, η2 = .329]. Once more, the magnitude of the effect of respondents’ nationality and their mean scores on the self-effacement versus monumentalism variable was large. Nationality accounted for 32.9 % of the variance of the MON variable. The post hoc Tamhane’s T2 test ( Table 9) reveals a significant difference in mean levels of the MON variable between Nepal (M = 111.80), Ghana (M = 109.60), and Peru (M = 69.40), the three societies with the highest levels of self-effacement societies, and the most monumental countries (with the lowest scores on the MON variable) including Iran (M = −6.50), Congo (M = −8.20), and China (M = 15.30). Nepal scored so high on the MON variable that its planners differ statistically from planners from all other countries except for Ghana. As Table 9 shows, the MON variable means vary so much across countries that virtually every country is statistically distinct from the others.
Countries with Statistically Significant Differences on the Self-Effacement Versus Monumentalism (MON) Dimension.
Discussion
This article’s principal objective was to offer evidence that public officials from the 10 selected countries studied vary on Hofstede’s seven dimensions of culture. Urban planners are ideal subjects for cultural values analysis because their work requires resolving value-laden trade-offs in land use, zoning, sustainability, and social equity. Unlike general public servants or social workers, planners routinely translate cultural values into spatial and regulatory outcomes. We do not expect that all individuals from a particular country will reflect the cultural differences found in the sample. The country differences in the dimensions show collective characteristics. For example, a planning official from a highly masculine country could easily score lower on the masculinity index than planners from a highly feminine country. Rather, we contend that planners in these 10 countries have been impacted by their cultural backgrounds and those differences influence the planners’ decision-making. The study also supports the cultural divergence view, at least among planners.
As expected, the study found that planners from the 10 countries studied are significantly different on all seven dimensions of culture. The Tamhane's T2 post hoc tests confirmed and specified which countries statistically differed from other countries on each dimension. The analysis provides evidence that planners in different countries have different value orientations. Since planning entails making value-laden decisions, these findings suggest that assertions of a developing “common planning practice” are not supported by quantitative evidence. These distinctive orientations could lead to different cultural products, resulting in distinctive urban planning practices.
The post hoc Tamhane’s T2 test separated countries into two categories: inequality-accepting countries and those less accepting of power differences. For example, planners in Congo, Nepal, and to some extent Ghana report experiencing practically no power distance between individuals they interact with. In contrast, in Iran, South Africa, and China, the perception of inequality between a less powerful and more powerful individual is much more salient. This is especially the case for Iran, which had the highest value on the PDI index.
Low power distance planning cultures, which generally reject power inequalities, would likely promote citizen participation ideas for collective decision-making. Since low PDI collectivities typically see that “the way to change a social system is to redistribute power” (Hofstede, 2001, p. 98), one would expect officials from low PDI cultures to advocate for social equality and for those less powerful, even on controversial issues. Citizens and other stakeholders would be seen as equals despite perceived or actual differences in expertise, knowledge, or legal status. Low PDI cultures would also prefer decentralized decision structures where authority is less concentrated at the organization’s top. The organization is flatter, based on teamwork, and less hierarchical: hierarchy translates into inequality (Hofstede, 2001).There would be an expectation that superiors make every effort to consult them in the organization’s governance and relevant decision-making matters. They would promote ideas of accountability, transparency, and a generally egalitarian workplace and society.
On the individualism-collectivism dimension (IND), the post-hoc Tamhane’s T2 test indicated that planners from Nepal, Iran, and Ghana focus more on the goals and needs of communities or societies, compared to planners from Brazil, China, Georgia, Congo, Peru, and South Africa, all of which are relatively similar in their individualistic orientations. One would expect individualist planning cultures to prefer privatization and market-based planning and governance arrangements. High IND cultures believe in a self-interested, utility-maximizing existence and are inclined to actto differentiate themselves from the group. In this situation, it might be difficult for some planners or public officials to accept cultures where the nuclear family is not the norm. Extended family arrangements might carry the stigma of poverty, backwardness, and even the likelihood of illicit activities such as nonconformance with building codes and zoning regulations. High IND cultures may have a more challenging time accepting the teamwork concept, mainly because members believe their work contributions cannot be assessed accurately. On the positive side, high IND cultures are likely to promote more significant innovation and creativity (Goncalo & Staw, 2006). However, low IND cultures are more likely to cooperate with coworkers, develop trust, and develop shared goals, creating a more nurturing and effective work environment.
We expected significant differences between the U.S., a traditional masculine society, and Nepal and China. However, the U.S. and Peru were not significantly different from other countries. Somewhat unexpectedly, China scored high on the masculinity index, resulting in China being significantly more masculinity-oriented than Nepal, Iran, and Congo. Brazil, Georgia, Ghana, and South Africa, together with China, reported high masculinity scores and differed statisically from the more feminine Nepal, Iran, and Congo.
With those differences in mind, what could it mean for planners to be more “masculine” than “feminine”? Planners determine the specific land use pattern within a jurisdiction by employing zoning and other planning tools, which inherently exclude some users while favoring others. MAS-oriented planning cultures might be less likely to offer “feminine” land uses, such as publicly financed nursing rooms and other childcare amenities in largely male-dominated areas, such as sports facilities. Spaces, where mothers can nurse and change infants, remain a rarity; even in the developed world often only appear in upscale shopping malls and some workplaces. This example is just one of many ways that high MAS societies could emphasize “maximum emotional and social role differentiation between the genders” (Hofstede, 2001, p. 299). High MAS cultures would also emphasize any decisions and actions that would present a strong, dominating, assertive built environment through massive sports complexes, institutional buildings, statues, and monuments. In the workplace, equal opportunities for women and minorities are less likely to happen in high MAS cultures. Women would have more traditional and nurturing roles, while men would be more likely to make major decisions, specialize in technical careers, and lead. Planning or any public governance decision would be skewed toward a “maleness” arrangement of the workplace or society.
On the uncertainty avoidance dimension (UAI), we expected planners from the more economically developed countries in the study (U.S., Brazil, and China) to differ than planners in lesser developed countries. In fact, because of their high UAI score (86.30), it appears that Nepalese planners are guided by more formal rules than planners in the United States and Brazil. If so, for what might high uncertainty avoidance planning cultures advocate? This planning culture arguably would seek more central, bureaucratic, and rational planning focused on controlling strategic and micro levels of societal activities. The Weberian-like bureaucrat – especially a rule-driven technocrat – comes to mind when thinking about how uncertainty avoidance cultures might affect public officials’ decision-making. In general, public officials in high uncertainty avoidance cultures tend to be more conservative, abide by law and order, avoid risk, need more structure and clarity in rules, and feel powerless in influencing external forces (Hofstede, 2001). Given the mean scores we found for this set of national cultures, we predict that planners from Nepal, Congo, and Iran would be much more inclined to conservative, rule-based, and comprehensive planning and decision-making than officials in the U.S., Brazil, or China. This latter group would be more willing to innovate and change, adopt new technology, and be more tolerant of diversity, incremental changes, and smaller organizations.
Significant differences along the long-term orientation dimension also appeared. Planners from Georgia, Nepal, Peru, and South Africa appeared along the short-term oriented dimension, while China, Iran, and Ghana clustered into long-term societies. In practical terms, the low LTO scores for the short-term-oriented countries point to cultures with a strong focus on the bottom line, fast economic growth, and short-term solutions to governance and economic issues. These officials are likely to respond to urges for immediate gratification of needs (Hofstede, 2001). We speculate that long-term orientation might be a shared value for planners. After all, to engage in planning as a profession requires thinking over the long term. A country’s socio-economic development relies on an orientation of public sector institutions toward strategic planning and management. Thus, public officials must demonstrate competency in long-term strategic management in the decision-making process. A long-term orientation approach enables public officials to respond to challenges with aoppropriate combinations of policy, fiscal, and institutional solutions to maximize efficiency and effectiveness.
As we have noted, the indulgence-restraint dimension (IVR) addresses the importance of leisure in the pursuit of happiness. Post-hoc Tamhane's T2 tests indicated that planners from Iran, Nepal, China, Congo, and Ghana all lean towards indulgence-oriented societies. Planners in these four countries differed significantly from those in Brazil, Peru, South Africa, and the U.S., all more restraint-oriented societies. Given these orientations, one could fairly argue that planners in Nepal, China, Congo, and Ghana would be less inclined to advocate for restraining policies, and they likely would promote spaces for people to pursue recreational activities freely or socialize with friends and relatives. In contrast, according to the findings here, planners from Brazil, Peru, South Africa, and the U.S. would be more interested in creating spaces dedicated to work and would promote policies that seek to restrain behavior and reward thriftiness.
The monumentality versus self-effacement dimension tmeasures the extent to which society rewards pride versus humility. Nepal, Ghana, and Peru appeared significantly more self-effacing than the monumentality-concerned Iran, Congo, and China. In practical terms, planners in Iran, Congo, and China would be expected to promote monumental urban design solutions geared to celebrating their national identity and pride even at the detriment of social needs. On the other hand, Nepal, Ghana, and Peru would be less preoccupied with celebrating their national pride and would be more flexible in accepting and promoting policies and planning solutions focused on the needs of all segments of their society.
Our analysis lays a foundation for future inquiry into representative bureaucracy by suggesting that planners’ values may reflect broader national cultural orientations, raising questions about representativeness in public service.
Conclusions
This study used Hofstede's 2008 Values Survey Model (VSM 08), a 34-item questionnaire designed to compare culturally determined values across 10 countries and asked whether planners from different nations are affected differently by their respective national cultures. It sought to evaluate if and how these differences affect their performance as public officials.
As a whole, the findings have important practical implications as urban planners are at the forefront of solving issues concerning the equity, sustainability, and growth of community life. Planners decide on the sustainability of the environment, where people live, shop, receive medical attention, and get from place to place–decisions that are as much guided by law, government, politics, and other contextual factors as the distinctive planning culture of the jurisdiction. Given that, to be successful in the professional practice of urban planning, planners and other public officials must understand the critical role that cultural values play in the decision-making process.
Although this study covered a range of cultures, further research involving cultures in more countries would help provide a clearer view of the impact of culture on public management. Further research could also include the impact culture has on one’s planning practice. This research would prove useful in developing insight into how urban planners’ views of advocacy and social equity planning, market-based planning, citizen participation, and rational planning form and evolve based on their cultural backgrounds. Furthermore, this can encourage future public officials to consider the impact of their cultural backgrounds when making decisions for their communities.
One limitation of this study is the unequal representation of women in some countries. Despite Hofstede’s findings that respondent sex does not affect the dimensions’ scores, similar percentages of women across the various countries’ samples would be preferred to control for the potential effect of gender on the dependent variables (Hofstede, 1980, 2001). As Table 2 shows, women represented only 30% of the South African and 34% of the Ghanaian sample, but made up 68% of the Georgian sample. In most countries, though, the numbers and percentages of female and male respondents fell close to the mean (44%).
Despite its limitations, the study’s findings that planners from the 10 sampled countries vary on all seven dimensions of culture contribute to cross-cultural research. Evidence that planners have different value orientations across countries weakens the argument of an emerging “common planning culture.” These distinctive value orientations are expected to lead to diverse cultural products, resulting in varying urban planning practices and public decision-making. An additional contribution is the introduction of index scores on the seven dimensions for China, Congo, Georgia, Ghana, and Nepal. Furthermore, index scores on long-term orientations are newly available for nine of the study’s 10 countries. Finally, we increased the number of countries compared to 10 and used all seven dimensions of the VSM 2008 theoretical framework.
Footnotes
Funding
The authors received no financial support for the research, authorship, and/or publication of this article.
Declaration of Conflicting Interests
The authors declared no potential conflicts of interest with respect to the research, authorship, and/or publication of this article.
Data Availability Statement
Data sharing not applicable to this article as no datasets were generated or analyzed during the current study.