
Abstract
Black Lives Matter (BLM) has gained support across racial lines and considerable financial backing. Yet it is unclear whether social science has responded with research likely to save Black lives. To encourage more applied research and related public discussion, we rank police departments in the 50 largest U.S. cities by their effectiveness in keeping homicides low and not taking civilian lives, while adjusting for poverty, which makes policing more difficult. We find enormous variation in police performance and offer qualitative evidence that this reflects organizational practices. We conclude with ideas for reform.
We are working for a world where Black lives are no longer systematically targeted for demise. https://blacklivesmatter.com/about/
Introduction
Marrying de Tocquevillian decentralization, social media, legacy media, institutional support, and extensive financial backing, Black Lives Matter (BLM) is by any measure among the most successful social movements of the past half-century, having collected significant funds while gaining an organizational presence in dozens of states and multiple countries (Fisher, 2019). The movement has brought to light serious and sometimes deadly inequities. Here, we explore ways to use this attention to enable research and ultimately reforms likely to disproportionately save Black lives.
We begin by briefly outlining long recognized difficulties of using social science to guide social reform, paying special attention to the role of class. Crucially, we apply a Reinventing Government paradigm to policing, placing special emphasis on improved police performance in New York City. On the twin assumptions that sometimes good research is just counting, and that transparency and intercity competition can drive police reform, we then rank the 50 largest U.S. cities based on the degree to which their police departments protect Black (and other) lives. Though selected based on their size, these cities also have large Black populations and tend to be centers of Black Lives Matter activism. We conclude with tentative recommendations regarding future research which could enable successful police reforms. In rare cases, partly defunding police may be a viable reform option, but only after citizens and policymakers ask the right questions.
Social Science, Police, and Crime
As a social movement, Black Lives Matter receives considerable institutional support in higher education; but, in applied terms, will academic research do more to make Black lives matter? Social scientists themselves critique social science’s record ameliorating social problems. In part this reflects the incoherence of state power in liberal polities (Lowi, 1979) and even illiberal ones (Scott, 1998). Yet it also reflects certain characteristics of social science.
As Lindblom and Cohen (1979) show, social science is seldom conclusive and rarely authoritative, that is, widely accepted. These factors limit the impacts of social research intended to alter behavior of street-level bureaucrats like cops and teachers (Brehm & Gates, 1997; Lipsky, 1980; Moskos, 2008; Payne, 2008). Even the natural sciences suffer these challenges, though to a lesser degree (McAvoy, 1999). Relatedly, considerable evidence indicates that social science is most thorough in the range of questions asked, most accurate in its answers, and most legitimate when conducted by communities of social scientists with diverse values and experiences. When social scientists (and people generally) lack methodological and ideological diversity, they are more likely to avoid certain questions and reach premature conclusions, limiting their understanding of complex phenomena (Duarte et al., 2015; Lukianoff & Haidt, 2018; Tetlock, 2018). Indeed, the Brookings Institution’s Rauch (2021) sees ideological and factional diversity as key to successful processes and outcomes, both in knowledge systems and political systems.
Applying this insight to policing, perhaps due to the homogeneity of researchers, surprisingly few criminal justice intellectuals admit that policing matters, instead focusing on broader social forces. Both former New York Police Commissioner William Bratton (Bratton & Knobler, 1998, pp. 289–291) and academic Franklin Zimring (2011) respectively report that many professors insisted that the steep 1990s crime declines in New York City reflected increased incarceration, changed demographics, reduced drug use, gang truces, or even different weather patterns that somehow only affected New York. Many refused to attribute the dramatic decline in crime to better policing, even though easily available data undermined the alternative hypotheses. Zimring (2011) points out that New York’s incarceration rate declined in the 1990s and 2000s, and economic growth and demographic changes (fewer young people) theorized to reduce crime came after rather than before New York’s crime decline. Likewise, Bratton and Knobler (1998) report that drug use remained high, with the vast majority of those arrested failing drug tests. Drug Enforcement Agency evidence gathered from thousands of wiretapped conversations found no evidence of gang truces. Moreover, after 1994 the number of police did not increase; yet crime kept declining. Finally, the crime decline did not reflect national trends; rather, as Bratton and Knobler write, nearly two-thirds of the national reduction in reported serious crimes in the mid-1990s came from the roughly 3% of the U.S. population living in New York City. Yet those alternative explanations fit dominant intellectual narratives regarding crime, which tend to discount policing.
Policing and Homicide in the BLM Era
These general observations may be applied to budget and organizational innovations arising in the BLM era. The legally justified police killing of Michael Brown in Ferguson in 2014, and, to an even greater degree, Minneapolis police officer Derek Chauvin’s murder of George Floyd in 2020, captured on video, led to large protests, even riots. The political system responded. Many cities cut police budgets and reduced the number of officers. 1 In addition, for myriad reasons including at times the negative reputation of police, departments attracted fewer applicants for posts (Duret & Li, 2023). These changes resulted in fewer patrols, fewer stops of suspects, and perceptions that police had less control of the streets. Such “de-policing” in turn was associated with higher homicide rates, concentrated among young African Americans, a serious inequity (Reilly, 2019, 2021).
While providing slightly varying numbers, multiple data sources indicate an upward trajectory in homicides during the Black Lives Matter era—and a sharp rise in murders following Mr. Floyd’s 2020 killing. The FBI’s (2022) most recent national crime data reports reveal a spike from roughly 16,500 murders in 2019 to 22,000 in 2020 and 22,900 in 2021. The more detailed data available via the Expanded Homicide Data Tables of the FBI Uniform Crime Reporting (UCR) system cover the entire BLM period, 2 and include figures of 12,312 qualifying homicides for 2014, 13,852 for 2015, 15,368 for 2016, 15,311 for 2017 (with figures for these 2 years representing the “Ferguson Effect”), 14,594 for 2018, 14,548 for 2019, and then 17,815 for 2020. Disaster Center (2020) and Center for Disease Control (CDC) data show similar patterns.
Although no complete national analysis appears to have been conducted yet—a research niche to fill, these surges in homicide consistently follow at a city-by-city level decreasing rates of policing and specifically decreased police stops. Johnson (2021), the former Deputy Police Commissioner of Baltimore, points out that, in the second half of 2020 and 1st quarter of 2021, stops/arrests by the New York City Police Department (NYPD) declined by 38%, while homicides rose by 58%. In Chicago, arrests declined by 31,000 (53%), and murders rose 65% during the same time period. In Louisville (KY), vehicle stops fell by 35%, overall arrest rates dropped 42%, and homicides rose by a staggering 87%.
Criminologist Asher (2021) has compiled data documenting that homicide rates increased during 2020 in 51 of 57 large American cities. Almost all saw Black Lives Matter protest activity, and likely responded to it to at least some degree (Campbell, 2022). These increases in homicide disproportionately affected Black Americans. Previously cited FBI (2022) data indicate that the Black percentage of known murder offenders jumped from more than 50% in 2020 to a perhaps unprecedented 60.4% in 2021. Over 58% of all FBI-documented murder victims that same year were also Black.
This homicide increase is tragically ironic since, as Brookings Institution researchers Reeves and Holmes (2015) point out, if young Black males were a nation, they would roughly tie Honduras for the world’s highest recorded homicide rate. Concentrated among the young, gun deaths take about 11% of “all years of potential life lost” among Blacks (82% involving homicide), compared to 6% among whites (77% involving suicide). One social scientist estimates that BLM catallyzed budget and organizational changes were followed directly by the deaths of 218 more Blacks in Chicago alone, as many as 2,874 nationally given the general increase in homicides and assuming 50% of victims are Black (Reilly, 2021).
Police Killings of Civilians
Interestingly, the drastic increase in homicide rates and at-best-stable levels of many other major crimes during the post-2020 period were not coupled with reductions in police killings of civilians. Campbell (2022) argues that police killings of civilians declined 15% to 20%, all else held equal, in cities that saw large BLM protests. However, in a public-facing but empirical piece, Reilly et al. (2022) analyze the Washington Post newspaper’s comprehensive “The Counted” police shootings data-base and find little evidence of a decline. Simply put, if we are to focus on Black victims, 258 Black Americans were fatally shot by on-duty U.S. police officers in 2015 (the first year of the database), 236 in 2016, 222 in 2017, 228 in 2018, 251 in 2019, 243 in 2020, 233 in 2021, and 225 in 2022. Obviously, no differences between any of these numbers are statistically significant.
Whether there has been any decline in police shootings of unarmed individuals also seems debatable. The number of fatally shot suspects listed simply as “unarmed” has dropped during the past 2 years, but the number contained in the two complementary categories of “unarmed” and “undetermined,” combined, has been at least stable, with the “undetermined” figure increasing sharply. The figures here are: 2015 (94 unarmed/115 unarmed plus undetermined), 2016 (64/96), 2017 (70/95), 2018 (58/72), 2019 (54/75), 2020 (60/77), 2021 (32/125), and 2022 (27/148).
American police are also shooting more people in overall terms. Modern era but pre-2020 police killing of civilians almost never topped 1,000 per year, with the representative year of 2015 coming in at 995, but in 2021 (1,048) and 2022 (1,096) both did. The simple necessity of reactive policing in response to the recent surge in crime likely eclipsed any potential positive effect of a post-protest climate of caution.
The Hidden Role of Class
The large increase in homicides, disproportionately cutting short Black lives, in our view has received insufficient attention. Class inequities, which often trump racial inequities (Graham, 1999; W. J. Wilson, 1978), may help explain why. In 1990, New York City endured 2,245 homicides (Maranto & Wolf, 2013, 232). Yet, the murder that year of a single affluent white tourist—22-year-old Brian Watkins, who was stabbed in front of his family while in town to watch the U.S. Open tennis championship—had more impact on improving NYC law enforcement than any other murder, because of widespread awareness of its potential impact on the business climate. William Bratton, then-Chief of the city’s Transit Police, recalls getting an unexpected phone call shortly after the Watkins’ murder from one of Governor Mario Cuomo’s chief aides, who offered $40,000,000 to improve public safety: “The Governor understood the impact this killing could have on New York tourism. . .this was the turnaround I needed” (Bratton & Knobler, 1998, 172). Similarly, in Chicago, the 2021 shooting of University of Chicago graduate student Shaoxiong “Dennis” Zheng almost certainly drew more national and local publicity than did any 100 “regular” killings of poor or working-class Windy City residents that year (CBS, 2021). A Google search using the deliberately narrow topic “Shaoxing Zheng shooting” returned 12,800 results, and a ProQuest search 18 articles; most Chicago homicides are not even covered once.
What leads to national coverage of crimes? White et al. (2020)—who study Chicago—claim that non-Hispanic white victims of homicide receive more media coverage than Black or Hispanic victims. These authors, however, fail to adjust for socio-economic status (SES), and their primary independent variable, the area of the city in which each murder victim was killed, is a rather direct proxy for class as well as race. Generally, there seems little doubt that, as authors ranging from hooks (2000) to Keller (2005) have said often before, “class matters.”
Class divides among African Americans are increasingly reflected in differential exposure to violent crime. As W. J. Wilson (2015, pp. 2–3) writes: Segregation by income amplifies segregation by race, leaving low-income blacks clustered in neighborhoods that feature disadvantages along several dimensions, including exposure to violent crime. As a result, the divide within the black community has widened sharply. In 1978, poor blacks aged twelve and over were only marginally more likely than affluent blacks to be violent crime victims—around forty-five and thirty-eight per 1000 individuals respectively. However, by 2008, poor blacks were far more likely to be violent crime victims—about seventy-five per 1000—while affluent blacks were far less likely to be victims of violent crime—about twenty-three per 1,000. . .
In short, affluent Blacks were far safer in 2008 than 30 years before, while impoverished Blacks faced considerably more danger. We suspect this within-race inequity has grown in the years since. Rising class inequity almost certainly reduced pressures on law enforcement to provide safe streets for all, enabling policies which in practice (though not intent) endanger more low-income Blacks while having little effect on upper income Blacks and whites. We believe this development has received insufficient attention from social scientists and may be key to understanding widespread police reforms in the BLM era.
A Way Forward? Ranking Police Departments in the 50 Largest Cities
Policies that transfer resources away from policing are meant to ameliorate real problems. Using a large dataset, Williamson et al. (2018) find that BLM protests are more likely in locales where more Black people previously have been killed by police. Some BLM oriented reformers like Philadelphia District Attorney Larry Krasner argue that, over a few decades, gradually replacing many or most police services with investments in social services will make cities safer. Krasner won reelection despite a roughly 40% rise in homicide during his first term (PBS, 2021). Philadelphia’s mid-year homicides reached their highest level in 60 years in 2020; 94% of the victims were nonwhite (Sullivan, 2021). In some other cities the 2021 municipal elections suggested local political reactions against de-policing policies, which many voters saw as increasing crime. For example, in 2021, largely in reaction to rising crime, New York elected as mayor African American former police captain Eric Adams (Sullivan, 2021).
In short, the political system responds to real problems of both police brutality and crime, albeit not always in effective or equitable fashion. How can social science facilitate more effective and equitable policing in which, regardless of race, citizens can expect to be protected by police in roughly equal fashion, with respect? As academics (Moskos, 2008; Zimring, 2011, 2017), prosecutors (Butler, 2017; Kennedy, 1998), and even some police leaders (Bratton & Knobler, 2021) detail, this will require substantial reforms of police organizations.
Which Police Departments Save Lives?
Updating and extending prior work (Wolf, 1995), we propose that, particularly in high poverty communities, police are street-level bureaucrats with difficult jobs (Brehm & Gates, 1997; Lipsky, 1980; J. Q. Wilson, 1968). Some defenders argue that police already perform very well, needing little or no reform but greater numbers (e.g., Mac Donald, 2016). We take a very different approach, more akin to scholars from the Reinventing Government movement like Barzelay and Armajani (1992), Behn (2014) and Maranto & Wolf, 2013; police practitioners like Bratton (Bratton & Kobler, 1998, 2021), Maple (2000), Timoney (2010), and Campisi (2019); and even organization theorists dating back to half-century old work on public bureaucracies (Downs, 1967) and private oligopolies, who note the X-efficiency of human capital in organizations, referring to the degree of sustained effort to achieve organizational missions (Leibenstein, 1966). Policing is indeed a difficult profession. Yet, like any profession, some individuals and whole organizations perform their tasks better than others. Statistics should never be used without careful thought; yet some inputs and outcomes can be measured in ways that allow us to distinguish more from less successful practices, people, and organizations. Indeed, this approach is central to U.S. federalism, in which voters routinely compare their own mayors, county executives, and governors to others. This holds lessons for policing: by copying more successful officers, precincts, and whole departments, policing generally can improve over time (Behn, 2014). If we really want to make Black lives matter, then we must compare different police departments to bring attention to more successful departments and their practices. We also must bring attention to less successful departments and to their policies and procedures that need reform.
Numbers can mislead. High poverty communities tend to have more crime; thus, ratings of police units and whole departments should adjust for community poverty. Further, even though citizens often care more about “quality of life” misdemeanors like public urination, vandalism, and prostitution (Bratton & Knobler, 2021; J. Q. Wilson, 1968), when judging police precincts and departments outsiders should focus more on homicide rates, for three reasons. First, more serious crimes like homicide correlate with less serious crimes (Latzer, 2017). Second, violent crimes like homicide are far more serious than property crimes, since ultimately restitution can never be adequate. Third, and more pragmatically, we can measure homicide rates with accuracy, because police cannot easily ignore or hide a dead body (Bratton, 2010).
Here we extend and update the Police Performance Index (PPI) ranking city governments (Bearfield, Maranto & Wolf, 2020). Although our original PPI ranked 21 cities using 2015 data, here we rank the 50 largest cities based on population using 2020 data. We analyze large cities for five key reasons. First, their very size makes them central to policymaking. These 50 cities account for roughly 16% of the U.S. population and an even larger share of homicides. This in turn means these cities get a disproportionate share of the national policy and scholarly attention: both academic and lay readers will have familiarity with them. Second, for a range of reasons including the capacity of their police bureaucracies, these cities are relatively more likely to be criminal justice innovators (Teodoro, 2011). Third, data for large cities are more available, particularly data on police killings of civilians. Fourth, since such events thankfully are rare, the annual statistics for small cities would be unstable even when averaged across a five-year period. Fifth, the largest cities in the U.S. tend to have sizable Black populations, averaging 22% of their total population, more than 50% higher than the Black population rate nationally, making them especially informative regarding policing to make Black Lives Matter. (For the operationalization of the variables used in our updated version, see Appendix I).
The PPI is an intuitive and justifiable assessment of police performance, combining the homicide rate and the rate of Police Related Deaths of Civilians (PRDC), most clearly expressed as:

The Index is generated by first multiplying each city’s annual (2019) homicide rate per 100,000 by its Police Related Deaths of Civilians (PRDC) rate per 100,000 over a 5-year period to produce a composite of the two rates. That initial step operationalizes the two overriding goals of urban policing: Limiting murders while avoiding the inappropriate use of force. Multiplying the homicide and PRDC rates by each other, as we do in our formula, avoids rewarding police departments for bringing down murder rates by killing a lot of civilians or avoiding killing civilians via wholesale de-policing so that murder rates increase.
To account for poverty, a major environmental factor in cities that makes policing more difficult, that product is divided by the annual poverty rate. We operationalize the poverty variable as the percentage of households with annual income below the federal poverty line as determined by the U.S. Census. Using poverty rate as the denominator in the algorithm means that cities with relatively high poverty rates will have higher than average performance scores on the index even if their homicide and civilian shooting rates are average. 3
Extremely high numbers for the murder or PRDC rates and extremely low numbers for the poverty rate have the potential to skew the results. Thus, we take the natural log of the result to pull in the upper tail of the performance score distribution without altering the order of the scores across the cities. The product is then subtracted from 10 to ensure that higher-performing cities, which will have smaller products from the initial calculations, receive higher numeric scores. The resulting Police Performance Index (PPI) can be thought of as ranging from 0 to 10, with 10 representing a hypothetical (but implausible) city with a composite homicide-shooting rate of less than 1% of the mean rate despite a poverty rate of 100%. We should note the relative stability of the measure, with the 2015 and the 2020 PPI correlating at .79 for the 21 cities ranked for each year.
Findings
We offer these rankings to bring attention to police performance, ideally leading to serious discussions of the cities that do and do not protect Black (and indeed other) lives. Not surprisingly, city poverty correlates relatively highly with homicide rate (.55), but only slightly (.10) with police related civilian deaths (Table 1).
The 50 Largest U.S. Cities Ranked by Police Performance Index Score.
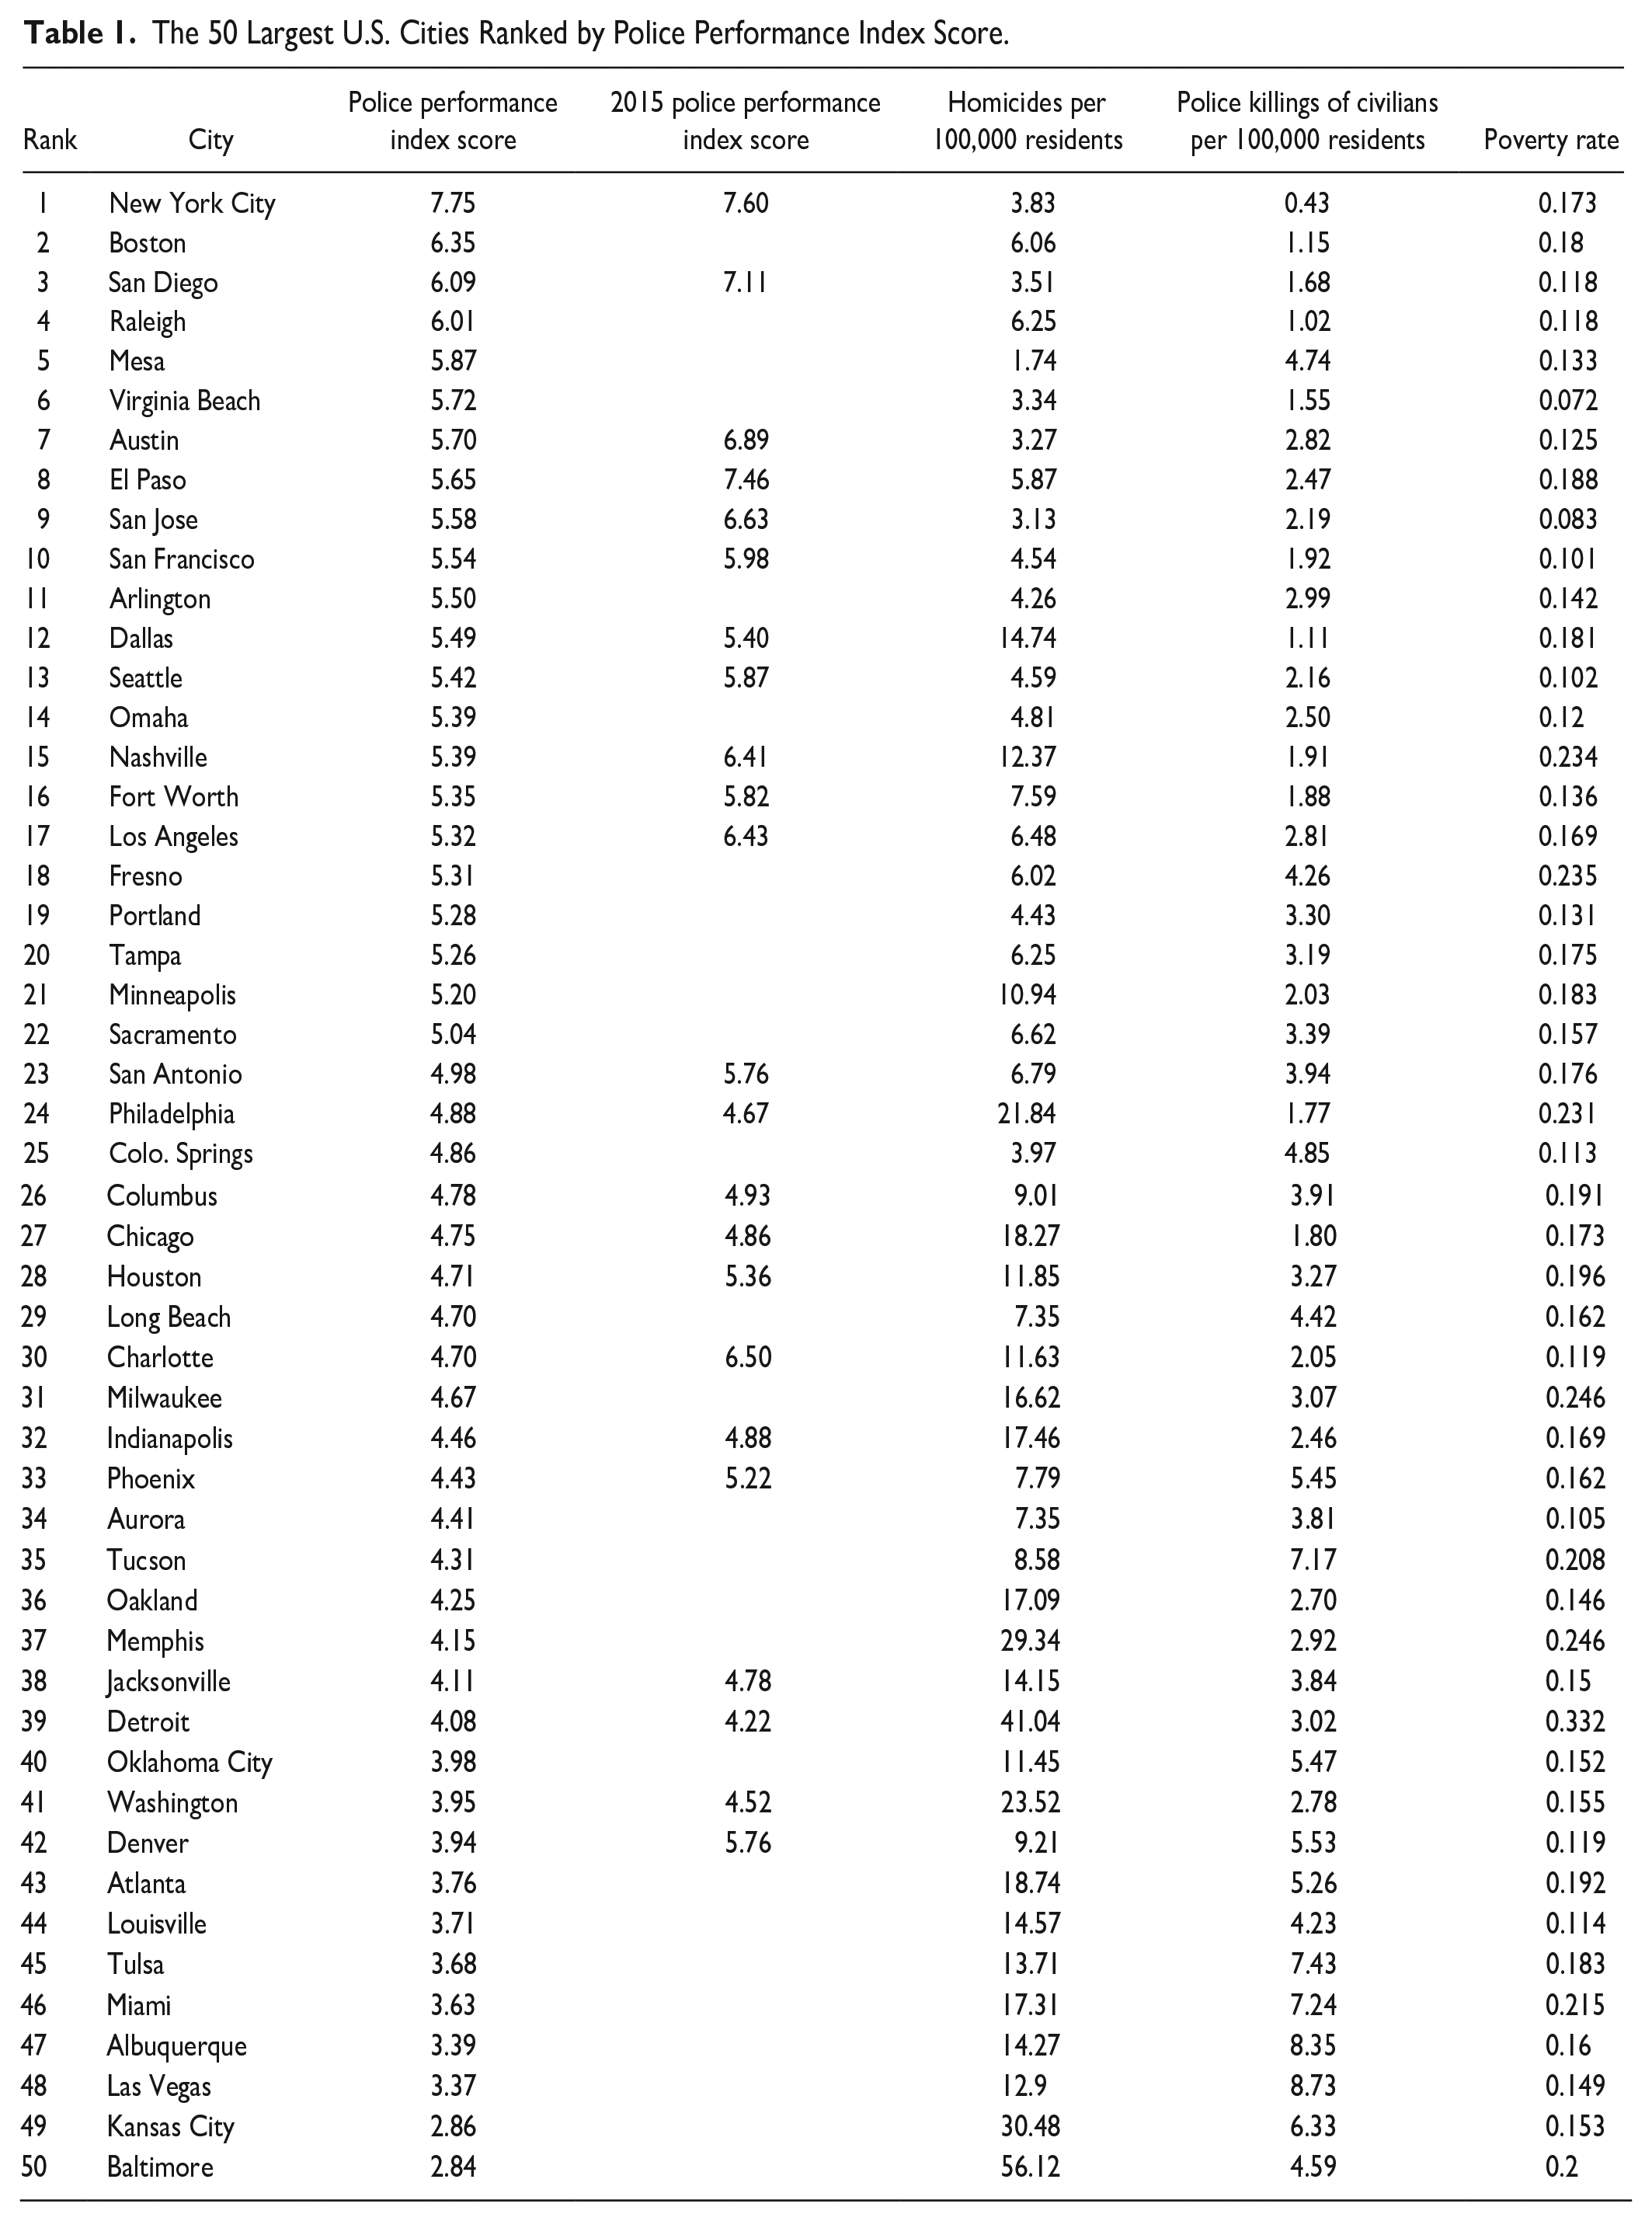
We note three key findings. First, even adjusting for poverty, U.S. police departments vary widely in their levels of effectiveness. Despite a somewhat higher poverty rate (17.3%, compared to a mean 16.4% for cities generally), New York has the sixth lowest homicide rate among the 50 cities, 3.83 per 100,000 residents. Only Mesa (1.74), San Jose (3.13), Austin (3.27), Virginia Beach (3.34), and San Diego (3.51) have lower homicide rates, and each has lower poverty rates than New York City. New York has by far the lowest rate of police killings of civilians (.43 per 100,000 population over a 5-year period), less than half the rates of the other three most restrained departments, Raleigh (1.02), Boston (1.15), and Dallas (1.11).
Second, homicide rate and the rate of police killings of civilians are positively (though weakly) correlated (.18). Departments that are better than average at preventing murders also tend to be better than average at avoiding killing civilians: Police use of lethal force is not associated with less crime.
Third, there are no obvious relationships between region and PPI, save for California and Texas cities doing better than average. Here, based on anecdotal evidence, we speculate that since both Texas and California have several large cities, their reporters, citizens, and elected officials might compare the relative performance of cities inside the mega states, pressuring police to improve relative to in-state rivals, in a process of competitive federalism (Peterson, 1981). After all, when wooing businesses, (8th ranked) El Paso officials are more likely to compare their police to those in (12th ranked) Dallas than to (13th ranked) Seattle. Future research should explore such possible competitive effects within states.
New York City does far better than any other city, with Boston second. None of the other 15 leading PPI cities, however, is from the Northeast. Four are Texan (Austin, El Paso, Arlington, and Dallas, with Fort Worth just missing at #16); three are from California (San Diego, San Francisco, San Jose, with Los Angeles and Fresno just missing the top 15); and three are southern (Raleigh, Virginia Beach, Nashville). Mesa, Seattle, and Omaha also appear. Virginia Beach, San Jose, San Francisco, Seattle, Austin, and Omaha all have notably low poverty rates (12.5% or less); only #15 Nashville, among the top-rated cities, has high poverty (23.4%).
Poor police performance seems even less linked to region than excellence is. Baltimore and Kansas City fall at the bottom in the PPI rankings. Baltimore has the nation’s worst murder rate by far: 56.12 homicides per 100,000 population per year, 37% higher than Detroit (41.04) and nearly twice as high as Kansas City (30.48) and Memphis (29.34). Among this bottom-dwelling group, even Memphis (29.34) has a homicide rate more than seven times that of safe cities like New York (3.83). Given that homicides are concentrated among young Black males, in Memphis, Kansas City, Detroit, and especially Baltimore, Black lives do not matter to the extent they should. Yet these cities seem to receive far less negative attention than Chicago (18.27), which has only a third of Baltimore’s homicide rate, likely due to Chicago’s larger size and national profile.
Regarding police killings of civilians per 100,000 over a 5-year period, Las Vegas is worst at 8.73, followed by Albuquerque (8.35), Tulsa (7.43), Miami (7.24), and Tucson (7.17). Of these relative hot-beds for police shootings, only Miami has a notably higher-than-average homicide rate, nearly half a standard deviation above the mean of 12.06. Clearly, police professionalism matters. Las Vegas and Albuquerque police kill civilians at a rate more than eight times higher than their counterparts in Raleigh, and more than 19 times higher than NYPD.
Of the 15 worst ranked PPI cities, nine are in the south or near south (Baltimore, Miami, Tulsa, Louisville, Atlanta, Washington, Oklahoma City, Jacksonville, and Memphis); four are in the West (Las Vegas, Albuquerque, Denver, and Oakland); and just two are midwestern (Kansas City and Detroit). Detroit has the highest poverty rate among the major cities ranked, 33.2%, with Memphis, Miami, and Baltimore all over 20%.
PPI does not always relate neatly to perceptions. Seattle and Portland are traditionally safe cities that remain fairly safe based on recent data, ranking medium-high on PPI (13th and 19th respectively). Each still has low rates of homicide and police-related deaths. This reality is belied by disorder in certain sections of the cities, which involve disarray and property destruction but few deaths, as even the cities’ critics admit (Reilly, 2021). Since the PPI focuses on deaths caused by civilians and police, it does not capture disorder without deaths. We believe the loss of life is uniquely important, and, further, over the long run minor and major crimes like homicide are related, as historical data indicate (Latzer, 2017).
Positive Outlier: NYPD
New York City’s improvements in policing in recent decades likely demonstrate the potential for police reforms elsewhere. As recently as the early 1990s, non-New Yorkers belittled New York for its crime and disorder, which damaged the city’s business climate. Though some progress came earlier, in a remarkably short 27-month period in 1994 to 1996, New York’s homicide rate fell by half under the leadership of NYPD Commissioner William Bratton, with further declines since (Bratton & Knobler, 2021, p. 196; Maranto & Wolf, 2013). New York is, as the title of Franklin Zimring’s 2011 book puts it, “the city that became safe.” As Zimring explains, reducing crime largely protected low-income minorities, who are vastly overrepresented both among crime victims and those imprisoned. As a result of NYPD’s success in deterring crime and thus changing behavior, the city’s incarcerated population fell substantially between the 1990s and 2010. Further, as Timoney (2010) and Campisi (2019) explain, over a much longer period from the 1970s through the 2000s, largely through improved training of officers, issuing of nonlethal weapons like tasers, and the institutionalization of an internal affairs unit holding officers accountable for unjustified uses of force, NYPD’s killings of civilians fell from about 100 annually to about 10 annually. As our data show, proportionately, NYPD kills far fewer citizens than any other large police force.
Many cities have adopted NYPD’s COMPSTAT, the computerized system of reporting crimes in real time, tracking where and when they occur. Fewer departments have deployed forces accordingly, putting “cops on the dots” (Behn, 2014; Bratton & Knobler, 2021, p. 147). This approach depends on precinct level leadership rapidly deploying officers to identify and stop crime hot spots, tactics lacking in most cities. NYPD had more success employing data informed policing in part because of weekly COMPSTAT meetings in which senior police leaders questioned precinct commanders, encouraging less successful leaders to copy their peers, making NYPD a learning organization (Bratton & Knobler, 1998, 2021).
In the real world, public servants including police do not always want to learn; personnel systems seem key to NYPD’s success (Maranto & Wolf, 2013; Timoney, 2010). As a result of reforms put in place by New York’s first Black police commissioner, Benjamin Ward, in the early 1980s, NYPD commissioners have unusual power over personnel. They are able to reduce in rank precinct commanders and central office officials, demotions that decrease pensions. The NYPD commissioner has the power to force into early retirement key managers and personally select their replacements. Bratton replaced about two-thirds of precinct commanders in just two years, fundamentally changing NYPD culture. Few other police commissioners have this kind of power over personnel, and fewer still use it to fight crime rather than reward supporters (Maranto & Wolf, 2013).
Likewise, NYPD has invested resources in a large, professional internal affairs unit able to terminate unprofessional officers, or at least place them in posts where they cannot carry firearms, such as in vehicle impoundment (Campisi, 2019). The emphasis on professional training and norms in New York is consistent with empirical findings from an earlier study of police background and police misconduct that concluded: “The most significant of our substantive findings is that professionalism safeguards against police brutality” (Brehm & Gates, 1997, 170). In most cases personnel reassignments are due to transgressions regarding sloppiness or petty corruption in their policing that should raise red flags. Recall that police killings of civilians are relatively rare. In 2015 roughly one in 670 officers killed on duty; yet Derek Chauvin, the Minneapolis officer who murdered George Floyd, had been involved in at least three uses of potential (and in one case, actual) deadly force before killing Floyd. Chauvin had 18 complaints on his official record, two of which resulted in discipline (Reilly, Maranto & Wolf, 2022). Yet Chauvin remained on the Minneapolis force, carrying a weapon, supervising rookie officers, reflecting a culture of inflexible civil service rules and union contracts (Navratil, 2022). Had the Minneapolis police chief had substantial authority over personnel and the willingness to use it, George Floyd would likely be alive today, as would roughly two dozen civilians killed in 2020’s BLM inspired unrest. Similarly, and importantly, even African American police commissioners have focused more on symbolic changes like altering uniform insignia than on fundamental reforms on how departments recruit, train, and discipline officers (Yancey-Bragg, 2023). The latter are more difficult and may offer fewer political rewards.
Discussion and Limitations
To summarize, we find that adjusting for poverty levels, different police departments show extraordinary variation in keeping homicides low and in respecting civilian life, with dramatic differences separating the best and worst departments. These differences across departments seem relatively stable across time, at least from 2015 to 2020. Yet we must consider a positive outlier. As we and others document, NYPD made remarkable improvements in not killing civilians and in preventing homicide, the latter in just two years, without increasing incarceration. This remarkable “turnaround” indicates that improving organizational performance can have dramatic impacts, disproportionately saving Black lives.
Our study has limitations. First, in the dataset we cannot distinguish valuing Black lives from valuing all lives, a matter of importance given the historical failings of policing Black communities admitted even by many law enforcement professionals (Bratton & Knobler, 2021). Yet, given the concentration of both police and civilian violence among young Blacks, as documented at length, more competent and consistent law enforcement will disproportionately benefit Blacks, who are now too often essentially outside of the formal justice system, unprotected and sometimes even harmed by that system (Butler, 2017; Kennedy, 1998; Zimring, 2011). As sociologists have long noted (Anderson, 1990; Turner, 1993), this has had devastating impacts on governments’ legitimacy.
Second, we lack key data on policing resources. 4 Bratton and Knobler (2021), for example, point out that NYPD had the ability to innovate and involve communities in ways that Los Angeles police could not simply because the latter had far fewer officers per capita. Third, this is an exploratory study. Lacking time series data and more sophisticated input variables, we must call for more research. Future work should use more sophisticated models, with controls beyond the poverty rate, particularly racial and ethnic variables. 5 That said, poverty does have strong impacts on crime. Further, the relative simplicity of this work and seemingly substantial impacts of policing found better enable stakeholder discussions. We do offer the caveat that other cities importing NYPD (or any) innovations may encounter unintended consequences (Gillon, 2000) and should respond accordingly.
Next Steps
May 25, 2023, marked the third anniversary of the murder of George Floyd, which intensified Black Lives Matter activism. Yet it is not clear that social science has produced sufficient knowledge likely to save Black lives or dignity by improving policing. We believe that social science can do better and conclude with two broad ideas about how to move forward.
To date, the most highly cited BLM related research involves studies of activism, not examinations of how to improve policing (Maranto, Reilly & Wolf, 2023). The singular exception among the 25 most cited articles on the topic is the fascinating Jennings and Rubado (2017) Public Administration Review article using data from 1,107 law enforcement agencies over a 15-year period. The authors find that community policing and police demographics had no impact on the numbers of fatal police shootings of civilians. In contrast, simply requiring officers to file a report whenever they point their guns without shooting substantially reduces police shootings of civilians, without increasing shooting deaths of officers. We call for more of this kind of applied research. Zimring’s under-cited 2017 book, When Police Kill, is another example of research that should receive more attention and replication. As noted avove, relatively applied works like these (and this essay) should be supplemented with research about police resources and about whether and how race and class interact, possibly in intersectional ways descriptive of white privilege.
Second, in de Tocquevillian fashion, we call on journalists and citizens to expect more from the city officials overseeing police and ultimately from police themselves. We call on researchers and journalists to apply the PPI or like metrics to smaller cities and compare different cities, both nationally and within states, to see which protect Black (and indeed all) lives and which do not. We must highlight the former and the latter. But transparency is just a first step. When mayors fail to take charge of their police to protect all citizens, ideally greater transparency can inform voters in holding those mayors accountable. Electoral accountability might be enhanced by elite efforts, if journalists, business leaders, and activists began to ask whether police commissioners have the power to terminate or otherwise render harmless unsuccessful officers and their managers, and the power and resources to hire and promote more effective officers. These are among the questions citizens should ask police leaders. If they answer no, transparency could enable citizens to push legislators to rewrite civil service rules and collective bargaining agreements, and defeat at the polls politicians who refuse to do so. This would require more complex approaches than reflexively disparaging or praising police; rather, stakeholders might recognize departments that work well and remake or even disband those that do not, as a warning to all underperforming departments. In some cases, defunding police may be an answer, but only after asking the right questions. Pathbreaking work by Teodoro (2011) indicates that ambitious police managers respond to such signals from their political environment.
Broadly, to enable this democratic process, we must distinguish success from failure, to accentuate the first and discourage the second. Measures like the PPI offer valid and reliable evidence distinguishing the two. After all, as the old reinventing government saying goes, what is not measured does not count. George Floyd, and thousands of others, deserve no less.
Footnotes
Appendix I: Variable List
Declaration of Conflicting Interests
The author(s) declared no potential conflicts of interest with respect to the research, authorship, and/or publication of this article.
Funding
The author(s) received no financial support for the research, authorship, and/or publication of this article.
Data Availability Statement
Data sharing not applicable to this article as no datasets were generated or analyzed during the current study.