
Abstract
Underemployment is an involuntary condition where individuals consider their employment inferior relative to a standard. This study analyzes underemployment among veterans using data from a large longitudinal study and federal occupational data to explore the relationship between subjective perceptions and objective indicators. Veterans reported their occupations, salaries, and subjective underemployment. Each veteran’s occupation was matched with O*NET job zone, education, and occupational median income data. Four groups were identified: neither subjectively nor objectively underemployed, subjectively underemployed only, objectively underemployed only, and both subjectively and objectively underemployed. A one-way analysis of variance (ANOVA) examined salary differences. Most veterans’ occupations required some education, and higher educational attainment correlated with increased underemployment. Two thirds of cases showed agreement between subjective and objective assessments, with underemployed veterans earning significantly less. This study highlights the reliability of self-reports as indicators of objective underemployment and underscores the need for innovative strategies to address veteran underemployment through early detection.
Underemployment is a multifaced issue stemming from mismatches in skills, pay, time, and career aspirations (Glyde, 1977). Underemployment occurs when someone believes that their job or career is inferior based on subjective comparisons (“After all those years at university, I should be making a lot more money”) or objective benchmarks (“I’m making well below the average annual income for people in my profession”). However, underemployment research faces challenges due to divergent operationalizations and measurement methods (Allan et al., 2016, 2017; McKee-Ryan & Harvey, 2011). In addition, operationalizations are further complicated by the diverse factors influencing its causes and consequences.
Studies have examined several factors contributing to underemployment, including individual attributes, such as work history, education level, and training (McKee-Ryan & Harvey, 2011); organizational factors, such as occupation, field of work, underutilization of skills, employer, and limited and limited opportunities for advancement (Jensen & Slack, 2003); and broader economic forces, such as market conditions, growth, or recession that affect labor markets (Erdogan et al., 2011; Erdogan & Bauer, 2009; Wilkins & Wooden, 2011). These factors interact in complex ways, with unique considerations for military veterans, including their military background, service occupation, cultural factors, and employer stigma.
There is growing concern about the prevalence of underemployment, particularly with military veterans transitioning to civilian careers. This study aims to compare and validate veterans’ experiences of underemployment against objective indicators.
Underemployment
There are several types of underemployment (Clogg, 2016; Glyde, 1977). Overeducation occurs when a person’s employment does not fully use their level of education. Similarly, overqualification underemployment occurs when an individual’s background, experience, and prior employment exceed what is required to do that job. When people work in a field or area unrelated to their education, they may experience content underemployment or horizontal mismatch (Somers et al., 2019). Finally, contingent underemployment occurs when someone is involuntarily employed in a temporary job (e.g., seasonal retail sales, fixed-term teacher; Bergström & Storrie, 2003).
The U.S. Bureau of Labor Statistics (BLS) estimates underemployment by counting workers in part-time roles who desire full-time employment as a fraction of the total labor force. Before the onset of the COVID-19 pandemic, the BLS reported a 3% underemployment rate, equating to approximately 4 million workers. However, other studies indicate that the actual rate may be as much as three times that of the study by Golden & Kim (2020). Notably, a recent study found that 52% of recent college graduates experienced overeducation underemployment (The Burning Glass Institute & Strada Institute for the Future of Work, 2024), demonstrating the underestimation of the BLS calculation. The BLS metric focuses solely on time-based underemployment, overlooking other forms of underemployment prevalent in the field. As a result, this measure tends to underrepresent the true extent of underemployment. Alternate estimations suggest that up to one third of the U.S. workforce may be affected by underemployment (Green & McIntosh, 2007; Green & Zhu, 2010).
Underemployment stems from a multitude of risk factors that intersect with various demographic and socioeconomic characteristics. These factors include being female, being younger (e.g., 18–24 years) or older (e.g., 55–64 years), having low educational attainment, being from underrepresented racial and ethnic groups, and having disabilities (Das-Munshi et al., 2012; Golden & Kim, 2020; Slack & Jensen, 2011). Older individuals may experience overqualification when entering late career positions, often transitional as they approach retirement (Virick, 2011). Women are often affected by underemployment due to a higher likelihood of engaging in part-time work to accommodate family responsibilities (Tipps & Gordon, 1985; Weststar, 2011).
Moreover, individuals from minority ethnic and racial groups often confront disproportionate levels of underemployment attributed to systemic barriers, such as racism, limited employment opportunities in their communities, and reduced access to supportive employment services (Slack & Jensen, 2011; Tipps & Gordon, 1985). This intersectionality of risk factors underscores the complex nature of underemployment, necessitating targeted interventions that address both individual and systemic challenges to foster equitable employment opportunities.
Underemployment, whether actual or perceived, is linked to various adverse outcomes, such as poor health, depression, and negative affect (Anderson & Winefield, 2011; Borgen et al., 1988; Dooley, 2003). Individuals experiencing underemployment often report lower job satisfaction, job retention, and greater work-related stress (Benedict et al., 2009; Lobene et al., 2015; Lobene & Meade, 2013). Data also indicate that underemployment has deleterious consequences on interpersonal relationships and family functioning (Anderson & Winefield, 2011; Barrera & Carter, 2017).
Research has explored mediating and moderating factors that shape the relationship between underemployment and well-being, and these considerations largely mimic those related to stress and well-being (Scott-Marshall et al., 2007). These factors include material resources, such as family income and financial assets; personal factors, such as self-esteem and self-efficacy; social aspects, such as perceived social support; and status-related resources, such as educational attainment and occupation. These factors play a crucial role in coping with stress (Ali & Avison, 1997; McDonough, 2000; Turner & Marino, 1994).
Veteran Underemployment
Limited empirical research examines underemployment among veterans as they transition from active duty service into civilian careers. Transitioning service members may be particularly vulnerable, as workers transitioning from one phase of life to another are more likely to be underemployed (Feldman, 1996). Moreover, underemployment among veterans is a concern given the changing demographics of the military—the proportion of women and racial and ethnic minorities in the military is increasing similarly to the overall U.S. population (Schaeffer, 2021).
Veterans face unique risk factors due to their military service. First, veterans are sometimes significantly affected by their combat experiences. They may have sustained injuries that caused physical or mental health disabilities. Second, some life experiences are more common among individuals in the military relative to civilians, such as exposure to adverse childhood experiences, and these incidents may hinder job performance. Third, some veterans have difficulty translating their military skills into civilian careers and, thus, can struggle to obtain jobs that fit their abilities (Ainspan et al., 2018). Fourth, veterans may regress in seniority on entering the civilian workforce (LinkedIn, 2019). Finally, stigmatized beliefs about veterans among some employers can limit job opportunities or lead to lower-level positions (Carter et al., 2017), prompting veterans to accept suboptimal jobs after military service (Barrera & Carter, 2017).
Studies, albeit with methodological challenges, indicate higher rates of underemployment among veterans compared to civilians, despite veterans’ higher educational qualifications and work experience. One non-peer-reviewed study focused on veterans who used the ZipRecruiter job-search platform found that underemployment among these veterans was nearly 16% higher than among civilians (Barrera & Carter, 2017). A study that compared veterans and civilians on the LinkedIn (2019) platform also found that underemployment was higher among veterans than civilians, even though veterans were more likely to have a graduate degree and more work experience than civilians. However, both studies had methodological challenges in selection effects regarding who is more likely to use the respective platforms.
For many individuals, underemployment is often a transitional phase rather than a permanent state (Farber, 1999; Wilkins & Wooden, 2011). This finding also appears to be true for veterans. Previous research has demonstrated that veterans frequently leave their initial post-service jobs within the first year due to various resources, such as financial needs or mismatched expectations (U.S. Chamber of Commerce Foundation, 2016). In addition, many veterans do not immediately find jobs that align with their preferences, leading to job changes. These situations may result in them leaving or switching jobs (LePage, 2020).
Measuring Underemployment
As previously mentioned, the complexity of underemployment is not fully captured by standard metrics such as those from the BLS. Subjective assessments of underemployment are crucial to capture its full range and complexity (Allan et al., 2017). In fact, subjective or perceived measures of overqualification are thought to be a better predictor of skill and education-based underemployment as there is some evidence to suggest that these are linked to worker’s job behaviors, job satisfaction, and overall well-being (Liu & Wang, 2012; Luksyte & Spitzmueller, 2011). However, self-reported metrics are often thought to have concerns regarding their bias and accuracy (Dang et al., 2020). A recent study, which included more than 4,000 post-9/11 veterans who had separated from active duty service 3 years prior, examined veterans’ subjective underemployment experiences (Davenport et al., 2022). Respondents indicated the extent to which they agreed that they should be in a better job given their (a) leadership experience, (b) skills, and (c) education. Approximately 62% of veterans agreed to some extent that they were underemployed in at least one of these areas. Specifically, 41% of veterans believed they should be in a better job due to their education.
The study also examined differences in underemployment perceptions among veteran subgroups. Those in enlisted paygrades, non-White, bachelor’s degree holders, and those reporting post-traumatic stress disorder symptoms reported higher levels of underemployment. No significant differences existed between males and females in their perceptions of underemployment. Furthermore, veterans from combat arms occupations were more likely to believe they were underemployed in terms of their skills.
For a comprehensive understanding of underemployment, other objective indicators should also be considered beyond the BLS, such as the Occupational Information Network (O*NET; https://www.onetonline.org/) provided by the U.S. Department of Labor’s Employment and Training Administration. O*NET is the nation’s primary resource for occupational data, including standardized and occupation-specific descriptors for more than 1,000 occupations, derived from surveys conducted among thousands of employees across diverse professions.
The core of O*NET is its Content Model, which catalogs the knowledge, skills, and abilities needed in various occupations. In addition, O*NET employs a Standard Occupational Classification (O*NET-SOC) system, defining more than 900 occupations. O*NET data are continually updated through inputs from workers, employers, professional organizations, and other data analytic sources, ensuring a comprehensive database of worker attributes and job characteristics.
The information in O*NET identified five distinct job zones, each characterized by similarities in required educational attainment, related experience, and on-the-job training. These job zones form a continuum based on the level of preparation needed. Job Zone 1 comprises roles like fast-food workers that typically require little to no preparation, while Zones 4 and 5 encompass occupations such as registered nurses, which require extensive preparation.
Occupations in Zone 3 require medium preparation, often requiring training from vocational schools, relevant on-the-job experience, or an associate degree. In Zone 3, prior work-related skills, knowledge, or experience are required. For instance, becoming an electrician necessitates the completion of several years of apprenticeship. Zone 3 positions usually involve 1–2 years of on-the-job and vocational training, frequently culminating in licensure requirements.
Using O*NET job zone data facilitates the objective measurement of underemployment due to education across various occupational criteria. This categorization enables a nuanced assessment of the match between individuals’ skills and qualifications with the demands of their respective occupations, aiding in identifying instances of objective underemployment. These categorizations can further be validated by comparing underemployment to other factors, such as occupational median income.
The Current Study
The current study used one wave of data collected from Veterans Engaging in Transition Studies (VETS), a continuation of The Veterans Metrics Initiative (TVMI), focusing on service members’ well-being during their transition from military to civilian life. By integrating VETS data with O*NET job zone information, the study aimed to compare subjective perceptions and objective measures of underemployment among veterans. In addition, the study examined the median annual salaries of veterans across different job zones as a secondary validation measure. Furthermore, it assesses the alignment between veterans’ self-reported underemployment experiences and an objective O*NET index. Notably, this research marks the first comprehensive exploration of objective and subjective underemployment measurements within a large veteran population, contributing significantly to understanding veterans’ workforce experiences during their transition to civilian careers.
Method
Participants
The data for the current study are from VETS, an extension of TVMI. A detailed explanation of the TVMI study has been previously published (Vogt et al., 2018). In brief, TVMI collected six waves of data over approximately 3 years, at 6-month intervals, from a large cohort of post-9/11 veterans to examine their experiences during their transition to civilian life. At Wave 1, 9,566 veterans (20% response rate) provided complete data. These participants were representative of the 48,965 separating veterans identified by the VA/DoD Identity Repository and invited to participate.
At the end of TVMI, 7,404 veterans agreed to be contacted to participate in future studies. A smaller portion (n = 3,516) agreed to participate and were invited to be involved in VETS. The VETS survey was administered online between November 2020 and January 2021. Human Subjects Protections approval was granted through the institutional review board, and study participants gave informed consent before beginning the survey. An incentive of a US$50 gift code was offered to those who completed the survey.
Of those invited, 43% (n = 3,205) consented to participate. A sample of 3,180 veterans completed the survey (90.4% completion rate). Thus, approximately one third of the original TVMI sample was maintained approximately 4 years after TVMI Wave 1 (M = 4.05, SD = 0.04). The high completion rate was likely because (a) there was an established relationship with participants from TVMI, (b) the incentive for completing the survey was offered during a holiday season, (c) participants received several email reminders encouraging survey completion, (d) the survey was opened for slightly more than 7 weeks, and (e) there were widespread COVID-19 social-distancing and stay-at-home mandates at the time of the survey.
On average, VETS participants were 37.91 years old (SD = 9.41), and ages ranged from 23 to 68 years. The vast majority identified as White non-Hispanic (70%; n = 2,234) and male (81%; n = 2,575). Veterans from the most junior enlisted paygrades, who are at the greatest risk for poor employment outcomes, comprised 29% of the participants. Most participants (85%) were honorably discharged. There was no restriction on continued service in reserve components following deactivation from federal military service, and 16% were currently serving in the National Guard or Reserves. Table 1 provides further demographics for this sample of respondents working at Wave 7.
Veterans Working for Pay Demographics.
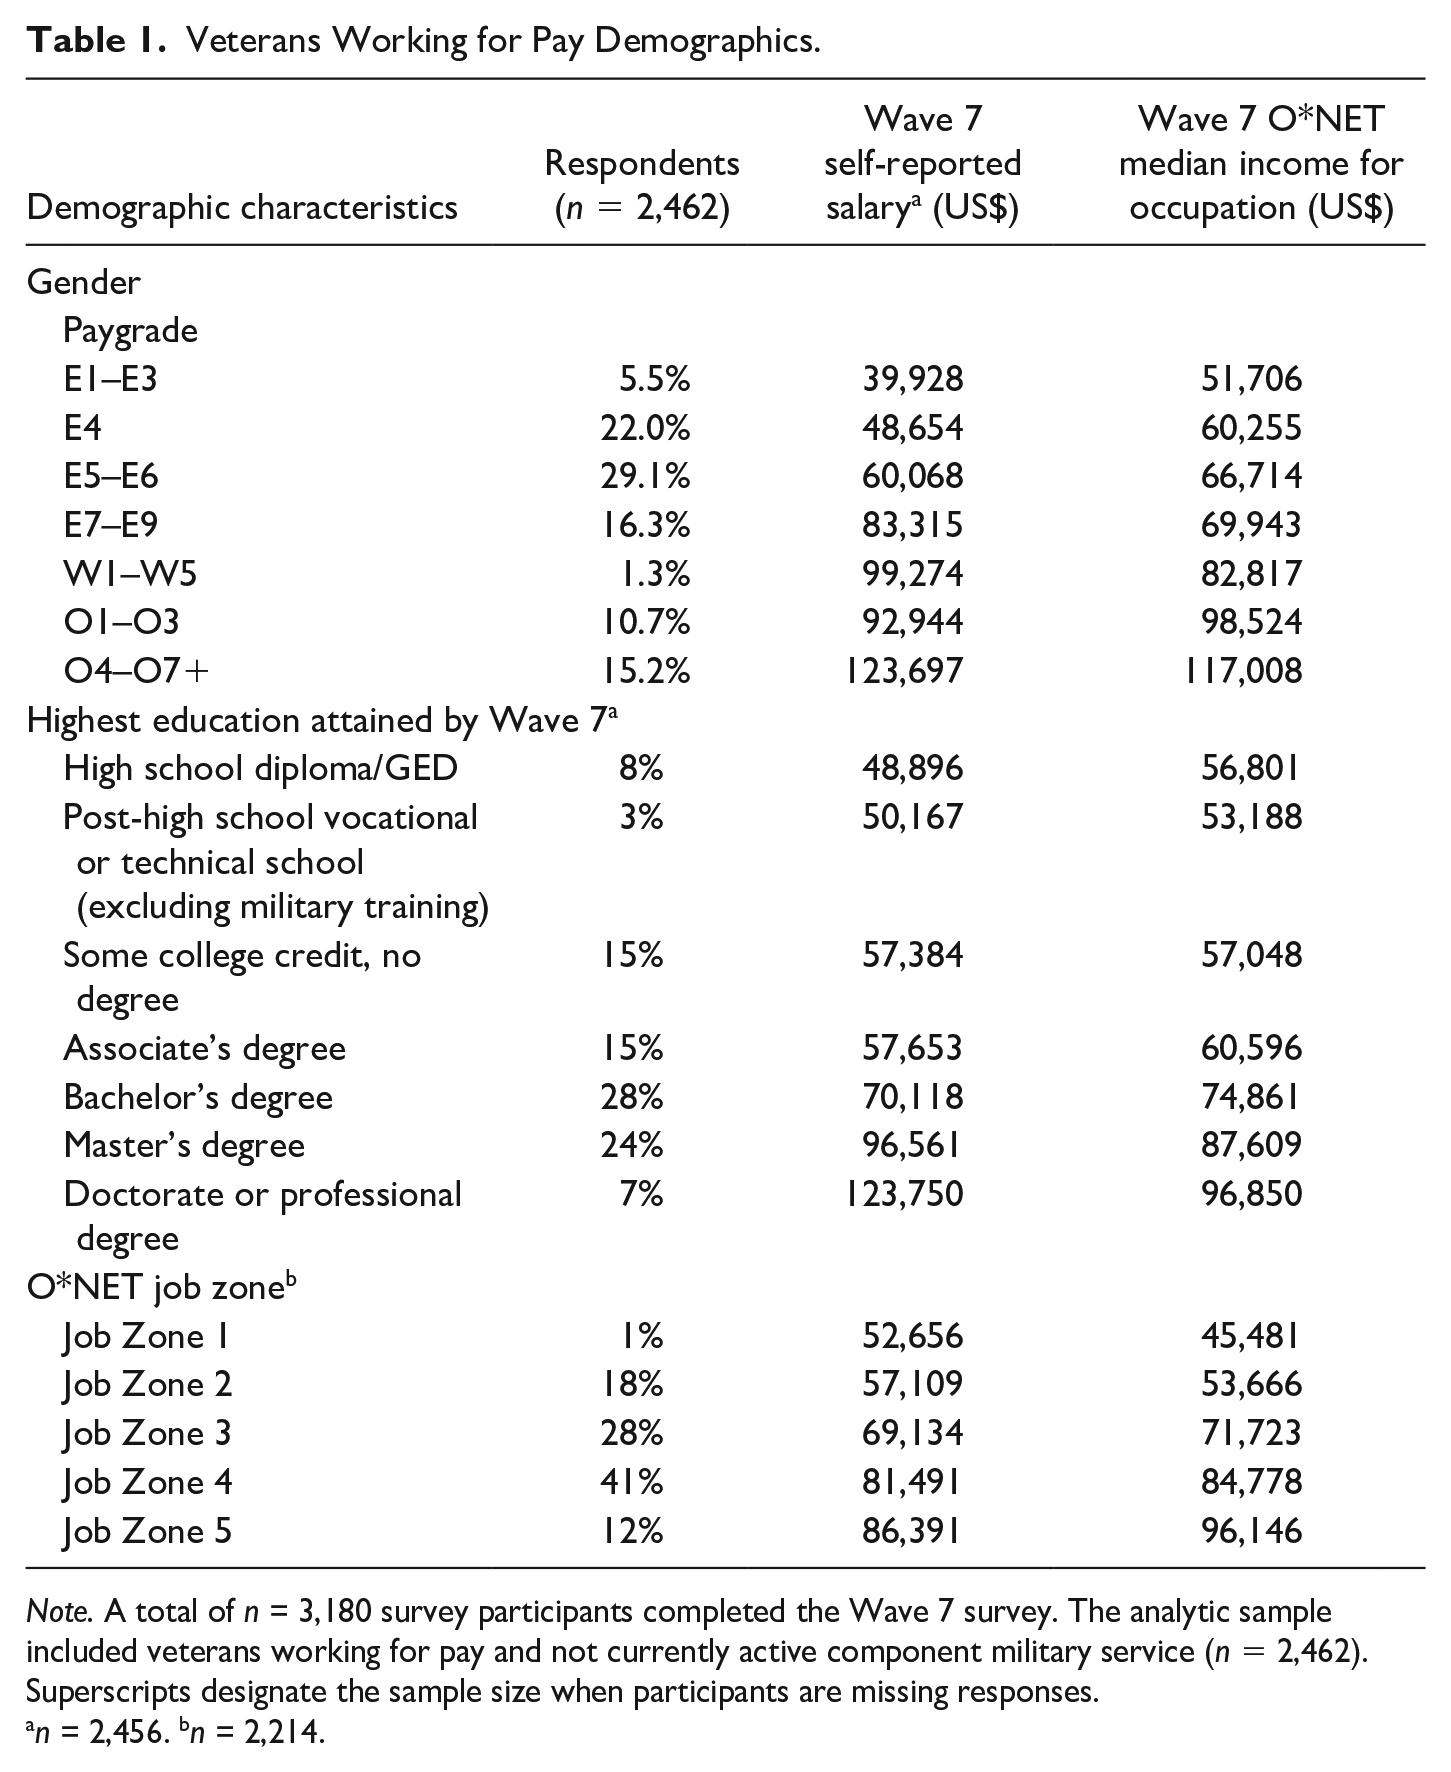
Note. A total of n = 3,180 survey participants completed the Wave 7 survey. The analytic sample included veterans working for pay and not currently active component military service (n = 2,462). Superscripts designate the sample size when participants are missing responses.
n = 2,456. bn = 2,214.
Measures
Subjective Experience of Underemployment
Veterans’ subjective experience regarding their underemployment was assessed during Wave 7 of the VETS survey, approximately 4 years after their separation from active duty. The survey adapted a previous measure of perceived underemployment (Crouter et al., 2006). Employed veterans were asked to indicate, on a five-point scale from 1 (i.e., strongly disagree) to 5 (i.e., strongly agree), their agreement with the following statement: “Given my education, I should be in a better job than my current job.”
Objective Index of Underemployment
The survey used in the VETS study asked participants a single question: “What kind of work do you do, that is, what is your occupation? (Be specific.)” These self-reported occupations were then cross-referenced with O*NET. For each reported job, data on the required education level, job zone classification, and median income were collected (Barrera & Carter, 2017). Data capture was only conducted for veterans who provided data on their perceived underemployment based on education. A single coder gathered the information for each occupation (n = 2,189), while a second coder reviewed a random sampling of 20% of the data collected for reliability. In 384 cases, the veteran’s occupation description was not clear enough to determine a single occupation code, and a second coder independently reviewed all unclear occupations. Any coding discrepancies were reconciled by a third PhD-level analyst to finalize the occupation code. Ultimately, 254 veterans had occupations that remained unclear, leading to missing job zones and salary information for these individuals.
Two independent coders, both master’s- and PhD-level industrial-organizational psychologists, placed the veterans’ self-reported occupations at Wave 7 into job zones using O*NET’s 2019 data. The coders used three items from the O*NET Education and Training Questionnaire (https://www.O*NETcenter.org/questionnaires.html) to determine job zones, with educational requirements serving as the primary criterion.
Objective underemployment was identified when a veteran’s self-reported education level exceeded the level required for the veteran’s occupation as defined by O*NET. Figure 1 outlines the model used to validate subjective and objective underemployment indicators.
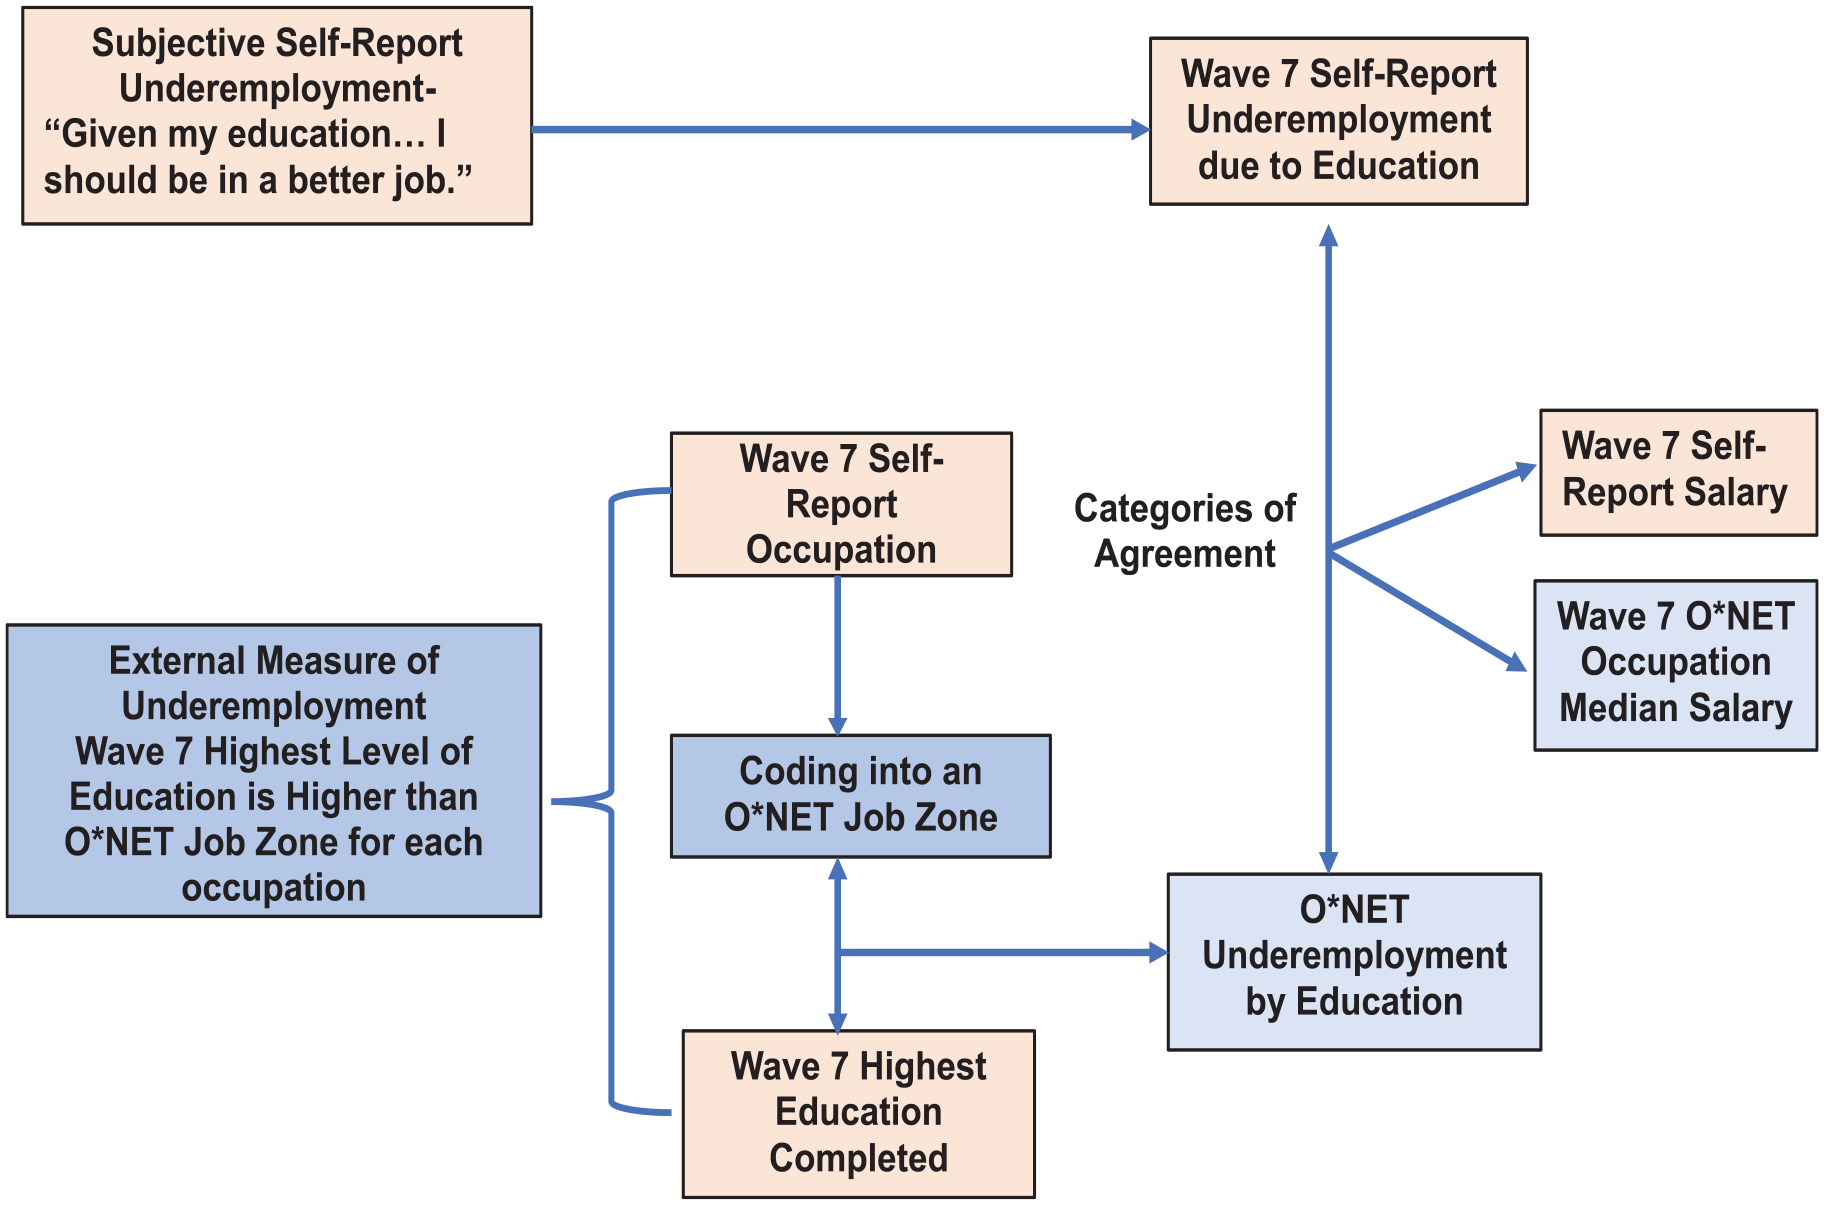
Model to Evaluate External Validation of Underemployment.
Self-Reported Annual Salary
At Wave 7, a single item from the VETS survey asked: “Please provide your expected annual salary before taxes are taken out. If you do not know the answer, please make your best guess.” Responses were recoded to reflect the lower end of the categorical range. Response options were as follows: no salary (US$0), Less than US$15,000 per year (US$7,500), US$15,000–US$24,999 (US$15,000), US$25,000–US$34,999 (US$25,000), US$35,000–US$44,999 (US$35,000), US$45,000–US$54,999 (US$45,000), US$55,000–US$74,999 (US$55,000), US$75,000–US$99,999 (US$75,000), US$100,000–US$149,999 (US$100,000), US$150,000 or more per year (US$150,000).
Objective Index of Median Income
The annual median income was sourced from the Occupational Employment and Wage Statistics (OEWS) survey, which measures wage rates for wage and salary workers in non-farm industries based on six panels of survey data collected more than a 3-year cycle. These data were then used to categorize each occupation’s estimated annual median income, employing the same ranges used for the self-reported annual salary described above. Responses were recoded to match the range of self-reported salaries. The lowest median income in the sample was US$23,740: US$15,000–US$24,999 (US$15,000), US$25,000–US$34,999 (US$25,000), US$35,000–US$44,999 (US$35,000), US$45,000–US$54,999 (US$45,000), US$55,000–US$74,999 (US$55,000), US$75,000–US$99,999 (US$75,000), US$100,000–US$149,999 (US$100,000), US$150,000 or more per year (US$150,000).
Data Analytic Approach
Proportions were used to describe veteran employment and education levels. Prior to analysis, each veteran’s self-reported job was coded into an O*NET job zone. The proportion of veterans within each job zone was then calculated and reported separately for enlisted and officer paygrades. Cross-tabulations were examined to compare job zones based on education levels and evaluate how well self-reported data matched O*NET index data on underemployment.
From these cross-tabulations, four categories of underemployment status were created: (a) veterans subjectively underemployed only, (b) veterans objectively underemployed only, (c) both subjectively and objectively underemployed, and (d) veterans neither subjectively nor objectively underemployed. Analysis of variance (ANOVA) was then used to examine group differences in self-reported salary data and O*NET median annual income data as a secondary objective indicator of underemployment. These analyses were also conducted separately for enlisted paygrades and officer paygrades.
Results
Descriptive Data
Nearly 80% of veterans were employed at Wave 7, approximately 4 years after separation from active duty service or deactivation from the National Guard or Reserves. As displayed in Table 1, 8% of veterans had a high school diploma/General Educational Development (GED), 3% had a vocational or technical degree, 15% had attended some college, 15% had attained an associate degree, 28% had attained a bachelor’s degree, 24% had attained a master’s degree, and 7% had attained a doctorate or professional degree.
Subjective Underemployment
On average, approximately 4 years after leaving the military, nearly 40% of veterans somewhat or strongly agreed to being underemployed based on their level of education (M = 3.11, SD = 1.28). In total, 27% of veterans from enlisted paygrades with a high school diploma endorsed being underemployed. In contrast, nearly 50% of the enlisted veterans with bachelor’s degrees and 60% of those with a master’s degree endorsed being underemployed due to their education.
Veterans Occupations and O*NET Job Zones
As previously described, each veteran’s self-reported occupation was located in O*NET and placed into the corresponding job zone. However, 1% of veteran jobs fell in Zone 1, which includes occupations that may require a high school diploma or GED, such as landscaping and groundskeeping laborers, baristas, fast-food preparation workers, and counter workers. Approximately 18% of veterans’ self-reported occupations were within Zone 2, which includes occupations that require a high school diploma, such as retail salespersons, security guards, correctional officers, and customer service representatives. Nearly 28% of occupations fell into Zone 3, which requires vocational school, an associate’s degree, or on-the-job training, such as police officers, firefighters, maintenance and repair workers, and service technicians. Approximately 41% of occupations held by veterans fell into Zone 4, which requires a bachelor’s degree and includes jobs, such as general and operations managers, information security analysts, registered nurses, logistic analysts, intelligence analysts, and engineers. Zone 5 occupations, which encompassed 12% of the respondents, require a graduate degree, including lawyers, physicians, management analysts, and dentists. See Table 1 for a description of the job zones for the sample.
Job zone comparisons were examined separately for enlisted and officer paygrades due to the different educational requirements for joining the military as an enlisted service member versus an officer. That is, officers are required to attain a bachelor’s degree. Among enlisted veterans, less than 1% were in Zone 1 (compared to 0% for officers); 24% were in Zone 2 (compared to 2% of officers); 34% were in Zone 3 (compared to 11% of officers); 37% were in Zone 4 (compared to 50% of officers); and 4% were in Zone 5 (compared to 37% of officers).
Objective Underemployment
Objective underemployment occurred when a veteran’s self-reported education surpassed the educational requirements specified by their occupation according to O*NET guidelines.
High School Diploma/GED
Nearly, two thirds of veterans with a high school diploma/GED were in job zones higher than their education level indicated. For example, 41% of veterans with a high school diploma were in Zone 3 (occupations requiring a vocational or associate’s degree), while 20% were in Zone 4 (occupations necessitating a bachelor’s degree). Approximately 40% of veterans with a high school diploma were in Zone 1 occupations, indicating no objective underemployment among this group.
Post-High School Vocational or Technical Training
Slightly over half (56%) of veterans with post-high school vocational or technical training were in job zones matching their education level. About 8% of enlisted veterans were in a higher job zone than their education level would indicate. More than one third (36%) of enlisted veterans with this level of education were objectively underemployed due to having more education than required for their occupation.
Some College
Approximately 66% of enlisted veterans with some college experience were employed in job zones higher than their education level suggested, indicating they possessed relevant experience rather than formal education. Moreover, 34% of these veterans were objectively underemployed.
Associate’s Degree
About 27% of enlisted veterans with an associate degree were in higher job zones than their education level, while 43% were in job zones that aligned with their education. However, 30% of veterans with an associate’s degree were objectively underemployed.
Bachelor’s Degree
Only 4% of enlisted veterans with a bachelor’s degree were in job zones exceeding their educational qualifications. Over half (56%) of enlisted veterans had jobs matching their education, while 40% were objectively underemployed. Among those underemployed, 16% were in Zone 1 occupations, and 23% were in Zone 3 occupations.
Master’s Degree
The majority (90%) of enlisted veterans with a master’s degree were objectively underemployed. Among them, 64% worked in Zone 4 occupations, 19% in Zone 3, and 7% in Zone 2. However, 10% of those with a master’s degree had occupations that aligned with the appropriate job zone. Refer to Figure 2 for job zone categorization.
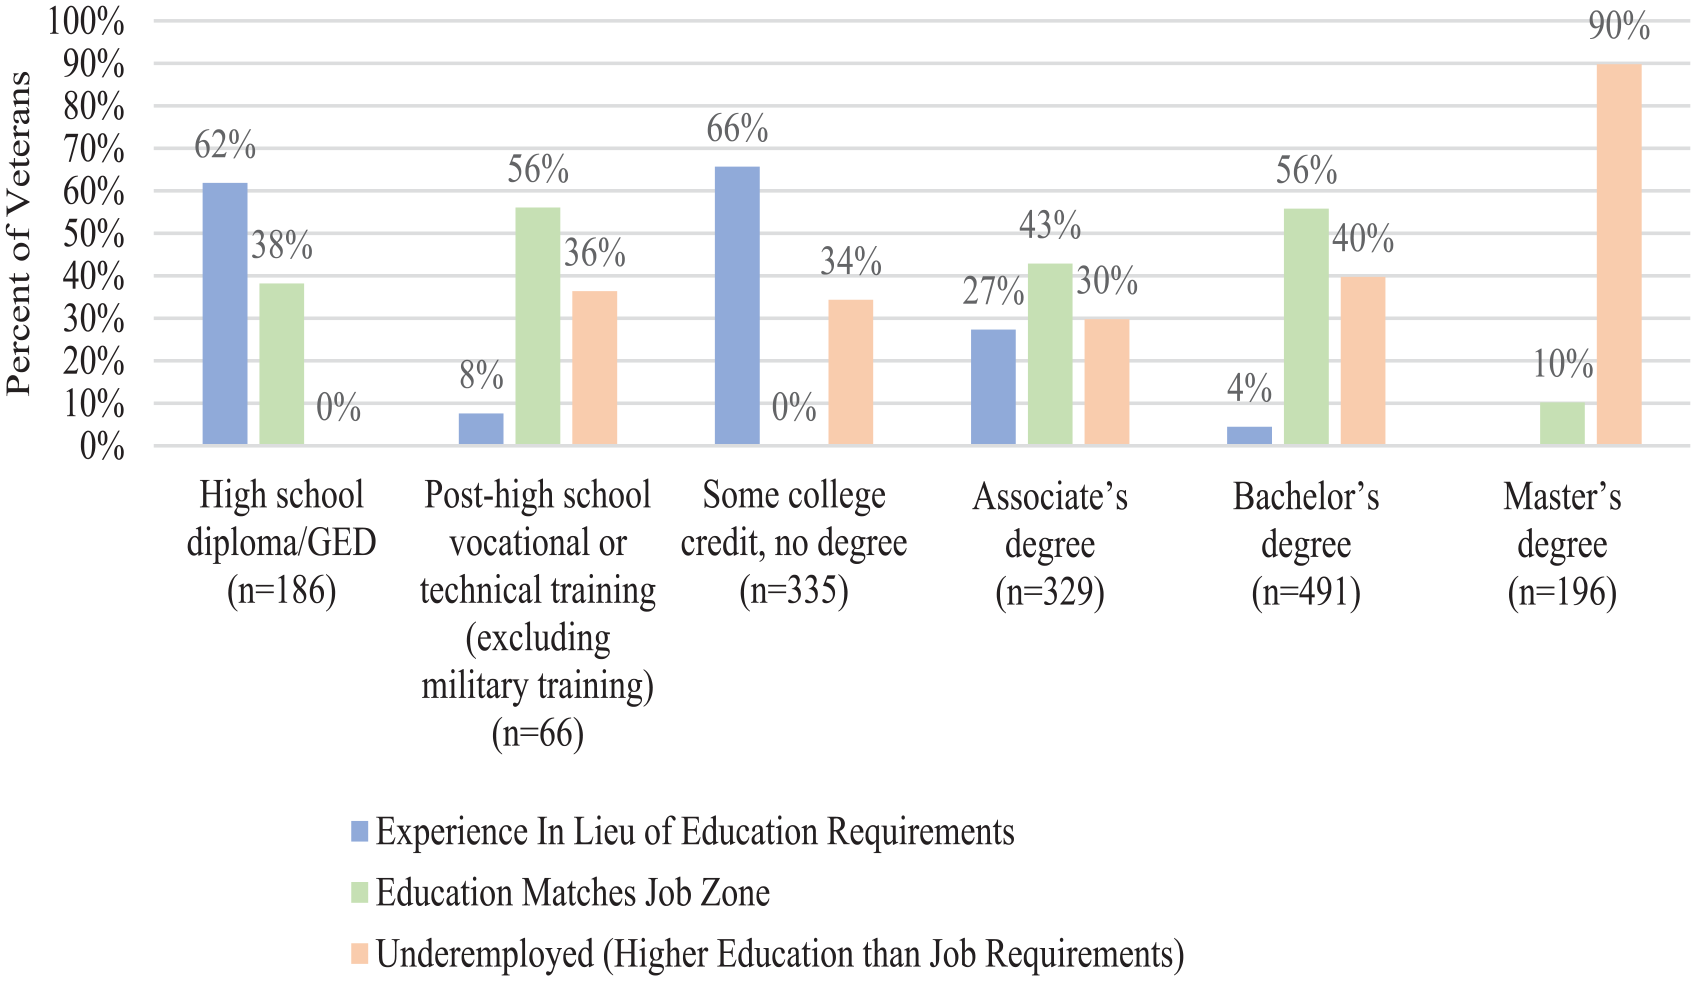
Job Zone Categories: In Lieu of Education, Matches Education, Underemployed.
Concordance of Subjective and Objective Underemployment Measures
The study compared subjective and objective measures of underemployment, resulting in the identification of four distinct groups. Group 1, comprising 43% of cases, was neither subjectively nor objectively underemployed. In contrast, Group 2 (19% of cases) experienced subjective but not objective underemployment. Conversely, Group 3 (15% of cases) exhibited objective but not subjective underemployment. Group 4, representing 23% of cases, experienced both subjective and objective underemployment.
Notably, in two thirds of cases, subjective and objective measures of underemployment were in agreement, indicating a fair, substantial level of concordance (κ = .29) and underscoring the significance between veterans’ perceptions and indicators of underemployment.
Concordance of Self-Reported Salary and O*NET Median Occupational Income
Table 1 provides the average self-reported salary categorized by paygrade, education, and job zone. Junior enlisted veterans reported an average annual salary of nearly US$40,000, while senior enlisted veterans reported slightly more than US$83,000 annually. Officers’ average annual salaries ranged from US$92,000 to US$124,000.
Comparing self-reported salaries to median occupational incomes from O*NET revealed several trends. For junior enlisted (E1–E6) and mid-level officer (O1–O3) paygrades, O*NET’s median income exceeded self-reported salaries. However, for senior enlisted (E7–E9), warrant officer (W1–W5), and senior officer paygrades, O*NET’s median income was lower.
Both self-reported and O*NET salaries demonstrated an upward trend with increasing educational attainment and job zones. Notably, self-reported salaries were lower for four of the six education levels (i.e., high school/GED, some college, associate’s degree, and bachelor’s degree) and Job Zones 3, 4, and 5, representing positions requiring vocational school, associate’s degree, on-the-job training, a bachelor’s degree, or a graduate degree.
Differences in Self-Reported and O*NET Objective Estimates of Salaries
To compare self-reported salary data and O*NET median occupational income estimates across the four underemployment groups, two separate one-way ANOVA were conducted. The results for enlisted service members are detailed in Figure 3. There was a significant correlation between self-reported salary and O*NET median occupational income estimates for enlisted service members (r = .42) and officers (r = .40). These analyses were performed for enlisted and officer paygrades separately.
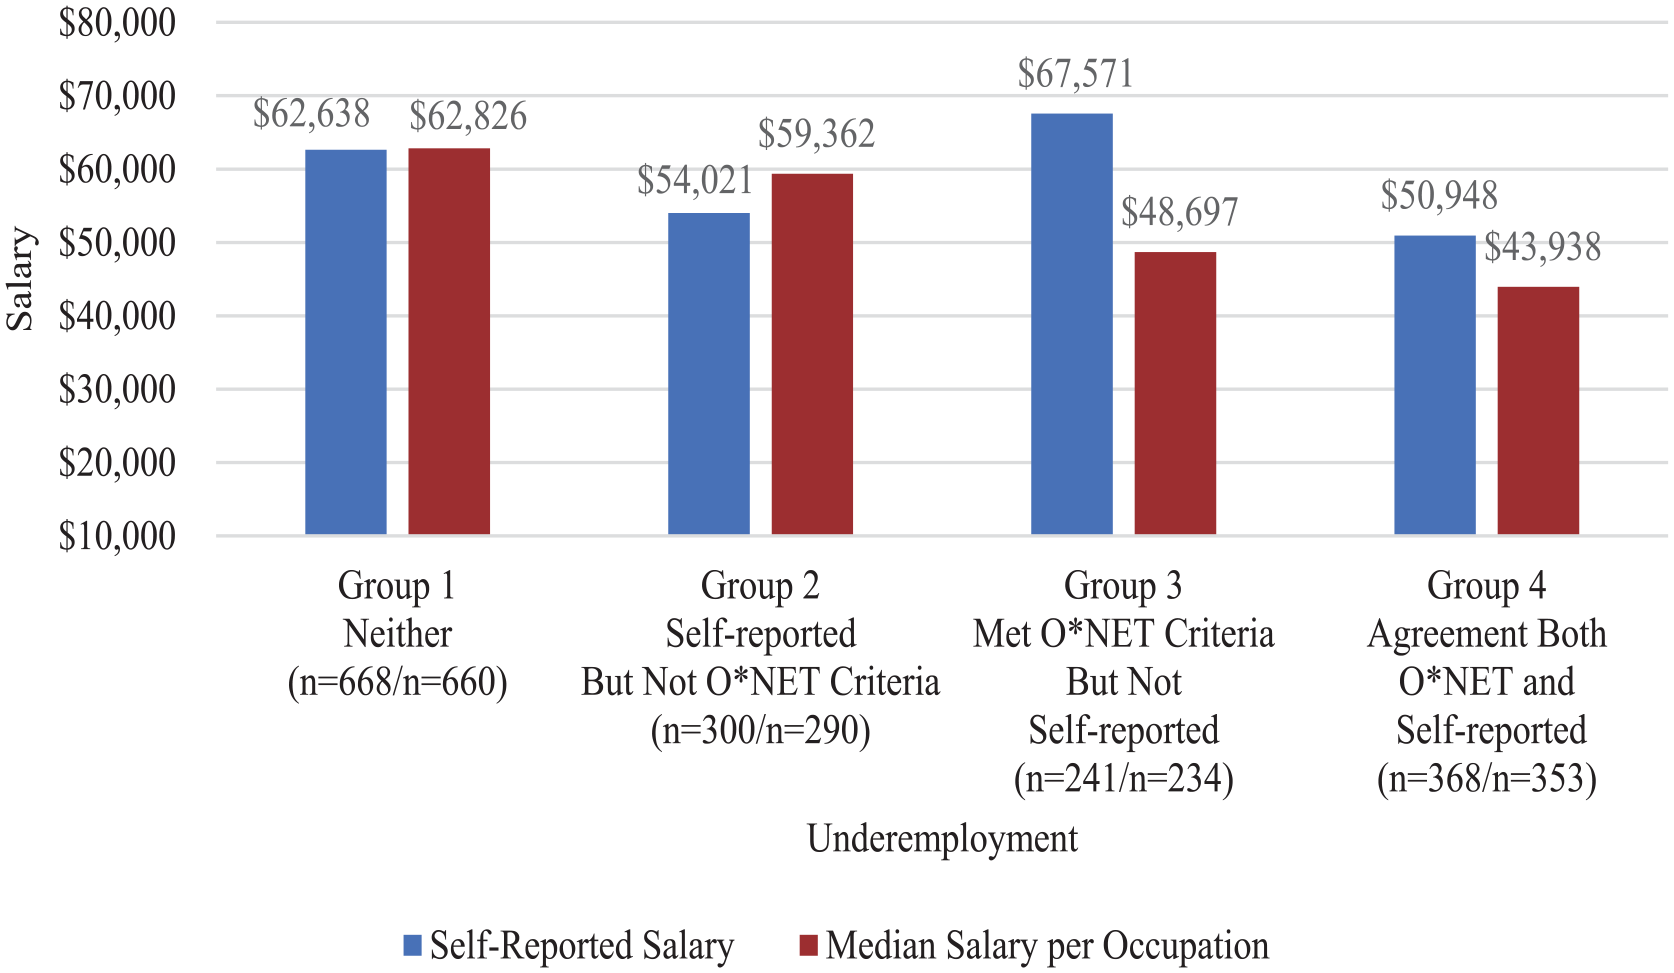
Veteran’s Self-Reported Salary and O*NET’s Job Zone Median Income by Reliability Categories.
Self-Reported Salary
The first one-way ANOVA showed a significant difference between self-reported salary between the four underemployment groups for enlisted veterans, F (3, 1,576) = 21.22, p < .001, and officers, F (3, 560) = 9.58, p < .001. Post Hoc Tukey’s Honest Significant Difference (HSD) tests further clarified these differences.
For enlisted veterans, those in Group 1 (neither subjectively nor objectively underemployed) had significantly higher self-reported annual salaries (M = US$62,638, SD = US$30,768) than Group 2 veterans (subjectively underemployed but not objectively underemployed; M = US$54,021 SD = US$29,743) and Group 4 veterans (subjectively and objectively underemployed; M = US$50,948, SD = US$30,057). However, Group 1 veterans had significantly lower self-reported salaries than Group 3 veterans (not subjectively underemployed, but objectively underemployed; M = US$67,571, SD = US$33,471). In addition, Group 2 veterans (subjectively but not objectively underemployed) reported significantly higher salaries (M = US$54,021, SD = US$29,743) than Group 4 veterans (subjectively and objectively underemployed; M = US$50,948, SD = US$30,057). Similar trends were observed for officer paygrades.
Median Income Per Occupation
The second one-way ANOVA showed significant differences in O*NET median income estimates among the four underemployment groups for both enlisted veterans, F (3, 1,510) = 74.36, p < .001, and officers, F (3, 539) = 47.80, p < .001. Post Hoc Tukey’s HSD tests further explained these findings.
Among enlisted veterans, Group 1 veterans (neither subjectively nor objectively underemployed; M = US$62,826, SD = US$21,153) had a higher median income than Group 3 veterans (not subjectively underemployed but were objectively underemployed; M = US$48,697, SD = US$20,179) and Group 4 veterans (subjectively but not objectively underemployed) and had a significantly higher median salary (M = US$43,938 SD = US$20,259). Group 2 veterans (subjectively but not objectively underemployed) had a considerably higher median income (M = US$59,362, SD = US$21,797) than veterans in Groups 3 and 4. Group 3 had a significantly lower median income than Groups 1 and 2 but a significantly higher median income than Group 4, which had the lowest median income compared to all other groups. Similar patterns existed for officer paygrades.
Discussion
This study analyzed underemployment using self-reported data among veterans approximately 4 years after they separated from the military and the O*NET index data. Specifically, this study explored the agreement between subjective reports and objective underemployment due to education and validated this relationship with a secondary objective indicator, annual income. Although existing research often focuses on veteran unemployment, there is a notable scarcity of studies addressing veteran underemployment, with Davenport et al. (2022) being a notable exception. Thus, there is a significant gap in the literature and in the public’s understanding of veteran underemployment, which is particularly troubling given the associations between underemployment and adverse work and well-being outcomes (Dooley, 2003). This study is unique in that it explores and validates subjective to objective estimates of underemployment and income, adding a distinct perspective to the existing research landscape.
At the time of the VETS survey, around 80% of veterans were employed, and the majority had obtained at least an undergraduate degree. These employment and education estimates align with prior veteran studies (Parker et al., 2019).
Analyzing the O*NET job zones provided new insights. Only about 1% of veterans reported jobs in O*NET Zone 1, which includes occupations that may require a high school diploma/GED, require few skills, pay low wages, are often unstable, and frequently do not provide health, retirement, or other benefits (U.S. Bureau of Labor Statistics, 2021). Thus, on the whole, veterans generally hold occupations beyond the lowest tier. Approximately 20% of veterans reported jobs in Zone 2, which may require a high school diploma, including roles such as retail sales positions, security guards, and mail carriers. These positions may or may not be full-time, may offer little room for occupational or wage growth, and may not advance worker skills (Gumber & Sullivan, 2022). The percentage of veterans in this job zone may reflect that veterans tend to cluster in occupations with somewhat lower average employment and earning growth, possibly in areas with lower economic growth (Makridis & Hirsch, 2021).
The majority of veterans (approximately 70%) reported jobs in Zone 3 or 4, which demand education levels (i.e., technical degrees and certificates and 2- or 4-year degrees) and are associated with higher wages, greater advancement opportunities, and are more likely to offer benefits. Not surprisingly, a significant proportion of veterans from the officer paygrades was employed in these higher job zones, given that they entered the military with at least a bachelor’s degree. Only 12% of veterans held jobs in Zone 5, which require a graduate degree.
These findings indicate that veterans could benefit from strategies and programs to enhance their education, skills, and job opportunities in higher-level zones. Strategies such as translating military experience to civilian employment, furthering education, occupational mentoring, and counseling are effective in helping veterans secure better employment (Dempsey & Schafer, 2020; Kintzle & Castro, 2018; Sargent, 2014; Shambaugh et al., 2018, U.S. Chamber of Commerce Foundation, 2016). Programs such as the Transition Assistance Program (TAP) and the post-9/11 GI Bill include this type of assistance and support (Li, 2020).
Importantly, this study also examined subjective and objective underemployment, focusing on veterans’ reported education levels. Among enlisted paygrades, 27% of high school diploma-holding veterans reported underemployment. Notably, veterans with a bachelor’s or master’s were more likely to report subjective underemployment compared with their enlisted peers with less education. This study provides evidence that veterans from enlisted paygrades with lower education levels are less likely to be underemployed compared with higher-ranking and more educated veterans. One possible explanation for this trend could be that enlisted veterans gravitate and excel in occupations where their military experience holds significant value over formal education. Many veterans believe the job skills they learned in the military helped them obtain civilian employment (Parker et al., 2019). These roles encompass various fields, such as human resources, transportation, equipment care and management, construction, computer and network systems, health care, and criminal justice (U.S. Bureau of Labor Statistics, 2023b).
This study was also the first to investigate the alignment between self-reported underemployment among veterans and an objective underemployment index. The results revealed a substantial agreement between subjective and objective measures of underemployment with a concordance rate of 66%. This high level of agreement suggests that veteran self-reports appear relatively accurate in assessing their underemployment status. Consequently, using self-reports could be an efficient and reliable method for evaluating underemployment in veterans. Despite the general concern about the bias and inaccuracy of self-reports (Dang et al., 2020), this study provides some evidence supporting the reliability of self-reports regarding underemployment among veterans.
Veterans from the officer paygrades reported significantly higher annual salaries compared with enlisted paygrades. Officers reported an average wage ranging from US$92,000 to nearly US$124,000 per year, whereas enlisted veterans averaged US$40,000 per year. This disparity is understandable given that officers typically enter the military with at least a bachelor’s degree, receive extensive leadership training, and hold supervisory roles with significant responsibilities. In other words, officers have already had highly successful careers and possess qualities valued in many occupations (U.S. Bureau of Labor Statistics, 2023a). As expected, both self-reported and O*NET salaries increased with higher education levels and job zones.
However, it is noteworthy that O*NET median income estimates were higher than self-reported salaries for veterans in the E1–E6 paygrades, suggesting that lower enlisted veterans may be receiving lower pay relative to their educational qualifications. However, O*NET’s reported income was lower than the self-reported income for veterans in higher enlisted, warrant, and senior officer paygrades. This raises the possibility that veterans in higher paygrades may underreport their actual income and earn more than expected based on their education levels. Self-reported salaries were lower than O*NET estimates for half of the six education levels and Zones 3, 4, and 5. The discrepancy between self-reported and O*NET income estimates highlights the need for further investigation into the factors influencing these differences among veterans.
Significant differences in self-reported and objective salaries were observed across different job zone categories. In general, veterans who reported or were classified as underemployed based on O*NET data tended to have lower salaries compared to those not experiencing subjective or objective underemployment. This finding aligns with expectations, as underemployment is typically associated with lower earnings. This study is the first to validate this relationship, specifically among veterans.
Policy Implications
Efforts to address veterans’ employment challenges have seen a range of legislative and programmatic interventions. Legislative measures such as the Post-9/11 GI Bill, which provides tuition and a housing stipend for education and training, and the Work Opportunity Tax Credit, which provides rebates to organizations that hire veterans, are aimed at facilitating veterans’ access to education, training, and job opportunities. Future legislative initiatives could explore targeted incentives to reduce underemployment and facilitate veterans’ transition to higher-paying job zones as defined by O*NET.
Within the VA, several programs exist to support veterans in securing stable and well-paying jobs. Initiatives such as the Veteran Readiness and Employment program, which subsidizes veterans’ income with an entry-level wage while training, the Special Employer Incentive, covering up to 50% of a veteran’s wages for 6 months and training costs, and the Non-Paid Work Experience program, offering a monthly wage to veterans for specific career training and on-the-job experience, offer financial and training support. Finally, as part of the Veteran Opportunity to Work Act, the U.S. Department of Defense expanded and enhanced the evaluation of TAP so it could be redesigned to better meet veterans’ needs. However, its effectiveness requires further evaluation (ICF, 2024).
In the private sector, many companies have tried to embrace a veteran-friendly culture that emphasizes the benefits of hiring veterans (Prudential Financial, Inc., 2012). In 2011, 11 companies created the 100,000 Jobs Mission with the goal of hiring 100,000 veterans by 2020. In only 3 years, nearly 200,000 veterans had been hired (Curry Hall et al., 2014). The Mission has also yielded several best practices for hiring veterans, showcasing corporate partnerships’ potential impact on veteran employment. These best practices include educating managers about the value of hiring veterans, investing in recruitment strategies targeting veterans, leveraging federal resources that support veteran hiring, and developing veteran-sensitive approaches to onboarding, career development, and retention (Curry Hall et al., 2014). Continued data collection and tracking are essential to refine these approaches and measure outcomes effectively.
Finally, non-governmental organizations also play a crucial role, offering platforms for job matching, career counseling, resume assistance, and job coaching, aiding employees in becoming proficient and self-confident in their positions. Indeed, veterans in the study sample report using vocational programs, including online job fairs, career fairs, job placement services, career counseling, and job training (Perkins et al., 2020). These programs are instrumental in helping veterans create career paths that align with their interests and experiences while effectively translating their military skills into civilian job roles to capitalize on the flexibility of the current labor market (Maynard & Feldman, 2011).
In addition, interventions targeting factors contributing to underemployment can help mitigate its adverse effects on veterans’ well-being, including health, relationships, and family functioning. Programs focusing on coping strategies (e.g., emotional support, stress management), career counseling, social connections, and enhanced job search skills can assist veterans in finding suitable and meaningful work and reducing their time spent in underemployment (Curry Hall et al., 2014; Prudential Financial, Inc, 2012; Shepherd et al., 2021).
Limitations and Future Directions
This study had several limitations. First, as with any self-reported measure, there may be inherent inaccuracies that researchers cannot fully address. Thus, the extent to which self-reported underemployment is accurate is uncertain (Razavi, 2001). However, in this study, subjective and objective indices of underemployment were aligned approximately two thirds of the time, suggesting that self-reported underemployment holds value for research and practical applications. Future investigations should further examine the validity of self-reported underemployment across various subgroups, including differences related to gender, race, ethnicity, paygrade, employment status (full-time vs. part-time), and military occupational specialties, particularly combat versus non-combat roles. Furthermore, underemployment measurement needs to be improved for the general population to establish a baseline understanding of the expected underemployment rate, make meaningful comparisons, and highlight disparities unique to veterans or specific subgroups of the veteran population.
Second, this study focused solely on underemployment in relation to educational attainment. However, education alone may not adequately reflect an individual’s vocational skills and abilities (Green & McIntosh, 2007; Mavromaras et al., 2013). Employers often use education as a screening criterion, which may not directly correlate with job requirements (Erdogan & Bauer, 2009; Wilkins & Wooden, 2011). O*NET data encompass a broader range of factors, such as specific abilities, interests, knowledge areas, and work-related attributes relevant to underemployment. Exploring how these factors influence underemployment among veterans could yield valuable insights that have the potential to positively affect millions of veterans as they undergo the military-to-civilian transition.
Third, there is limited research on how military experience, instead of formal education, influences employment outcomes, including underemployment. Many veterans report that they encounter challenges translating their military skills and experiences into civilian job contexts (Carter et al., 2017). Exploring strategies to bridge this gap and effectively showcase veterans’ skills to prospective employers could significantly improve their employability and reduce underemployment and unemployment. Future studies could identify specific skills and abilities veterans obtain from their military occupations and their relevance to civilian occupations, offering recommendations to forecast which military occupations are most likely to predict meaningful and full employment.
Footnotes
Declaration of Conflicting Interests
The authors declared no potential conflicts of interest with respect to the research, authorship, and/or publication of this article.
Funding
The authors disclosed receipt of the following financial support for the research, authorship, and/or publication of this article: The Veterans Metrics Initiative (TVMI) research was managed by the Henry M. Jackson Foundation for the Advancement of Military Medicine, Inc. (HJF), and it was collaboratively sponsored by the Bob Woodruff Foundation, Health Net Federal Services, HJF, Lockheed Martin Corporation, Marge and Philip Odeen, May and Stanley Smith Charitable Trust, National Endowment for the Humanities, Northrop Grumman, Prudential Financial, Robert R. McCormick Foundation, Rumsfeld Foundation, Schultz Family Foundation, The Heinz Endowments, U.S. Department of Veterans Affairs Health Services Research and Development Service, Walmart Foundation, and Wounded Warrior Project, Inc. Support for the Veterans Engaging in Transition Studies (VETS) Wave 7 survey was provided by The Pew Charitable Trusts. The views expressed are those of the author(s) and do not necessarily reflect the views of The Pew Charitable Trusts.