
Abstract
The purpose of deriving weights for factors is to identify and discover what items have the strongest relation to the outcome of interest to create an assessment with the best predictive validity. The current study examined and compared weighted and nonweighted models for the pre-screen of the Youth Assessment and Screening Instrument (YASI). The total sample of 6,175 youth from the state of North Dakota, United States, was divided into the calibration sample (33%) to build the models and was cross-validated across five independent subsets. The results were that no method consistently nor substantially outperformed the original method. The one exception was the risk total score produced through the logistic regression model substantially improved the predictive accuracy for violent dispositions after the initial YASI administration in the validation subsets. Therefore, it may be worth considering alternative models and warrants further exploration for the users of the scale.
Actuarial assessments are used within the criminal justice system throughout the decision-making process from pre-trial to sentencing to discharge. These types of assessments use statistical models or algorithms to classify individuals (Silver, 2000; Smid, 2014). Thus, actuarial assessments are believed to be the optimal predictive tools for decision-making (Hannah-Moffat & Shaw, 2001). Given the significance and life-altering implications of these decisions, it is imperative that these decisions are made based on assessments that are accurate and reliable. Thus, it is critical that the items within these scales are appropriately and proportionally related toward an individual’s overall risk and need to make fair, defensible, and transparent decisions that are empirically and quantitatively supported. Moreover, it is imperative that these assessments have high predictive accuracy, given decisions are made based on their results. However, within the field, there is little research for the optimal derivation of weights for assessments to improve predictive accuracy. Weights in this case are values given to risk or strength factors in actuarial models for the evaluation of risk in recidivism (Grann & Långström, 2007). Relatedly, subpar indicators with small to moderate predictive accuracy are used, as they are the “best” that are available. It is worthwhile to optimize the weighting scheme for items on actuarial tools because it might improve predictive accuracy. In turn, assessments that have better predictive accuracy are likely to provide information on how to best allocate resources and services based on an individual’s needs. Overall, this would lead to more data-driven decision-making that would reduce biases while increasing public confidence and public safety. The current study examined the optimal weights for the items on the pre-screen of the Youth Assessment and Screening Instrument (YASI; Orbis Partners, 2000), by comparing weighting and nonweighted models, for youth in the state of North Dakota, United States, by testing whether alternative weighting schemes improve predictive accuracy.
Weighting Items
The purpose of deriving weights for items, also known as factors, is to identify and discover what items have the strongest relation to the outcome of interest to create an assessment with the strongest ability to predict an outcome of interest, in this case recidivism (predictive validity). Recidivism occurs when an individual who has previously committed a crime re-offends. Rather than assigning each item equivalent weights (e.g., 0 when the risk factor is absent and 1 when it is present) and then summing all the items to a total score, each factor can be considered in terms of its relation to recidivism (Grann & Långström, 2007). That is, items that are more closely related and directly influence recidivism can be given greater weight, compared with items that are less related. In the criminal justice field, predictive validity needs to be optimal to be to be able to trust these assessments, given the significance of decisions for the individuals themselves, as well as maintaining public safety.
The current study compared weighting methods that were chosen to be consistent with the guidelines proposed by Grann and Långström (2007) and Rieger and Serin (2021): the original method, Burgess, Nuffield, and logistic regression. These studies found that the weighting methods did not significantly improve predict accuracy over the nonweighted approach. This finding is consistent with other researchers who have found no significant improvement when weighting methods are considered, such as when using logistic regression compared with more complex methods, such as classification tree models or neural network models (Dawes, 1979; Liu et al., 2011; Wainer, 1976; Walters, 2011). Robb (2021) examined weighting methods for an assessment evaluating criminogenic risks, needs, and strengths for adult women. Robb (2021) found that the gender-responsive Nuffield coding was the superior method compared with the Burgess and traditional Nuffield method. In comparison, others have argued that significant improvements can be garnered when the samples sizes are large enough (Einhorn & Hogarth, 1975; Hosmer et al., 2013; Silver et al., 2000). Therefore, given conflicting findings and the lack of evaluation of weighting methods for strength items, the current study was justified.
The Youth Assessment and Screening Instrument
The YASI is a measurement tool designed to assess the risks, needs, and strengths of youth involved in the criminal justice system. With respect to the pre-screen assessment, the YASI has evidenced good predictive accuracy for recidivism, though findings have been mixed with area under the curve (AUC) values ranging from .55 (small effect size for recidivism for the protective total score; Scott et al., 2019) to .79 (large effect sizes for new offenses and violent offenses for the pre-screen overall; Jones et al., 2016). Since implementation of the tool in 2002, the YASI item weights have not yet been evaluated in North Dakota. As knowledge of risk, needs, and strengths have evolved in that time out of decades of research and practice, it is important to re-examine. In addition, North Dakota recently passed a law that states that each youth in a formal delinquency petition be given an assessment to assess their level of risk and needs prior to their disposition (i.e., the outcome of their arrest or prosecution; North Dakota Juvenile Court, 2021). Given that the North Dakota Juvenile Court currently uses the YASI, this present study aimed to help the jurisdiction ensure that the tool is up-to-date and reflective of relevant empirical evidence for their population.
Current Study
The purpose of the current study was to examine and compare weighting models for the assessment of risk and need for future offending for youth in the state of North Dakota with the YASI using its pre-screen assessment. There were four weighting methods included, for which the optimal weights for the items were examined in hopes to improve the tool’s predictive accuracy.
Method
Sample
The initial dataset received from North Dakota included 18,233 YASI administrations involving initial and reassessments since 2012. In total, there were 7,057 unique youth cases in the initial dataset who were on community supervision. After removing duplicate assessments and individuals who did not have a complete initial pre-screen assessment, there were 6,175 unique youth cases with available follow-up data for at least six months. On average, the cohort was followed for approximately 5 years (range = 0–10.33 years) following their initial YASI pre-screen administration. For this research, we examined a fixed 3-year follow-up, which included 5,210 cases. If the youth aged out of the juvenile system during the study period, any data after they aged out was not included. A majority of the total sample (N = 6,175) was male (67.6%) and White (66.6%), with an over-representation of Native American (14.9%) and Black (10.2%) youth compared with the general population in North Dakota. However, the distribution of ethnicities and over-representation of certain ethnicities is reflective of the normative population involved with the North Dakota juvenile justice system. The remaining participants identified as Asian (0.7%), Hispanic (4.6%), mixed (0.2%), and unknown/not applicable (2.9%). The average age was 15.32 years old (SD = 1.66, range = 8-29).
Measure
The YASI is a measurement tool designed to assess the risks, needs, and strengths of youth involved in the juvenile justice system (Jones et al., 2016). The YASI includes a pre-screen and a full assessment. For the purposes of the current research, only the pre-screen was examined. The pre-screen assessment is used at intake for all youth to classify their risk level, whereas the full assessment is used more for case planning and case management purposes.
When a youth first arrives at a juvenile justice agency, the YASI pre-screen is administered to categorize their risk level respective to their odds of general recidivism (Jones et al., 2016). The YASI can be used in diversion meetings to provide information on the suitable level of services the youth needs, following an admission of a delinquent offense at the informal adjustment, or in the formal court proceedings within the context of the pre-dispositional evaluation (C. Ferderer, personal communication, February 28, 2024). The assessment is completed based on file information and semi-structured interview with the youth. There are slight differences in the number of items based on the jurisdiction where the YASI is used. For North Dakota, the YASI pre-screen includes a subset of 33 items (29 scored) from the full assessment, across nine domains that measure static and dynamic risk factors and strength items (Jones et al., 2016). The nine domains include: Legal History, Family History, School, Community and Peers, Alcohol and Drugs, Aggression, Attitudes, Social Cognitive Skills, and Mental Health. Most of the items are rated on a Likert-type scale (Jones et al., 2016). Mental Health is measured as flags and are not included in total scoring for risk or strengths for the YASI tool. An overall risk total is summed using an algorithm specific to each jurisdiction from the 29 risk-relevant items and categorizes youth as low, moderate, or high risk (Jones et al., 2016). Higher scores in the risk subscale suggest that the youth have a higher risk to re-offend (Jones et al., 2016). A total strength score is summed using an algorithm specific to each jurisdiction from the seven relevant strength items and corresponds to a strength score that categorizes youth as low, moderate, or high strength. Higher scores on the strength subscale suggest that the youth have more strength factors (i.e., less likely to re-offend). The YASI user manual provides recidivism estimates based on a risk classification system, in which youth in the low, moderate, and high-risk groups range between 10-20%, 30-40%, and 50-60%, respectively (Jones et al., 2016). For the current study, the authors were provided with the total scores on the YASI items and the pre-screen risk and strength totals weighted as per the YASI algorithm.
Evaluations of the psychometric properties of the YASI have been conducted on both the pre-screen and full assessment. With respect to the pre-screen, it has been shown to have acceptable 1 internal consistency for the risk total (α = .82) and low internal consistency for the strength total (α = .59; Geck, 2012). The pre-screen has been found to have good to excellent 2 inter-rater reliability for the risk and strength domain totals (intra-class correlation coefficients [ICC] = .77–.89 and .84–.96, respectively; Baird et al., 2013; Brown et al., 2012; Geck, 2012). There is evidence of convergent validity for the YASI pre-screen with the Youth Level of Service/Case Management Inventory 2.0 (YLS/CMI 2.0; Hoge & Andrews, 2002, 2011) and the Psychopathy Checklist Youth Version (PCL/YV; Forth et al., 2003; Geck, 2012; Scott et al., 2019). Finally, the pre-screen has been shown to have small to moderate (AUCs 3 = .55 - .79) predictive accuracy across multiple studies for general and violent offenses with variable follow-up periods (Jones et al., 2016; Matz et al., 2020; Orbis Partners, 2007; Scott et al., 2019), and across gender and ethnicity (AUCs = .63–.76; Baird et al., 2013; Matz et al., 2020). Thus, the YASI pre-screen has been generally shown to have adequate psychometric properties.
Outcome Measures
The outcome measures for the current study were recidivism. Recidivism was measured as dispositions by three dichotomous variables (i.e., presence or absence): (a) general recidivism, (b) general recidivism excluding status offenses (e.g., minor offenses or problem behavior that would not be chargeable if the justice-involved individual was an adult), and (c) any violent disposition after the initial YASI administration. Technical violations were not included in recidivism for this study. A violent disposition describes individuals who committed a crime where they used or threatened the use of violence against another individual, such as assaultive behavior or even homicide. The recidivism data was provided in the dataset from the North Dakota Juvenile Court. The recidivism data were re-coded as either absent (0) or present (1) for each youth for analytical purposes. Overall, the majority of the youth committed a general recidivism event in the 3 years after their initial YASI assessment administration (51.9%) and a smaller proportion had a violent disposition (15.7%). When status offenses are not included, just under one-third of the youth had a general recidivism event in the 3-year follow-up (32.8%).
Procedure
Two researchers received the data from North Dakota Justice Department in three separate files: the YASI administrations, referral data (charges and dispositions), and supervision information. The original YASI file included 18,233 assessments. There was a total of 7,057 unique client IDs, which reflects the total sample size from the original data file received. Individuals who did not have a complete pre-screen assessment at any point in their supervision period (n = 295) and those who did not have an initial pre-screen assessment that was complete (n = 587) were excluded. The researchers were interested in retaining the first, complete YASI pre-screen assessment. There was a total of 6,175 unique youth that had initial, complete YASI pre-screen assessment. Next, the researchers identified the index disposition by removing offending data that preceded the initial complete YASI pre-screen. One youth was excluded from the sample given that their age at the time of their initial YASI administration was 29. Youth with tribal memorandum of understanding (n = 2) and deprivation (n = 575) cases were also removed given that they are not indicative of delinquent or criminal behavior. Data analyses proceeded with the disposition recidivism dataset only, given they tend to have less racial disparity (Kovera, 2019). For analytic purposes, the time from the initial YASI pre-screen assessment until the disposition or end of the study date for those who did not re-offend (May 16, 2022) were computed. Recidivism was computed into a 3-year fixed follow-up period.
Model Building
Original
First, the original YASI weighting method was examined as a reference to the other methods to compare effectiveness (Grann & Långström, 2007). For the original method, the weighting of the items and the use of the risk and strength total scores that are currently used in the YASI pre-screen, as per the YASI manual. Raw items in the original YASI scoring scheme are coded categorically (nominal or ordinal). The current weighting method was developed using the Nuffield approach (see Nuffield section below for more details). The creators then took the scoring from the Nuffield approach and modified them by removing some items and adding some new ones. For the new items, they mimicked their existing scoring (no weights were given). Total risk and strength scores were provided in the data for the current study. The original procedure is considered as the simplest model in the current study given that nothing was changed, therefore it acted as a control.
Burgess
Second, the Burgess method was implemented, which uses a unit scoring approach (0/1) on categorically coded predictors (Burgess, 1928; Silver et al., 2000). We used the same categorically coded item response options as the original YASI scoring method with only the items that are scored on the pre-screen assessment. First, the general recidivism rate was computed for the calibration sample at 3 years (51.5%). Crosstabulations were run between each item response and general recidivism. The general recidivism rate for each item response was then compared with the average recidivism rate. For items related to risk, if the item response was associated with higher rates of general recidivism compared with the average general recidivism rate, the item response was scored as a 1. If the item response was associated with equal or lower rates of general recidivism compared with the average, the item response was scored a 0. For items measuring strengths, if the item response was associated with equal or higher rates of general recidivism compared with the average, the item response was scored as a 0. If the item response was associated with lower rates of general recidivism compared with the average, the item was scored as 1. Next, the risk items were summed to create a total risk score and the strength items were summed to create a total strength score. There was one risk item that was not included given all the participants scored 0 (item responses were associated with equal or lower rates of general recidivism compared with the average). In the case of the current study, the presence of more risk factors was expected to be related to higher recidivism rates. It was expected that youth with higher strength total scores would have lower recidivism rates.
Nuffield
The third method utilized the Nuffield (1982) approach, whereby predictor variables were chosen given their univariate correlations with recidivism. Table S1 in the Supplemental Material (available in the online version of this article) includes an example of scoring one item in the legal history domain of the YASI using the Nuffield approach. The first step was to determine the average success rate by subtracting the recidivism base rates (%) from 100%. Second, the crosstabs of each item (all the items on the pre-screen assessment) and the three recidivism outcomes were computed. Third, the ratio of individuals who were successful (i.e., no recidivism) were reported for each response option for each item. This is indicated in the success rate column in Table S1 in the Supplemental Material. Fourth, a one-unit weight was added for more than a 5% deviation of the success rate for each item response from the average success rate previously calculated in step one (Harris et al., 1993; Nuffield, 1982). As observed in Supplementary Table S1, when the success rate for an item response is 5% greater than the average success rate, a value of -1 is given (less risk). In comparison, when the success rate for an item response is 5% lower than the average success rate, a value of +1 is given (more risk). A two-unit weight is added for more than a 10% deviation, and so on. This method was repeated for the three recidivism outcomes. Finally, total scores were calculated for the risk and strength items for each recidivism outcome. To calculate the total scores, the weights for each response option (i.e., simple summation score) were multiplied by the raw item scores, as in a logistic regression. The Nuffield method has been previously used in the risk assessment field in the development of the General Statistical Information on Recidivism Scale (GSIR; Nuffield, 1982) and to derive the weights for the items on the Violence Risk Appraisal Guide (Quinsey et al., 1998).
Logistic Regression
The final statistical approach included the use of logistic regressions to derive optimal weights. The requirements were met for proceeding with logistic regressions as the outcome variables were binary and the follow-up periods were fixed. In logistic regressions, the coefficients indicate the log odds of an event happening (Morgan et al., 2003). First, crude regression models were performed separately for each item (all the items on the pre-screen assessment) with each recidivism outcome. Once the beta weights for each item were computed and extracted, these weights were multiplied by the item scores and summed to compute a total risk and total strength score. That is, weights were assigned for each individual risk item and each individual strength item according to their corresponding regression coefficient (beta weight). There were two risk items that were not included given all the participants scored 0 (not present/applicable).
Cross-Validation
The sample was divided into two random samples for cross-validation purposes. The first sample was for the construction phase and included approximately one third (n = 1,845) of the original sample. The models were built on the construction sample, herein referred to as the calibration sample. The second sample, the validation sample, was further divided into five random subsets. The five subsets were randomly sampled to represent 20% of the validation sample (i.e., some overlap of individuals in the subsets). Given the large sample size, it was deemed appropriate and prudent to validate across multiple subsamples as there were numerous weighting techniques being evaluated in the current study. Given that a 1:1 approach would likely yield high model fit values and therefore, it has been recommended to have a higher number of subsets, especially when sample sizes are large (Grann & Långström, 2007). Moreover, prediction models for the sample that they were created on tends to fit very well and is why testing the models on independent populations is necessary (Grann & Långström, 2007). In addition, using 20% of the validation sample also balanced any power concerns, given the large dataset. The calibration and validation subsets were assessed for group differences on ethnicity, sex, and age to ensure that there were no significant differences between the samples. The five validation subsets were also examined. There were no significant group differences on any of the relevant demographics mentioned earlier for any of the comparisons evaluated. None of the subsets had to be re-drawn.
Data Cleaning
The data was cleaned in SPSS v29 by the authors. There were no data entry errors based on out-of-range values and the missing data was addressed throughout the data cleaning process. There were three individuals who were not coded as male or female in the dataset provided, and thus were excluded.
Overview of Analyses
To determine the predictive accuracy of the scale, the AUC derived from the receiver operating characteristic (ROC) analysis was used as it is the most recommended and reported statistics for reporting predictive accuracy of risk scales for fixed follow-up times (Rice & Harris, 2005). The AUC is an effect size and measure of accuracy of a diagnostic test. In general, greater AUC values indicate better test performance. AUC values range from 0.5 (no diagnostic ability) to 1.0 (perfect diagnostic ability). Therefore, higher AUCs indicate that the model is better able to discriminate between individuals who experience the event compared with those that do not (Hosmer et al., 2013). For the current study, higher AUC values indicated that the model was better able to discriminate between youth who have re-offended vs. those who did not.
Survival analyses were conducted to examine whether lower risk and higher strength scores on the YASI related to more successful outcomes (i.e., no recidivism or longer periods until recidivism). The Cox regression model was chosen given that it is more robust than other methods (Allison, 1995) and most used in the field (Tabachnick & Fidell, 2013). The Cox regression survival analysis is a multiple linear regression that examines the relation between the incidence of an event and a set of covariates (Bradburn et al., 2003). In the Cox regression model, the exponent(B) is named hazard ratios to represent the ratio of the incidence of the event happening to the incidence of the event not happening (Bradburn et al., 2003). A hazard ratio value greater than one suggests that survival time declines (i.e., recidivism happens faster), whereas a hazard ratio value less than one suggests that survival time increases (i.e., recidivism took longer, if at all; Tabachnick & Fidell, 2013). The proportional hazards assumption was tested for all models for the risk and strength total scores. For the models in which the assumption was not met, the time-dependent covariate was included in the model (Kleinbaum & Klein, 2012).
Improvement Target for Decision-Making
After a thorough examination of the literature, no specific improvement targets were noted specific to the tool or to the field, or more generally. In general, the predictive accuracy of assessment tools for justice-involved individuals is small to large, with AUC values between .63 to .78 (Brown et al., 2020; Singh et al., 2011). More specifically for the YASI pre-screen, predictive accuracy is generally negligible to moderate (AUC values = .55 - .79; Baird et al., 2013; Orbis Partners, 2007; Scott et al., 2019). The effect sizes of the AUCs will be compared with respect to being small (.56), medium (.64), and large (.71; Rice & Harris, 2005). The 95% confidence intervals of the AUCs of the original method compared with the other weighting methods will be evaluated. If the confidence intervals do not overlap and the AUC value is higher than the original method, this would indicate that the weighting method had better predictive accuracy compared with the original method. This decision was made by the research team given the lack of benchmarks available in the literature for comparisons or criteria of improvement in fit.
Results
Calibration Sample
Predictive Accuracy
In the calibration sample, risk scores did not significantly differ for general recidivism. For violent dispositions, logistic regression outperformed the original weighting method, increasing the effect size from small-medium to large. See Table S2 in Supplementary Materials. Notably, the 95% confidence intervals for the AUCs produced by the logistic regression weighting method overlapped the original method, except for predicting violent dispositions. Therefore, there was an improvement from a small-medium to a large effect size from the original method to the logistic regression weighting method.
For strength total scores, the Nuffield method outperformed the Burgess method in predicting general dispositions without status offenses, bringing the effect sizes from small to medium, however it was not a significant difference. There were no other significant differences between weighting methods.
Survival Analyses
For risk totals, the original and Nuffield weighting methods significantly predicted general recidivism, and the Burgess and logistic regression models did not. See Table S3 in the Supplemental Material for the survival analyses predicting the time to the three recidivism outcomes with the risk total scores. The Nuffield model was the only model for which the risk total significantly predicted general recidivism without status offenses. None of the models significantly predicted violent dispositions. Therefore, in general for risk totals, the Nuffield method outperformed the weighting methods.
For strength totals, all the weighting methods significantly predicted general recidivism. The original method and the logistic regression were the only two models for which the strength total scores significantly predicted general recidivism without status offenses. None of the models significantly predicted the time until violent dispositions. Overall, there were more inconsistencies in which model was superior for predicting survival time for the strength totals. Table S4 in the Supplemental Material includes the survival analyses predicting the time to the three recidivism outcomes with the strength total scores.
Given the clearer outperformance of the risk total computed by the logistic regression method in predictive accuracy, risk cut-off scores were computed to further examine survival analyses. Strength cut-off scores were computed on the strength totals created by the Nuffield method. For both risk and strength, three groups were created based on the total scores using one standard deviation above and below the mean (i.e., low, moderate, and high). For the models where the proportional hazards assumption was violated, the survival curves could not be plotted. For violent dispositions, there was an unexpected pattern of the low-risk group significantly failing quicker, where the moderate and high risk groups had similar survival rates, as observed in Figure S1 in the Supplemental Material. Compared with youth in the low risk group, the hazard of any violent disposition is 52% and 55% lower for youth in the moderate and high risk group, respectively.
For the strength total scores produced by the Nuffield weighting method, none of the three strength categories predicted survival time for general recidivism with or without status offenses, as observed with overlapping survival curves in Figure S2 in the Supplemental Material. All three strength groups significantly predicted the time until a violent disposition. As observed in Figure S2 in the Supplemental Material, the pattern more closely resembles that of what would be expected for violent dispositions, where low strength individuals fail more quickly (i.e., have a violent disposition more quickly), though the survival curves for moderate and high strengths overlapped substantially. Compared with low strength youth, the hazard of a violent disposition for moderate and high strength youth is 84% and 83% lower, respectively.
Cross-Validation
Predictive Accuracy
In Table 1, we present the averaged AUCs across the five calibration subsets. Examining risk totals in predicting outcomes, the methods compared were not significantly improved with the alternate weighting methods for most outcomes except violent disposition. These comparisons were only significantly different between the logistic regression and original approaches for violent dispositions. In predicting violent dispositions, the logistic regression approach produced large levels of predictive validity compared with the original approach, which produced moderate levels of predictive validity. When we examine predictive validity across outcomes for each recidivism type across subsets (see Table S5 in the Supplemental Materials), we see that logistic regression outperforms other methods in predicting violent disposition in three of five validation subsets. For an examination of the tool’s risk score performance across validation subsets, refer to Table S5 in the Supplemental Material.
Comparing the Average Predictive Accuracy (AUC) for Risk and Strength Totals Computed by Weighting Methods for the Validation Sample
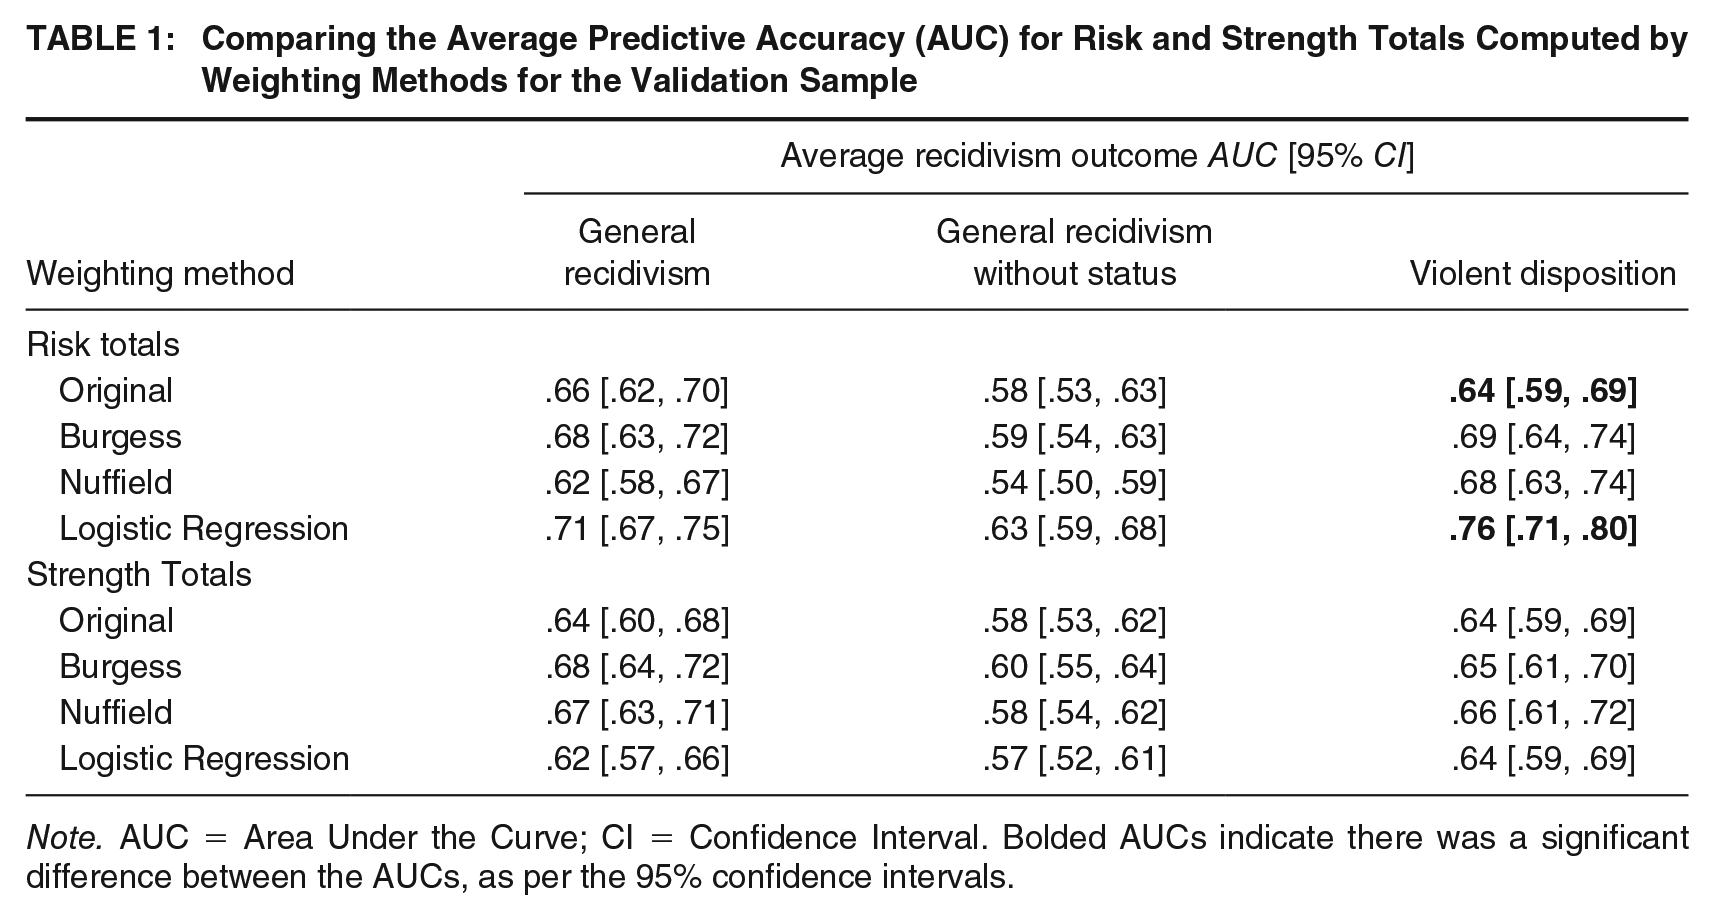
Note. AUC = Area Under the Curve; CI = Confidence Interval. Bolded AUCs indicate there was a significant difference between the AUCs, as per the 95% confidence intervals.
For strength totals, for all outcomes, the methods compared were not significantly improved with alternative weighting methods. The pattern of non-significant improvements also held true when examining comparisons across validation subsets (see Table S6 in the Supplemental Material).
Survival Analyses
Overall, as observed in Table 2, all the risk totals produced by the weighting methods significantly predicted all three recidivism events, except that the Burgess and Nuffield methods risk totals did not predict violent dispositions. With respect to the strength totals, as shown in Table 3, all the strength totals produced by the weighting methods significantly predicted general recidivism with and without status offenses. However, none of the weighting methods strength totals significantly predicted violent dispositions.
Risk Total Scores Predicting Recidivism Outcomes Using Cox Regression Survival Curves for the Validation Sample
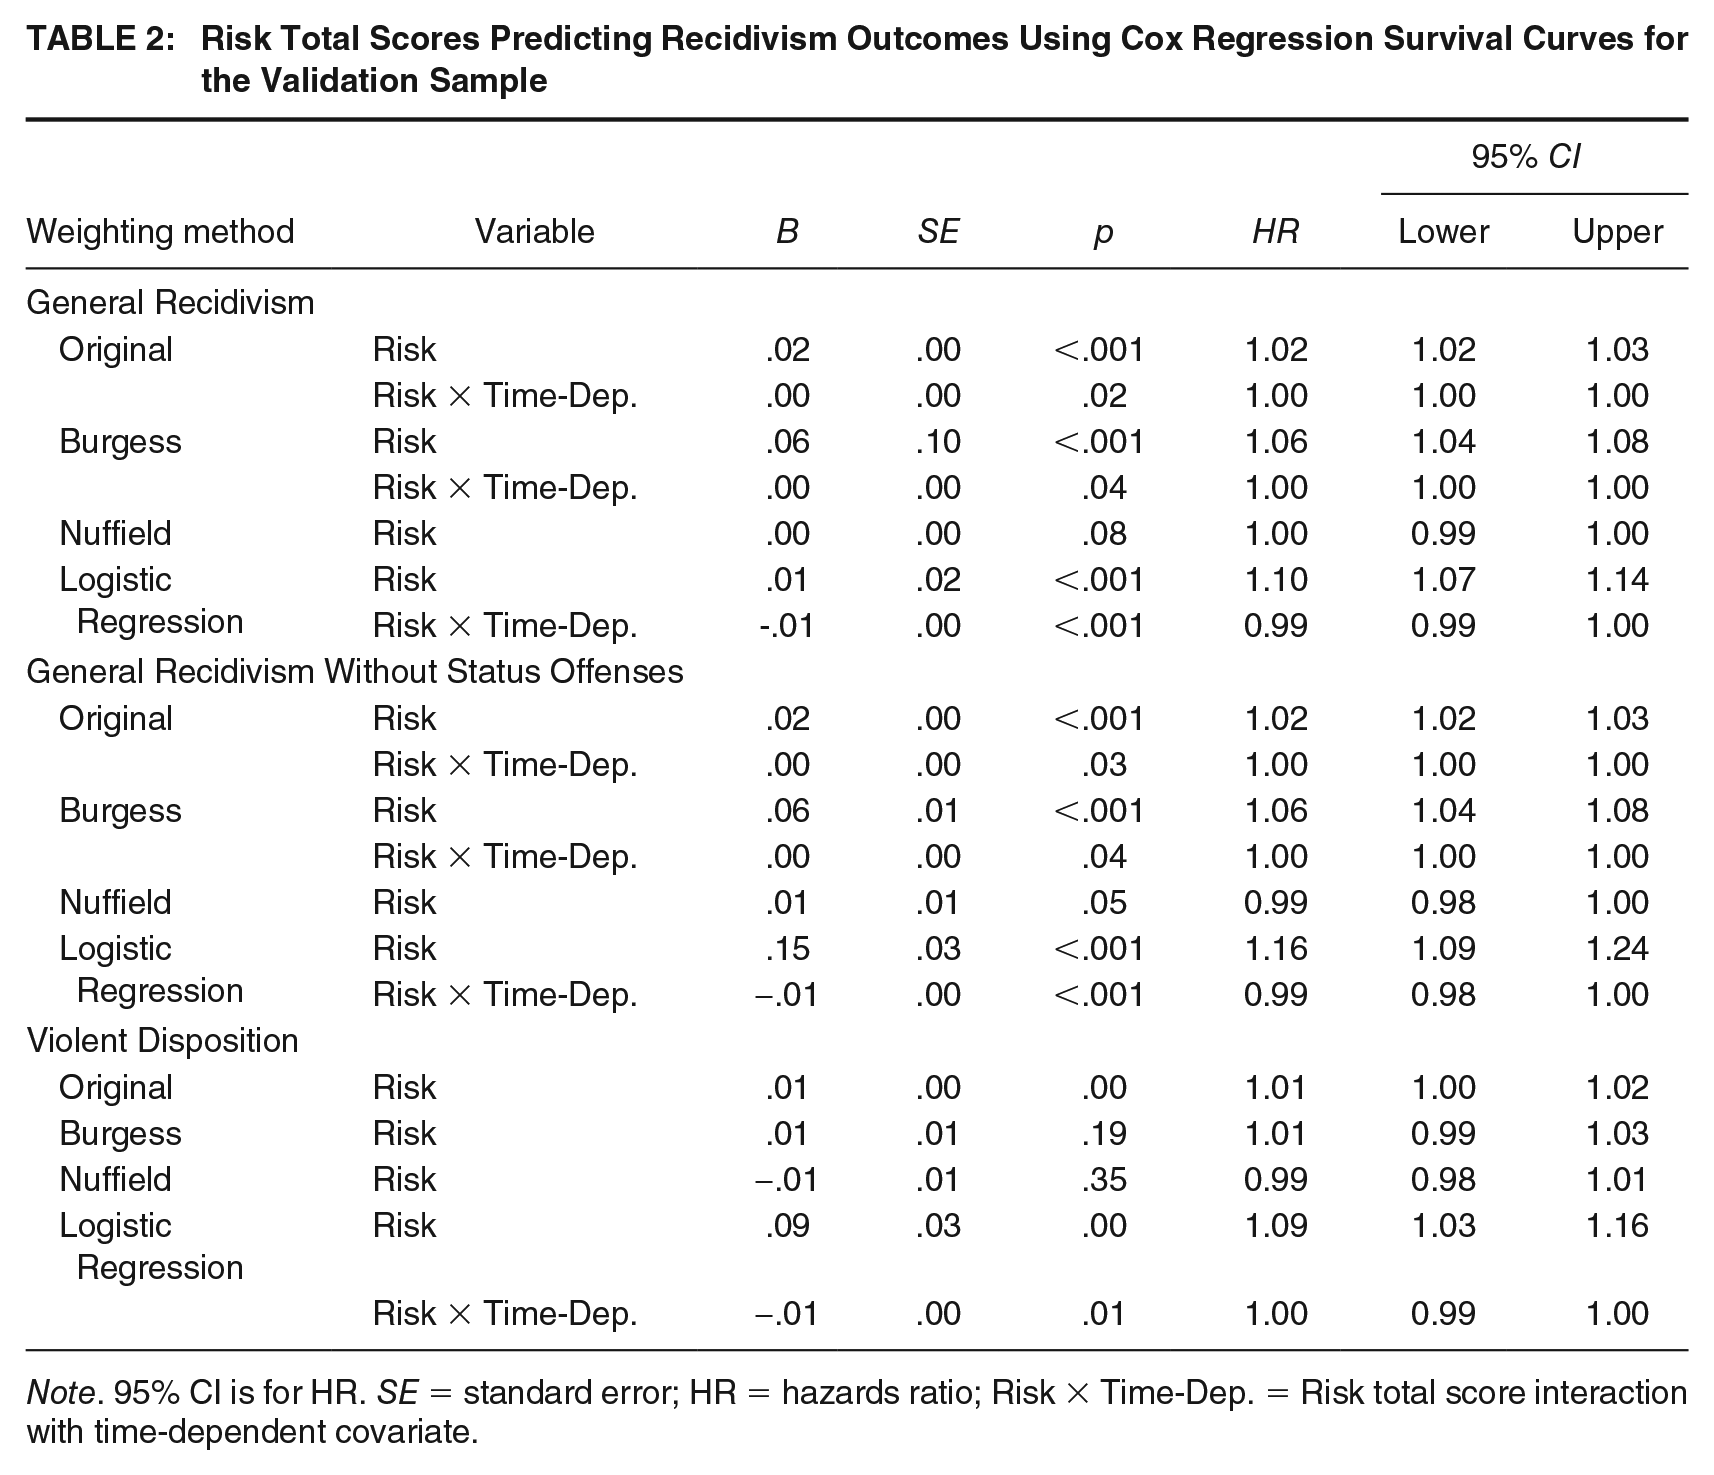
Note. 95% CI is for HR. SE = standard error; HR = hazards ratio; Risk × Time-Dep. = Risk total score interaction with time-dependent covariate.
Strength Total Scores Predicting Recidivism Outcomes Using Cox Regression Survival Curves for the Validation Sample
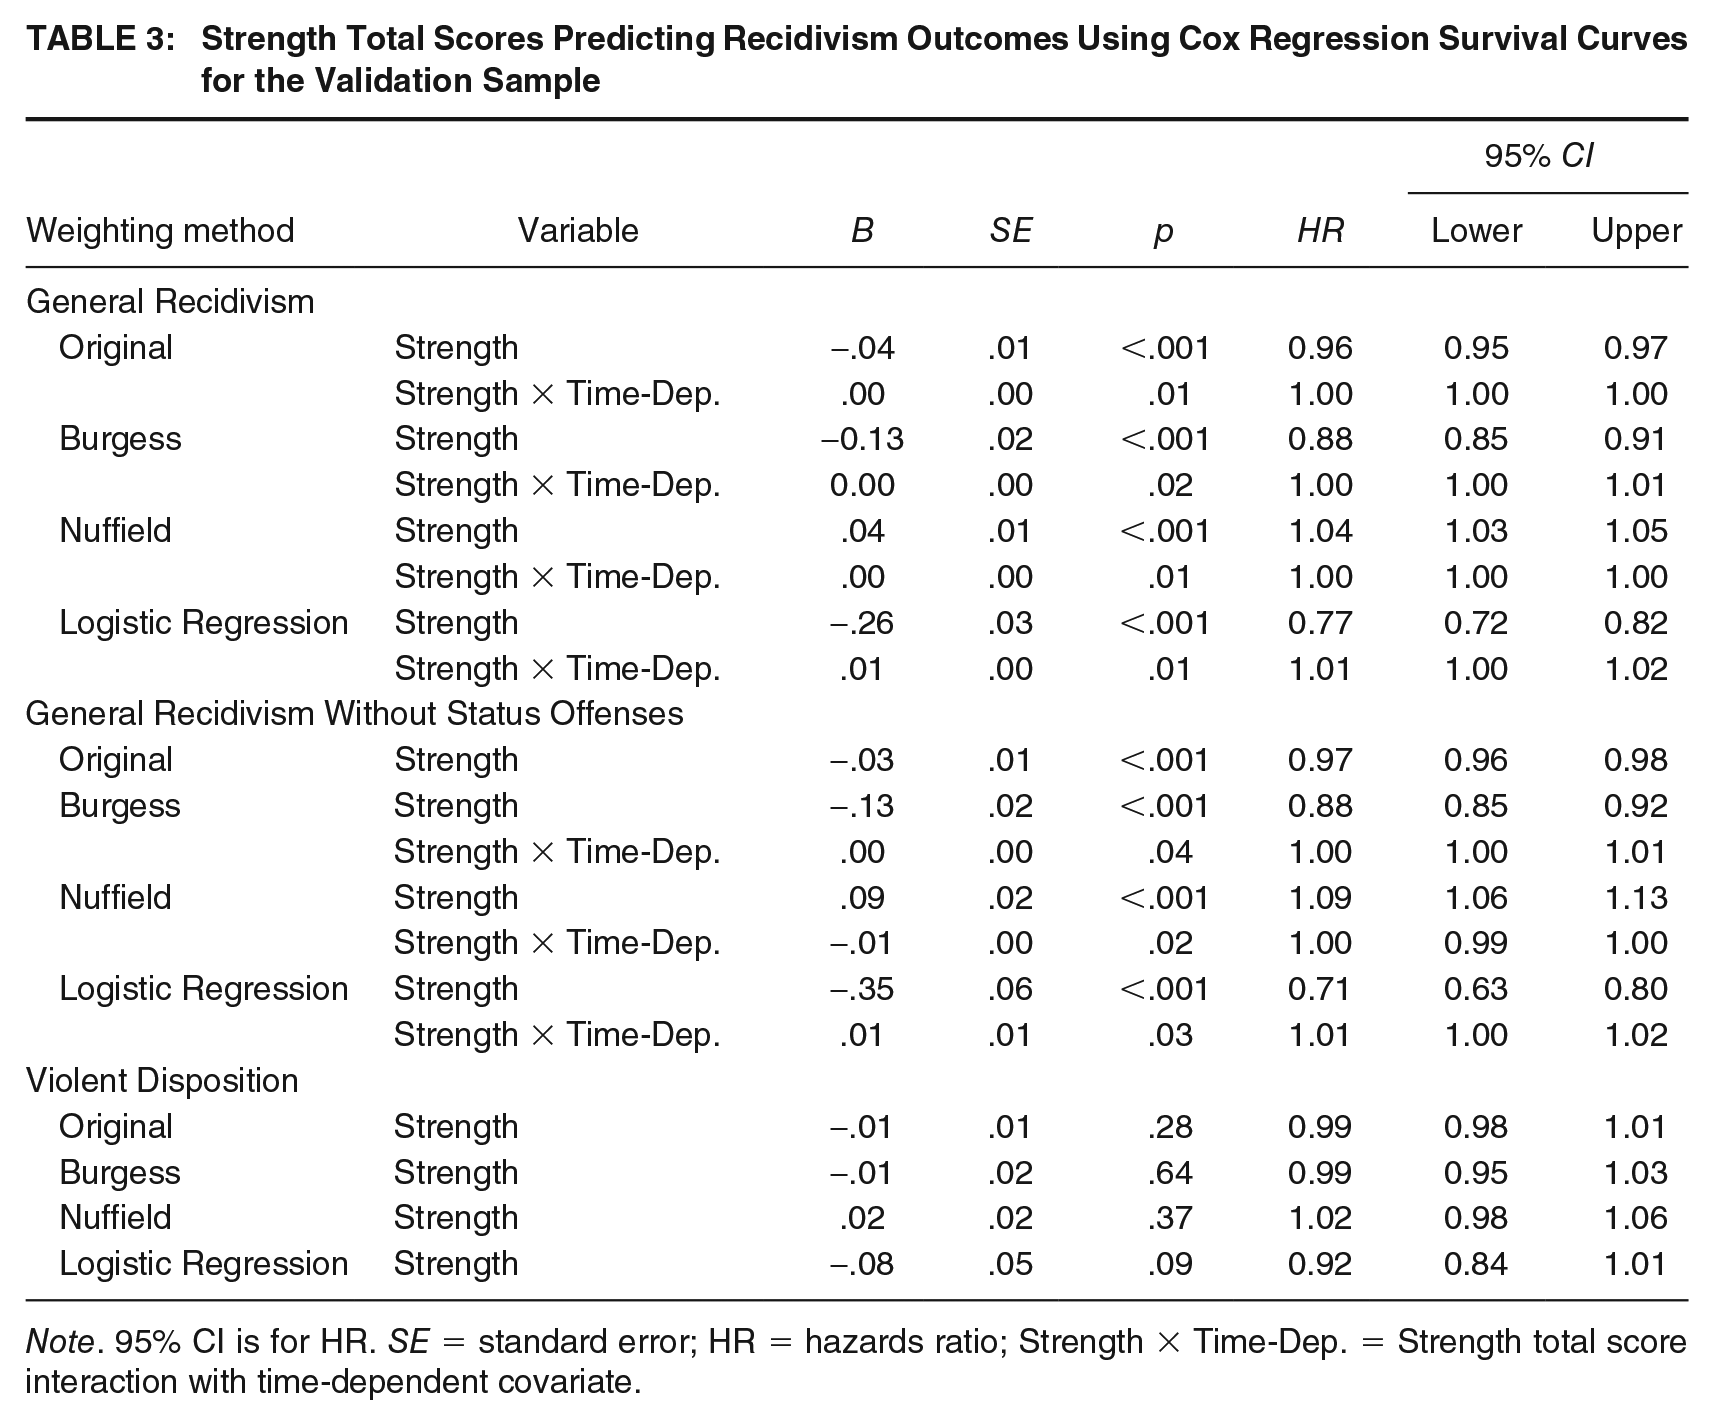
Note. 95% CI is for HR. SE = standard error; HR = hazards ratio; Strength × Time-Dep. = Strength total score interaction with time-dependent covariate.
When comparing the hazards ratio across the weighting methods to the original method, the logistic regression method consistently outperformed the other weighting methods. That is, with every one-point increase in the risk total score using the original weighting method resulted in a 1-2% increase in risk for recidivism across the events, for every one-point increase in the risk total score using the logistic regression method resulted in a 9-16% increase in risk for recidivism across the events. Comparatively, with every one-point increase in the strength total score using the original weighting methods resulted in a decrease of 1-4% in risk for recidivism across the events, compared with the strength total score using the logistic regression method resulted in a decrease of 8-29% in risk for recidivism across the events.
As examined in the calibration sample and given that the logistic regression was the most consistent in improvements of predictive accuracy and survival analyses, the logistic regression risk and strength total scores were categorized into three risk and strength groups (i.e., low, moderate, and high). As expected, the high risk groups had the shortest survival time until recidivism, however there was considerable between the survival times between the low and moderate risk groups. Youth with high strengths had the best survival with the low and moderate strengths groups having similar survival curves. See Figures S3 and S4 in the Supplemental Materia for the survival curves observed in the validation sample for risk and strength total scores, respectively.
Discussion
The purpose of this research study was to determine whether the predictive accuracy of the YASI could be improved by examining different weighting methods of risk and strength items. The results were mixed throughout the research study with respect to weighting methods performance. For instance, in the calibration and validation samples, the logistic regression model significantly improved predictive accuracy for risk total scores in predicting violent disposition over the original method. That is, using the risk totals produced by the logistic regression model, in general, there were improvements from moderate effect sizes using the original weighting method to large effect size for the 3-year follow-up. For strength totals alternate weighting methods did not significantly improve predictive validity at the 3-year follow-up. Though there were noted improvements, there were many instances where the 95% confidence intervals did overlap, indicating a non-meaningful improvement.
There were inconsistencies in the performance of the weighting methods in the calibration and validation subsets for the survival analyses. In the calibration sample, the Nuffield method tended to outperform the other methods for risk totals and there was no one method that performed better for survival time for strength totals. In the validation subsets, all the weighting methods significantly predicted outcomes and the Nuffield method tended to perform poorly, which is inconsistent with what was observed in the calibration dataset. Another exception is that the Burgess risk total did not significantly predict violent dispositions. A surprising finding was that the logistic regression weighting method performed better in the cross-validation subsets compared with the calibration sample. This was unexpected given that the logistic regression model was built on the calibration sample, and therefore lends confidence in its ability as a weighting method for the YASI pre-screen. In the validation sample, the survival curves more closely resembled what would be expected based on the literature, that is that low risk and high strength are expected to be less likely to re-offend and more successful compared with individuals with high risk and low strengths. It is currently unclear to the authors why the unexpected survival pattern was found. One explanation for the unexpected finding may have to do with the sample sizes changing. A second explanation could be that disaggregation could provide a more clear and nuanced understanding of these unexpected survival curves. For instance, examining the weighting methods and survival analyses by gender or ethnicity might be helpful in explaining the findings rather than examining the youth together as a homogeneous group.
Similar to what was observed in Grann and Långström (2007) and Rieger and Serin (2021), the simpler weighting methods (e.g., Burgess) did not consistently improve predictive accuracy over the original method. The present study was the first, to the authors knowledge, to examine and compare weighting methods for strength factors for youth (see Robb, 2021 for an evaluation on adult women). This novel examination revealed alternate weighting methods did not outperform the original weighting scheme. Given the deficits-based focus of risk assessments (Maruna & LeBel, 2003), the current study provides information and evidence that strength scores that may provide a more holistic approach to assessing the risk, needs, and strengths of individuals in the criminal justice system.
In general, the findings indicate that the alternatives examined in the present study were inconsistently outperforming the original method and that the original method was not consistently outperforming the alternative methods. These results are worth considering more closely and for the users of the scale to consider the cost-benefit to switching their current weighting method. It may be preferrable to switch to risk totals produced by the logistic regression method given the inconsistent, yet substantial improvements in predictive accuracy that could markedly improve the confidence and trust of decision-makers who use the YASI as a guide for case management decisions (e.g., release, supervision, programming). In addition, the findings could reduce recidivism by more appropriately capturing a youth’s risk and strengths. Though, reduction in recidivism would occur if improved accuracy of classification leads to appropriate allocation of resources and services based on the individual’s need. However, it may be beneficial to stick with the original method given the resources that would be required to update the YASI manual and the portal users access to score the YASI.
Limitations and Future Directions
As with any research study, there are limitations to note. First, the research findings are only generalizable to the midwestern state in which the study was conducted. Given that the models were created on a sample from one state only and the unique nature of the state itself, the findings cannot be generalized to any other state or province that uses the YASI. Future research should be conducted to examine various weighting methods for different jurisdictions. A second limitation is that the models were built on the entire sample and were not examined across gender or ethnicities. Though the items in the YASI are hypothesized to be “gender-neutral” (i.e., predict equally across gender; Jones et al., 2016), previous research has found that the classification cut-offs should be established based on gender to decrease the tendency to over-classify females when using cut-offs established on males (Jones et al., 2016; Robinson & Jones, 2019). Therefore, future research should examine the different weighting models for specific groups of interest.
Conclusion
In conclusion, no weighting method examined consistently nor substantially outperformed the current weighting method in the calibration sample or in cross-validation subsets across the three recidivism outcomes. The one exception would be the use of the risk total score that was calculated based on the logistic regression model that substantially improved the predictive accuracy for violent dispositions after the initial YASI administration. However, the original method did not consistently outperform the alternative methods. Therefore, it may be worth considering alternative methods or further exploration and for the users of the scale to consider a cost-benefit analysis.
Supplemental Material
sj-docx-1-cjb-10.1177_00938548241291015 – Supplemental material for Examining Optimal Weights for the Youth Assessment and Screening Instrument in North Dakota
Supplemental material, sj-docx-1-cjb-10.1177_00938548241291015 for Examining Optimal Weights for the Youth Assessment and Screening Instrument in North Dakota by Sonya A. Mclaren and Danielle J. Rieger in Criminal Justice and Behavior
Footnotes
Authors’ Note:
The manuscript reflects the views of the authors, and not those of Orbis Partners Inc. or the North Dakota Court System. The authors would like to thank the North Dakota Court System, Orbis Partners Inc., and Dr. Andrea Howard for their support in this research project. Danielle Rieger is affiliated with Orbis Partners, the developer of the Youth Assessment and Screening Instrument (YASI; Orbis Partners, 2000). Sonya McLaren was previously affiliated with Orbis Partners.
Supplemental material
Notes
References
Supplementary Material
Please find the following supplemental material available below.
For Open Access articles published under a Creative Commons License, all supplemental material carries the same license as the article it is associated with.
For non-Open Access articles published, all supplemental material carries a non-exclusive license, and permission requests for re-use of supplemental material or any part of supplemental material shall be sent directly to the copyright owner as specified in the copyright notice associated with the article.